Quarterly Investment Management Conference Call · Lower-quality assets outperformed again Note:...
27
Quarterly Investment Management Conference Call A New Year January 19, 2011 Peter J. Langas Director of Investment Strategies Marc D. Stern Chief Investment Officer
Transcript of Quarterly Investment Management Conference Call · Lower-quality assets outperformed again Note:...

Quarterly Investment Management Conference Call
A New YearJanuary 19, 2011
Peter J. Langas
Director of Investment Strategies
Marc D. Stern
Chief Investment Officer

Past performance is no guarantee of future results. This material is provided for your general information and is not a complete description of any fund or portfolio named herein. It does not take into account the particular investment objectives, financial situation, or needs of individual clients. This material has been prepared based on information that Bessemer Trust believes to be reliable, but Bessemer Trust makes no representation or warranty with respect to the accuracy or completeness of such information. This presentation does not include a complete description of any fund or portfolio mentioned herein. Investors should consider the investment objectives, risks, charges, and expenses of each fund or portfolio before investing. Views expressed herein are current opinions only as of the date indicated, and are subject to change without notice. Forecasts may not be realized due to a variety of factors, including changes in economic growth, corporate profitability, geopolitical conditions, and inflation. The mention of a particular security is not intended to represent a stock-specific or other investment recommendation, and our view of these holdings may change at any time based on stock price movements, new research conclusions, or changes in risk preference. Index information is included herein to show the general trend in the securities markets during the periods indicated and is not intended to imply that any referenced portfolio is similar to the indices in either composition or volatility. Sector and Industry classifications included in this presentation utilize the Global Industry Classification Standard (“GICS ”). GICS is the exclusive property and a service mark of Morgan Stanley Capital International Inc. (“MSCI”) and Standard & Poor’s (“S&P”), a division of The McGraw-Hill Companies, Inc. Neither MSCI nor S&P makes any express or implied warranties or representations or shall have any liability for any direct, indirect, special, punitive, consequential or any other damages (including lost profits) with respect to GICS data or results obtained therefrom.

3
2010 Themes: Our Report Card
Consumer
meltdown
averted
Sustained
corporate
strength
Moderate
global
growth
Reduced
government
stimulus
Shifting
investment
leadership
No economic
“double dip”
Widespread
recession
fears
proved
wrong
Global GDP
grew 4½%
Corporate
earnings
surged 21%
U.S. retail
sales rose
4.8%
Policymakers
tightened in
Asia, but not
in U.S. or
Europe
Lower-quality
assets
outperformed
again
Note: These six themes originally appeared in our materials at year-end 2009. Green shading appears for themes that proved to be correct in 2010, while red shading appears for incorrect themes. Text beneath provides additional color on actual 2010 developments.
Markets post up year in “1½ steps forward, 1 step back” pattern
Strong gains in March, July, September, and December eventually outweighed
sharp selloffs in May, June, and August

4
Key Performance Factors: 2010
As of December 31, 2010. Reflects representative factors affecting the relative performance of Bessemer’s Balanced Growth model portfolio.The Stock/Bond Mix is comprised of 70% S&P 500 Index and 30% Barclays Gov’t/Credit Index.
• Substantial underperformance in U.S. Large Cap, which returned only 7.4%
• Limited returns in bonds (municipals +2.7%, taxables +5.6%)
• Double-digit returns in several portfolios:o Global Small & Mid Cap +24.1%o Non-U.S. Large Cap +16.4%o Global Opportunities +16.2%o Real Return +15.8%
• Substantial outperformance in Non-U.S. Large Cap
• Participation in key investment themes:o Strength in small/mid-capitalization areao Substantial returns in credit (mortgage-backed,
convertibles, high yield, emerging markets)o Outperformance of Asian currencies versus
European
We were disappointed with…We were pleased with…
15.1S&P 500 Index
12.5Stock/Bond Mix
12.1%Balanced Growth Portfolio
2010

5
Cumulative Returns Annualized Volatility
As of December 31, 2010. Past performance is no guarantee of future results.The Stock/Bond Mix is comprised of 70% S&P 500 Index and 30% Barclays Gov’t/Credit Index.2005 is the first full reporting period since Bessemer’s Chief Investment Officer assumed responsibilities for investments.Source: Barclays Capital, Standard & Poor’s
Favorable Long-Term Results
39.8%
10.2% 11.8%
24.5%
16.5%17.5%
Balanced Growth Stock/Bond Mix S&P 500 Index
January 2005 – December 2010

6
Many Reasons for Optimism…with Clouds on Horizon
Sources of strength
Moderate global growth
Rising corporate profits
Increasing spending power
Rebounding sentiment
Counterforces building
Economic imbalances
Rising inflation
Higher interest rates
Our expectations:
• Gains for growth-oriented assets
• S&P 500 hits 1400 during 2011
• Favorable outlook for many commodities and currencies
Our expectations:
• Pressure on fixed income, with scant return potential for bond portfolios
• Potential for market setbacks in late 2011 and into 2012
7
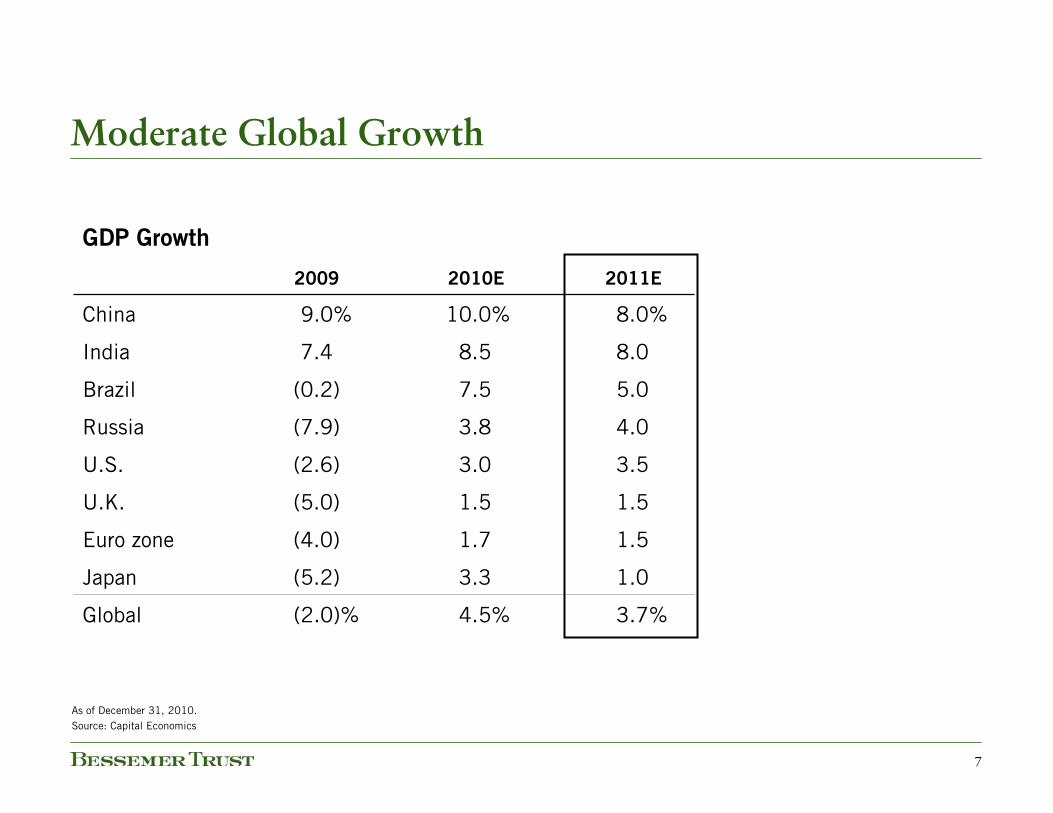
As of December 31, 2010.Source: Capital Economics
Moderate Global Growth
4.03.8(7.9)Russia
2011E2010E2009
3.7%4.5%(2.0)%Global
1.03.3(5.2)Japan
1.51.7(4.0)Euro zone
1.51.5(5.0)U.K.
3.53.0(2.6)U.S.
5.07.5(0.2)Brazil
8.08.57.4India
8.0%10.0%9.0%China
GDP Growth

8
• Total freight shipping volume up 15%• U.S. exports up 17%• Global air passenger traffic hits new high• FedEx sets single-day shipment record• Heavy truck orders highest since March 2006• Orders for largest cargo ships hit record• Architectural firms report highest billings in 32 months• Ford and GM sales rise 20%• GE raises dividend 17%• Taiwan Semiconductor to boost production by 30%
Corporate Earnings Widespread Reports of Improvement During Q4/2010
Business Investment S&P 500 TargetsBased on Expected Q4/2011 Earnings
As of December 31, 2010.Source: Bloomberg, Bureau of Economic Analysis, Empirical Research Partners, Standard & Poor’s, Company reports, FactSet
Rising Corporate Profits
$ Billions
2010
1,138 1,123 1,098
1,012
903 904 913945
9901,046
1,087
1Q 2Q 3Q 4Q 1Q 2Q 3Q 4Q 1Q 2Q 3Q
2008 2009153015x
142814x
132613x
122412x
Potential
PriceP/E
200
600
1,000
1,400
1,800
00 02 04 06 08 10
$ B
illio
ns
2000

9
150
250
350
450
550
650
07 08 09 10
Thou
sand
s
2007
Unemployment Claims
As of December 31, 2010. Unemployment claims reflects four-week moving average of initial claims. Total compensation and retail sales figures are adjusted for inflation. Household debt obligations reflects homeowners’ total payments on mortgage debt, homeowners' insurance, property taxes, consumer debt, and automobile leases as a percentage of disposable personal income.Source: Bureau of Economic Analysis, Bureau of Labor Statistics, Federal Reserve
Improving Job Market Helps Consumer Spending Power
-6.0
-4.0
-2.0
0.0
2.0
4.0
6.0
05 06 07 08 09 10
Year
-ove
r-Ye
ar %
Cha
nge
2005
Total Compensation
Household Debt Obligations
12
14
16
18
82 86 90 94 98 02 06 10
% o
f In
com
e
1982
Retail Sales
120
140
160
180
200
96 98 00 02 04 06 08 10
$ B
illio
ns
1996
10
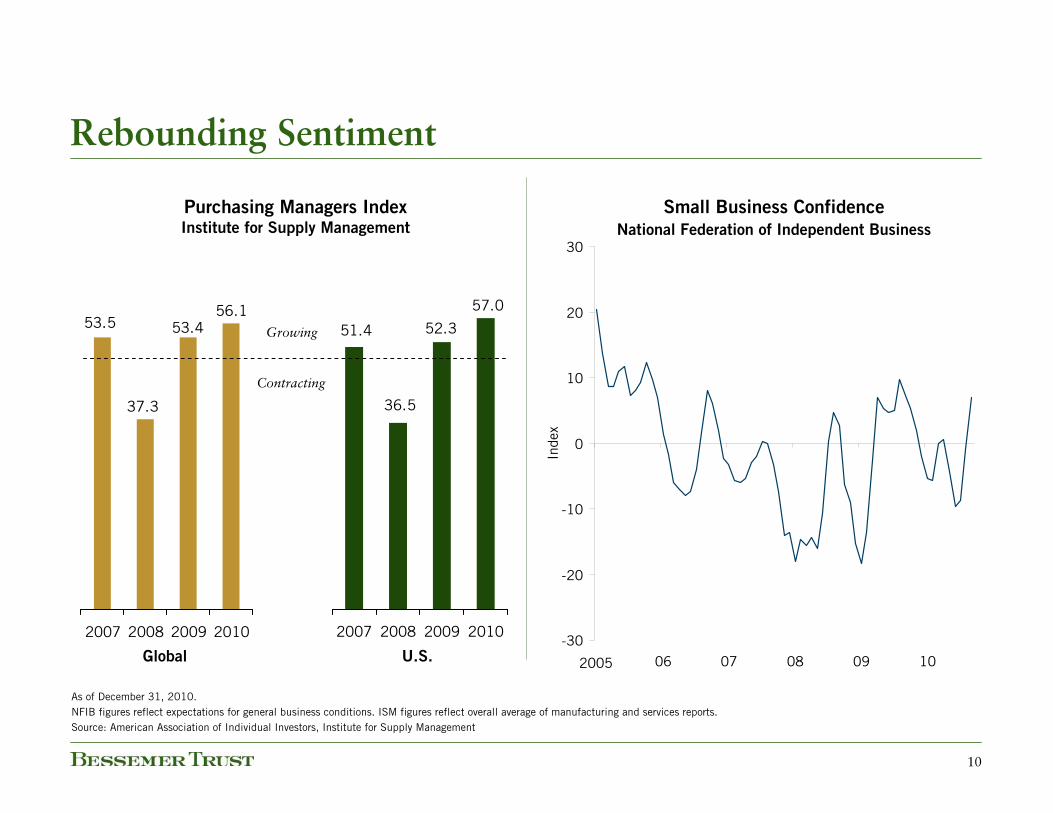
53.5
37.3
53.456.1
2007 2008 2009 2010
57.0
52.3
36.5
51.4
2007 2008 2009 2010
Small Business Confidence
National Federation of Independent Business
Purchasing Managers IndexInstitute for Supply Management
As of December 31, 2010.NFIB figures reflect expectations for general business conditions. ISM figures reflect overall average of manufacturing and services reports.Source: American Association of Individual Investors, Institute for Supply Management
Rebounding Sentiment
-30
-20
-10
0
10
20
30
05 06 07 08 09 10
Inde
x
2005Global U.S.
Growing
Contracting
11
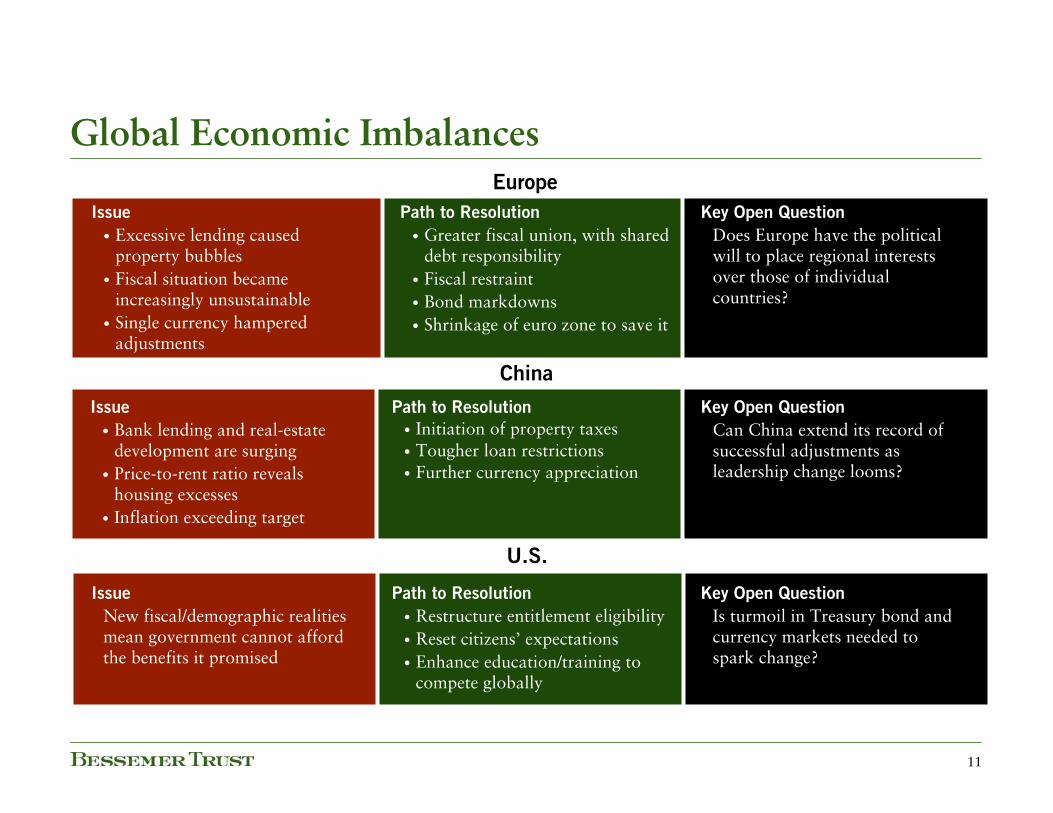
Global Economic ImbalancesEurope
China
Issue
• Bank lending and real-estate development are surging
• Price-to-rent ratio reveals housing excesses
• Inflation exceeding target
Path to Resolution
• Initiation of property taxes• Tougher loan restrictions• Further currency appreciation
Key Open Question
Can China extend its record of successful adjustments as leadership change looms?
Issue
• Excessive lending caused property bubbles
• Fiscal situation became increasingly unsustainable
• Single currency hampered adjustments
Path to Resolution
• Greater fiscal union, with shared debt responsibility
• Fiscal restraint• Bond markdowns• Shrinkage of euro zone to save it
Key Open Question
Does Europe have the political will to place regional interests over those of individual countries?
Issue
New fiscal/demographic realities mean government cannot afford the benefits it promised
Path to Resolution
• Restructure entitlement eligibility• Reset citizens’ expectations• Enhance education/training to
compete globally
Key Open Question
Is turmoil in Treasury bond and currency markets needed to spark change?
U.S.

12
-25
-20
-15
-10
-5
0
5
10
15
20
25
00 02 04 06 08 10
Year
-ove
r-Ye
ar %
Cha
nge
2000
Inflationary Pressures Are Growing
-10
-8
-6
-4
-2
0
2
4
6
8
05 06 07 08 09 10
Year
-ove
r-Ye
ar %
Cha
nge
2005
Commercial Lending
As of December 31, 2010.China's export pricing (as of November 30, 2010) is expressed in RMB, smoothed on a trailing six-month basis.Source: Bureau of Economic Analysis, Bureau of Labor Statistics, CEIC, Empirical Research Partners, Federal Reserve, National Federation of Independent Business, Wall Street Journal
China Export Pricing
-21.8%
-3.7%

13
After 30 Years of Falling Yields…Investors Prefer Bonds
Mutual Fund Net Inflows
January 2009 – November 2010
10-Year U.S. Treasury yields as of December 31, 2010. U.S. mutual fund net inflows as of November 30, 2010.Source: Federal Reserve, Global Financial Data, Investment Company Institute
All Other
2.8%
Stocks
0.5%Bonds
96.7%
2.0
4.0
6.0
8.0
10.0
12.0
14.0
16.0
18.0
80 86 92 98 04 10
% Y
ield
1980
Treasury Bond Yield
14
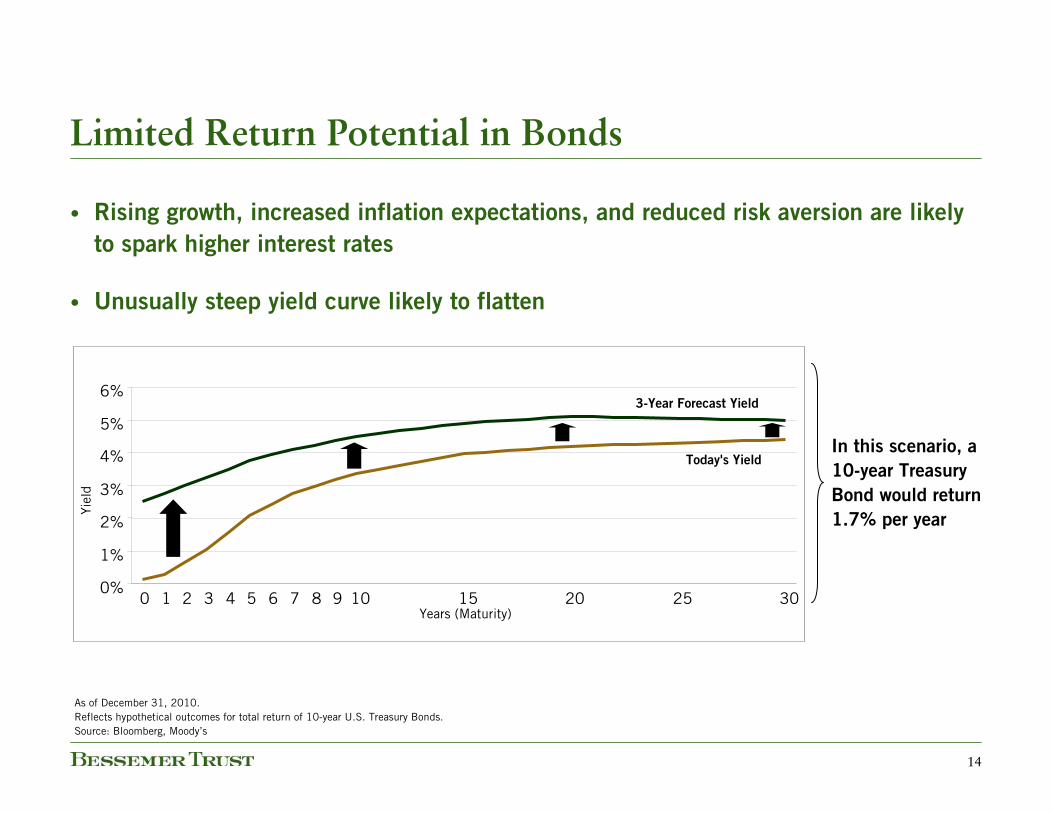
0%
1%
2%
3%
4%
5%
6%
0 1 2 3 4 5 6 7 8 9 10 15 20 25 30Years (Maturity)
Yiel
d
Today's Yield
3-Year Forecast Yield
Limited Return Potential in Bonds
• Rising growth, increased inflation expectations, and reduced risk aversion are likely
to spark higher interest rates
• Unusually steep yield curve likely to flatten
As of December 31, 2010.Reflects hypothetical outcomes for total return of 10-year U.S. Treasury Bonds.Source: Bloomberg, Moody’s
In this scenario, a
10-year Treasury
Bond would return
1.7% per year

15
Asset Allocation Changes
Reflects Bessemer Trust’s new Balanced Growth recommendations effective December 15, 2010.Bessemer’s recommendations may be adjusted due to a variety of factors, including changes in market conditions, economic growth, corporate profitability, geopolitical conditions, and inflation. Investments cannot be made directly in these model portfolios. Because each client has different spending needs, liquidity requirements, time horizon, risk tolerance, and tax circumstances, individual implementation will vary.
Based on the environment we foresee, we want to:
• Protect against potential interest rate rise• Broaden global currency diversification• Achieve greater inflation protection• Emphasize global growth prospects
As a result, we have:
• Reduced Fixed Income• Initiated Strategic Currency• Increased Real Return• Increased Global Small & Mid Cap and reduced U.S. Large Cap

16
Rotation in Leadership
Absolute Returns
Best
Wor
st
Municipal Bond2.7
Fixed Income5.6
U.S. Large Cap7.4
Balanced Growth
12.1
Real Return15.8
Global Opportunities16.2
Non-U.S. Large Cap16.4
Global Small & Mid Cap 24.1
2010
Fixed Income3.6
U.S. Large Cap(37.4)
Municipal Bond8.9
Real Return(36.9)
Non-U.S. Large Cap4.5
Fixed Income3.8
Non-U.S. Large Cap19.9
Non-U.S. Large Cap (34.4)
Municipal Bond4.6
Municipal Bond4.3
Balanced Growth
20.5
Global Opportunities (34.0)
Global Small & Mid Cap6.6
Real Return11.5
Municipal Bond3.0
Global Opportunities21.3
Global Small & Mid Cap (24.4)
U.S. Large Cap8.1
Balanced Growth
13.5
Fixed Income4.2
Real Return25.8
Balanced Growth
(22.5)
Balanced Growth
9.0
U.S. Large Cap14.5
U.S. Large Cap5.3
U.S. Large Cap31.3
Municipal Bond2.6
Fixed Income9.1
Non-U.S. Large Cap20.5
Balanced Growth
8.0
Global Small & Mid Cap32.5
Fixed Income11.1
Real Return26.5
Global Small & Mid Cap 20.7
Non-U.S. Large Cap16.1
20092008200720062005
As of December 31, 2010.

17
U.S. Large Cap: 2010 Performance Factors
As of December 31, 2010.¹Based on 2010 calendar year consensus earnings estimates.²2010 performance reflects total return.This material is provided for your general information. Views expressed are current as of the date noted and are subject to change without notice. The mention of a particular security is not intended to represent a stock-specific recommendation, and our view of these holdings may change at any time based on new research conclusions and changes in risk preference.
What drove performance in 2010?
• Defensive holdings (e.g., Baxter, Teva, Walgreen) underperformed, particularly in second-quarter downturn
• Earnings of retailer Staples missed expectations
• In a macro-driven environment, large holdings across sectors underperformed despite earnings improvements
• Helped by gains in National Oilwell Varco (+53%), Ingersoll-Rand (+32%), EMC (+31%), and Hess (+27%).
-6.5%25.1%Microsoft
-4.240.1Google
2.370.8JPMorgan Chase
3.216.7Wal-Mart
3.429.4International Paper
2010
Performance²2010
Earnings Growth¹
Valuation
Momentum
20102009
Market performance factors
Strong earnings, weak stocks
18
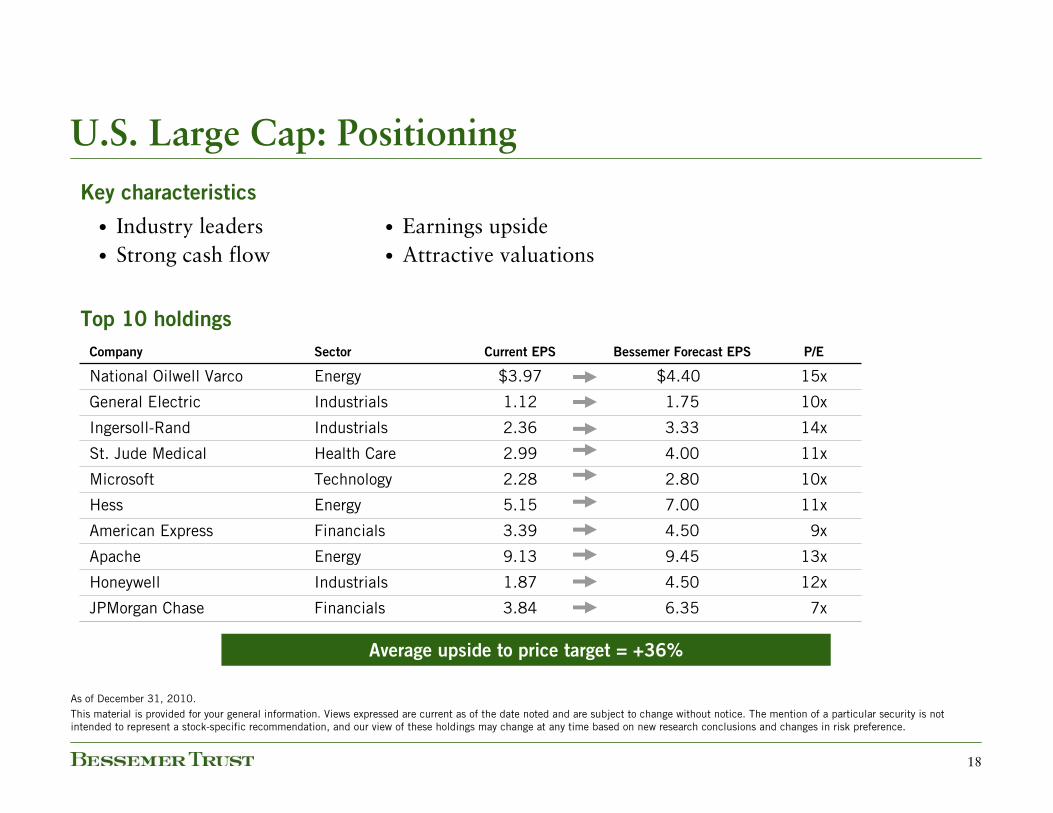
U.S. Large Cap: Positioning
• Attractive valuations• Strong cash flow• Earnings upside• Industry leaders
Key characteristics
7x
12x
13x
9x
11x
10x
11x
14x
10x
15x
P/E
6.35
4.50
9.45
4.50
7.00
2.80
4.00
3.33
1.75
$4.40
Bessemer Forecast EPS
3.84FinancialsJPMorgan Chase
1.87IndustrialsHoneywell
9.13EnergyApache
3.39FinancialsAmerican Express
5.15EnergyHess
2.28TechnologyMicrosoft
2.99Health CareSt. Jude Medical
2.36IndustrialsIngersoll-Rand
1.12IndustrialsGeneral Electric
$3.97EnergyNational Oilwell Varco
Current EPSSectorCompany
Top 10 holdings
Average upside to price target = +36%
As of December 31, 2010.This material is provided for your general information. Views expressed are current as of the date noted and are subject to change without notice. The mention of a particular security is not intended to represent a stock-specific recommendation, and our view of these holdings may change at any time based on new research conclusions and changes in risk preference.
19
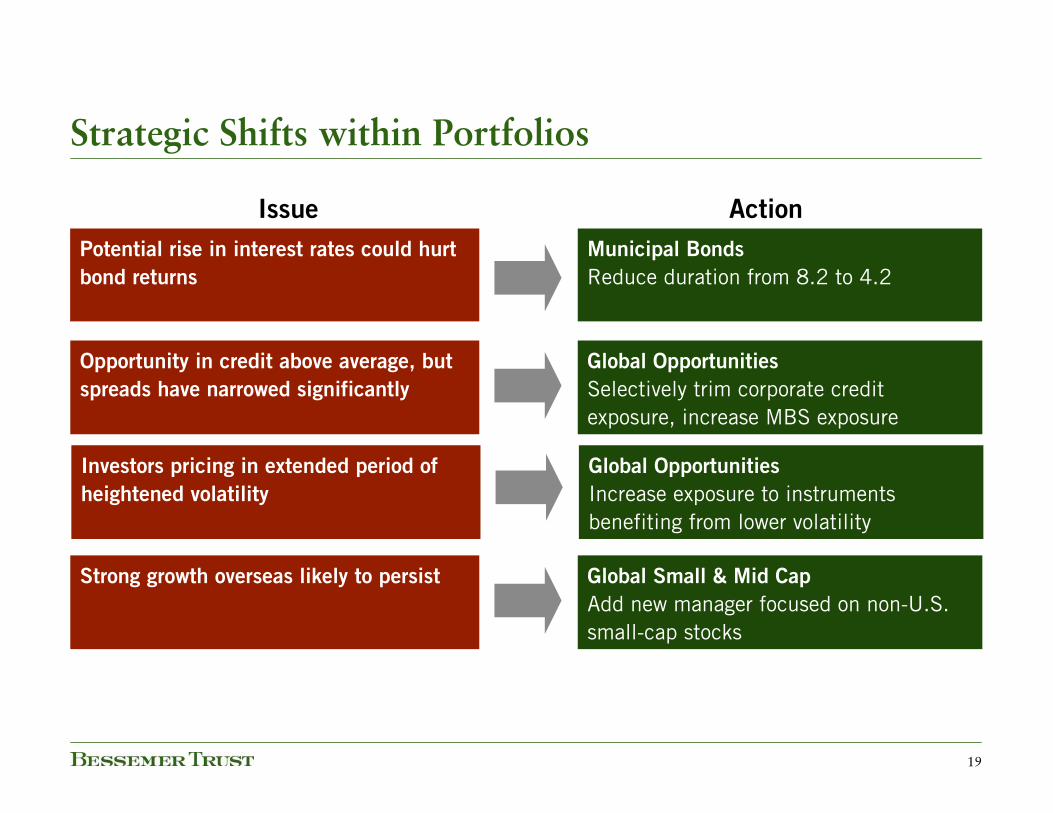
Strategic Shifts within Portfolios
Municipal Bonds
Reduce duration from 8.2 to 4.2Potential rise in interest rates could hurt
bond returns
Global Opportunities
Selectively trim corporate credit exposure, increase MBS exposure
Opportunity in credit above average, but
spreads have narrowed significantly
Global Small & Mid Cap
Add new manager focused on non-U.S. small-cap stocks
Strong growth overseas likely to persist
Issue Action
Global Opportunities
Increase exposure to instruments benefiting from lower volatility
Investors pricing in extended period of
heightened volatility
20
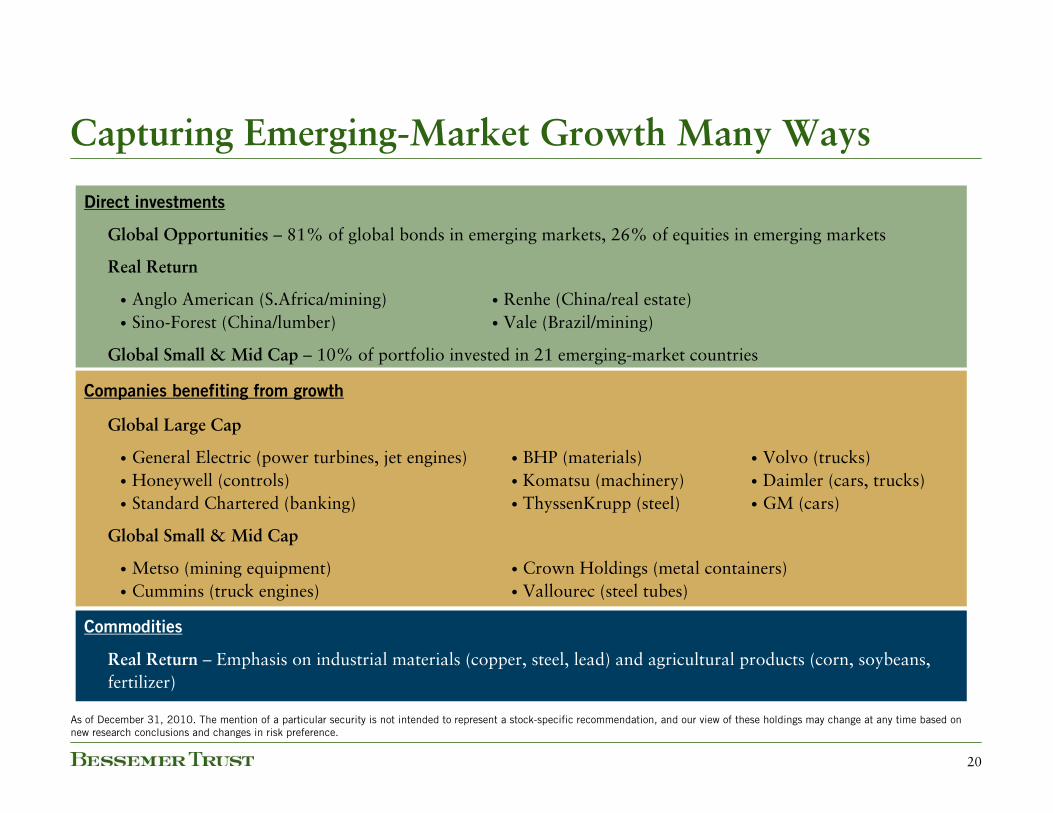
Capturing Emerging-Market Growth Many Ways
• Renhe (China/real estate)• Vale (Brazil/mining)
• Anglo American (S.Africa/mining)• Sino-Forest (China/lumber)
Real Return
Global Opportunities – 81% of global bonds in emerging markets, 26% of equities in emerging markets
Global Small & Mid Cap – 10% of portfolio invested in 21 emerging-market countries
Real Return – Emphasis on industrial materials (copper, steel, lead) and agricultural products (corn, soybeans, fertilizer)
Commodities
• Crown Holdings (metal containers)• Vallourec (steel tubes)
• Metso (mining equipment)• Cummins (truck engines)
Global Small & Mid Cap
• Volvo (trucks)• Daimler (cars, trucks)• GM (cars)
• BHP (materials)• Komatsu (machinery)• ThyssenKrupp (steel)
• General Electric (power turbines, jet engines)• Honeywell (controls)• Standard Chartered (banking)
Global Large Cap
Companies benefiting from growth
Direct investments
As of December 31, 2010. The mention of a particular security is not intended to represent a stock-specific recommendation, and our view of these holdings may change at any time based on new research conclusions and changes in risk preference.
21
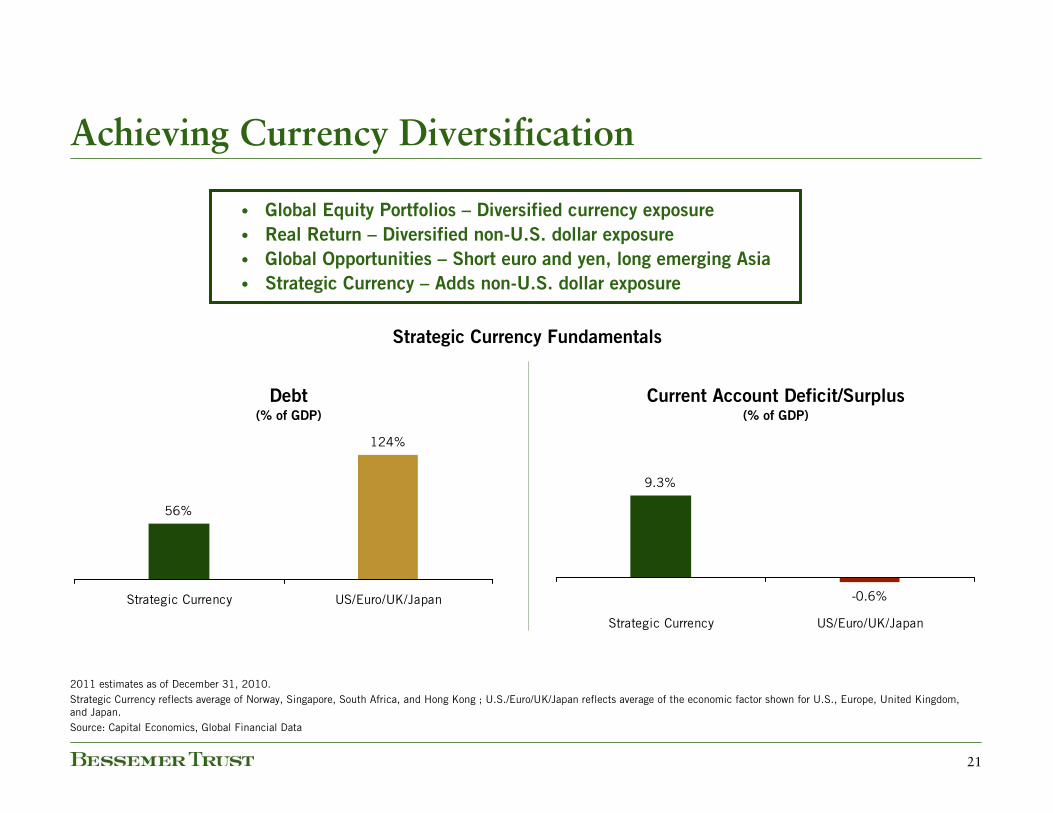
Achieving Currency Diversification
56%
124%
Strategic Currency US/Euro/UK/Japan
2011 estimates as of December 31, 2010.Strategic Currency reflects average of Norway, Singapore, South Africa, and Hong Kong ; U.S./Euro/UK/Japan reflects average of the economic factor shown for U.S., Europe, United Kingdom, and Japan.Source: Capital Economics, Global Financial Data
Debt(% of GDP)
9.3%
-0.6%
Strategic Currency US/Euro/UK/Japan
Current Account Deficit/Surplus(% of GDP)
• Global Equity Portfolios – Diversified currency exposure
• Real Return – Diversified non-U.S. dollar exposure
• Global Opportunities – Short euro and yen, long emerging Asia
• Strategic Currency – Adds non-U.S. dollar exposure
Strategic Currency Fundamentals

22
Greater Exposure to Global Currencies
U.S. Dollar74.8%
Non-U.S. Dollar25.2%
Non-U.S. Dollar33.8%
U.S. Dollar66.2%
Prior Current
Balanced Growth Portfolio
“Prior” is as of November 30, 2010. “Current” is as of December 31, 2010. Non-U.S.-dollar weighting includes Real Assets exposure.Bessemer’s recommendations may be adjusted due to changes in market conditions. Because each client has different spending needs, liquidity requirements, time horizon, risk tolerance and tax circumstances, individual implementation will vary.Alternative investments, including Bessemer hedge funds of funds, are not suitable for all clients and are available only to qualified investors. Exposure to other alternative investments, including private equity and real estate, may also be appropriate for qualified investors.

23
Hypothetical Client Allocation
As of December 31, 2010.This model displays Bessemer’s suggested model portfolio allocation guidelines. Each client situation is unique and may be subject to special circumstances, including but not limited to greater or less risk tolerance, classes and concentrations of assets not managed by Bessemer, investment limitations imposed under applicable governing documents and other limitations, that may require adjustments to the suggested allocations. These suggested model allocation guidelines are based on, among other things, market conditions, which may be subject to change, Bessemer’s current views on projected return and risk parameters, and overall political or economic conditions, all of which could affect these suggested allocations. These model asset allocation guidelines may be adjusted from time to time on the basis of the foregoing or other factors.Alternative investments, including Bessemer hedge funds of funds, private equity, and real estate, are not suitable for all clients and are available only to qualified investors.
Asset Class Exposure
Cash6%
Municipals13%
TIPS1%
MBS2%
Global Gov't Bonds2%
High-Yield Bonds2%
Convertible Bonds4%
Commodities3%
Commodity-Related Equities
4%
Strategic Currency5%Hedge Funds
12%
Global Small Cap Equities7%
Global Mid Cap Equities7%
Global Large Cap Equities17%
Real Estate5%
Private Equity10%

24
Summary
2010 performance was consistent with our objective of participating in strong market periods
while limiting losses during market setbacks
• Second consecutive year of double-digit gains for Balanced Growth
• Most portfolios delivered strong results
In 2011, we expect favorable market forces to drive further asset price gains, although potent
counterforces will pick up later in the year
Based on the environment we foresee, our portfolios are:
• Maintaining significant exposure to growth-oriented assets
• Protecting against potential interest rate rise
• Increasing currency diversification
• Augmenting inflation protection
• Implementing strategic shifts within asset classes

25

26
Bessemer Portfolios: Performance Comparison
Past performance is no guarantee of future results.*Balanced Portfolio excludes hedge fund due to limited performance history.The Growth and Balanced Growth Portfolios represent model portfolios comprised of U.S. Large Cap, Non-U.S. Large Cap, Global Opportunities, Global Small & Mid Cap, Real Return, Fixed Income, Strategic Cash, and three Bessemer hedge funds of funds. The Balanced Portfolio represents a model portfolio comprised of U.S. Large Cap, Non-U.S. Large Cap, Global Opportunities, Global Small & Mid Cap, Real Return, Fixed Income, and Strategic Cash. Investments cannot be made directly in these model portfolios. Relative weightings vary over time. The U.S. Stock/Bond Mix (70/30) is a composite of 70% S&P 500 Index and 30% Barclays Government/Credit Bond Index. The U.S. Stock/Bond Mix (55/45) is a composite of 55% S&P 500 Index and 45% of Barclays Government/Credit Bond Index. The Global Stock/Bond Mix reflects a mix of the S&P 500 Index (25%), S&P Mid Cap 400 Index (10%), MSCI EAFE Index (14%), MSCI World Small Index (5%), MSCI Emerging Markets Index (3%), HedgeFund.net (10%), Dow Jones-UBS Commodity Index (2.5%), Barclays Government/Credit Bond Index (25%), Barclays U.S. TIPS Index (2.5%), and Treasury Bills (3%). Index information is included herein to show the general trend in the securities markets during the periods indicated and is not intended to imply that any referenced portfolio is similar to the indices in either composition or volatility. Please see the end of this presentation for a complete description of Bessemer’s portfolios and benchmarks.
1 Year 3 Year 5 Year 10 Year
Balanced Growth Portfolio 12.1 1.5 5.3 4.1U.S. Stock/Bond Mix (70/30) 13.0 0.1 3.6 3.1Global Stock/Bond Mix 12.5 0.6 4.5 N/AGrowth Portfolio 13.9 (0.7) 4.2 2.6S&P 500 Index 15.1 (2.9) 2.3 1.4Balanced Portfolio* 11.2 3.0 N/A N/AU.S. Stock/Bond Mix (55/45) 11.8 1.5 N/A N/AFixed Income 5.6 6.7 6.6 6.3Barclays Gov't/Credit Index 6.6 5.6 5.6 5.8Municipal Bond 2.7 4.7 4.6 5.0Barclays Municipal Bond Index 2.4 4.1 4.1 4.8U.S. Large Cap 7.4 (4.1) 1.8 0.3S&P 500 Index 15.1 (2.9) 2.3 1.4Non-U.S. Large Cap 16.4 (2.9) 2.9 3.5MSCI EAFE Index 7.8 (7.0) 2.5 3.5Global Small & Mid Cap 24.1 7.5 9.8 N/AMSCI World Small Cap Index 26.1 1.9 4.5 N/AGlobal Opportunities 16.2 (2.4) N/A N/AS&P Global LargeMid Index 13.4 (3.4) N/A N/AReal Return 15.8 (2.8) 5.3 N/ADJ-UBS Commodity Index 16.8 (3.7) 1.2 N/ABarclays U.S. TIPS Index 6.3 5.0 5.3 N/A
Annualized - Periods Ending December 31, 2010

27
Past performance is no guarantee of future results.
2005 is the first full reporting period since Bessemer’s Chief Investment Officer assumed responsibilities for investments. The data shown for the Bessemer Balanced Portfolio represents performance since its inception in January 2007.
The Growth and Balanced Growth Portfolios represent model portfolios comprised of U.S. Large Cap, Non-U.S. Large Cap, Global Opportunities, Global Small & Mid Cap, Real Return, Fixed Income, Strategic Cash, and three Bessemer hedge funds of funds. The Balanced Portfolio represents a model portfolio comprised of U.S. Large Cap, Non-U.S. Large Cap, Global Opportunities, Global Small & Mid Cap, Real Return, Fixed Income, and Strategic Cash. Investments cannot be made directly in these model portfolios. Relative weightings vary over time. Returns for Old Westbury Global Opportunities Fund, Old Westbury Global Small & Mid Cap Fund, Old Westbury Real Return Fund, and Bessemer hedge funds of funds are after all fees and expenses. All other returns reflect performance of Bessemer Common Trust Funds and are before fees and expenses. The results also include the reinvestment of all dividends and capital gains.
Global Small & Mid Cap Fund returns began April 5, 2005. Real Return Fund returns began April 28, 2005. Global Opportunities Fund returns began November 28, 2007. Bessemer hedge funds of funds returns for these model portfolios began July 1, 2005, are preliminary and are subject to revision. Alternative investments, including Bessemer hedge funds of funds, are not suitable for all clients and are available only to qualified investors.
The Global Stock/Bond Mix reflects a mix of the S&P 500 Index (25%), S&P Mid Cap 400 Index (10%), MSCI EAFE Index (14%), MSCI World Small Index (5%), MSCI Emerging Markets Index (3%), HedgeFund.net (10%), Dow Jones-UBS Commodity Index (2.5%), Barclays Government/Credit Bond Index (25%), Barclays U.S. TIPS Index (2.5%), and Treasury Bills (3%).
The U.S. Stock/Bond Mix (70/30) is a composite of 70% S&P 500 Index and 30% Barclays Government/Credit Bond Index.
The U.S. Stock/Bond Mix (55/45) is a composite of 55% S&P 500 Index and 45% Barclays Government/Credit Bond Index.
Index information is included herein to show the general trend in the securities markets during the periods indicated and is not intended to imply that any referenced portfolio is similar to the indices in either composition or volatility.
Sources: Barclays Capital, Dow Jones, Federal Reserve, HedgeFund.net, Morgan Stanley Capital International, Standard & Poor’s, UBS