
Quarterly Global Oil Market Imbalance - mayerbrown.com · Capital Intensity Stabilized Last Two...
32
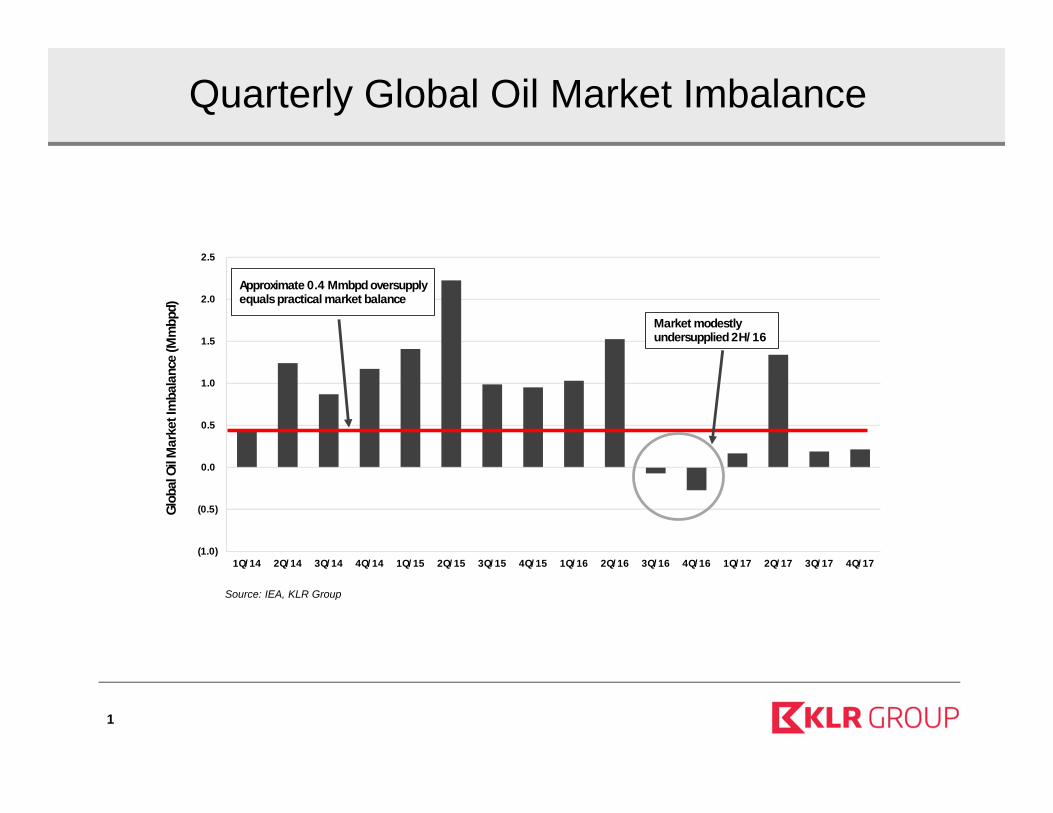
Quarterly Global Oil Market Imbalance 1.5 2.0 2.5 (Mmbpd) Market modestly undersupplied 2H/ 16 Approximate 0.4 Mmbpd oversupply equals practical market balance 0.5 1.0 Market Imbalance (1.0) (0.5) 0.0 1Q/ 14 2Q/ 14 3Q/ 14 4Q/ 14 1Q/ 15 2Q/ 15 3Q/ 15 4Q/ 15 1Q/ 16 2Q/ 16 3Q/ 16 4Q/ 16 1Q/ 17 2Q/ 17 3Q/ 17 4Q/ 17 Global Oil Source: IEA, KLR Group 1Q/ 14 2Q/ 14 3Q/ 14 4Q/ 14 1Q/ 15 2Q/ 15 3Q/ 15 4Q/ 15 1Q/ 16 2Q/ 16 3Q/ 16 4Q/ 16 1Q/ 17 2Q/ 17 3Q/ 17 4Q/ 17 1
Transcript of Quarterly Global Oil Market Imbalance - mayerbrown.com · Capital Intensity Stabilized Last Two...
Quarterly Global Oil Market Imbalance
1.5
2.0
2.5
(Mm
bpd)
Market modestly undersupplied 2H/ 16
Approximate 0.4 Mmbpd oversupply equals practical market balance
0.5
1.0
Mar
ket I
mba
lanc
e
(1.0)
(0.5)
0.0
1Q/ 14 2Q/ 14 3Q/ 14 4Q/ 14 1Q/ 15 2Q/ 15 3Q/ 15 4Q/ 15 1Q/ 16 2Q/ 16 3Q/ 16 4Q/ 16 1Q/ 17 2Q/ 17 3Q/ 17 4Q/ 17
Glob
al O
il
Source: IEA, KLR Group
1Q/ 14 2Q/ 14 3Q/ 14 4Q/ 14 1Q/ 15 2Q/ 15 3Q/ 15 4Q/ 15 1Q/ 16 2Q/ 16 3Q/ 16 4Q/ 16 1Q/ 17 2Q/ 17 3Q/ 17 4Q/ 17
1
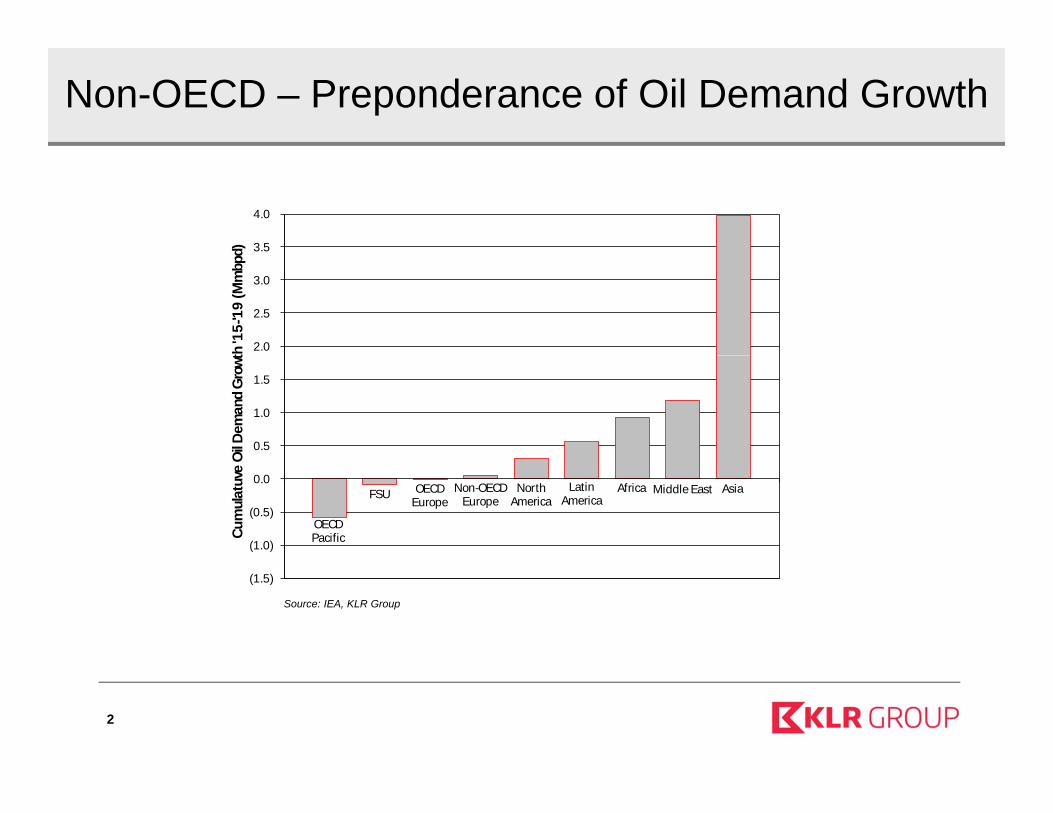
Non-OECD – Preponderance of Oil Demand Growth
3.5
4.0
d)
2.0
2.5
3.0
th '1
5-'1
9 (M
mbp
d
0.5
1.0
1.5
Oil D
eman
d Gr
owt
NorthAmericaFSU OECD
EuropeNon-OECD
Europe
OECDPacific
Middle EastAfricaLatinAmerica
Asia
(1.0)
(0.5)
0.0
Cum
ulat
uve
O
Source: IEA, KLR Group
(1.5)
2
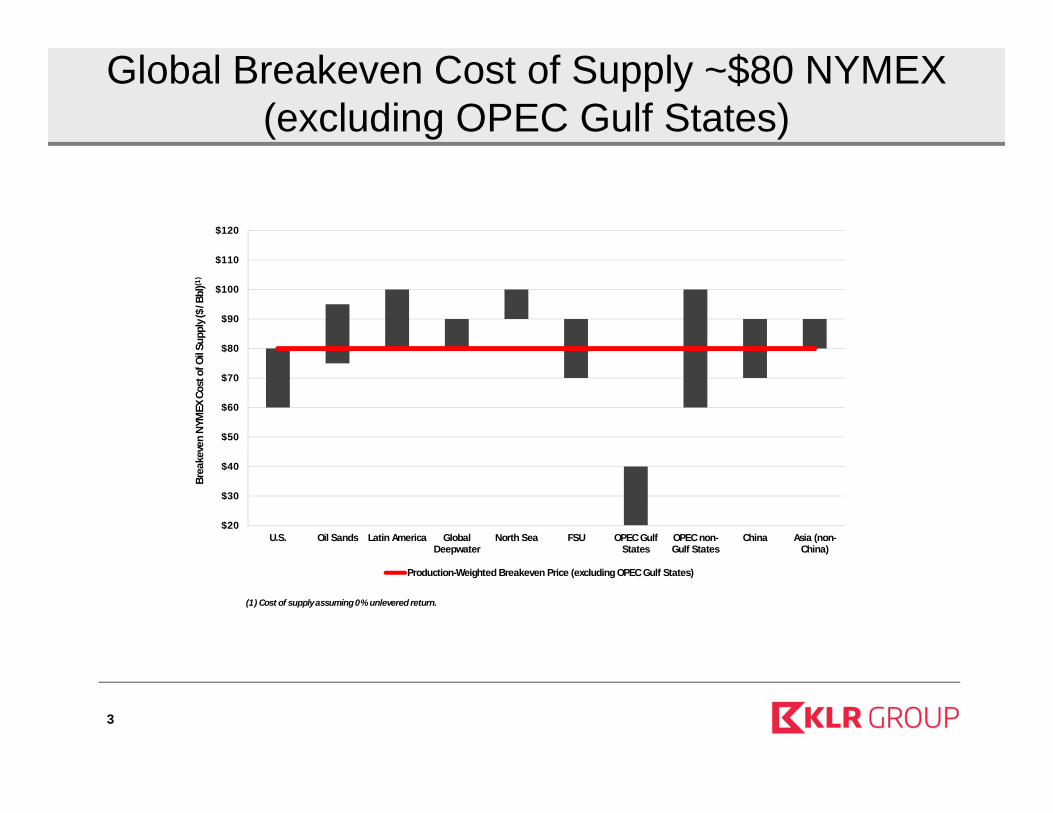
Global Breakeven Cost of Supply ~$80 NYMEX (excluding OPEC Gulf States)
$120
$80
$90
$100
$110
l Sup
ply (
$/Bb
l)(1)
$50
$60
$70
keve
n NY
MEX
Cos
t of O
i
$20
$30
$40
U.S. Oil Sands Latin America GlobalDeepwater
North Sea FSU OPEC GulfStates
OPEC non-Gulf States
China Asia (non-China)
Brea
k
Production-Weighted Breakeven Price (excluding OPEC Gulf States)
(1) Cost of supply assuming 0% unlevered return.
3
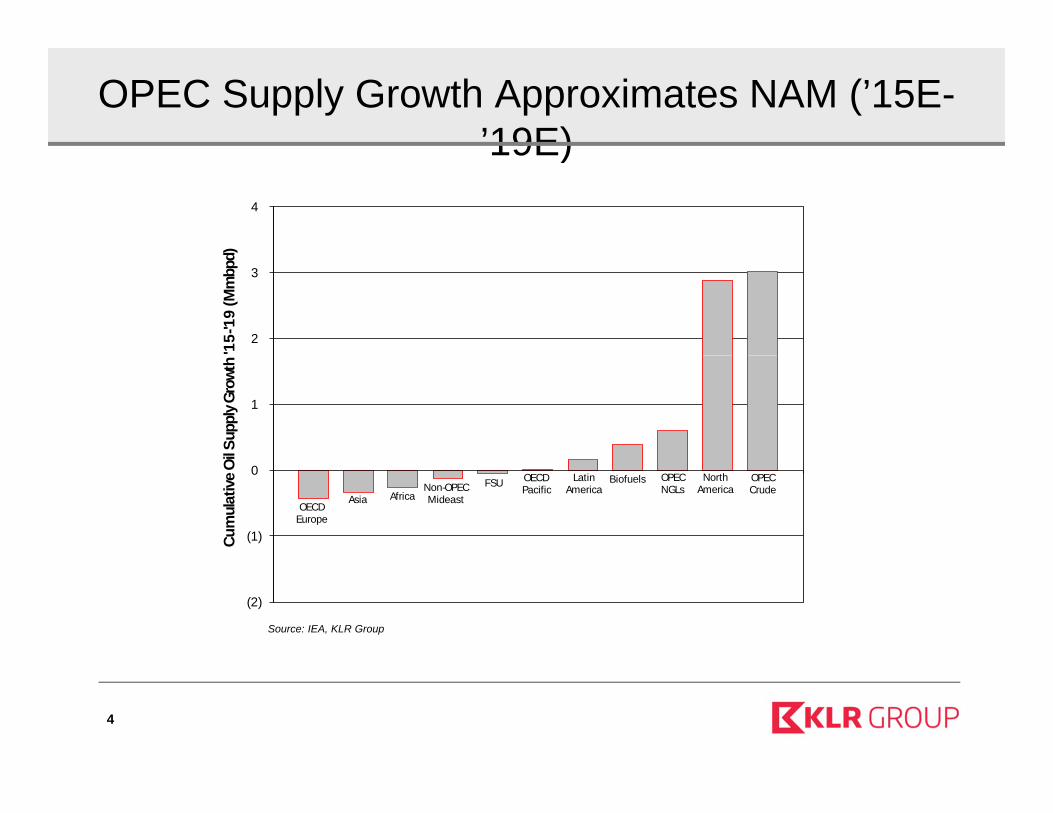
OPEC Supply Growth Approximates NAM (’15E-’19E)19E)
4
d)
2
3
'15-
'19
(Mm
bpd
1
il Sup
ply G
rowt
h
OECDEurope
Non-OPECMideast
BiofuelsAfrica
FSU OECDPacific
LatinAmerica
Asia
OPECCrude
OPECNGLs
NorthAmerica
(1)
0
Cum
ulat
ive O
i
Source: IEA, KLR Group
(2)
4
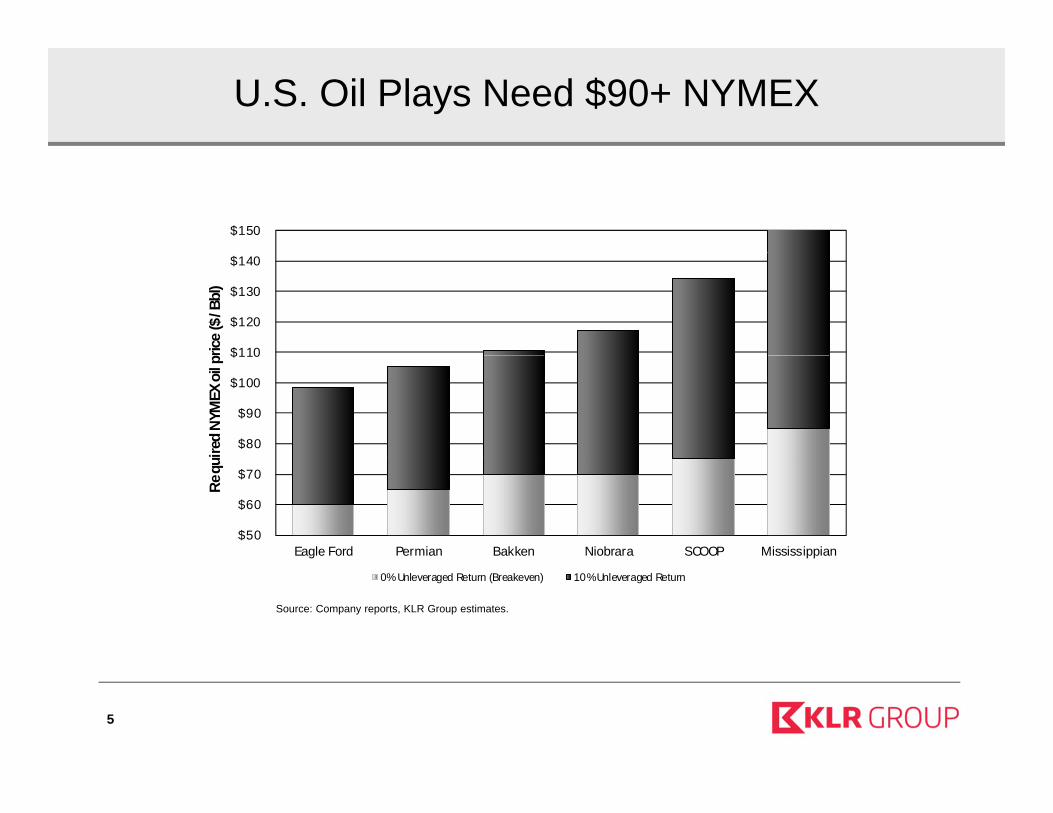
U.S. Oil Plays Need $90+ NYMEX
$150
$110
$120
$130
$140
rice
($/B
bl)
$80
$90
$100
$110
uire
d NY
MEX
oil p
$50
$60
$70
Eagle Ford Permian Bakken Niobrara SCOOP Mississippian
Requ
Source: Company reports, KLR Group estimates.
0% Unleveraged Return (Breakeven) 10% Unleveraged Return
5
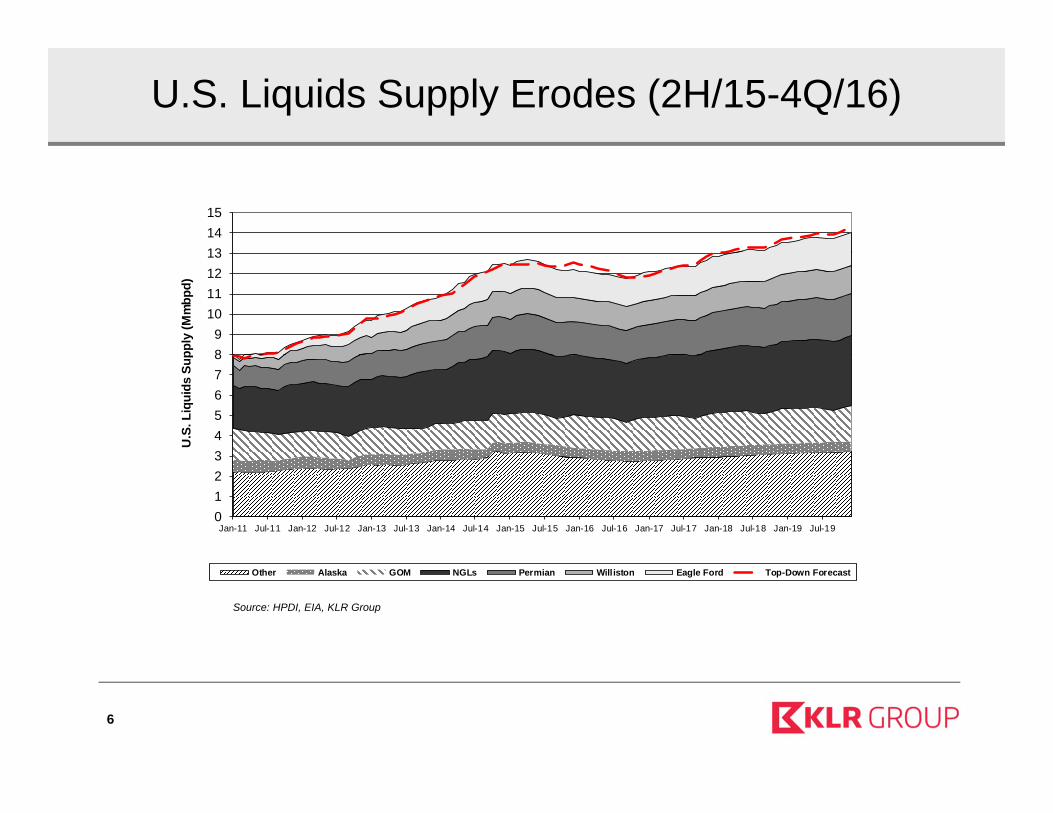
U.S. Liquids Supply Erodes (2H/15-4Q/16)
131415
89
10111213
pply
(Mm
bpd)
345678
U.S
. Liq
uids
Sup
0123
Jan-11 Jul-11 Jan-12 Jul-12 Jan-13 Jul-13 Jan-14 Jul-14 Jan-15 Jul-15 Jan-16 Jul-16 Jan-17 Jul-17 Jan-18 Jul-18 Jan-19 Jul-19
Source: HPDI, EIA, KLR Group
Other Alaska GOM NGLs Permian Williston Eagle Ford Top-Down Forecast
6
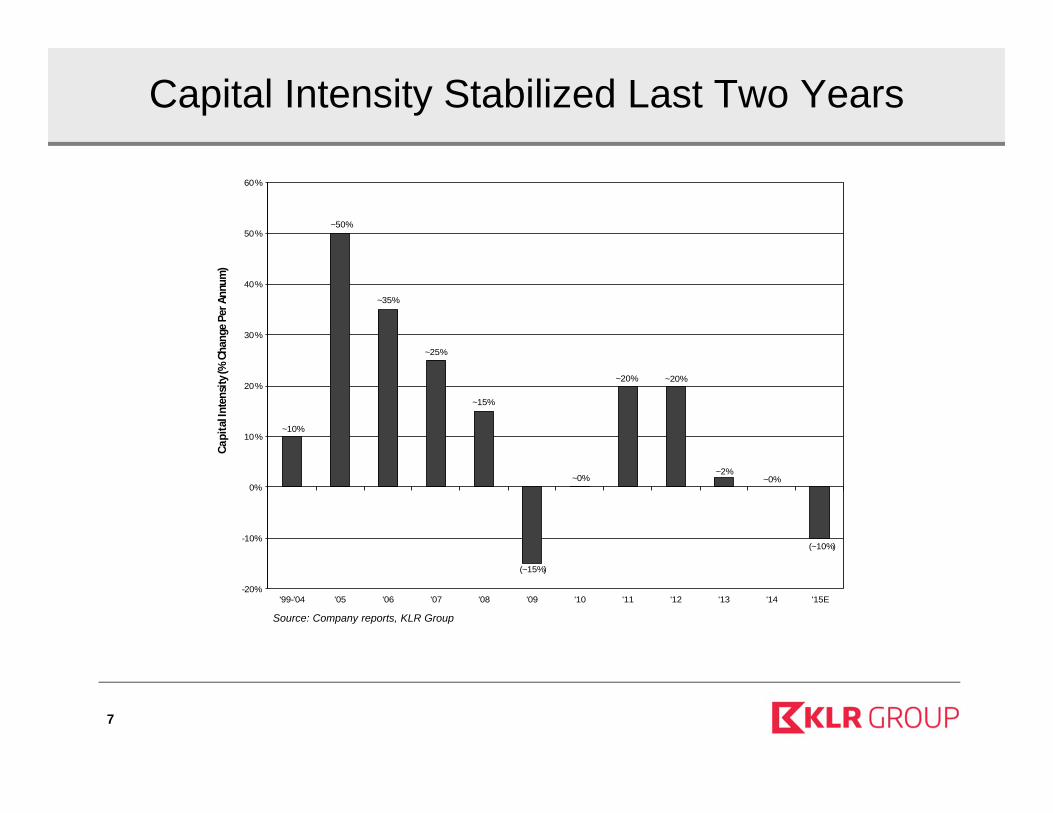
Capital Intensity Stabilized Last Two Years
~50%50%
60%
~35%
~25%
30%
40%
Chan
ge P
er A
nnum
)
~10%
~15%
~20% ~20%
10%
20%
Capi
tal In
tens
ity (%
C
~0%~2%
~0%
(~10%)-10%
0%
(~15%)
-20%'99-'04 '05 '06 '07 '08 '09 '10 '11 '12 '13 '14 '15E
Source: Company reports, KLR Group
7
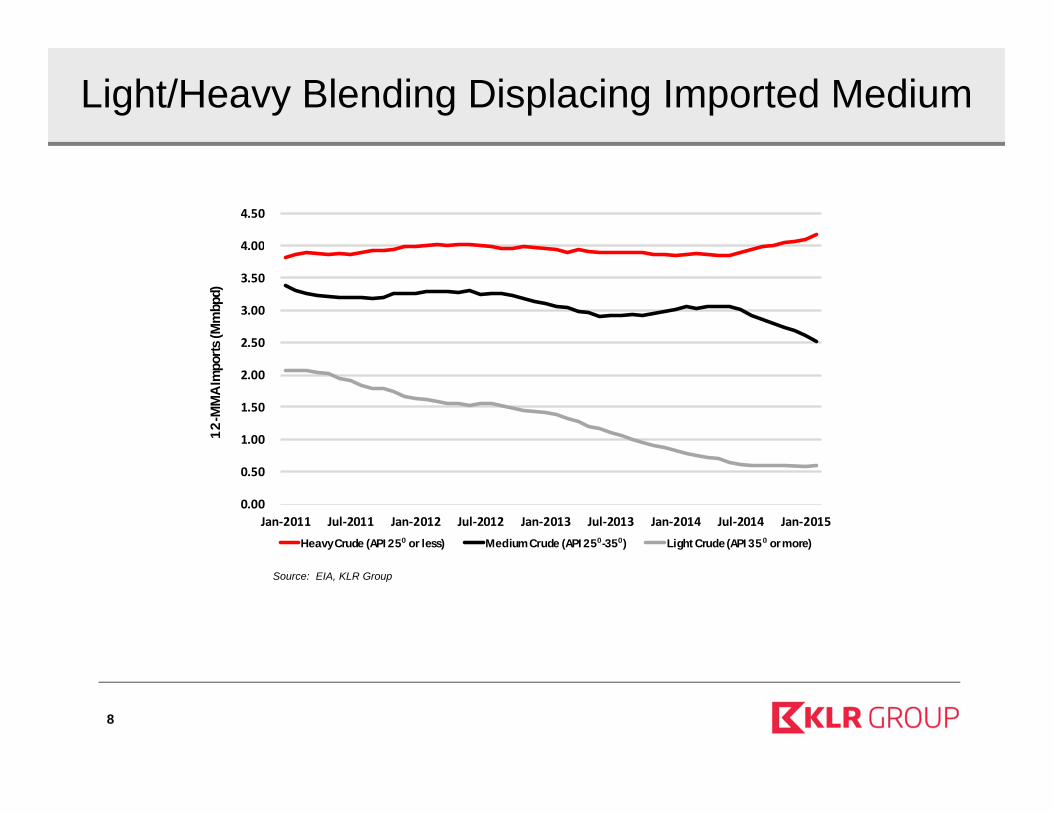
Light/Heavy Blending Displacing Imported Medium
4.00
4.50
2.50
3.00
3.50
rts (M
mbp
d)
1.00
1.50
2.00
12-M
MA
Impo
r
0.00
0.50
Jan‐2011 Jul‐2011 Jan‐2012 Jul‐2012 Jan‐2013 Jul‐2013 Jan‐2014 Jul‐2014 Jan‐2015
Heavy Crude (API 25⁰ or less) Medium Crude (API 25⁰-35⁰) Light Crude (API 35⁰ or more)
Source: EIA, KLR Group
8
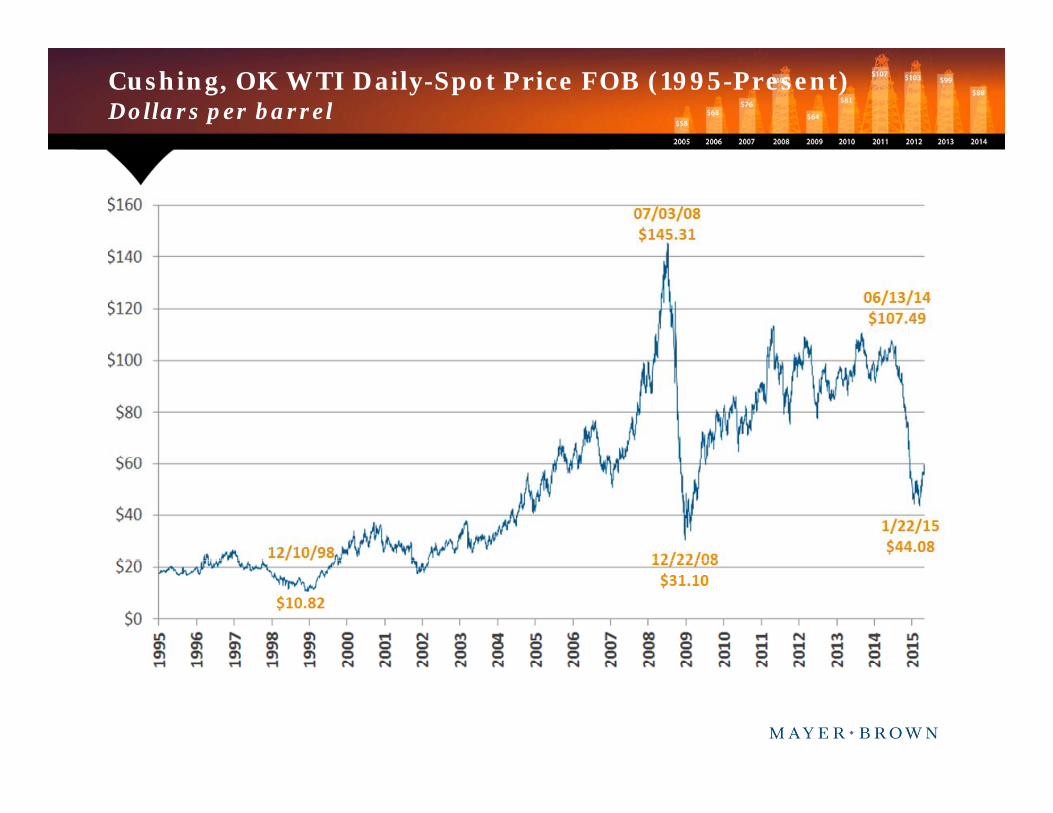
Cushing, OK WTI Daily-Spot Price FOB (1995-Present)Dollars per barrel

Oil Services, Equipment & DrillingMayer Brown’s 10th Annual Global Energy ConferenceMayer Brown s 10th Annual Global Energy Conference
May 13th, 2015
James C. West1 212 653 9047+1 212 653-9047

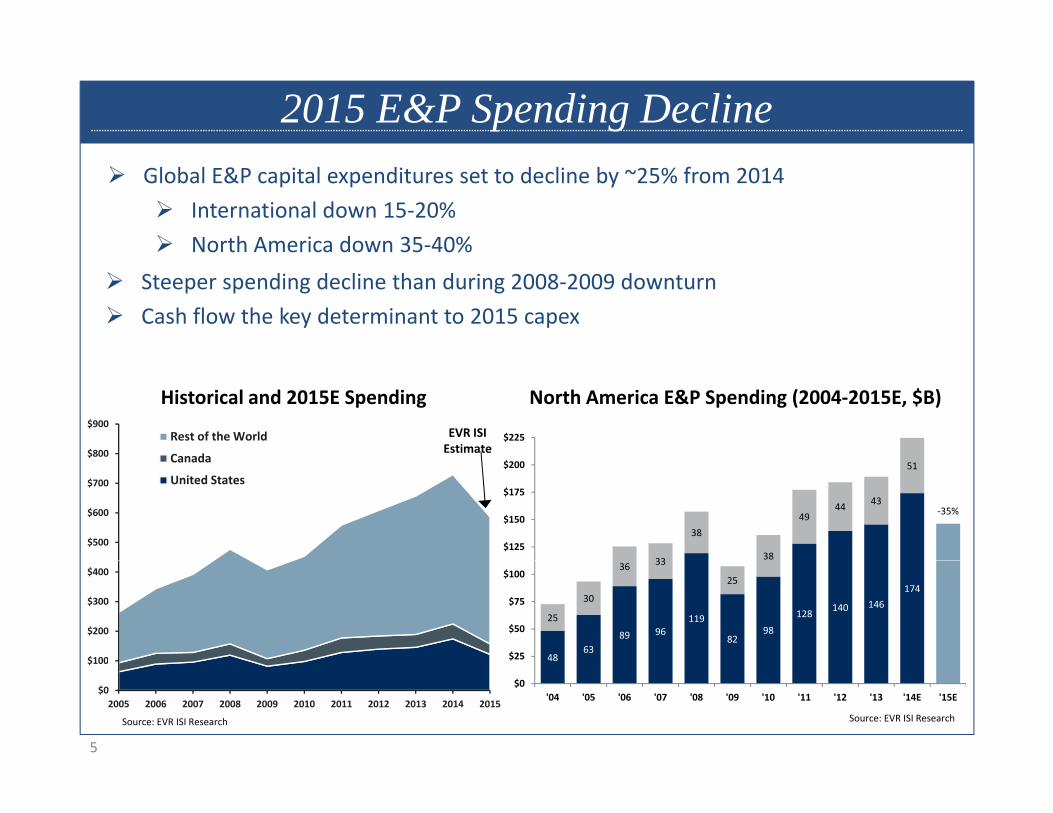
2015 E&P Spending Decline Global E&P capital expenditures set to decline by ~25% from 2014
International down 15‐20% North America down 35‐40%
Steeper spending decline than during 2008‐2009 downturn Cash flow the key determinant to 2015 capex
North America E&P Spending (2004‐2015E, $B)
$800
$900Rest of the World
Canada
EVR ISIEstimate
Historical and 2015E Spending
$225
$500
$600
$700
Canada
United States
‐35%
33
38
38
4944 43
51
$125
$150
$175
$200
$100
$200
$300
$400
4863
89 96119
8298
128 140 146174
25
30
36 33
25
$25
$50
$75
$100
5
$0
$100
2005 2006 2007 2008 2009 2010 2011 2012 2013 2014 2015
$0'04 '05 '06 '07 '08 '09 '10 '11 '12 '13 '14E '15E
Source: EVR ISI ResearchSource: EVR ISI Research

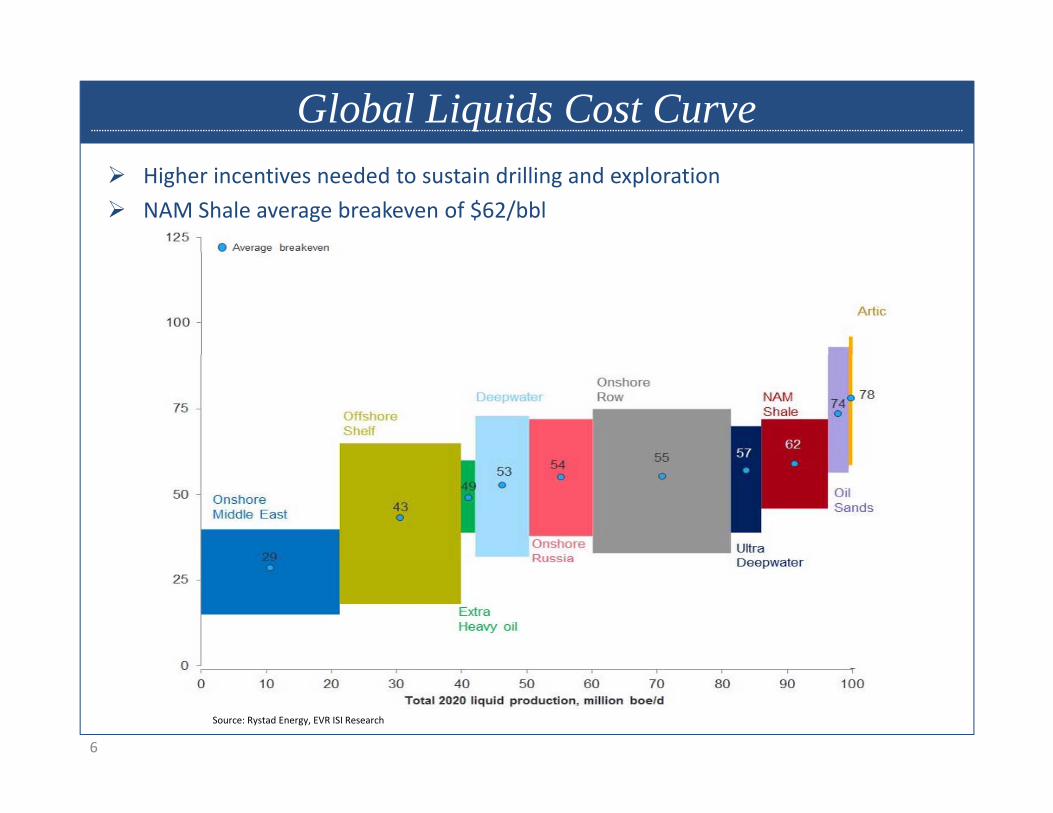
Global Liquids Cost Curve Higher incentives needed to sustain drilling and exploration NAM Shale average breakeven of $62/bbl
6
Source: Rystad Energy, EVR ISI Research

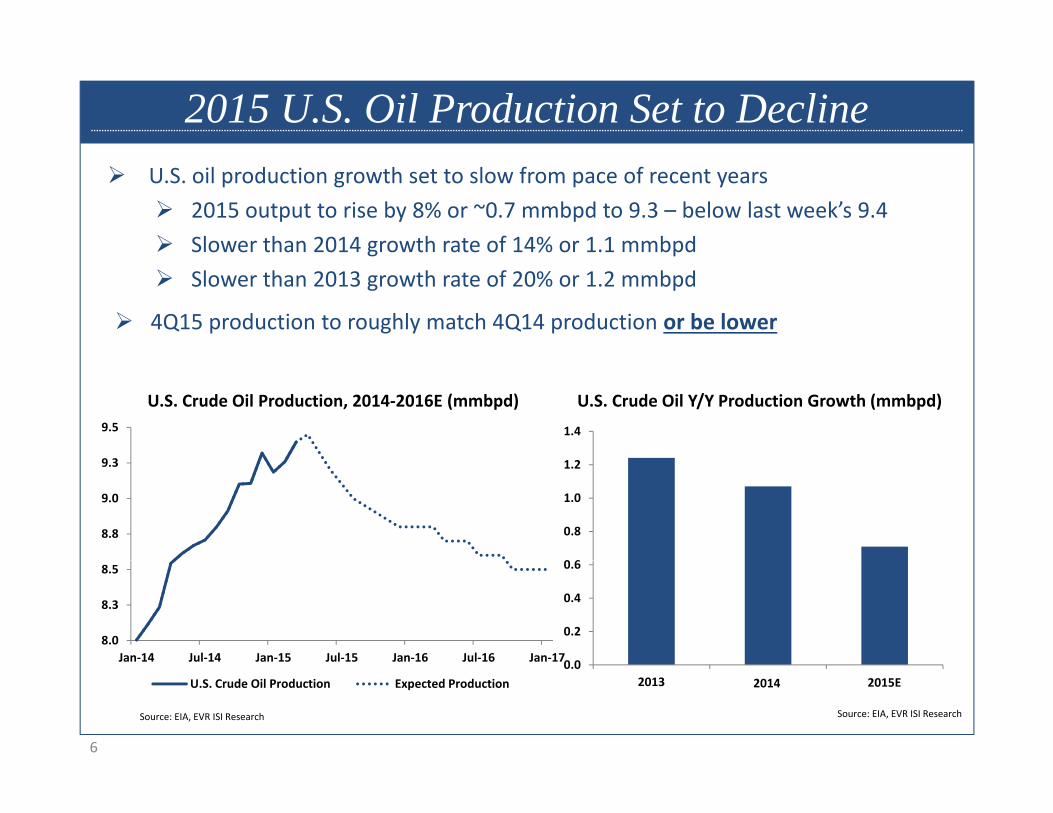
2015 U.S. Oil Production Set to Decline U.S. oil production growth set to slow from pace of recent years
2015 output to rise by 8% or ~0.7 mmbpd to 9.3 – below last week’s 9.4 Slower than 2014 growth rate of 14% or 1.1 mmbpdg p Slower than 2013 growth rate of 20% or 1.2 mmbpd
4Q15 production to roughly match 4Q14 production or be lower
U.S. Crude Oil Production, 2014‐2016E (mmbpd) U.S. Crude Oil Y/Y Production Growth (mmbpd)1.49.5
0 6
0.8
1.0
1.2
8.8
9.0
9.3
0 0
0.2
0.4
0.6
8.0
8.3
8.5
Jan‐14 Jul‐14 Jan‐15 Jul‐15 Jan‐16 Jul‐16 Jan‐17
6
0.02013 2014 2015E
Source: EIA, EVR ISI ResearchSource: EIA, EVR ISI Research
U.S. Crude Oil Production Expected Production
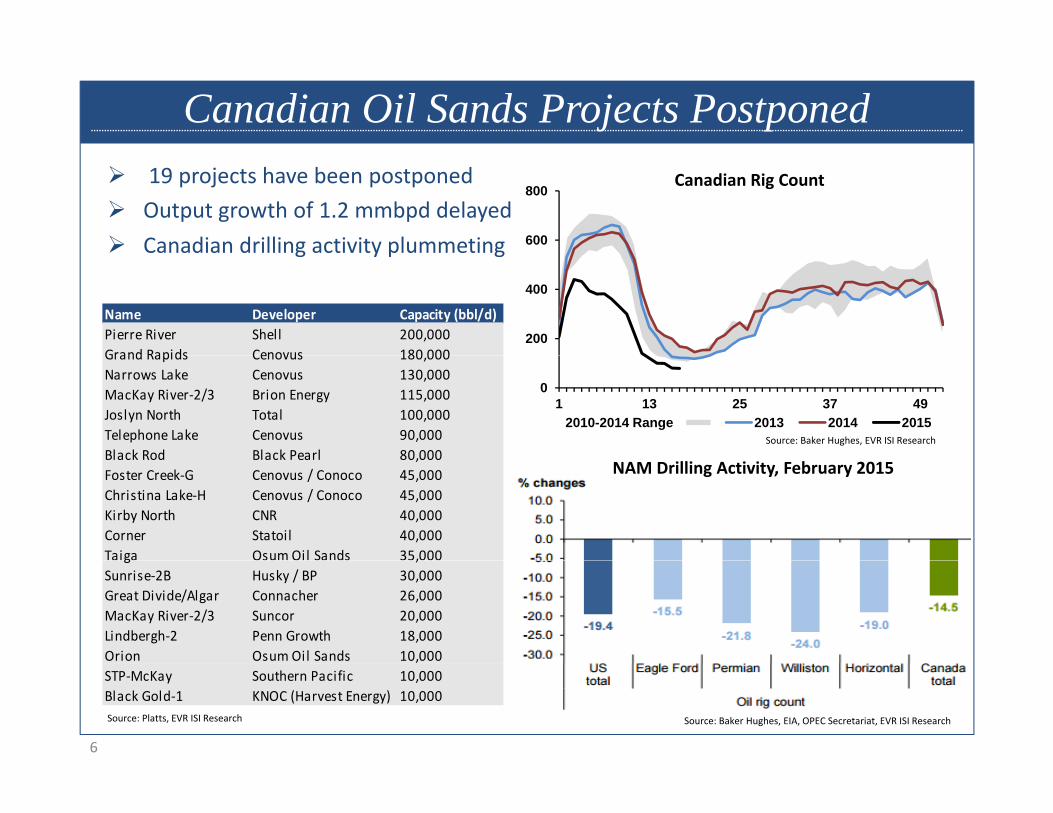
Canadian Oil Sands Projects Postponed 19 projects have been postponed Output growth of 1.2 mmbpd delayed Canadian drilling activity plummeting 600
800Canadian Rig Count
Ca ad a d g act ty p u et g
Name Developer Capacity (bbl/d)Pierre River Shell 200,000Grand Rapids Cenovus 180 000
200
400
Grand Rapids Cenovus 180,000Narrows Lake Cenovus 130,000MacKay River‐2/3 Brion Energy 115,000Joslyn North Total 100,000Telephone Lake Cenovus 90,000Black Rod Black Pearl 80 000
01 13 25 37 49
2010-2014 Range 2013 2014 2015Source: Baker Hughes, EVR ISI Research
NAM Drilling Activity, February 2015Black Rod Black Pearl 80,000Foster Creek‐G Cenovus / Conoco 45,000Christina Lake‐H Cenovus / Conoco 45,000Kirby North CNR 40,000Corner Statoil 40,000Taiga Osum Oil Sands 35,000g ,Sunrise‐2B Husky / BP 30,000Great Divide/Algar Connacher 26,000MacKay River‐2/3 Suncor 20,000Lindbergh‐2 Penn Growth 18,000Orion Osum Oil Sands 10,000
6
Source: Baker Hughes, EIA, OPEC Secretariat, EVR ISI ResearchSource: Platts, EVR ISI Research
STP‐McKay Southern Pacific 10,000Black Gold‐1 KNOC (Harvest Energy) 10,000

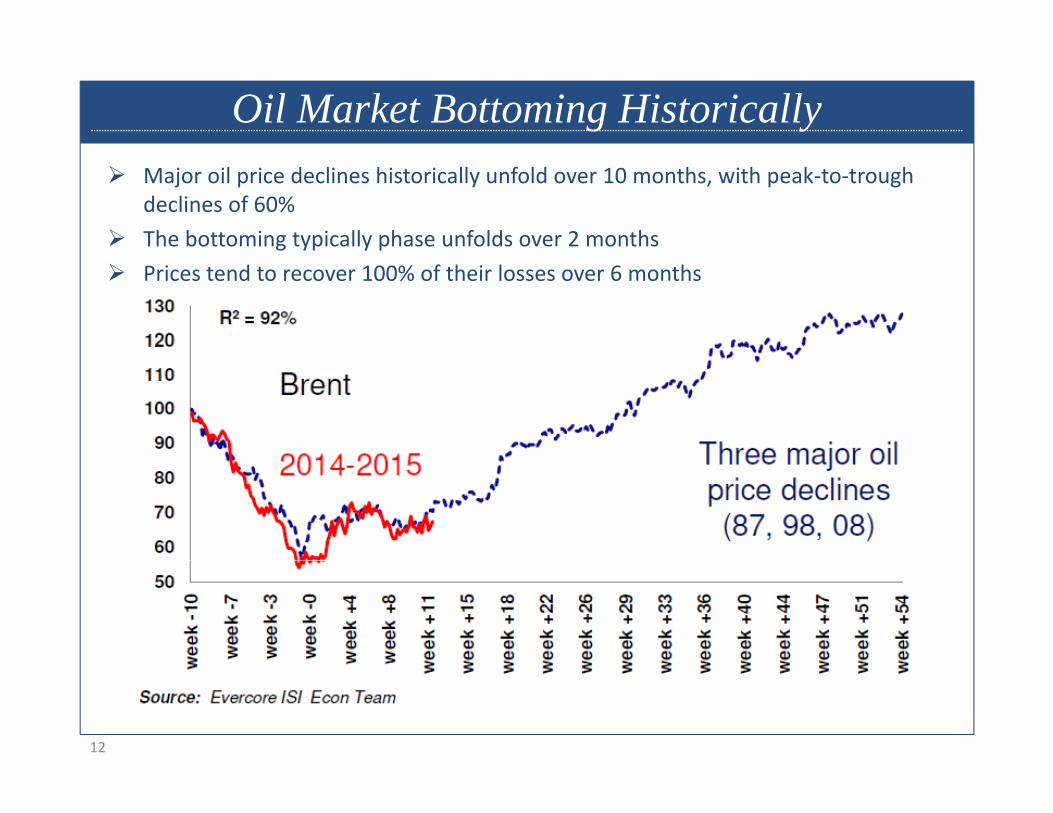
Oil Market Bottoming Historically Major oil price declines historically unfold over 10 months, with peak‐to‐trough
declines of 60% The bottoming typically phase unfolds over 2 months Prices tend to recover 100% of their losses over 6 months
12

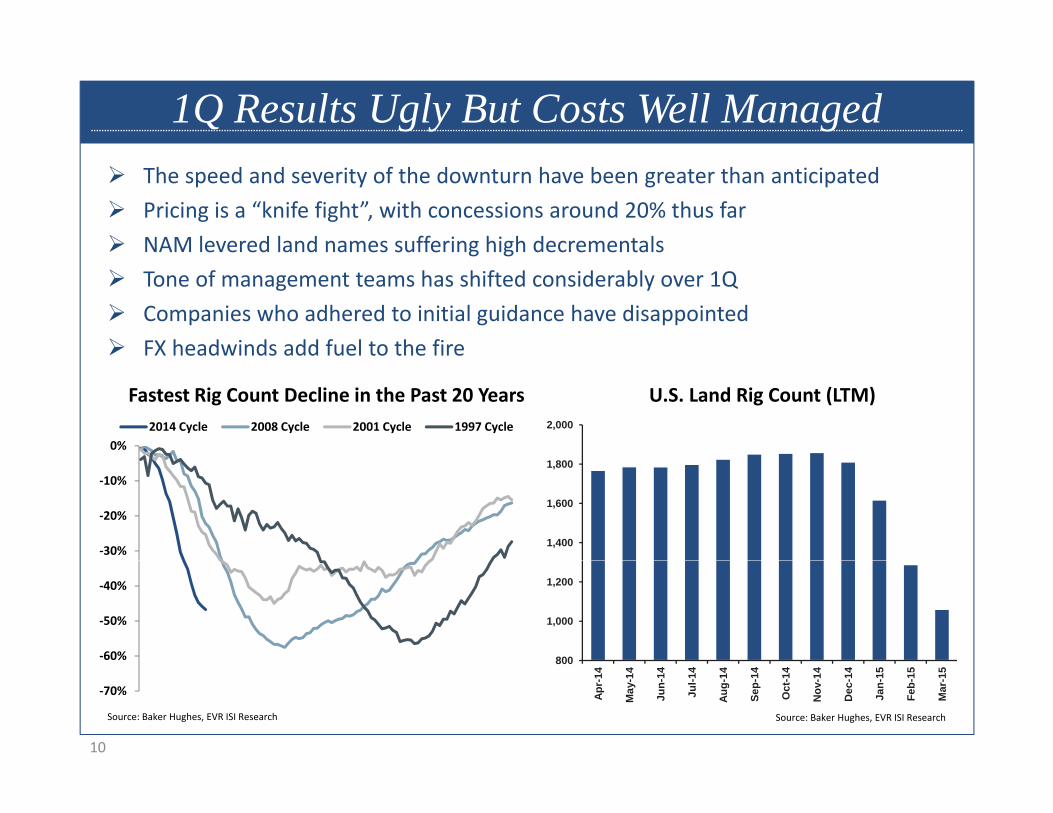
1Q Results Ugly But Costs Well Managed The speed and severity of the downturn have been greater than anticipated Pricing is a “knife fight”, with concessions around 20% thus far NAM levered land names suffering high decrementalsg g Tone of management teams has shifted considerably over 1Q Companies who adhered to initial guidance have disappointed FX headwinds add fuel to the fireFX headwinds add fuel to the fire
0%2014 Cycle 2008 Cycle 2001 Cycle 1997 Cycle
Fastest Rig Count Decline in the Past 20 Years2,000
U.S. Land Rig Count (LTM)
‐30%
‐20%
‐10%
1,400
1,600
1,800
‐60%
‐50%
‐40%
800
1,000
1,200
10
‐70%
800
Apr-
14
May
-14
Jun-
14
Jul-1
4
Aug-
14
Sep-
14
Oct
-14
Nov
-14
Dec
-14
Jan-
15
Feb-
15
Mar
-15
Source: Baker Hughes, EVR ISI Research Source: Baker Hughes, EVR ISI Research
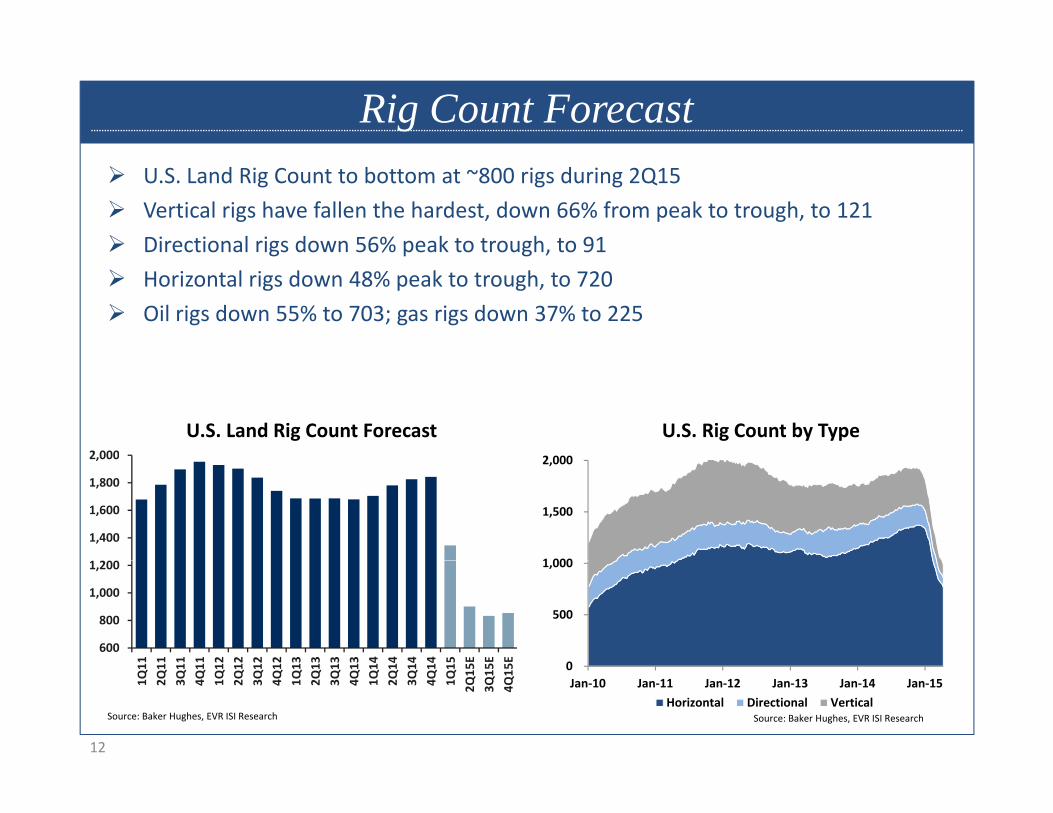
Rig Count Forecast U.S. Land Rig Count to bottom at ~800 rigs during 2Q15 Vertical rigs have fallen the hardest, down 66% from peak to trough, to 121 Directional rigs down 56% peak to trough, to 91g p g , Horizontal rigs down 48% peak to trough, to 720 Oil rigs down 55% to 703; gas rigs down 37% to 225
U.S. Land Rig Count Forecast2 000
U.S. Rig Count by Type2,000
1 000
1,500
2,000
1,400
1,600
1,800
2,000
0
500
1,000
600
800
1,000
1,200
1 1 1 1 2 2 2 2 3 3 3 3 4 4 4 4 5 E E E
12
0 Jan‐10 Jan‐11 Jan‐12 Jan‐13 Jan‐14 Jan‐15
Horizontal Directional VerticalSource: Baker Hughes, EVR ISI Research Source: Baker Hughes, EVR ISI Research
1Q1
2Q1
3Q1
4Q1
1Q1
2Q1
3Q1
4Q1
1Q1
2Q1
3Q1
4Q1
1Q1
2Q1
3Q1
4Q1
1Q1
2Q15
3Q15
4Q15

• ANALYST CERTIFICATION• The analysts, James West, Samantha Hoh, Cameron Schnier and Alex Nuta, primarily responsible for the preparation of this research report attest to the following: (1) that the views and
opinions rendered in this research report reflect his or her personal views about the subject companies or issuers; and (2) that no part of the research analyst’s compensation was, is, or will be directly related to the specific recommendations or views in this research report.
•DISCLOSURES
•This report is approved and/or distributed by International Strategy & Investment Group LLC (“ISI Group LLC”), a U.S. licensed broker‐dealer regulated by the Financial Industry Regulatory Authority (“FINRA”) and by International Strategy & Investment Group (UK) Limited (“ISI UK”), which is authorised and regulated in the United Kingdom by the Financial Conduct Authority. ISI Group and ISI UK are subsidiaries of Evercore Partners Inc. and collectively operate under the global marketing brand name Evercore ISI (“Evercore ISI”). The trademarks, logos and service marks shown on this report are registered trademarks of Evercore Partners Inc.
•The analysts and associates responsible for preparing this report receive compensation based on various factors, including the firm’s total revenues, a portion of which is generated by affiliated investment banking transactions Evercore ISI publishes and disseminates research through Evercore ISI and seeks to update its research as appropriate but various regulationsaffiliated investment banking transactions. Evercore ISI publishes and disseminates research through Evercore ISI, and seeks to update its research as appropriate, but various regulations may prevent this from happening in certain instances. Aside from certain industry reports published on a periodic basis, the large majority of reports are published at irregular intervals as appropriate in the analyst’s judgment.
•Evercore ISI generally prohibits analysts, associates and members of their households from maintaining a financial interest in the securities of any company in the analyst’s area of coverage. Any exception to this policy requires specific approval by Evercore ISI Compliance. Such ownership is subject to compliance with applicable regulations and disclosure. Evercore ISI also prohibits analysts, associates and members of their households from serving as an officer, director, advisory board member or employee of any company that the analyst covers.
•Thi t i l d T ti l C ll hi h d ib t t t l t ff ti th bj t th k t ll d hi h i t d t h h t t iThis report may include a Tactical Call, which describes a near‐term event or catalyst affecting the subject company or the market overall and which is expected to have a short‐term price impact on the equity shares of the subject company. This Tactical Call is separate from the analyst’s long‐term recommendation (Buy, Hold or Sell) that reflects a stock’s forward 12‐month expected return), is not a formal rating and may differ from the target prices and recommendations reflected in the analyst’s long‐term view.
•Applicable current disclosures regarding the subject companies covered in this report are available at the offices of Evercore ISI, and can be obtained by writing to ISI Group LLC, Attn. Compliance, 666 Fifth Avenue, 11th Floor, New York, NY 10103.
•Evercore ISI and / or its affiliates, and / or their directors, officers, members and employees, may have, or have had, interests or qualified holdings on issuers mentioned in this report. Evercore ISI and / or its affiliates may have, or have had, business relationships with the companies mentioned in this report..
•Additional information on securities or financial instruments mentioned in this report is available upon request.
•Ratings Definitions
•Current Ratings Definition
21
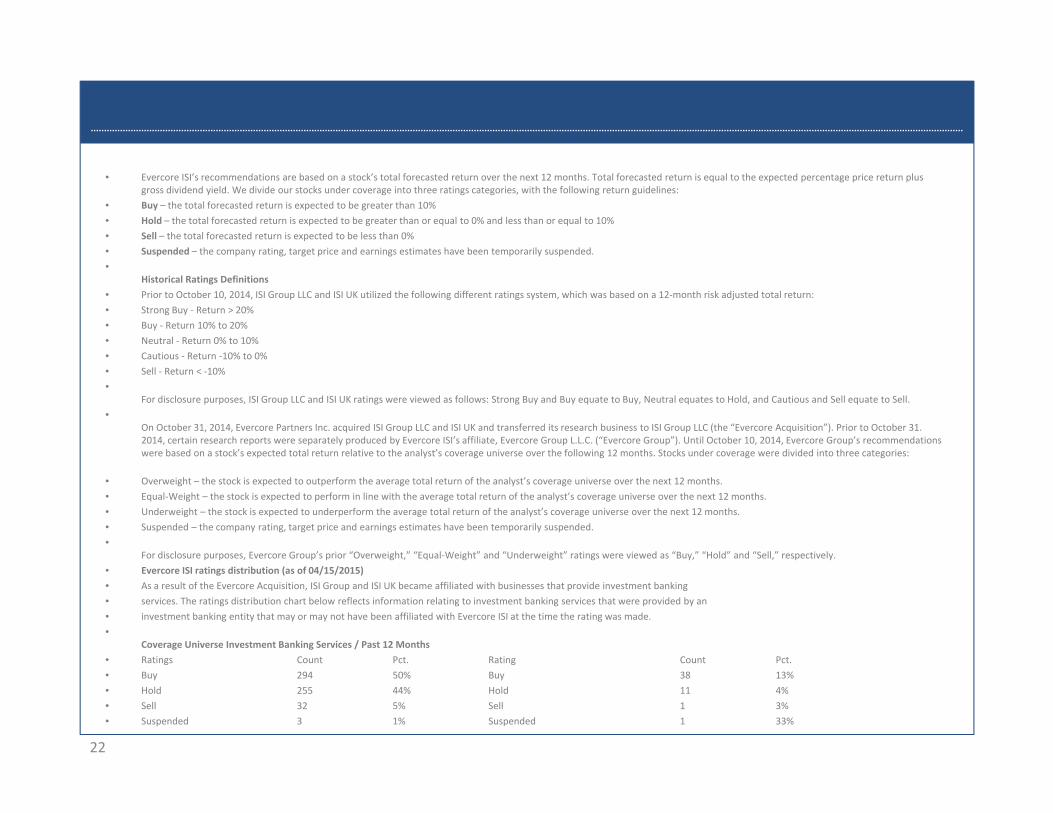
• Evercore ISI’s recommendations are based on a stock’s total forecasted return over the next 12 months. Total forecasted return is equal to the expected percentage price return plus gross dividend yield. We divide our stocks under coverage into three ratings categories, with the following return guidelines:
• Buy – the total forecasted return is expected to be greater than 10%• Hold – the total forecasted return is expected to be greater than or equal to 0% and less than or equal to 10%• Sell – the total forecasted return is expected to be less than 0%• Suspended – the company rating target price and earnings estimates have been temporarily suspendedSuspended the company rating, target price and earnings estimates have been temporarily suspended.•
Historical Ratings Definitions• Prior to October 10, 2014, ISI Group LLC and ISI UK utilized the following different ratings system, which was based on a 12‐month risk adjusted total return:• Strong Buy ‐ Return > 20%• Buy ‐ Return 10% to 20%• Neutral ‐ Return 0% to 10%• Cautious Return 10% to 0%• Cautious ‐ Return ‐10% to 0%• Sell ‐ Return < ‐10%•
For disclosure purposes, ISI Group LLC and ISI UK ratings were viewed as follows: Strong Buy and Buy equate to Buy, Neutral equates to Hold, and Cautious and Sell equate to Sell.•
On October 31, 2014, Evercore Partners Inc. acquired ISI Group LLC and ISI UK and transferred its research business to ISI Group LLC (the “Evercore Acquisition”). Prior to October 31. 2014, certain research reports were separately produced by Evercore ISI’s affiliate, Evercore Group L.L.C. (“Evercore Group”). Until October 10, 2014, Evercore Group’s recommendations were based on a stock’s expected total return relative to the analyst’s coverage universe over the following 12 months. Stocks under coverage were divided into three categories:p y g g g g
• Overweight – the stock is expected to outperform the average total return of the analyst’s coverage universe over the next 12 months.• Equal‐Weight – the stock is expected to perform in line with the average total return of the analyst’s coverage universe over the next 12 months.• Underweight – the stock is expected to underperform the average total return of the analyst’s coverage universe over the next 12 months.• Suspended – the company rating, target price and earnings estimates have been temporarily suspended.•
For disclosure purposes, Evercore Group’s prior “Overweight,” “Equal‐Weight” and “Underweight” ratings were viewed as “Buy,” “Hold” and “Sell,” respectively.• Evercore ISI ratings distribution (as of 04/15/2015)• As a result of the Evercore Acquisition, ISI Group and ISI UK became affiliated with businesses that provide investment banking• services. The ratings distribution chart below reflects information relating to investment banking services that were provided by an• investment banking entity that may or may not have been affiliated with Evercore ISI at the time the rating was made.•
Coverage Universe Investment Banking Services / Past 12 Months• Ratings Count Pct. Rating Count Pct.
22
Ratings Count Pct. Rating Count Pct.• Buy 294 50% Buy 38 13%• Hold 255 44% Hold 11 4%• Sell 32 5% Sell 1 3%• Suspended 3 1% Suspended 1 33%
• General Disclosures• This report is provided for informational purposes only. It is not to be construed as an offer to buy or sell or a solicitation of an offer to buy or sell any financial instruments or to
participate in any particular trading strategy in any jurisdiction. The information and opinions in this report were prepared by registered employees of Evercore ISI. The information herein is believed by Evercore ISI to be reliable and has been obtained from public sources believed to be reliable, but Evercore ISI makes no representation as to the accuracy or completeness of such information. Opinions, estimates and projections in this report constitute the current judgment of the author as of the date of this report. They do not necessarily reflect the opinions of Evercore and are subject to change without notice. In addition, opinions, estimates and projections in this report may differ from or be contrary to those expressed b h b i f E d i ffili E ISI h bli i d dif d hi h i if d h f i hby other business areas or groups of Evercore and its affiliates. Evercore ISI has no obligation to update, modify or amend this report or to otherwise notify a reader thereof in the event that any matter stated herein, or any opinion, projection, forecast or estimate set forth herein, changes or subsequently becomes inaccurate. Facts and views in Evercore ISI research reports and notes have not been reviewed by, and may not reflect information known to, professionals in other Evercore affiliates or business areas, including investment banking personnel.
•Evercore ISI does not provide individually tailored investment advice in research reports. This report has been prepared without regard to the particular investments and circumstances of the recipient. The financial instruments discussed in this report may not suitable for all investors and investors must make their own investment decisions using their own independent advisors as they believe necessary and based upon their specific financial situations and investment objectives. Securities and other financial instruments discussed in this report, or recommended or offered by Evercore ISI, are not insured by the Federal Deposit Insurance Corporation and are not deposits of or other obligations of any insured depository institution. If a financial instrument is denominated in a currency other than an investor’s currency, a change in exchange rates may adversely affect the price or value of, or the income derived from the financial instrument, and such investor effectively assumes such currency risk. In addition, income from an investment may fluctuate and the price or value of financial instruments described in this report, either directly or indirectly, may rise or fall. Estimates of future performance are based on assumptions that may not be realized. Furthermore, past performance is not necessarily indicative of future performance.
•Evercore ISI salespeople, traders and other professionals may provide oral or written market commentary or trading strategies to our clients that reflect opinions that are contrary to the opinions expressed in this research. Our asset management affiliates and investing businesses may make investment decisions that are inconsistent with the recommendations or views p p g g yexpressed in this research.
• Electronic research is simultaneously available to all clients. This report is provided to Evercore ISI clients and may not be redistributed, retransmitted or disclosed, in whole or in part, or in any form or manner, without the express written consent of Evercore ISI. Receipt and review of this research report constitutes your agreement not to redistribute, retransmit, or disclose to others the contents, opinions, conclusion or information contained in this report (including any investment recommendations, estimates or target prices) without first obtaining express permission from Evercore ISI.
•This report is not intended for distribution to or use by any person or entity in any jurisdiction or country where such distribution or use would be contrary to local law or regulation ForThis report is not intended for distribution to, or use by any person or entity in any jurisdiction or country where such distribution or use would be contrary to local law or regulation. For investors in the UK: In making this report available, Evercore makes no recommendation to buy, sell or otherwise deal in any securities or investments whatsoever and you should neither rely or act upon, directly or indirectly, any of the information contained in this report in respect of any such investment activity. This report is being directed at or distributed to, (a) persons who fall within the definition of Investment Professionals (set out in Article 19(5) of the Financial Services and Markets Act 2000 (Financial Promotion) Order 2005 (the “Order”)); (b) persons falling within the definition of high net worth companies, unincorporated associations, etc. (set out in Article 49(2) of the Order); (c) other persons to whom it may otherwise lawfully be communicated (all such persons together being referred to as “relevant persons”). This report must not be acted on or relied on by persons who are not relevant persons.
23

Cushing, OK WTI Daily-Spot Price FOB (1995-Present)Dollars per barrel
Oil Services, Equipment & DrillingMayer Brown’s 10th Annual Global Energy ConferenceMayer Brown s 10th Annual Global Energy Conference
May 13th, 2015
James C. West1 212 653 9047+1 212 653-9047
2015 E&P Spending Decline Global E&P capital expenditures set to decline by ~25% from 2014
International down 15‐20% North America down 35‐40%
Steeper spending decline than during 2008‐2009 downturn Cash flow the key determinant to 2015 capex
North America E&P Spending (2004‐2015E, $B)
$800
$900Rest of the World
Canada
EVR ISIEstimate
Historical and 2015E Spending
$225
$500
$600
$700
Canada
United States
‐35%
33
38
38
4944 43
51
$125
$150
$175
$200
$100
$200
$300
$400
4863
89 96119
8298
128 140 146174
25
30
36 33
25
$25
$50
$75
$100
5
$0
$100
2005 2006 2007 2008 2009 2010 2011 2012 2013 2014 2015
$0'04 '05 '06 '07 '08 '09 '10 '11 '12 '13 '14E '15E
Source: EVR ISI ResearchSource: EVR ISI Research
Global Liquids Cost Curve Higher incentives needed to sustain drilling and exploration NAM Shale average breakeven of $62/bbl
6
Source: Rystad Energy, EVR ISI Research
2015 U.S. Oil Production Set to Decline U.S. oil production growth set to slow from pace of recent years
2015 output to rise by 8% or ~0.7 mmbpd to 9.3 – below last week’s 9.4 Slower than 2014 growth rate of 14% or 1.1 mmbpdg p Slower than 2013 growth rate of 20% or 1.2 mmbpd
4Q15 production to roughly match 4Q14 production or be lower
U.S. Crude Oil Production, 2014‐2016E (mmbpd) U.S. Crude Oil Y/Y Production Growth (mmbpd)1.49.5
0 6
0.8
1.0
1.2
8.8
9.0
9.3
0 0
0.2
0.4
0.6
8.0
8.3
8.5
Jan‐14 Jul‐14 Jan‐15 Jul‐15 Jan‐16 Jul‐16 Jan‐17
6
0.02013 2014 2015E
Source: EIA, EVR ISI ResearchSource: EIA, EVR ISI Research
U.S. Crude Oil Production Expected Production

Canadian Oil Sands Projects Postponed 19 projects have been postponed Output growth of 1.2 mmbpd delayed Canadian drilling activity plummeting 600
800Canadian Rig Count
Ca ad a d g act ty p u et g
Name Developer Capacity (bbl/d)Pierre River Shell 200,000Grand Rapids Cenovus 180 000
200
400
Grand Rapids Cenovus 180,000Narrows Lake Cenovus 130,000MacKay River‐2/3 Brion Energy 115,000Joslyn North Total 100,000Telephone Lake Cenovus 90,000Black Rod Black Pearl 80 000
01 13 25 37 49
2010-2014 Range 2013 2014 2015Source: Baker Hughes, EVR ISI Research
NAM Drilling Activity, February 2015Black Rod Black Pearl 80,000Foster Creek‐G Cenovus / Conoco 45,000Christina Lake‐H Cenovus / Conoco 45,000Kirby North CNR 40,000Corner Statoil 40,000Taiga Osum Oil Sands 35,000g ,Sunrise‐2B Husky / BP 30,000Great Divide/Algar Connacher 26,000MacKay River‐2/3 Suncor 20,000Lindbergh‐2 Penn Growth 18,000Orion Osum Oil Sands 10,000
6
Source: Baker Hughes, EIA, OPEC Secretariat, EVR ISI ResearchSource: Platts, EVR ISI Research
STP‐McKay Southern Pacific 10,000Black Gold‐1 KNOC (Harvest Energy) 10,000
Oil Market Bottoming Historically Major oil price declines historically unfold over 10 months, with peak‐to‐trough
declines of 60% The bottoming typically phase unfolds over 2 months Prices tend to recover 100% of their losses over 6 months
12
1Q Results Ugly But Costs Well Managed The speed and severity of the downturn have been greater than anticipated Pricing is a “knife fight”, with concessions around 20% thus far NAM levered land names suffering high decrementalsg g Tone of management teams has shifted considerably over 1Q Companies who adhered to initial guidance have disappointed FX headwinds add fuel to the fireFX headwinds add fuel to the fire
0%2014 Cycle 2008 Cycle 2001 Cycle 1997 Cycle
Fastest Rig Count Decline in the Past 20 Years2,000
U.S. Land Rig Count (LTM)
‐30%
‐20%
‐10%
1,400
1,600
1,800
‐60%
‐50%
‐40%
800
1,000
1,200
10
‐70%
800
Apr-
14
May
-14
Jun-
14
Jul-1
4
Aug-
14
Sep-
14
Oct
-14
Nov
-14
Dec
-14
Jan-
15
Feb-
15
Mar
-15
Source: Baker Hughes, EVR ISI Research Source: Baker Hughes, EVR ISI Research

Rig Count Forecast U.S. Land Rig Count to bottom at ~800 rigs during 2Q15 Vertical rigs have fallen the hardest, down 66% from peak to trough, to 121 Directional rigs down 56% peak to trough, to 91g p g , Horizontal rigs down 48% peak to trough, to 720 Oil rigs down 55% to 703; gas rigs down 37% to 225
U.S. Land Rig Count Forecast2 000
U.S. Rig Count by Type2,000
1 000
1,500
2,000
1,400
1,600
1,800
2,000
0
500
1,000
600
800
1,000
1,200
1 1 1 1 2 2 2 2 3 3 3 3 4 4 4 4 5 E E E
12
0 Jan‐10 Jan‐11 Jan‐12 Jan‐13 Jan‐14 Jan‐15
Horizontal Directional VerticalSource: Baker Hughes, EVR ISI Research Source: Baker Hughes, EVR ISI Research
1Q1
2Q1
3Q1
4Q1
1Q1
2Q1
3Q1
4Q1
1Q1
2Q1
3Q1
4Q1
1Q1
2Q1
3Q1
4Q1
1Q1
2Q15
3Q15
4Q15
• ANALYST CERTIFICATION• The analysts, James West, Samantha Hoh, Cameron Schnier and Alex Nuta, primarily responsible for the preparation of this research report attest to the following: (1) that the views and
opinions rendered in this research report reflect his or her personal views about the subject companies or issuers; and (2) that no part of the research analyst’s compensation was, is, or will be directly related to the specific recommendations or views in this research report.
•DISCLOSURES
•This report is approved and/or distributed by International Strategy & Investment Group LLC (“ISI Group LLC”), a U.S. licensed broker‐dealer regulated by the Financial Industry Regulatory Authority (“FINRA”) and by International Strategy & Investment Group (UK) Limited (“ISI UK”), which is authorised and regulated in the United Kingdom by the Financial Conduct Authority. ISI Group and ISI UK are subsidiaries of Evercore Partners Inc. and collectively operate under the global marketing brand name Evercore ISI (“Evercore ISI”). The trademarks, logos and service marks shown on this report are registered trademarks of Evercore Partners Inc.
•The analysts and associates responsible for preparing this report receive compensation based on various factors, including the firm’s total revenues, a portion of which is generated by affiliated investment banking transactions Evercore ISI publishes and disseminates research through Evercore ISI and seeks to update its research as appropriate but various regulationsaffiliated investment banking transactions. Evercore ISI publishes and disseminates research through Evercore ISI, and seeks to update its research as appropriate, but various regulations may prevent this from happening in certain instances. Aside from certain industry reports published on a periodic basis, the large majority of reports are published at irregular intervals as appropriate in the analyst’s judgment.
•Evercore ISI generally prohibits analysts, associates and members of their households from maintaining a financial interest in the securities of any company in the analyst’s area of coverage. Any exception to this policy requires specific approval by Evercore ISI Compliance. Such ownership is subject to compliance with applicable regulations and disclosure. Evercore ISI also prohibits analysts, associates and members of their households from serving as an officer, director, advisory board member or employee of any company that the analyst covers.
•Thi t i l d T ti l C ll hi h d ib t t t l t ff ti th bj t th k t ll d hi h i t d t h h t t iThis report may include a Tactical Call, which describes a near‐term event or catalyst affecting the subject company or the market overall and which is expected to have a short‐term price impact on the equity shares of the subject company. This Tactical Call is separate from the analyst’s long‐term recommendation (Buy, Hold or Sell) that reflects a stock’s forward 12‐month expected return), is not a formal rating and may differ from the target prices and recommendations reflected in the analyst’s long‐term view.
•Applicable current disclosures regarding the subject companies covered in this report are available at the offices of Evercore ISI, and can be obtained by writing to ISI Group LLC, Attn. Compliance, 666 Fifth Avenue, 11th Floor, New York, NY 10103.
•Evercore ISI and / or its affiliates, and / or their directors, officers, members and employees, may have, or have had, interests or qualified holdings on issuers mentioned in this report. Evercore ISI and / or its affiliates may have, or have had, business relationships with the companies mentioned in this report..
•Additional information on securities or financial instruments mentioned in this report is available upon request.
•Ratings Definitions
•Current Ratings Definition
21

• Evercore ISI’s recommendations are based on a stock’s total forecasted return over the next 12 months. Total forecasted return is equal to the expected percentage price return plus gross dividend yield. We divide our stocks under coverage into three ratings categories, with the following return guidelines:
• Buy – the total forecasted return is expected to be greater than 10%• Hold – the total forecasted return is expected to be greater than or equal to 0% and less than or equal to 10%• Sell – the total forecasted return is expected to be less than 0%• Suspended – the company rating target price and earnings estimates have been temporarily suspendedSuspended the company rating, target price and earnings estimates have been temporarily suspended.•
Historical Ratings Definitions• Prior to October 10, 2014, ISI Group LLC and ISI UK utilized the following different ratings system, which was based on a 12‐month risk adjusted total return:• Strong Buy ‐ Return > 20%• Buy ‐ Return 10% to 20%• Neutral ‐ Return 0% to 10%• Cautious Return 10% to 0%• Cautious ‐ Return ‐10% to 0%• Sell ‐ Return < ‐10%•
For disclosure purposes, ISI Group LLC and ISI UK ratings were viewed as follows: Strong Buy and Buy equate to Buy, Neutral equates to Hold, and Cautious and Sell equate to Sell.•
On October 31, 2014, Evercore Partners Inc. acquired ISI Group LLC and ISI UK and transferred its research business to ISI Group LLC (the “Evercore Acquisition”). Prior to October 31. 2014, certain research reports were separately produced by Evercore ISI’s affiliate, Evercore Group L.L.C. (“Evercore Group”). Until October 10, 2014, Evercore Group’s recommendations were based on a stock’s expected total return relative to the analyst’s coverage universe over the following 12 months. Stocks under coverage were divided into three categories:p y g g g g
• Overweight – the stock is expected to outperform the average total return of the analyst’s coverage universe over the next 12 months.• Equal‐Weight – the stock is expected to perform in line with the average total return of the analyst’s coverage universe over the next 12 months.• Underweight – the stock is expected to underperform the average total return of the analyst’s coverage universe over the next 12 months.• Suspended – the company rating, target price and earnings estimates have been temporarily suspended.•
For disclosure purposes, Evercore Group’s prior “Overweight,” “Equal‐Weight” and “Underweight” ratings were viewed as “Buy,” “Hold” and “Sell,” respectively.• Evercore ISI ratings distribution (as of 04/15/2015)• As a result of the Evercore Acquisition, ISI Group and ISI UK became affiliated with businesses that provide investment banking• services. The ratings distribution chart below reflects information relating to investment banking services that were provided by an• investment banking entity that may or may not have been affiliated with Evercore ISI at the time the rating was made.•
Coverage Universe Investment Banking Services / Past 12 Months• Ratings Count Pct. Rating Count Pct.
22
Ratings Count Pct. Rating Count Pct.• Buy 294 50% Buy 38 13%• Hold 255 44% Hold 11 4%• Sell 32 5% Sell 1 3%• Suspended 3 1% Suspended 1 33%

• General Disclosures• This report is provided for informational purposes only. It is not to be construed as an offer to buy or sell or a solicitation of an offer to buy or sell any financial instruments or to
participate in any particular trading strategy in any jurisdiction. The information and opinions in this report were prepared by registered employees of Evercore ISI. The information herein is believed by Evercore ISI to be reliable and has been obtained from public sources believed to be reliable, but Evercore ISI makes no representation as to the accuracy or completeness of such information. Opinions, estimates and projections in this report constitute the current judgment of the author as of the date of this report. They do not necessarily reflect the opinions of Evercore and are subject to change without notice. In addition, opinions, estimates and projections in this report may differ from or be contrary to those expressed b h b i f E d i ffili E ISI h bli i d dif d hi h i if d h f i hby other business areas or groups of Evercore and its affiliates. Evercore ISI has no obligation to update, modify or amend this report or to otherwise notify a reader thereof in the event that any matter stated herein, or any opinion, projection, forecast or estimate set forth herein, changes or subsequently becomes inaccurate. Facts and views in Evercore ISI research reports and notes have not been reviewed by, and may not reflect information known to, professionals in other Evercore affiliates or business areas, including investment banking personnel.
•Evercore ISI does not provide individually tailored investment advice in research reports. This report has been prepared without regard to the particular investments and circumstances of the recipient. The financial instruments discussed in this report may not suitable for all investors and investors must make their own investment decisions using their own independent advisors as they believe necessary and based upon their specific financial situations and investment objectives. Securities and other financial instruments discussed in this report, or recommended or offered by Evercore ISI, are not insured by the Federal Deposit Insurance Corporation and are not deposits of or other obligations of any insured depository institution. If a financial instrument is denominated in a currency other than an investor’s currency, a change in exchange rates may adversely affect the price or value of, or the income derived from the financial instrument, and such investor effectively assumes such currency risk. In addition, income from an investment may fluctuate and the price or value of financial instruments described in this report, either directly or indirectly, may rise or fall. Estimates of future performance are based on assumptions that may not be realized. Furthermore, past performance is not necessarily indicative of future performance.
•Evercore ISI salespeople, traders and other professionals may provide oral or written market commentary or trading strategies to our clients that reflect opinions that are contrary to the opinions expressed in this research. Our asset management affiliates and investing businesses may make investment decisions that are inconsistent with the recommendations or views p p g g yexpressed in this research.
• Electronic research is simultaneously available to all clients. This report is provided to Evercore ISI clients and may not be redistributed, retransmitted or disclosed, in whole or in part, or in any form or manner, without the express written consent of Evercore ISI. Receipt and review of this research report constitutes your agreement not to redistribute, retransmit, or disclose to others the contents, opinions, conclusion or information contained in this report (including any investment recommendations, estimates or target prices) without first obtaining express permission from Evercore ISI.
•This report is not intended for distribution to or use by any person or entity in any jurisdiction or country where such distribution or use would be contrary to local law or regulation ForThis report is not intended for distribution to, or use by any person or entity in any jurisdiction or country where such distribution or use would be contrary to local law or regulation. For investors in the UK: In making this report available, Evercore makes no recommendation to buy, sell or otherwise deal in any securities or investments whatsoever and you should neither rely or act upon, directly or indirectly, any of the information contained in this report in respect of any such investment activity. This report is being directed at or distributed to, (a) persons who fall within the definition of Investment Professionals (set out in Article 19(5) of the Financial Services and Markets Act 2000 (Financial Promotion) Order 2005 (the “Order”)); (b) persons falling within the definition of high net worth companies, unincorporated associations, etc. (set out in Article 49(2) of the Order); (c) other persons to whom it may otherwise lawfully be communicated (all such persons together being referred to as “relevant persons”). This report must not be acted on or relied on by persons who are not relevant persons.
23


![Name Title [telephone] [email]@mayerbrown.com](https://static.fdocuments.us/doc/165x107/56816856550346895dde761f/name-title-telephone-emailmayerbrowncom.jpg)

