QUARTERLY COMMENTARY€¦ · GRAPH 1 World sugar price and Illovo share price World sugar price...
26
Q3 30 SEPTEMBER 2009 QUARTERLY COMMENTARY The Balanced Fund celebrates 10 years The cost of too much choice African expansion sweetens the Illovo mix South African banks – not just a bad debt story
Transcript of QUARTERLY COMMENTARY€¦ · GRAPH 1 World sugar price and Illovo share price World sugar price...

Q330 SEPTEMBER 2009
QUARTERLY COMMENTARY
The Balanced Fund celebrates 10 years
The cost of too much choice
African expansion sweetens the Illovo mix
South African banks – not just a bad debt story

INSIDE THIS ISSUECOMMENTS FROM THE CHIEF OPERATING OFFICER Rob Dower
AFRICAN ExPANSION SWEETENS THE ILLOvO MIx Lonwabo Maqubela
SOUTH AFRICAN BANkS - NOT JUST A BAD DEBT STORy Jacques Plaut
THE BALANCED FUND CELEBRATES 10 yEARS Jeanette Marais
THE COST OF TOO MUCH CHOICE Marisa Kaplan
SO MUCH MORE CAN BE ACHIEvED WITH TIME Tracy Hirst
THE BENEFITS AND PITFALLS OF FOREIGN DIvERSIFICATION Chris du Toit
PERFORMANCE
BALANCED FUND QUARTERLy DISCLOSURE AND TOTAL ExPENSE RATIOS
01
02
05
08
11
14
17
The Allan Gray Quarterly Commentary is printed on LumiSilk, a paper made from trees grown specifically for paper manufacturing. The paper is certified by the Forest Stewardship Council (FSC), an organisation which promotes responsible management of the world’s forests.
20
24

Q3 2009 01
As I write, the JSE is more than double its March low
when priced in US dollars. To justify the current stock market
valuation on a PE multiple hovering around 15, with in all
probability some more bad news to come in the earnings
numbers, one has to be pretty optimistic about a return to
the high profit levels which characterised the boom years.
The risk is not just in earnings. The last three swings in South
African equity prices – the peak in July last year, the trough in
October and the recovery since March – have demonstrated
the extent to which short-term movements in our local
capital markets are driven by global rather than local investor
sentiment. Although this sentiment is currently in our favour,
and there is a lot more capital out there that could flow into
SA, it is also extremely fickle. And the current state is not
stable: based on fundamentals, SA share prices expect a strong
recovery. Yet the appetite for emerging market currencies
implies a continuation of low hard currency interest rates
and therefore continued economic weakness. Both of these
cannot easily be true – having either proved wrong would be
bad news for local equities.
Simply put, share prices in South Africa have reached a point
where generally we are finding more opportunities to sell
shares than to buy them. This is reflected in the reduced
equity exposure in our asset allocation portfolios.
Cyclical factors are only one part of the equation
This issue of our Quarterly Commentary includes two articles
that demonstrate why value-based investing requires more
than a simple analysis of the business cycle.
Our first example is Illovo. The world sugar market is
arguably overheated, with sugar currently trading above its
long-term mean of US$10.5c/lb. This favourable commercial
environment is fully reflected in sugar company stock prices,
so you probably would not expect to find a value-based
investor like Allan Gray attracted to a sugar business like
Illovo at this point in the cycle. Lonwabo Maqubela explains
in his article why we believe that Illovo’s African operations
and favourable European market access mean that its current
price is sustainable even if the global price declines, and why
we favour the share despite its recent gains.
The opposite is true of the banking sector, which is
experiencing depressed profits on the back of record-high
bad debts. This would usually make it a good hunting ground
for investors like us, as the market tends to extrapolate the
bad news of today into the future. Jacques Plaut explains why,
despite an expected cyclical improvement in bad debts, we
believe that the outlook for South African bank earnings is
even more negative than the market anticipates.
Balanced Fund’s 10th anniversary
It is difficult not to be proud of the Balanced Fund. It has
done a remarkable job over its history, delivering returns in
line with those of equities but at a much lower level of risk.
Jeanette Marais reminds us of the Allan Gray Balanced Fund’s
investment mandate as it celebrates its 10th anniversary.
Along with the Equity Fund, which began its track record in
1998, the Balanced Fund allowed us to help many thousands
of individual investors who we were not able to serve with
segregated portfolios.
There are eight Allan Gray funds, and including these we
have 43 local funds on our investment platform. This is an
intentionally small selection when set against the 899 funds
available industry-wide. Marisa Kaplan looks at how in the
face of too much choice people often land up making worse
decisions, or suffering from buyer’s remorse – that is, if they
are able to make any choice at all.
I hope you enjoy this issue and look forward to your feedback.
Thank you sincerely for your continued support.
Kind regards
Rob Dower
Comments from the Chief operating offiCer
Rob Dower

Q3 200902
In the Middle Ages, due to its rarity, sugar was considered
a romantic gift, while throughout the 18th century, it is
thought, securing the sugar supply was the cause of many of
the Anglo-French Caribbean wars. Although I dare not suggest
that we all start sharpening our swords, another shortage in
sugar is looming. As a result, the world sugar price is trading
at 22-year highs (see Point A on Graph 1).
World market, from surplus to deficit
In 2008, 166 million (m) tons of sugar were produced globally,
10m tons more than what was consumed. The surplus is
expected to swing into a deficit in the 2009 sugar season,
primarily as a result of substantial production declines in India
and the European Union (EU), which together accounted for
28% of 2008’s global supply.
The 12m ton (38%) decline in Indian production can be blamed
squarely on the rain – or the lack thereof. Indian rainfall this
year is well below average, with the country experiencing its
driest summer in 83 years.
The decline in the EU’s production is one of several structural
changes in the European sugar market, including:
• Exportrestrictions
Due to subsidies and political interventions, the EU has
historically produced sugar well above its consumption
requirements. The surplus of 5-6m tons was effectively
dumped on the world sugar market, depressing the price. In
2006, the World Trade Organisation responded by imposing
an export restriction on the EU. To date, this has resulted in a
4m ton (18%) decline in the EU’s sugar production.
Lonwabo Maqubela
XECUTIVESUMMARY: Despite our concerns about the current heat in the sugar market (with the world sugar price trading
at 22-year highs), we are reluctant to part with our position in Illovo. We observe with interest as Illovo’s management plots
further expansion into Africa. Given the team’s success in that region to date, we are confident that the African operations
will continue to generate attractive returns for shareholders. Lonwabo Maqubela explains.
e
afriCan expansion sweetens the illovo mix
Source: I-Net Bridge
4000
3000
2000
1500
1000
750
500
400
300
200
12.5
15.0
20.0
17.5
25.0
10.0
6.0
4.65.0
8.0
87 908988 91 92 93 94 95 96 97 98 99 00 01 02 03 04 05 06 07 08 09 10
GRAPH 1 World sugar price and Illovo share price
World sugar price Illovo Sugar Limited
Wo
rld
su
gar
pri
ce (
cen
ts U
S$/l
b)
Sug
ar price (cen
ts, ZAR
)
B
A

Q3 2009 03
• Pricereduction
Effective from 2010, the EU will reduce the EU regulated
price by 36%, which is expected to cause even more of the
inefficient European sugar-beet farmers to stop producing.
Global weather patterns are also contributing to the positive
sentiment in the world sugar price. Meteorologists speculate
that there is a high probability that El Niño has returned. El Niño
results in flooding and droughts in regions that are crucial for the
global supply of sugar.
Investing in sugar
The world sugar market is highly volatile. As contrarian
investors, when we observe the positive sentiment and strong
momentum found in the sugar sector today, we become
cautious. The world sugar price is currently trading above its
long-term mean of US$10.5c/lb. In time, the high prices are
likely to result in a significant supply response from the world’s
largest producer, Brazil, as well as India (when conditions
improve). This additional supply will result in a correction of the
world sugar price, which is what happened in 1997 (see Point
B on Graph 1). During this period our clients were well-served
by timely selling of Illovo shares when the world sugar price
was trading above the long-term mean.
However, despite our concerns about the current heat in the
sugar market, we are reluctant, at this stage, to part with our
position in Illovo at current prices for the following reasons:
• Theworld sugarmarket is only18%of Illovo’s volumes
and will become even less important as Illovo’s African
expansions come into fruition.
• 40% of Illovo’s volumes are sold into African markets
(excluding South Africa), which have historically traded
at prices that are at a premium even to the current world
sugar price. Africa imports one-third of its sugar
consumption and is short sugar. Further, logistics for
importing and retailing sugar in many countries are
difficult. These factors allow for pricing power for
producers in Africa. As a result, whereas the world sugar
price may decline, prices in the African markets should
continue to trade at current levels.
• Weestimate20%ofIllovo’svolumeswillbesoldintothe
EU preferential market, at prices that happen to be similar
to the current world sugar price. Unlike the world sugar
price, prices in the EU are fixed and despite the regulated
change next year, have almost no mid-term downside risk.
• Growth potential of Illovo’s African operations
(discussed below).
African expansion
Besides South Africa, Illovo also operates in Zambia,
Malawi, Swaziland, Mozambique, Tanzania and is expanding
into Mali currently.
The ‘African’ operations have grown to 80% of Illovo’s
operating profits (see growth of the red bar in Graph 2).
1600
1400
1200
1000
800
600
400
200
0
GRAPH 2 Contribution to Illovo’s operating profits
2001 2002 2003 2004 2005 2006 2007 2008 2009
Source: Allan Gray research
R m
illio
ns
Rest of Africa South Africa

Q3 200904
Given Illovo’s successes in Africa to date, it is expanding
capacity in its African operations.
Earlier this year, Illovo commissioned a R1.4bn, 200 000 ton
per year expansion in Zambia. In addition, Illovo recently
undertook a R3bn rights issue, in order to fund its expansion
plans. We followed our clients’ rights on their behalf and we
are optimistic about the expansions in the following regions:
• Mali: Greenfield sugar production expansion of
200 000 tons per year
• Mozambique:75 000 ton per year sugar production
expansion
• Swaziland: 80 000 ton per year
sugar production expansion,
including an increase in electricity
generating capacity, which will be
sold into the Swazi national grid
Besides the above-mentioned projects, which
are expected to cost R4bn, Illovo is also
considering further expansion opportunities
of R2.8bn. As alluded to in its prospectus,
the most significant opportunities include
the potential substantial expansion of Illovo’s Malawian
operations and rehabilitation of a 150 000 ton old sugar
estate near Beira, Mozambique.
If all these expansions are successful, we estimate that Illovo’s
production capacity could increase by 1m tons (53%) from
the current 1.8m ton capacity. Given Illovo’s management
team’s successes in its African operations, we are confident
of its ability to execute the expansion plan. Further, post the
rights issue, Illovo will have sufficient cash resources to take
advantage of other attractive expansion opportunities that
may arise.
Why invest in Africa?
In the 2009 financial year, for each ton of sugar produced, the
African operations generated a profit of R1 250, compared
with R320 generated by the South African operations.
We have reason to believe that the African operations will
continue to generate attractive returns for shareholders:
• TheAfricanoperationswill effectively sell no volumes to
the volatile, and at times depressed, world sugar market.
• Theneteffectoftheabove-mentionedEUreformsisthat
the EU will have to import 3m tons of sugar. The EU has
granted Least Developed Countries (LDCs)
unrestricted access to export to the EU,
at fixed prices (which coincidentally
are the same as the current spot world
sugar price). All of Illovo’s operations
outside South Africa qualify for the EU’s
LDC programme.
• As mentioned earlier, we think that
African sugar prices will continue to trade
at levels which are higher than the current
world sugar price.
• Sugar cane requires land, sunlight and
water in order to grow and there is plenty of all three in
Illovo’s African operations. For example, agricultural yields (the
amount of sugar cane grown per hectare of land) in Zambia
are close to double South Africa’s. As a result, the African
operations’ costs are among the lowest in the world.
Readers of our recent investment commentary will know that
we think that the FTSE/JSE All Share Index (ALSI)’s levels of
earnings are high. We are optimistic that Illovo’s earnings
should grow faster than the ALSI’s. While the share price is up
significantly, we believe that it is still not reflecting adequately
the potential value in Illovo’s African operations.
“Sugar cane requires land, sunlight and water in order to grow and there is plenty of each in Illovo’s African
operations.”

Q3 2009 05
When it comes to valuing banks, bad debts are grabbing the
headlines. This is understandable: in 2008 the big four South
African banks reported that a total of R30bn in loans had gone
bad. This is no small sum, compared with the banking profit
pool of R40bn, and larger than the total amount that went
bad in the three years from 2004 to 2006. This year will be
worse still. (Note that all amounts and percentage increases in
this article have been adjusted for the effects of inflation).
Bad debts are cyclical. Currently, they are at record highs,
and we are confident that the long-term average bad debt
charge will be lower than it is today (see Graph 1). However,
we think the future benefits of a lower bad debt charge will
probably be offset by other factors, such as:
• Ashrinkingbaseof‘lazydeposits’andlowerreturnson
these funds because of lower interest rates
• Lowgrowthinadvancesforsometime
• Comparedwiththelasttwodecades,muchless
opportunity to improve operational productivity and cut
costs, and upward pressure on costs per rand of assets as
average loan sizes fall
• Lowertradingincome
Deposits and the endowment effect
It has often been said that a bank’s most valuable asset is its
base of lazy deposits. A hundred years ago, when banks were
allowed to fail, the business used to be entirely about attracting
deposits. Banks competed to be the most conservative –
only lending depositors’ money to municipalities, large
corporations and governments, and never accepting illiquid
assets such as real estate or cars as collateral. The economics
of lazy deposits are simple: take the R100 that customer X
carelessly leaves in his 0.5% savings account, lend it to
customer Y at prime, and pocket the difference.
JacquesPlaut
XECUTIVE SUMMARY: Record-high bad debts are currently weighing on the banking sector. Typically, an industry
experiencing depressed profits due to cyclical factors is a good hunting ground for bargains, as the market tends to
extrapolate the bad news of today into the distant future. However, we have reservations about the banks – we think the
future benefits of a lower bad debt charge will probably be offset by other factors. Jacques Plaut elaborates.
e
south afriCan banks – not just a bad debt story
45
40
35
30
25
20
15
10
5
0
GRAPH 1 Bad debts, big four banks
2003 2004 2005 2006 2007 2008 2009 forecast Historical average
Source: Company reports
R b
illio
ns

Q3 200906
In 2008 lazy deposits were even more profitable than
usual, because interest rates were so high: banks could lend
out their ‘free’ money at a comparatively high rate (see
Graph 2) to comparatively low risk customers. In 2009 and
beyond, this ’endowment’ will be considerably less generous,
and we expect profits to be impacted negatively.
Not only will banks earn less on their
lazy deposits going forward, but over
time we expect there will be fewer lazy
deposits to lend out. For at least a decade,
customers have become increasingly
conscientious about where they leave their
money, with new savings vehicles, such as
money market funds, offering convenient
alternatives to no-interest bank accounts.
We expect this trend to continue over the long term. Banks
will thus have fewer lazy deposits as a proportion of assets
in future.
Advances growth
From 1966 to 2000, banks grew their loan books at a rate of
5%. The growth accelerated to 9% in the past decade, and
to 12% over the past five years. This was possible thanks to
large house price increases, deposits on home loans going
from 20% to 0%, and an increase in the general appetite
for debt.
These factors have started to reverse, and we think loan
growth will be low for several years as a result. In the UK, after
the recession and housing slump in the early 90s, Barclays saw
its loan book shrink by 17%, with management citing weak
demand for loans as one of the reasons.
This happened three years after UK house
prices started to fall, which means we
could still see something similar playing
out in South Africa.
Costs
Banks have become a lot more efficient
in the past 20 years. In 1988, each Standard Bank employee
was responsible for administering, on average, R4m worth
of loans. Today the number (net of inflation adjustment) is
R13m – and the story is much the same for the other banks.
We suspect that technology has played a part in improving
the loan-to-employee ratio: in 1988 there was no internet
banking, retailers had no point-of-sale machines, and bank
employees spent their time processing cheques. Today much
of this work is done by computer, which means employees are
free to do more productive things.
Source: I-Net Bridge
12
13
11
10
9
8
7
6
Jan
2006
Mar
200
6
May
200
6
Jul 2
006
Sep
2006
Nov
200
6
Jan
2007
Mar
200
7
May
200
7
Jul 2
007
Sep
2007
Nov
200
7
Jan
2008
Mar
200
8
May
200
8
Jul 2
008
Sep
2008
Nov
200
8
Jan
2009
Mar
200
9
May
200
9
Jul 2
009
Sep
2009
Nov
200
9GRAPH 2 Three month inter-bank lending rate
Annual averages
“It has often been said that a bank’s
most valuable asset is its base of lazy
deposits.”
2006
2007
2008
2009

Q3 2009 07
But banks are also more efficient today because house prices
and corporate profits have doubled since 1988. We expect this
means that the average loan size has also doubled, helping
the banks. Lower corporate profits and house prices going
forward will put pressure on the average loan size and hence
the loan-per-employee ratio. We also expect that a retail
bank where 10% of customers are not paying their loans –
compared with a long-term average closer to 3% – will be
more expensive to run per rand of assets, pushing up costs in
the medium term.
Trading income
One of the things we like about banks is that they are able
to generate revenue almost everywhere that money is
flowing. For example, when a corporation wants to move
money offshore, or hedge its exposure to the copper price,
it does so through a bank. As a rule of thumb, the more
volatile the price of the commodity or currency, the more
profit the bank makes on the transaction. In 2008, volatilities
across all traded instruments were at record highs, and
banks made record trading profits. We expect this number to
be lower in the future as the level of volatility returns to its
long-term average (see Graph 3).
Even if one believes in an imminent recovery in bad debts,
there are other reasons why banking profits will be under
pressure in the future. But then, the recovery might not be so
imminent. The evidence about where we are in the bad debt
cycle is mixed. And bad debts have a tendency to go higher
than people expect.
80
70
60
50
30
40
20
10
0
GRAPH 3 Chicago Board Options Exchange Volatility Index
1997 1998 1999 2000 2001 2002 2003 2004 2005 2006 2007 2008 2009
Source: Bloomberg
Annual averages

Q3 200908
The Allan Gray Balanced Fund proudly celebrates its
10-year anniversary this month, having achieved an annualised
return of 21.8% since its inception on 1 October 1999. This
means that an investment of R10 000 on 1 October 1999
at the opening unit price of R10 would have grown to
R71 598 after fees and with distributions re-invested at the
closing price of R49.19 on 30 September 2009. As shown in
Graph 1 on page 9, the average fund in its sector (Domestic
Prudential – Variable Equity) achieved an annualised return
of 16.1% over the same period, with a R10 000 investment
growing to R44 579. The same investment in the FTSE/JSE
All Share Index (ALSI) would have achieved
an annualised return of 17.7%, growing
to R50 819 (before fees but with dividends
re-invested).
Why a balanced fund may be the right
investment choice for you
If you are looking to diversify your
investment portfolio, you are probably
aware that you should include a spread
of assets such as cash, shares, offshore
investments, property and bonds. But what
percentage of each would work best to deliver returns? And
will you know exactly the right time to ease out of equities
and increase, for example, your cash component? Allocation
between different classes of assets in an investment portfolio
can be very challenging. A better bet for many investors who
wish to invest in a range of asset classes, and are happy to
delegate their asset allocation decisions, may be to invest in
a balanced fund.
Balanced funds, like equity funds, have the capacity to
create wealth over time and not just to preserve wealth.
But they are not as high risk as equity-only funds, as their
broader investment mandate allows other asset classes to
be included in the portfolio, enabling the portfolio managers
to reduce volatility. The Allan Gray Balanced Fund is limited
to a maximum equity exposure of 75%, and although it has
never had less than 48% exposure to equities, its mandate
allows it to have no exposure to equities at all. Although pure
equity mandates should produce higher returns over the long
term, the Allan Gray Balanced Fund has outperformed the
Domestic General Equity Sector over its full history, but with
considerably lower volatility and risk.
Approaches to asset allocation
There are two different schools of thought
when it comes to asset allocation – managers
either use a top-down, or bottom-up
philosophy. The top-down school of thought
starts with a macro view of the economy.
Economists forecast views on the economy,
sectors, currencies and interest rates. Then
they make a call on which sectors should be
overweight or underweight the ALSI. From
there analysts seek out appropriate shares.
The bottom-up school of thought manages investments the
opposite way around – and this is the school of thought
we subscribe to. It is our experience that understanding
companies, and investing in them when their fundamental
value is less than their market value, is more rewarding than
trying to predict economic, political or share-market trends.
Fundamental value is the value a prudent businessman
would place on a business. This involves detailed analysis of
the business, its income, expenses, outlook and positioning
within its industry. Our research results in portfolio manager
JeanetteMarais
XECUTIVESUMMARY: On 1 October 2009 Allan Gray celebrated the 10-year anniversary of the Balanced Fund. Excluding
the money market funds, at just over R29bn it is now the largest single unit trust in any South African sector. Jeanette
Marais reminds us how the Fund’s broad investment mandate allows the portfolio managers to reduce the volatility of the
portfolio over the medium to long term, making the Balanced Fund a popular choice for retirement products.
e
the balanCed fund Celebrates 10 years
“Excluding the money market funds, at just over R29bn, [the Balanced Fund] is now the largest single unit trust in any South African
sector.”

Q3 2009 09
decisions to hold individual companies, or to keep funds in
bonds, property or cash. And the sum of all of these individual,
bottom-up investment decisions is the asset allocation of the
Fund. Our company research – including many conversations
with senior management – also ultimately gives us a rounded
view of the state of the economy, which we can use as a check
on the bottom-up allocation.
The Balanced Fund’s asset allocation varies over time
Graph 2, on page 10, shows how the Fund’s asset allocation
has changed over the years. By examining the asset allocation
over the last year, you can see how we have responded to the
global financial crisis. Between January 2007 and September
2008 the Fund reduced equity exposure, taking advantage
of the strong performance of the ALSI. The Fund used stock
market hedging to achieve this. This trend continued until
October 2008, a month characterised by extreme volatility in
asset prices as investors tried to adjust to the concept of a
world recession. During this month, the Fund took advantage
of the weakness in the equity market to close out its hedge
against stock market declines. This had the effect of increasing
the net equity exposure of the Fund.
Under normal circumstances we would reduce exposure to
shares by selling shares, not by stock market hedging. However
in the middle of 2008 we were faced with the unusual
combination of A: very demanding valuations in many of the
largest shares in the ALSI, and B: relatively attractive prices in
the defensive shares that we held. Keen to take advantage of
this valuation difference, yet pessimistic about the market as
a whole, our portfolio managers unusually decided to reduce
exposure through hedging.
Many of you will be aware that for some time now we have
used our full offshore exposure limit. On average, South
Africans spend about 40% of their income on imported
goods, but legal restrictions limit us to a maximum 20%
offshore exposure. We are currently taking full advantage of
this holding through the Orbis funds and foreign shares that
are inward listed (classified as foreign but listed on the JSE,
such as Mondi and British American Tobacco).
The Balanced Fund showcases our best ideas
Regular readers of our investment commentary will know
that we generally do not broadcast a ‘house view’ and we
shy away from making economic predictions. However, those
curious about our view of the world need not look much
further than the Balanced Fund’s asset allocation to get
a few clues. For example, keeping an eye on the Fund’s
allocation to local shares relative to a neutral point of about
R100 000
R80 000
R40 000
R20 000
R10 000
GRAPH 1 Value of R10 000 invested on 1 October 1999 to 30 September 2009
1999 2000 2001 2002 2003 2004 2005 2006 2007 2008 2009
Source: Allan Gray research, MoneyMate
Allan Gray Balanced Fund
Domestic Prudential - Variable Equity sector average
Allan Gray Equity Fund
FTSE/JSE All Share Index
Inflation

Q3 200910
60% will tell you when we find South African equities
attractive, and when we do not.
Note that when there is not a significant difference in the
value of the different asset classes, the Balanced Fund will
tend to be overweight in equities, as this asset class allows us
to add more value to the portfolio. (More detail on the Fund’s
quarterly disclosures can be found on page 24 of the QC).
Recently, the Fund has been steadily reducing its net equity
exposure after the rapid rebound of global stock markets
off their lows. The Fund’s net equity exposure is currently
down to 63.2% and its net exposure to SA equities is down
to 50.6%.
Conclusion
More confident investors may decide to do their own
asset allocation. You can do this by choosing individual
building blocks – a bond fund, an equity fund, etc. – in
varying proportions, depending on how you view the overall
market. A balanced fund can do this for you, but with more
peace of mind.
Source: Allan Gray research, I-Net Bridge
GRAPH 2 Allan Gray Balanced Fund asset allocation as at 30 September 2009
Oct
199
9
Jan
2000
Apr
200
0
Jul 2
000
Oct
200
0
Jan
2001
Apr
200
1
Jul 2
001
Oct
200
1
Jan
2002
Apr
200
2
Jul 2
002
Oct
200
2
Jan
2003
Apr
200
3
Jul 2
003
Oct
200
3
Jan
2004
Apr
200
4
Jul 2
004
Oct
200
4
Jan
2005
Apr
200
5
Jul 2
005
Oct
200
5
Jan
2006
Apr
200
6
Jul 2
006
Oct
200
6
Jan
2007
Apr
200
7
Jul 2
007
Oct
200
7
Jan
2008
Apr
200
8
Jul 2
008
Oct
200
8
Jan
2009
Apr
200
9
Jul 2
009
Sep
2009
35 000
20 000
25 000
30 000
15 000
10 000
5 000
0
100
40
60
80
20
0
Ass
et a
lloca
tio
n (
%)
FTSE
/JSE
All
Shar
e In
dex
SA Listed Equities Foreign Shares - Inward Listings Orbis Equity Hedged Equities
Orbis Optimal Listed Property Commodities Bonds
Foreign Cash Cash FTSE/JSE All Share Index

Q3 2009 11
‘When you have to make a choice and do not make it, that in
itself is a choice.’ (William James, US philosopher)
‘Life is a sum of all your choices.’ (Albert Camus, French novelist)
Over the last 10 years the unit trust industry in South Africa has
enjoyed substantial growth both in assets under management
and in the number of funds available. At the end of June
1999, the industry managed R96 billion in assets and had a
total of 225 funds. By the end of June this year, investors could
choose from a staggering total of 899 funds, and assets under
management totalled R703 billion. To put this in context, our
stock market consists only of some 370 shares.
But has this dramatic increase in choice benefited investors?
On the surface, most people are attracted to choice, with
more options being more enticing than a limited selection.
However, research has shown that, in the face of too much
choice, people may:
• Suffer from ‘analysis paralysis’ preventing them from
making any decisions at all
• Makeworsedecisions
• Endupsufferingfrombuyer’sremorse
Analysis paralysis
Evaluating and comparing options takes time and brain
power. The more choices that are available, the more likely
it is that people will delay, or even ultimately avoid, making
a decision.
The findings of an experiment involving jam purchasing
behaviour illustrate this tendency. Grocery store shoppers
were given the opportunity to taste-test jam. Some shoppers
encountered a display of six varieties, while others encountered
24 varieties. A greater percentage of shoppers were attracted
to the larger display, but they were 10 times less likely to
purchase jam after the tasting than those who tasted from
the smaller display (3% versus 30%).1
With important purchases, people may intend to consider their
options carefully when they have the time to do so. However,
in today’s busy world, that day may never come.
For investments, a delayed decision either results in lost returns
or yield while funds languish in low-interest bank accounts or,
potentially more damagingly, in unintentional risk of capital
loss while remaining invested at the peak of a bull market.
MarisaKaplan
XECUTIVESUMMARY: People are attracted to choice, but that does not mean that having more choice will lead to better
decisions, or a better decision-making process. Research has shown that, in the face of too much choice, people often land
up making worse decisions, or suffering from buyer’s remorse – that is, if they are able to make any choice at all, with many
suffering from ‘analysis paralysis’. Marisa Kaplan elaborates.
e
the Cost of too muCh ChoiCe
Case study: Participation rates in retirement savings plans are at their highest when fewer funds are offered.
One study looked at a sample of almost 900 000 employees across 69 industries – all clients of US investment management company the Vanguard Group.
The findings indicated that employees who were offered retirement savings plans with more investment fund options were less likely to participate in the plans. Participation rates were highest (75%) for plans with only two funds offered and lowest (60%) for plans with the maximum of 69 funds offered. For every 10 additional funds offered, there was an associated decrease of 2% in the participation rate.
Source: Research by Sheena Iyengar, Wei Jiang, and Gur Huberman (2003)
Q3 200912
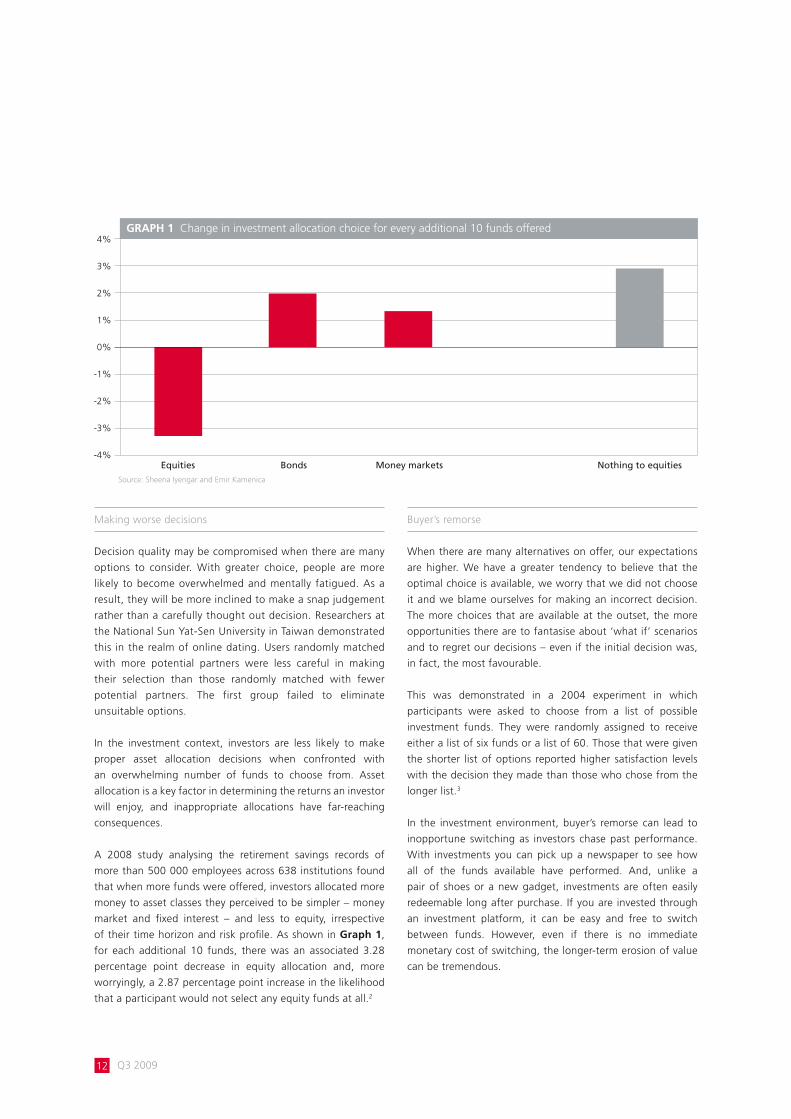
Making worse decisions
Decision quality may be compromised when there are many
options to consider. With greater choice, people are more
likely to become overwhelmed and mentally fatigued. As a
result, they will be more inclined to make a snap judgement
rather than a carefully thought out decision. Researchers at
the National Sun Yat-Sen University in Taiwan demonstrated
this in the realm of online dating. Users randomly matched
with more potential partners were less careful in making
their selection than those randomly matched with fewer
potential partners. The first group failed to eliminate
unsuitable options.
In the investment context, investors are less likely to make
proper asset allocation decisions when confronted with
an overwhelming number of funds to choose from. Asset
allocation is a key factor in determining the returns an investor
will enjoy, and inappropriate allocations have far-reaching
consequences.
A 2008 study analysing the retirement savings records of
more than 500 000 employees across 638 institutions found
that when more funds were offered, investors allocated more
money to asset classes they perceived to be simpler – money
market and fixed interest – and less to equity, irrespective
of their time horizon and risk profile. As shown in Graph 1,
for each additional 10 funds, there was an associated 3.28
percentage point decrease in equity allocation and, more
worryingly, a 2.87 percentage point increase in the likelihood
that a participant would not select any equity funds at all.2
Buyer’s remorse
When there are many alternatives on offer, our expectations
are higher. We have a greater tendency to believe that the
optimal choice is available, we worry that we did not choose
it and we blame ourselves for making an incorrect decision.
The more choices that are available at the outset, the more
opportunities there are to fantasise about ‘what if’ scenarios
and to regret our decisions – even if the initial decision was,
in fact, the most favourable.
This was demonstrated in a 2004 experiment in which
participants were asked to choose from a list of possible
investment funds. They were randomly assigned to receive
either a list of six funds or a list of 60. Those that were given
the shorter list of options reported higher satisfaction levels
with the decision they made than those who chose from the
longer list.3
In the investment environment, buyer’s remorse can lead to
inopportune switching as investors chase past performance.
With investments you can pick up a newspaper to see how
all of the funds available have performed. And, unlike a
pair of shoes or a new gadget, investments are often easily
redeemable long after purchase. If you are invested through
an investment platform, it can be easy and free to switch
between funds. However, even if there is no immediate
monetary cost of switching, the longer-term erosion of value
can be tremendous.
4%
3%
2%
1%
-3%
-2%
-1%
0%
-4%
GRAPH 1 Change in investment allocation choice for every additional 10 funds offered
Source: Sheena Iyengar and Emir Kamenica
Equities Bonds Money markets Nothing to equities

Q3 2009 13
Allan Gray offers a limited selection of funds
Our research has shown that, while our investors and advisers want choice, they prefer it to be limited. Allan Gray Unit Trust Management Limited, despite being the second largest unit trust company in South Africa, offers only eight funds. And we do not offer more than one fund in the same category.
On the Allan Gray investment platform, where you can choose from other fund managers in addition to Allan Gray, we currently offer 43 local funds including our own. On our offshore investment platform we offer 30 funds, including the Orbis funds. We do not intend to expand this offering significantly in the future – our overall aim is to ensure the choice is adequate and manageable.
We offer only funds which: • Have been registered by the Financial Services Board (FSB), local and offshore• Have a minimum fund size for liquidity purposes
We try to offer more choice where there is potential for differences in fund performance. This means we offer fewer fixed income funds than equity funds, and aim for a good spread across the asset classes. We also steer away from specialist/sector specific funds as they move in and out of favour.
To make space for new funds, we ‘cap’ the funds that have not received significant flows over at least a two-year period. When we ‘cap’ a fund we keep it open for existing investors, but we take it off the ‘buy list’ for new investors. Sometimes we will ask investors to switch out of a fund, but only if very few people remain invested.
When it comes to investments, if you have little knowledge of the sector, having less choice does not mean that you will make the right decision. If you are not comfortable making your own investment decisions, or do not have the time to do so, we recommend that you engage the services of an independent financial adviser.
By chasing recent winners, investors make decisions by looking
in the rear-view mirror and engage in a systematic process
of buying high and selling low. The ensuing performance
gap can be wide. Investors do not always stay invested long
enough to enjoy the benefits of an asset manager’s investment
approach, so their investments do not always perform as well
as the funds in which they have invested.4
Does more choice mean better decisions?
Moderation is the best strategy for many things in life,
including choice. Too little choice is stifling; but too much
choice is confusing and, ultimately, counter-productive –
particularly when it comes to investments. People are attracted
to choice, but that does not mean that having more choice will
lead to better decisions, or a better decision-making process.
1. Research by Sheena Iyengar and Mark Lepper (2000) 2. Research by Sheena Iyengar and Emir Kamenica (2008)3. Research by Julie Agnew and Lisa Szykman (2004) 4. Jonathan Brodie and Trevor Black covered this subject in some detail in the previous issue of the Quarterly Commentary in their piece ‘Turmoil reigns in the markets. What should I do next?’. (You can also read this piece on our website, www.allangray.co.za under the ‘Latest news’ tab.)
Other interesting reading includes:Academic articles by Sheena Iyengar, the author of some of the case studies discussed (see http://www.columbia.edu/~ss957/publications.shtml).
A non-academic book by Barry Schwartz – ‘The Paradox of Choice’.

Q3 200914
TracyHirst
James Dean did not live for very long, but he lived his short
life to the full. Imagine what a life it could have been if he had
lived for longer. A fictional version of Dean’s life as it might
have been is the subject of our latest television advertisement
with the campaign line ‘Given more time, imagine the
possibilities’. The message reinforces an important aspect of
our investment philosophy: time is an essential ingredient in
the recipe to create wealth. None of what we do at Allan
Gray is of any good if investors do not give us their time.
‘Legend’
The commercial opens (year 2009) with
an elderly man in his late 70s on his stud
farm; he is surrounded by a loving family.
It is a peaceful and happy scene. A few
years earlier, at a younger age, he is seen
racing cars; receiving a lifetime achievement
award; still younger, doing humanitarian
work; directing a movie; swamped by
paparazzi and fans; walking through New
York... all the time getting progressively more youthful.
Clearly a life in reverse taking us all the way back to 1955.
Throughout the commercial there is a feeling of familiarity
about this man, but perhaps viewers cannot quite put their
finger on it. Ultimately, we come to a point where the lead
character is aged 24, we see him driving along a road in a
silver Porsche Spyder. A car coming towards him in the other
lane turns in front of him, cutting him off. There is almost a
head-on collision, but the driver just manages to pull to the
side and, in a storm of dust, avoids the collision. By this point
most viewers will have realised that we have been following
the life of James Dean (who was in fact tragically killed in this
car accident).
The team at our advertising agency King James spent an
enormous amount of time researching and preparing for
the advert. Although it is short, the film aims to be an
earnest representation of what might have
been James Dean’s life after 1955. Some
narrative clues are provided through the
journey to aid recognition and to give the
advert longevity and mystique.
An illustration of the benefits of time
The new advert is an extension of a theme
we began in 2008. As an illustration of the benefits of
time, last year we launched a magazine campaign which
told the stories of the full and inspirational lives of Joan of
Arc, Nkosi Johnson and Wolfgang Mozart that were sadly
cut short. All three of them, just like our newly launched
television commercial persona, became household names
XECUTIVESUMMARY: We recently launched new television, print and airport advertising that reinforces the importance
of time in building wealth. The television advert picks up on a theme we have been running for some time in magazines,
where we use examples of famous people who have died young, and ask our audience to imagine what they could have
achieved if they had been given more time.
e
so muCh more Can be aChieved with time
“We try to use advertising to deepen
understanding, not just to build
awareness.”

Q3 2009 15
in their respective times. In the print adverts the reader is
left to ponder the same thought ‘Given more time, imagine
the possibilities’. There is no suggestion given as to what
more history may have written about these people, had they
lived long lives. In the launch of the TV advert ‘Legend’ we
continue to explore this territory by taking the analogy a step
further. We offer a fictional account of a long and successful
life as it may have been lived by James Dean.
The 2009 commercial takes the approach of not focusing
on Allan Gray, but on the investor as an integral part of
our investment philosophy. Our chief investment officer Ian
Liddle refers to this, the relationship between client and asset
manager, as an ‘investment partnership’. Richard Carter,
head of product development, wrote an article in QC3,
2008 entitled ‘What you can do to improve your investment
returns’. The piece focuses on the gap between fund returns
and investor returns i.e. the value that is destroyed in the
absence of time.
Magazine and newspaper advertising
We are also proud of our three new magazine adverts,
which take stories of long-term thinking and relate them
to memories from our childhoods. Remember taking karate
lessons? Remember finding sea monkeys in the back of
comic books? Ever watched a group of under-7s playing
a soccer match? Each of these adverts tells the story of
the patience and planning that we believe is required to
invest successfully.
In newspapers we have kept with the previous forthright
approach, with a series of investment insights that have
simply been given a fresh but perhaps a more bold and
courageous look.
Airport advertising
We have launched a new campaign that you may have seen
if you have been travelling through OR Tambo or frequenting
Cape Town airport. The messages here are the mirror image
of the new television advert. They address the impact of
time from the beginning of a life, with anticipation, rather
than from the end of it. The varying executions show young
children who are displaying a talent early: a toddler learning
the piano, a three-year old the guitar, a budding tennis star
and a six-year old golfer. After all, any parent of an aspiring
superstar will tell you that the best investments take time and
the earlier you start the better.
We welcome your opinion
We know that advertising is subjective, but we hope that
with the new campaigns we have managed to tap into
human truths about investing that connect us to our clients,
in different ways from any of our previous campaigns. We are
always interested in hearing your thoughts and feedback.
The evolution continues We try to use advertising to deepen understanding, not just to build awareness. ‘Long-term investing’, our new pay-off line visible on all of our
advertising, is at the heart of Allan Gray as a company, its culture and its brand. This message is aimed at highlighting and reinforcing a key aspect
of the Allan Gray investment philosophy. Our past commercials highlight similar important aspects of our approach:
2003: Single-minded is good
2004: Commitment is rare
2005: Human beings are ruled by emotions; investment decisions should not be
2006: Few things last as long as our track record
2007: While others chase instant wealth, we have learnt that patience is handsomely rewarded
2008: First look for potential, then have patience to wait for it
2009: Time is an essential ingredient in the recipe to create wealth

Q3 2009 17
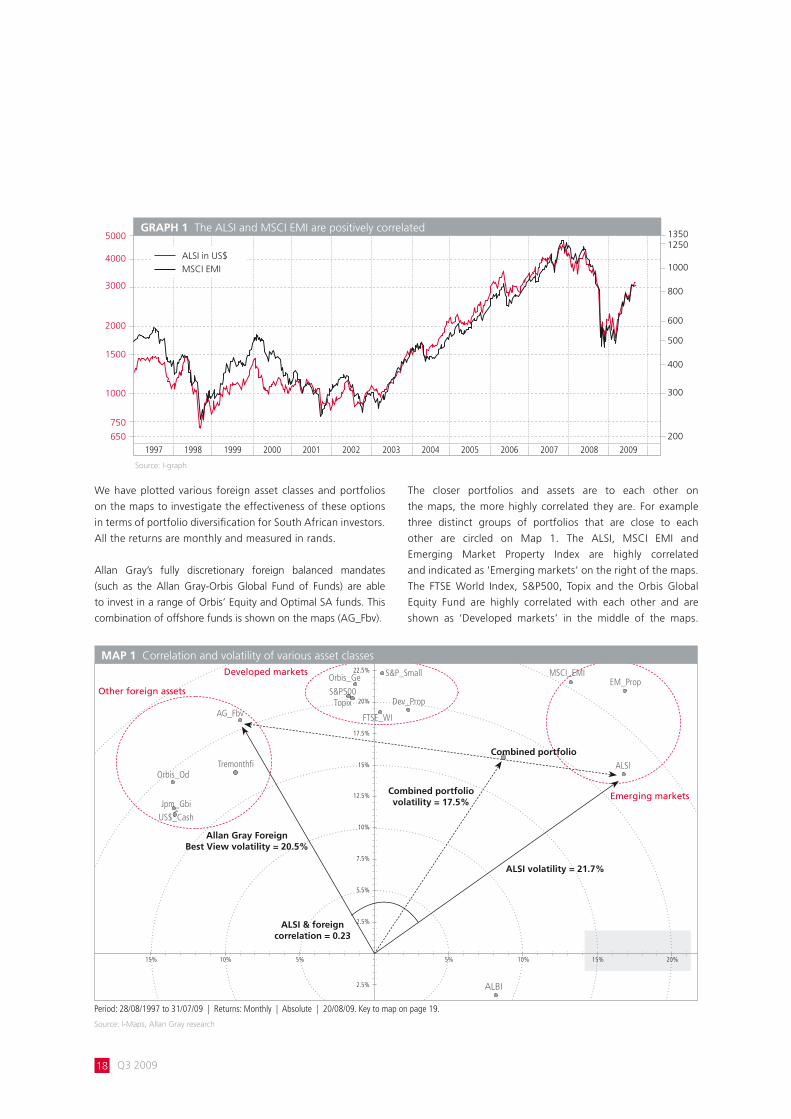
South Africa is a relatively small, open economy. Our stock
market consists of some 370 companies and makes up just
over 1% of the world’s total listed equity universe by market
capitalisation. For South African investors, offshore assets are
a natural option when looking to build a diversified portfolio.
Shares of companies that operate in different industries and
different parts of the world should behave differently. Business
and economic cycles favour different companies at any given
point in time, and therefore investing in
those different companies should yield
different (unrelated) returns over time.
Correlation and volatility
According to the text books, a diversified
portfolio of assets should produce returns
at lower levels of volatility over the long term. The concepts
of correlation and volatility are central to portfolio
diversification. Correlation measures the strength of the
relationship between two assets’ returns. A positive correlation
indicates a strong positive relationship, i.e. the two assets tend
to have higher and lower returns at the same time. A negative
correlation implies the opposite, i.e. the two assets’ returns
move in opposite directions at any given time. A correlation
of zero implies that no relationship (positive or negative)
exists between the returns of the two assets.
A portfolio consisting of assets that are all positively correlated
with each other is not diversified. An undiversified portfolio is
not a problem if all the assets are performing well, but it is a
problem if all the assets are performing poorly.
By adding assets with zero, or negative correlation, a portfolio
becomes more diversified. We measure the effectiveness of
diversification by the extent to which the portfolio’s overall
volatility, or deviation of its returns, is reduced. Intuitively,
a portfolio consisting of correlated assets will show larger
deviations in its overall returns (a high volatility), and a
portfolio consisting of uncorrelated assets should show
smaller deviations in its overall returns.
How different are the assets that you are investing in?
As indicated in previous commentary, the
returns of South African shares are highly
correlated with broader emerging markets,
partly due to the behaviour of global
investors who treat all emerging markets
as a single asset class. In Graph 1 on page
18 note how closely the performance of
the FTSE/JSE All Share Index (ALSI) and the
Morgan Stanley Capital International (MSCI) Emerging Market
Index (EMI) (measured in US dollars) follow each other.
A map of past correlation and volatility
The I-Maps Visual Portfolio Positioning system provides us
with a useful tool to look at past correlation and volatility in
the context of offshore assets (see Map 1 on page 18 and
Map 2 on page 19). The positions of the portfolios on the
maps are determined by two factors:
1. The volatility of each portfolio is indicated by its distance
from the centre of the map. Portfolios with a high volatility
are further away from the centre.
2. The angle between two portfolios from the centre measures
the correlation between them. A smaller angle (in other
words portfolios that are closer together) implies a strong
positive correlation. A larger angle (portfolios far apart)
implies lower correlation.
ChrisduToit
XECUTIVESUMMARY: Most South African investors looking to diversify will choose to include offshore assets in their
portfolio. The trick is to select the right combination of foreign assets and asset managers, in order to produce the desired
result i.e. diversification without sacrificing long-term performance. The concepts of volatility and correlation play a central
role in understanding the benefits and pitfalls of diversifying by investing offshore. Chris du Toit explains.
e
the benefits and pitfalls of foreign diversifiCation
“..., we would favour a maximum exposure
to foreign assets.”
Q3 200918
We have plotted various foreign asset classes and portfolios
on the maps to investigate the effectiveness of these options
in terms of portfolio diversification for South African investors.
All the returns are monthly and measured in rands.
Allan Gray’s fully discretionary foreign balanced mandates
(such as the Allan Gray-Orbis Global Fund of Funds) are able
to invest in a range of Orbis’ Equity and Optimal SA funds. This
combination of offshore funds is shown on the maps (AG_Fbv).
The closer portfolios and assets are to each other on
the maps, the more highly correlated they are. For example
three distinct groups of portfolios that are close to each
other are circled on Map 1. The ALSI, MSCI EMI and
Emerging Market Property Index are highly correlated
and indicated as ‘Emerging markets’ on the right of the maps.
The FTSE World Index, S&P500, Topix and the Orbis Global
Equity Fund are highly correlated with each other and are
shown as ‘Developed markets’ in the middle of the maps.
Source: I-graph
13501250
1000
800
600
500
400
300
200
2000
3000
1000
750
5000
4000
1500
650
1997 1998 1999 2000 2001 2002 2003 2004 2005 2006 2007 2008 2009
GRAPH 1 The ALSI and MSCI EMI are positively correlated
2.5%
2.5%
5.5%
7.5%
10%
12.5%
15%
17.5%
20%
22.5%
5%5%10%15% 10% 15% 20%
ALBI
EM_PropMSCI_EMI
ALSI
AG_Fbv
Orbis_OdTremonthfi
Jpm_GbiUS$_Cash
S&P_Small
Dev_Prop
FTSE_WI
S&P500Topix
Orbis_Ge ••
•
••
•
•
••
••
•
••
•
•
ALSI & foreign correlation = 0.23
ALSI volatility = 21.7%
Allan Gray Foreign Best View volatility = 20.5%
Combined portfolio volatility = 17.5%
Combined portfolio
other foreign assets
Developed markets
Emerging markets
MAP 1 Correlation and volatility of various asset classes
Period: 28/08/1997 to 31/07/09 | Returns: Monthly | Absolute | 20/08/09. Key to map on page 19.
Source: I-Maps, Allan Gray research
ALSI in US$
MSCI EMI

Q3 2009 19
The developed markets’ portfolios are reasonably uncorrelated
with the emerging market portfolios. On the far left we group
the ‘Other foreign assets’ being US$ cash, global bonds,
hedge funds, the Orbis Optimal US$ Strategy and Allan Gray’s
Foreign Best View portfolio (a specialist balanced portfolio for
institutional investors). The other foreign asset portfolios are
highly uncorrelated to the emerging market group.
A useful feature of these maps is the ability to combine different
assets into one portfolio. For example, Map 1 combines the
ALSI and Allan Gray’s Foreign Best View to form a portfolio of
South African and foreign assets (Combined portfolio). Adding
this mix of (low correlation) Orbis Funds to South African shares
has meaningfully reduced the overall volatility of the portfolio
to 17.5%, as shown by the dotted arrow in the maps, versus
20.5% for the Foreign Best View and 21.7% for the ALSI.
Because emerging markets and equities are highly correlated
to the ALSI, adding the two together produces a portfolio with
higher volatility than the ALSI (see Map 2). This illustrates the
importance of investing in uncorrelated foreign assets if and
when you are looking to diversify your overall portfolio.
During the second half of 2008 and into early 2009 the
global credit crisis caused a massive sell-off in all asset classes.
We were reminded again that the past is not a guarantee
of the future, as the correlation between all equity markets
rose to levels way above historical norms. During such
periods of high correlation the benefits of diversification
can indeed disappear. Reassuringly, Allan Gray’s Foreign
Best View portfolio and Orbis’ Optimal funds maintained
their very low correlation with South African assets during
this crisis.
South Africa, along with all emerging markets, has
outperformed world markets meaningfully over the last 10
years. The ALSI has returned 13.7% per year in US dollars but
world markets have returned only 1.3% per year. Allan Gray’s
Foreign Best View portfolio has returned 12.8% in US dollars.
Clearly, a diversified portfolio (i.e. including foreign) is likely
to have underperformed a potentially less diversified local-
only portfolio. However, given current valuations of shares in
South Africa compared with those outside South Africa, we
would favour a maximum exposure to foreign assets.
The trick is to select the right combination of foreign assets
and asset managers, in order to produce the desired result i.e.
diversification without sacrificing long-term performance.
Period: 28/08/1997 to 31/07/09 | Returns: Monthly | Absolute | 20/08/09
Source: I-Maps, Allan Gray research
key to i-map portfolios
alsi = FTSE/JSE All Share Index, albi = All Bond Index, em_prop = Emerging Market Property Index, msCi_emi = MSCI Emerging Market Index,
ftse_wi = FTSE World Index, dev_prop = Developed Market Property Index, topix = TOPIX Japanese Equity Index, s&p500 = S&P500 Equity Index,
s&p_small =S&P Small Cap Equity Index, orbis_ge = Orbis Global Equity Fund, tremonthfi = Tremont Hedge Fund Index,
orbis_od = Orbis Optimal Strategy, jpm_gbi = JP Morgan Global Government Bond Index, us$_Cash = US$ Bank deposits
2.5%
2.5%
5.5%
7.5%
10%
12.5%
15%
17.5%
20%
22.5%
5%5%10%15% 10% 15% 20%
ALBI
EM_PropMSCI_EMI
ALSI
AG_Fbv
Orbis_OdTremonthfi
Jpm_GbiUS$_Cash
S&P_Small
Dev_Prop
FTSE_WI
S&P500Topix
Orbis_Ge ••
•
••
•
•
••
••
•
••
•
•
Combined portfolio volatility (23.4%), higher than ALSI volatility (21.7%).
MAP 2 Adding emerging market equity to ALSI increases volatility
MSCI_EMI volatility = 25.0%

Q3 200920
allan gray limited global mandate share returns vs. ftse/jse all share index
Period Allan Gray* FTSE/JSE All Share Index Out/Underperformance 1974 (from 15.06) -0.8 -0.8 0.0 1975 23.7 -18.9 42.6 1976 2.7 -10.9 13.61977 38.2 20.6 17.6 1978 36.9 37.2 -0.3 1979 86.9 94.4 -7.5 1980 53.7 40.9 12.8 1981 23.2 0.8 22.4 1982 34.0 38.4 -4.4 1983 41.0 14.4 26.6 1984 10.9 9.4 1.5 1985 59.2 42.0 17.2 1986 59.5 55.9 3.6 1987 9.1 -4.3 13.4 1988 36.2 14.8 21.4 1989 58.1 55.7 2.4 1990 4.5 -5.1 9.6 1991 30.0 31.1 -1.1 1992 -13.0 -2.0 -11.0 1993 57.5 54.7 2.8 1994 40.8 22.7 18.1 1995 16.2 8.8 7.4 1996 18.1 9.4 8.7 1997 -17.4 -4.5 -12.9 1998 1.5 -10.0 11.5 1999 122.4 61.4 61.0 2000 13.2 0.0 13.2 2001 38.1 29.3 8.8 2002 25.6 -8.1 33.7 2003 29.4 16.1 13.3 2004 31.8 25.4 6.4 2005 56.5 47.3 9.2 2006 49.7 41.2 8.5 2007 17.6 19.2 -1.6 2008 -12.6 -23.2 10.6 2009 (to 30.09) 17.3 18.6 -1.3 annualised to 30.09.2009 From 01.10.2008 (1 year) 15.1 7.7 7.4 From 01.10.2006 (3 years) 12.9 6.7 6.2 From 01.10.2004 (5 years) 26.3 19.5 6.8 From 01.10.1999 (10 years) 28.3 17.2 11.1 Since 01.01.1978 29.7 20.5 9.2 Since 15.06.1974 28.4 17.8 10.6
Average outperformance 10.6 Number of calendar years outperformed 27 Number of calendar years underperformed 7
Annualisedto30.09.2009
investment track record
* Allan Gray commenced managing pension funds on 1 January 1978. The returns prior to 1 January 1978 are of individuals managed by Allan Gray, and these returns exclude income. Note: Listed property included from 1 July 2002.
An investment of R10 000 made with Allan Gray on 15 June 1974 would have grown to R67001041 by 30 September 2009. By comparison, the returns generated by the FTSE/JSE All Share Index (ALSI) over the same period would have grown a similar investment to R3203926.
35
30
25
20
15
10
5
0
Allan Gray*
ALSI
From 01.10.2006 (3 years)
12.9
6.7
From 01.10.2004 (5 years)
26.3
19.5
From 01.10.1999 (10 years)
28.3
17.2
Since 01.01.1978
29.7
20.5
Since 15.06.1974
28.4
17.8
From 01.10.2008 (1 year)
15.1
7.7

Q3 2009 21
allan gray limited global mandate total returns vs. alexander forbes large manager watch
Period Allan Gray AFLMW** Out/Underperformance
1978 34.5 28.0 6.5 1979 40.4 35.7 4.7 1980 36.2 15.4 20.8 1981 15.7 9.5 6.2 1982 25.3 26.2 -0.9 1983 24.1 10.6 13.5 1984 9.9 6.3 3.6 1985 38.2 28.4 9.8 1986 40.3 39.9 0.4 1987 11.9 6.6 5.3 1988 22.7 19.4 3.3 1989 39.2 38.2 1.0 1990 11.6 8.0 3.6 1991 22.8 28.3 -5.5 1992 1.2 7.6 -6.4 1993 41.9 34.3 7.6 1994 27.5 18.8 8.7 1995 18.2 16.9 1.3 1996 13.5 10.3 3.2 1997 -1.8 9.5 -11.3 1998 6.9 -1.0 7.9 1999 80.0 46.8 33.1 2000 21.7 7.6 14.1 2001 44.0 23.5 20.5 2002 13.4 -3.6 17.1 2003 21.5 17.8 3.7 2004 21.8 28.1 -6.3 2005 40.0 31.9 8.1 2006 35.6 31.7 3.9 2007 14.5 15.1 -0.6 2008 -1.1 -12.3 11.2 2009 (to 30.09) 10.3 13.7 -3.4 annualised to 30.09.2009 From 01.10.2008 (1 year) 12.3 8.2 4.1From 01.10.2006 (3 years) 11.9 8.5 3.4From 01.10.2004 (5 years) 21.0 17.4 3.6From 01.10.1999 (10 years) 23.5 16.7 6.8Since 01.01.1978 23.6 18.0 5.6
Average outperformance 5.6 Number of calendar years outperformed 25 Number of calendar years underperformed 6
From 01.10.2008 (1 year)
12.3
8.2
From 01.10.2006 (3 years)
11.9
8.5
From 01.10.2004 (5 years)
21.0
17.4
From 01.10.1999 (10 years)
23.5
16.7
Since 01.01.1978
23.6
18.0
investment track record
** Consulting Actuaries Survey returns used up to December 1997. The return for September 2009 is an estimate.
An investment of R10 000 made with Allan Gray on 1 January 1978 would have grown to R8365700 by 30 September 2009. The average total performance of global mandates of Large Managers over the same period would have grown a similar investment to R1935299.
Annualisedto30.09.2009
25
20
10
15
5
0
Allan Gray
AFLMW**

Q3 200922
allan gray annualised performance in percentage per annum to 30 september 2009
performanCe as CalCulated by allan gray1 The fund returns are net of investment management fees
2 The return for Quarter 3, 2009 is an estimate as the relevant survey results have not yet been released
3 Unable to disclose due to ASISA regulations
4 Consulting Actuaries Survey returns used to 31 December 1997. Alexander Forbes Global Large Manager Watch used from 1 January 1998
5 The composite assets under management figures shown include the assets invested in the pooled portfolios above where appropriate
6 Amounts invested by the Allan Gray client portfolios in the Orbis Funds are included in the assets under management figures in the table above
third Quarter 1 year 3 years 5 years 10 years sinCe inCeption assets under management inCeption date (unannualised) (R million) UNITTRUSTS1 EquITy FuND (AgEF) 3 11.2 9.4 21.9 23.8 30.7 19 034.1 01.10.98FTSE/JSE All Share Index 7.7 6.7 19.5 17.2 19.0 BALANCED FuND (AgBF) 3 11.9 10.1 18.6 21.8 21.8 29 162.9 01.10.99Average of both Prudential Medium Equity category and Prudential Variable Equity category (excl. AGBF) 7.2 7.3 15.6 14.3 14.3 STABLE FuND (AgSF) - (NET oF TAx) 3 11.5 10.2 13.3 - 14.2 28 455.7 01.07.00Call deposits plus two percentage points (Net of tax) 8.3 8.4 7.3 - 7.9 STABLE FuND (AgSF) - (groSS oF TAx) 3 12.7 11.3 14.2 - 15.5 28 455.7 01.07.00Call deposits plus two percentage points (Gross of tax) 11.2 11.3 9.9 - 10.7 MoNEy MArkET FuND (AgMF) 3 10.4 10.4 9.1 - 9.6 9 588.1 03.07.01Domestic fixed interest money market unit trust sector (excl. AGMF) 10.3 10.2 8.9 - 9.6 opTIMAL FuND (AgoF) 3 9.2 9.9 8.9 - 9.9 2 561.1 01.10.02Daily call rate of FirstRand Bank Ltd 9.0 9.1 7.7 - 8.2 BoND FuND (AgBD) 3 10.9 9.4 - - 9.1 135.1 01.10.04BEASSA All Bond Index (total return) 9.1 8.0 - - 8.5 gLoBAL FuND oF FuNDS (AggF) 3 12.3 6.8 13.3 - 9.7 6 499.8 03.02.0460% of the FTSE World Index and 40% of the JP Morgan Global Government Bond Index (Rands) -3.0 1.6 9.5 - 7.0 gLoBAL EquITy FEEDEr FuND (AgoE) 3 11.5 1.4 - - 12.9 3 427.1 01.04.05FTSE World Index (Rands) -8.8 -3.6 - - 7.8
LIFEPOOLEDPORTFOLIOS gLoBAL BALANCED porTFoLIo 9.6 12.0 11.9 20.8 - 22.2 13 230.6 01.09.00Mean of Alexander Forbes Global Large Manager Watch 2 11.7 8.2 8.5 17.4 - 15.3 DoMESTIC BALANCED porTFoLIo 10.8 13.0 13.4 22.9 - 22.8 5 394.4 01.09.01Mean of Alexander Forbes Domestic Manager Watch 2 11.7 10.7 10.8 19.1 - 17.7 DoMESTIC EquITy porTFoLIo 12.9 11.8 12.9 26.1 - 26.4 5 415.7 01.02.01FTSE/JSE All Share Index 13.9 7.7 6.7 19.5 - 15.8 DoMESTIC ABSoLuTE porTFoLIo 10.9 18.7 18.6 25.5 - 27.0 529.0 06.07.01Mean of Alexander Forbes Domestic Manager Watch 2 11.7 10.7 10.8 19.1 - 17.3 DoMESTIC STABLE porTFoLIo 5.8 14.6 13.8 17.3 - 17.5 475.7 01.12.01Alexander Forbes Three-Month Deposit Index plus 2% 2.3 12.1 12.2 11.0 - 11.7 DoMESTIC opTIMAL porTFoLIo 1 1.2 10.0 10.8 9.8 - 10.0 171.8 04.12.02Daily Call Rate of Nedcor Bank Limited 1.6 9.2 9.5 8.1 - 8.3 gLoBAL ABSoLuTE porTFoLIo 9.5 17.2 17.4 24.5 - 22.9 1 218.2 01.03.04Mean of Alexander Forbes Global Large Manager Watch 2 11.7 8.2 8.5 17.4 - 17.6 DoMESTIC MEDICAL SCHEME porTFoLIo 5.6 13.9 13.5 15.7 - 16.2 1 292.3 01.05.04Consumer Price Index plus 3% p.a. 2 2.4 8.0 11.6 10.1 - 9.7 gLoBAL STABLE porTFoLIo 4.8 12.1 12.3 16.2 - 16.9 2 731.7 15.07.04Alexander Forbes Three-Month Deposit Index plus 2% 2.3 12.1 12.2 11.0 - 11.0 rELATIvE DoMESTIC EquITy porTFoLIo 12.4 11.3 9.7 22.6 - 26.7 657.9 05.05.03FTSE/JSE CAPI Index 13.7 8.2 7.6 20.2 - 24.4 MoNEy MArkET porTFoLIo 1 2.0 10.7 10.5 9.1 - 9.9 888.4 21.09.00Alexander Forbes Three-Month Deposit Index 1.8 9.9 10.0 8.9 - 9.6 ForEIgN porTFoLIo 1 5.4 12.8 6.5 13.2 - 5.8 1 597.9 23.01.0260% of the MSCI Index and 40% JP Morgan Global Government Bond Index (Rands) 10.5 -2.7 1.7 9.5 - 1.2 orBIS gLoBAL EquITy porTFoLIo 1 13.4 11.9 1.9 13.5 - 12.6 2 014.5 18.05.04FTSE World Index (Rands) 15.5 -8.5 -3.6 8.4 - 8.2 SEGREGATEDPORTFOLIOS5 gLoBAL BALANCED CoMpoSITE 9.6 12.3 11.9 21.0 23.5 23.6 24 076.9 01.01.78Mean of Alexander Forbes Global Large Manager Watch 2, 4 11.7 8.2 8.5 17.4 16.7 18.0 DoMESTIC BALANCED CoMpoSITE 10.7 13.0 13.5 22.8 24.1 24.1 24 949.2 01.01.78Mean of Alexander Forbes Domestic Manager Watch 2 11.7 10.7 10.8 19.1 18.2 18.5 DoMESTIC EquITy CoMpoSITE 13.2 12.1 13.3 26.4 27.2 22.6 42 674.7 01.01.90FTSE/JSE All Share Index 13.9 7.7 6.6 19.5 17.2 14.7 gLoBAL BALANCED NAMIBIAN HIgH ForEIgN CoMpoSITE 8.2 12.1 12.8 20.9 23.1 21.0 5 361.7 01.01.94Mean of Alexander Forbes Namibia Average Manager 2 11.7 8.2 10.7 17.9 16.5 14.7 rELATIvE DoMESTIC CoMpoSITE 12.9 11.9 9.8 22.3 - 22.5 9 231.6 19.04.00Weighted average of client specific benchmarks 2 14.0 8.2 7.8 19.7 - 16.2 ForEIgN BEST vIEW (rANDS) CoMpoSITE 6.6 8.8 4.8 12.2 16.9 15.5 5 205.7 23.05.9660% of the MSCI and 40% of the JP Morgan Global Government Bond Index (Rands) 10.5 -2.7 1.7 9.5 6.7 10.6 ORBISFUNDS(RANDS)1, 6 orBIS gLoBAL EquITy FuND (rANDS) 13.5 11.2 1.7 13.6 13.9 19.3 - 01.01.90FTSE World Index (Rands) 15.6 -8.5 -3.6 8.4 4.6 11.9 orBIS JApAN EquITy (yEN) FuND (rANDS) 4.3 8.7 -2.3 9.0 6.9 15.0 - 01.01.98Tokyo Stock Price Index (Rands) 3.7 -7.9 -8.7 5.0 0.1 6.1 orBIS opTIMAL SA FuND-uS$ CLASS (rANDS) -0.4 6.1 6.3 - - 13.6 - 01.01.05US$ Bank Deposits (Rands) -2.2 -7.8 2.5 - - 10.3 orBIS opTIMAL SA FuND-Euro CLASS (rANDS) 3.1 9.0 10.1 - - 14.1 - 01.01.05Euro Bank Deposits (Rands) 1.9 -3.6 7.5 - - 11.3 orBIS ASIA Ex-JApAN EquITy FuND (rANDS) 22.6 36.1 12.6 - - 19.7 - 01.01.06MSCI Asia Ex-Japan (Rands) 16.3 15.4 6.6 - - 15.3

Q3 2009 23
third Quarter 1 year 3 years 5 years 10 years sinCe inCeption assets under management inCeption date (unannualised) (R million) UNITTRUSTS1 EquITy FuND (AgEF) 3 11.2 9.4 21.9 23.8 30.7 19 034.1 01.10.98FTSE/JSE All Share Index 7.7 6.7 19.5 17.2 19.0 BALANCED FuND (AgBF) 3 11.9 10.1 18.6 21.8 21.8 29 162.9 01.10.99Average of both Prudential Medium Equity category and Prudential Variable Equity category (excl. AGBF) 7.2 7.3 15.6 14.3 14.3 STABLE FuND (AgSF) - (NET oF TAx) 3 11.5 10.2 13.3 - 14.2 28 455.7 01.07.00Call deposits plus two percentage points (Net of tax) 8.3 8.4 7.3 - 7.9 STABLE FuND (AgSF) - (groSS oF TAx) 3 12.7 11.3 14.2 - 15.5 28 455.7 01.07.00Call deposits plus two percentage points (Gross of tax) 11.2 11.3 9.9 - 10.7 MoNEy MArkET FuND (AgMF) 3 10.4 10.4 9.1 - 9.6 9 588.1 03.07.01Domestic fixed interest money market unit trust sector (excl. AGMF) 10.3 10.2 8.9 - 9.6 opTIMAL FuND (AgoF) 3 9.2 9.9 8.9 - 9.9 2 561.1 01.10.02Daily call rate of FirstRand Bank Ltd 9.0 9.1 7.7 - 8.2 BoND FuND (AgBD) 3 10.9 9.4 - - 9.1 135.1 01.10.04BEASSA All Bond Index (total return) 9.1 8.0 - - 8.5 gLoBAL FuND oF FuNDS (AggF) 3 12.3 6.8 13.3 - 9.7 6 499.8 03.02.0460% of the FTSE World Index and 40% of the JP Morgan Global Government Bond Index (Rands) -3.0 1.6 9.5 - 7.0 gLoBAL EquITy FEEDEr FuND (AgoE) 3 11.5 1.4 - - 12.9 3 427.1 01.04.05FTSE World Index (Rands) -8.8 -3.6 - - 7.8
LIFEPOOLEDPORTFOLIOS gLoBAL BALANCED porTFoLIo 9.6 12.0 11.9 20.8 - 22.2 13 230.6 01.09.00Mean of Alexander Forbes Global Large Manager Watch 2 11.7 8.2 8.5 17.4 - 15.3 DoMESTIC BALANCED porTFoLIo 10.8 13.0 13.4 22.9 - 22.8 5 394.4 01.09.01Mean of Alexander Forbes Domestic Manager Watch 2 11.7 10.7 10.8 19.1 - 17.7 DoMESTIC EquITy porTFoLIo 12.9 11.8 12.9 26.1 - 26.4 5 415.7 01.02.01FTSE/JSE All Share Index 13.9 7.7 6.7 19.5 - 15.8 DoMESTIC ABSoLuTE porTFoLIo 10.9 18.7 18.6 25.5 - 27.0 529.0 06.07.01Mean of Alexander Forbes Domestic Manager Watch 2 11.7 10.7 10.8 19.1 - 17.3 DoMESTIC STABLE porTFoLIo 5.8 14.6 13.8 17.3 - 17.5 475.7 01.12.01Alexander Forbes Three-Month Deposit Index plus 2% 2.3 12.1 12.2 11.0 - 11.7 DoMESTIC opTIMAL porTFoLIo 1 1.2 10.0 10.8 9.8 - 10.0 171.8 04.12.02Daily Call Rate of Nedcor Bank Limited 1.6 9.2 9.5 8.1 - 8.3 gLoBAL ABSoLuTE porTFoLIo 9.5 17.2 17.4 24.5 - 22.9 1 218.2 01.03.04Mean of Alexander Forbes Global Large Manager Watch 2 11.7 8.2 8.5 17.4 - 17.6 DoMESTIC MEDICAL SCHEME porTFoLIo 5.6 13.9 13.5 15.7 - 16.2 1 292.3 01.05.04Consumer Price Index plus 3% p.a. 2 2.4 8.0 11.6 10.1 - 9.7 gLoBAL STABLE porTFoLIo 4.8 12.1 12.3 16.2 - 16.9 2 731.7 15.07.04Alexander Forbes Three-Month Deposit Index plus 2% 2.3 12.1 12.2 11.0 - 11.0 rELATIvE DoMESTIC EquITy porTFoLIo 12.4 11.3 9.7 22.6 - 26.7 657.9 05.05.03FTSE/JSE CAPI Index 13.7 8.2 7.6 20.2 - 24.4 MoNEy MArkET porTFoLIo 1 2.0 10.7 10.5 9.1 - 9.9 888.4 21.09.00Alexander Forbes Three-Month Deposit Index 1.8 9.9 10.0 8.9 - 9.6 ForEIgN porTFoLIo 1 5.4 12.8 6.5 13.2 - 5.8 1 597.9 23.01.0260% of the MSCI Index and 40% JP Morgan Global Government Bond Index (Rands) 10.5 -2.7 1.7 9.5 - 1.2 orBIS gLoBAL EquITy porTFoLIo 1 13.4 11.9 1.9 13.5 - 12.6 2 014.5 18.05.04FTSE World Index (Rands) 15.5 -8.5 -3.6 8.4 - 8.2 SEGREGATEDPORTFOLIOS5 gLoBAL BALANCED CoMpoSITE 9.6 12.3 11.9 21.0 23.5 23.6 24 076.9 01.01.78Mean of Alexander Forbes Global Large Manager Watch 2, 4 11.7 8.2 8.5 17.4 16.7 18.0 DoMESTIC BALANCED CoMpoSITE 10.7 13.0 13.5 22.8 24.1 24.1 24 949.2 01.01.78Mean of Alexander Forbes Domestic Manager Watch 2 11.7 10.7 10.8 19.1 18.2 18.5 DoMESTIC EquITy CoMpoSITE 13.2 12.1 13.3 26.4 27.2 22.6 42 674.7 01.01.90FTSE/JSE All Share Index 13.9 7.7 6.6 19.5 17.2 14.7 gLoBAL BALANCED NAMIBIAN HIgH ForEIgN CoMpoSITE 8.2 12.1 12.8 20.9 23.1 21.0 5 361.7 01.01.94Mean of Alexander Forbes Namibia Average Manager 2 11.7 8.2 10.7 17.9 16.5 14.7 rELATIvE DoMESTIC CoMpoSITE 12.9 11.9 9.8 22.3 - 22.5 9 231.6 19.04.00Weighted average of client specific benchmarks 2 14.0 8.2 7.8 19.7 - 16.2 ForEIgN BEST vIEW (rANDS) CoMpoSITE 6.6 8.8 4.8 12.2 16.9 15.5 5 205.7 23.05.9660% of the MSCI and 40% of the JP Morgan Global Government Bond Index (Rands) 10.5 -2.7 1.7 9.5 6.7 10.6 ORBISFUNDS(RANDS)1, 6 orBIS gLoBAL EquITy FuND (rANDS) 13.5 11.2 1.7 13.6 13.9 19.3 - 01.01.90FTSE World Index (Rands) 15.6 -8.5 -3.6 8.4 4.6 11.9 orBIS JApAN EquITy (yEN) FuND (rANDS) 4.3 8.7 -2.3 9.0 6.9 15.0 - 01.01.98Tokyo Stock Price Index (Rands) 3.7 -7.9 -8.7 5.0 0.1 6.1 orBIS opTIMAL SA FuND-uS$ CLASS (rANDS) -0.4 6.1 6.3 - - 13.6 - 01.01.05US$ Bank Deposits (Rands) -2.2 -7.8 2.5 - - 10.3 orBIS opTIMAL SA FuND-Euro CLASS (rANDS) 3.1 9.0 10.1 - - 14.1 - 01.01.05Euro Bank Deposits (Rands) 1.9 -3.6 7.5 - - 11.3 orBIS ASIA Ex-JApAN EquITy FuND (rANDS) 22.6 36.1 12.6 - - 19.7 - 01.01.06MSCI Asia Ex-Japan (Rands) 16.3 15.4 6.6 - - 15.3

Q3 200924
allan gray balanced fund Quarterly disclosure as at 30 september 2009
%ofFund SouthAfricanequities 51.1 Resources 12.5 Anglogold Ashanti 4.3 Sasol 4.0 Harmony Gold Mining Co. 1.9 African Rainbow Minerals 1.6 Positions individually less than 1% of total JSE-listed securities held by the Fund 0.6 Financials 8.0 Sanlam 3.0 Standard Bank Group 1.6 Reinet Investments SA 0.9 Firstrand 0.8 Positions individually less than 1% of total JSE-listed securities held by the Fund 1.7 Industrials 30.5 SABMiller 7.2 Remgro 3.8 MTN Group 3.2 Compagnie Fin Richemont SA 2.2 Sappi 1.9 Nampak 1.6 Dimension Data Holdings 1.4 Illovo Sugar 1.4 Sun International 1.0 Tongaat-Hulett 0.9 Shoprite Holdings 0.7 Mondi Limited 0.6 Aspen Healthcare Holdings 0.6 Positions individually less than 1% of total JSE-listed securities held by the Fund 4.1 Othersecurities 0.1 Positions individually less than 1% of total JSE-listed securities held by the Fund 0.1 Derivatives -0.5 ALSI 40 1209-RMB -0.5 ---- Net South African equities ---- 50.6 HedgedSouthAfricanEquities 0.5 Commodities 4.0 New Gold ETF 4.0 Bonds 4.7 RSA Bonds 1.9 Parastatal Bonds 0.2 Corporate Bonds 2.7 Moneymarketandcalldeposits 19.9 Foreign-JSEinwardlistedshares 4.2 British American Tobacco 4.2 Foreign-Orbisabsolutereturnfunds 8.0 Orbis Optimal SA Fund (US$) 5.0 Orbis Optimal SA Fund (Euro) 3.0 Foreign-Orbisequityfunds 8.0 Orbis Global Equity Fund 4.7 Orbis Japan Equity Fund (Yen) 3.3 Totals: 100.0
performance component 1.17% 0.49% 0.14% 0.43% 0.18% 0.00% 0.29% 0.43%
fee at benchmark 1.71% 1.15% 1.14% 1.14% 0.29% 0.29% 1.28% 1.49% trading costs 0.12% 0.06% 0.04% 0.45% 0.00% 0.00% 0.06% 0.17%
other expenses 0.01% 0.03% 0.02% 0.02% 0.09% 0.01% 0.18% 0.34%
total expense ratio (ter) 3.01% 1.73% 1.34% 2.04% 0.56% 0.30% 1.81% 2.43%
EquityFund
BalancedFund
StableFund
OptimalFund
BondFund
MoneyMarketFund
GlobalFundofFunds
GlobalEquityFeederFund
A Total Expense Ratio (TER) of a portfolio is a measure of the portfolio’s assets that were relinquished as a payment of services rendered in the management of the portfolio. The total operating expenses are expressed as a percentage of the average value of the portfolio, calculated for the year to the end of June 2009. Included in the TER is the proportion of costs incurred by the performance component, fee at benchmark and other expenses. These are disclosed separately as percentages of the net asset value. Trading costs (including brokerage, VAT, STT, STRATE, levy and insider trading levy) are included in the TER. A high TER will not necessarily imply a poor return nor does a low TER imply a good return. The current TER cannot be regarded as an indication of future TERs.
total expense ratios (ters)
Note: There may be slight discrepancies in the totals due to rounding.

Registration Number 2005/002576/06 Granger Bay Court Beach Road V&A Waterfront Cape Town 8001P O Box 51318 V&A Waterfront Cape Town 8002 South Africa Tel +27 (0)21 415 2300 Fax +27 (0)21 415 2400www.allangray.co.za [email protected]
Client Service Centre 0860 000 654 / +27 (0)21 415 2301Client Service Email [email protected]/IFA Service Facsimile 0860 000 655 / +27 (0)21 415 2492IFA Service Centre 0860 000 653 / +27 (0)21 415 2690IFA Email [email protected] Square Dock Road V&A Waterfront Cape Town 8001
DIRECTORS M Cooper B Bus Sc FIA FASSA RW Dower BSc (Eng) MBA DD Govender B Com CA (SA) CFA WB Gray B Com MBA CFA (Non-Executive) (Irish) IS Liddle B Bus Sc (Hons) CFA SC Marais PhD CFA (Non-Executive)T Mhlambiso AB MBA JD (Non-Executive) IN Mkhize BSc MBA (Non-Executive)
COMPANY SECRETARY CJ Hetherington B Com CA (SA)
Collective Investment Schemes (unit trusts) are generally medium- to long-term investments. The value of participatory interest (units) may go down as well as up. Past performance is not necessarily a guide to the future. Unit trust prices are calculated on a net asset value basis, which, for money market funds, is the total book value of all assets in the portfolio divided by the number of units in issue. The Allan Gray Money Market Fund aims to maintain a constant price of 100 cents per unit. The total return to the investor is primarily made up of interest received but may also include any gain or loss made on any particular instrument held. In most cases this will have the effect of increasing or decreasing the daily yield, but in some cases, for example in the event of a default on the part of an issuer of any instrument held by the Fund, it can have the effect of a capital loss. Such losses will be borne by the Allan Gray Money Market Fund and its investors and in order to maintain a constant price of 100 cents per unit, investors’ unit holdings will be reduced to the extent of such losses. Fluctuations or movements in exchange rates may also be the cause of the value of underlying international investments going up or down. Unit trusts are traded at ruling prices. Commissions and incentives may be paid and if so, would be included in the overall costs. Different classes of units apply to the Allan Gray Equity, Balanced, Stable and Optimal Funds only and are subject to different fees and charges. A detailed schedule of fees and charges and maximum commissions is available on request from the company. Forward pricing is used. A fund of funds unit trust may only invest in other unit trusts, which levy their own charges that could result in a higher fee structure for these portfolios. A feeder fund is a unit trust fund that, apart from assets in liquid form, consists solely of units in a single portfolio of a collective investment scheme. All of the unit trusts except the Allan Gray Money Market Fund may be capped at any time in order for them to be managed in accordance with their mandates. Allan Gray Unit Trust Management Limited is a member of the Association for Savings & Investment SA (ASISA).
The FTSE/JSE Africa Index Series is calculated by FTSE International Limited (‘FTSE’) in conjunction with the JSE Limited (‘JSE’) in accordance with standard criteria. The FTSE/JSE Africa Index Series is the proprietary information of FTSE and the JSE. All copyright subsisting in the FTSE/JSE Africa Index Series index values and constituent lists vests in FTSE and the JSE jointly. All their rights are reserved.
Allan Gray Limited and Allan Gray Life Limited are authorised financial services providers. Allan Gray Investment Services Limited is an authorised administrative financial services provider.© Allan Gray Limited, 2009.
KIN
GJA
MES
rsvp