
Quarterly Bulletin 3 / 2013 September - Swiss National Bank · Quarterly Bulletin 3 / ... section...
40
Quarterly Bulletin 3/2013 September
Transcript of Quarterly Bulletin 3 / 2013 September - Swiss National Bank · Quarterly Bulletin 3 / ... section...

Qu
arte
rly
Bu
lleti
n
3 / 2
013
S
epte
mb
er Quarterly Bulletin 3 / 2013 September


Quarterly Bulletin 3 / 2013 September
Volume 31


Quarterly Bulletin 3 / 2013 September 3
Contents
Page
Monetary policy report 4
1 Monetary policy decision of 19 September 2013 5 Monetary policy strategy at the SNB 6
2 Global economic environment 7 3 Economic developments in Switzerland 13 4 Prices and inflation expectations 19
5 Monetary developments 23
Business cycle trends 30
Chronicle of monetary events 34

Report for the attention of the Governing Board of the Swiss National Bank for its quarterly assessment of September 2013
The report describes economic and monetary developments in Switzerland and explains the inflation forecast. It shows how the SNB views the economic situation and the implications for monetary policy it draws from this assessment. The first section (‘Monetary policy decision of 19 September 2013’) is an excerpt from the press release published following the assessment.
This report is based on the data and information available as at 19 September 2013. Unless otherwise stated, all rates of change from the previous period are based on seasonally adjusted data and are annualised.
Monetary policy report
Quarterly Bulletin 3 / 2013 September 5
1 Monetary policy decision of 19 September 2013
Swiss National Bank reaffirms minimum exchange rateThe Swiss National Bank (SNB) is maintaining its minimum exchange rate of CHF 1.20 per euro. The Swiss franc is still high. The SNB stands ready to enforce the minimum exchange rate, if necessary, by buying foreign currency in unlimited quantities, and to take further measures, as required. Although the situation on the global financial markets has eased somewhat, the minimum exchange rate, with the three-month Libor close to zero, remains essential. It prevents an undesired tightening of monetary conditions were the upward pressure on the Swiss franc to intensify once again. The target range for the three-month Libor will stay at 0.0 – 0.25%.
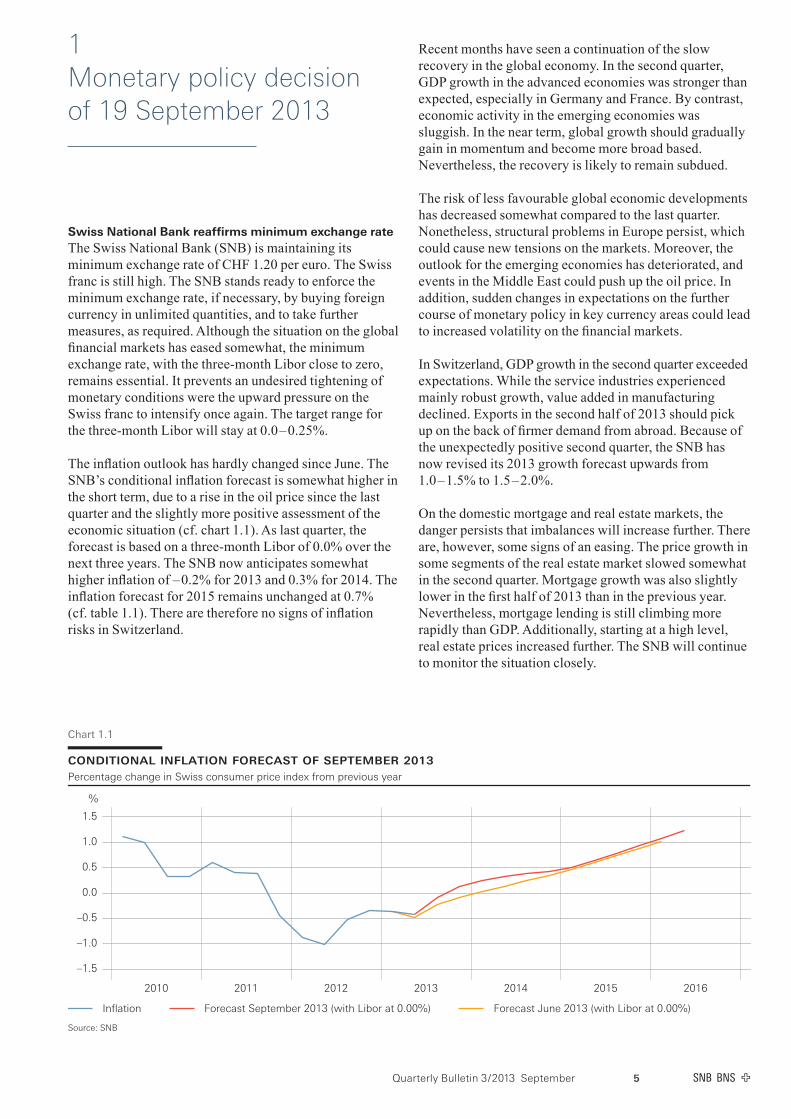
The inflation outlook has hardly changed since June. The SNB’s conditional inflation forecast is somewhat higher in the short term, due to a rise in the oil price since the last quarter and the slightly more positive assessment of the economic situation (cf. chart 1.1). As last quarter, the forecast is based on a three-month Libor of 0.0% over the next three years. The SNB now anticipates somewhat higher inflation of – 0.2% for 2013 and 0.3% for 2014. The inflation forecast for 2015 remains unchanged at 0.7% (cf. table 1.1). There are therefore no signs of inflation risks in Switzerland.
Recent months have seen a continuation of the slow recovery in the global economy. In the second quarter, GDP growth in the advanced economies was stronger than expected, especially in Germany and France. By contrast, economic activity in the emerging economies was sluggish. In the near term, global growth should gradually gain in momentum and become more broad based. Nevertheless, the recovery is likely to remain subdued.
The risk of less favourable global economic developments has decreased somewhat compared to the last quarter. Nonetheless, structural problems in Europe persist, which could cause new tensions on the markets. Moreover, the outlook for the emerging economies has deteriorated, and events in the Middle East could push up the oil price. In addition, sudden changes in expectations on the further course of monetary policy in key currency areas could lead to increased volatility on the financial markets.
In Switzerland, GDP growth in the second quarter exceeded expectations. While the service industries experienced mainly robust growth, value added in manufacturing declined. Exports in the second half of 2013 should pick up on the back of firmer demand from abroad. Because of the unexpectedly positive second quarter, the SNB has now revised its 2013 growth forecast upwards from 1.0 – 1.5% to 1.5 – 2.0%.
On the domestic mortgage and real estate markets, the danger persists that imbalances will increase further. There are, however, some signs of an easing. The price growth in some segments of the real estate market slowed somewhat in the second quarter. Mortgage growth was also slightly lower in the first half of 2013 than in the previous year. Nevertheless, mortgage lending is still climbing more rapidly than GDP. Additionally, starting at a high level, real estate prices increased further. The SNB will continue to monitor the situation closely.
conditional inflation forecast of september 2013Percentage change in Swiss consumer price index from previous year
%
–1.5
–1.0
–0.5
0.0
0.5
1.0
1.5
2010 2011 2012 2013 2014 2015 2016
Inflation Forecast September 2013 (with Libor at 0.00%) Forecast June 2013 (with Libor at 0.00%)
Source: SNB
Chart 1.1
Quarterly Bulletin 3 / 2013 September6
Monetary policy strategy at the SNBThe SNB has a statutory mandate to ensure price stability while taking due account of economic developments. The SNB has specified the way in which it exercises this mandate in a three-part monetary policy strategy. First, it regards prices as stable when the national consumer price index (CPI) rises by less than 2% per annum. This allows it to take account of the fact that the CPI slightly overstates actual inflation. At the same
time, it allows inflation to fluctuate somewhat with the economic cycle. Second, the SNB summarises its assessment of the situation and of the need for monetary policy action in a quarterly inflation forecast. This forecast, which is based on the assumption of a constant short-term interest rate, shows how the SNB expects the CPI to move over the next three years. Third, the SNB sets its operational goal in the form of a target range for the three-month Swiss franc Libor. In addition, a minimum exchange rate against the euro is currently in place.
Table 1.1
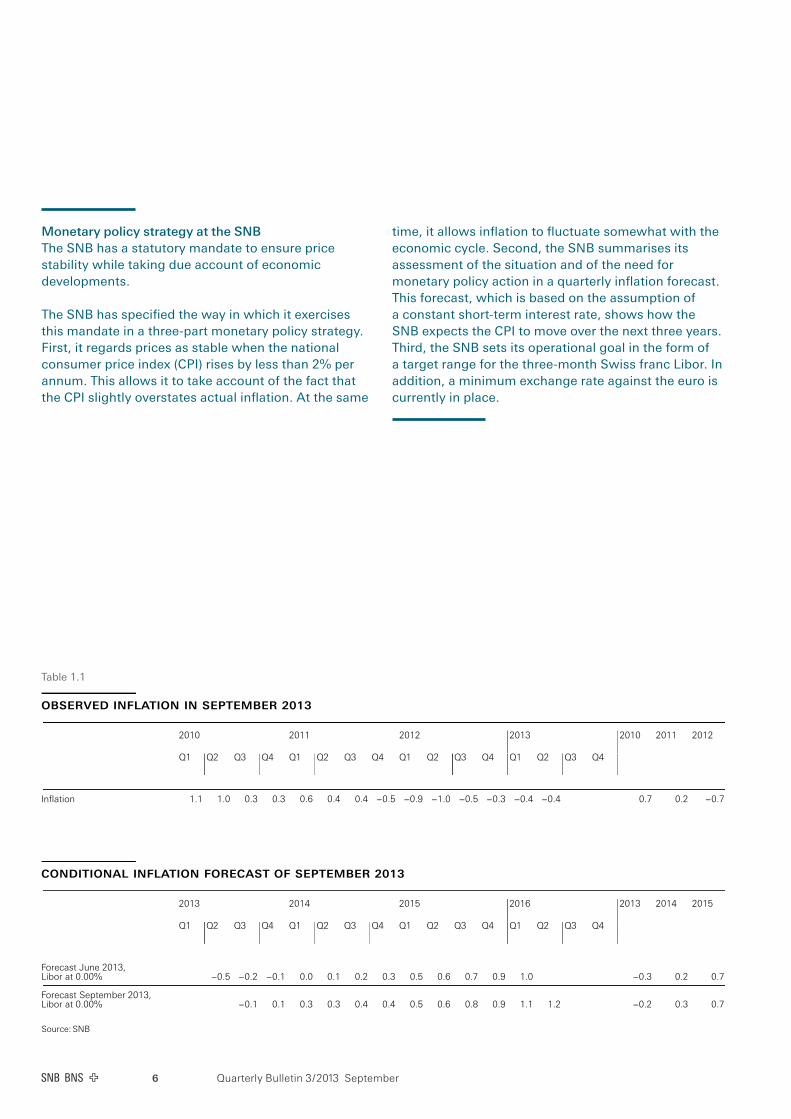
observed inflation in september 2013
2010 2011 2012 2013 2010 2011 2012
Q1 Q2 Q3 Q4 Q1 Q2 Q3 Q4 Q1 Q2 Q3 Q4 Q1 Q2 Q3 Q4
Inflation 1.1 1.0 0.3 0.3 0.6 0.4 0.4 –0.5 –0.9 –1.0 –0.5 –0.3 –0.4 –0.4 0.7 0.2 –0.7
conditional inflation forecast of september 2013
2013 2014 2015 2016 2013 2014 2015
Q1 Q2 Q3 Q4 Q1 Q2 Q3 Q4 Q1 Q2 Q3 Q4 Q1 Q2 Q3 Q4
Forecast June 2013,Libor at 0.00% –0.5 –0.2 –0.1 0.0 0.1 0.2 0.3 0.5 0.6 0.7 0.9 1.0 –0.3 0.2 0.7
Forecast September 2013,Libor at 0.00% –0.1 0.1 0.3 0.3 0.4 0.4 0.5 0.6 0.8 0.9 1.1 1.2 –0.2 0.3 0.7
Source: SNB

Quarterly Bulletin 3 / 2013 September 7
2 Global economic environment
The slow recovery of the global economy continued in the second quarter. In the advanced economies, GDP grew more strongly than expected. The business cycle revived especially strongly in Germany and France. By contrast, economic performance in the emerging economies continued to be sluggish in historical terms, as reflected by a decline in exports (cf. chart 2.1).
Global growth is likely to continue gaining momentum in the coming quarters. The situation for the advanced economies has remained essentially unchanged since the monetary policy assessment of mid-June. Domestic demand in the US has been stimulated by improved household wealth and the steady increase in employment. The exceptionally expansionary monetary policy in Japan is helping the upswing. In the euro area, although a large number of structural problems still persist, the economy should revive on the back of more stable financing conditions and a lightening fiscal burden. The outlook for the emerging economies, by contrast, has become somewhat more sombre: Turbulence on the financial markets is weighing on economic activity in the short term, and some of these countries have tightened monetary policy to counter capital outflows and high inflation. Finally, the structural problems facing some emerging economies must first be addressed through reforms.
global exportsPeriod average = 100
Index
75
80
85
90
95
100
105
110
115
2009 2010 2011 2012 2013
WorldAdvanced economies
Emerging economies
Sources: CPB, Thomson Financial Datastream
Chart 2.1
stock marketsBeginning of period = 100 (lhs)
Index Index
75
100
125
150
175
200
2009 2010 2011 2012 2013
10
20
30
40
50
60
Developed markets (MSCI) Emerging marketsImplied volatility (VIX) (rhs)
Sources: Reuters, Thomson Financial Datastream
Chart 2.2
Table 2.1
baseline scenario for global economic developments
Scenario
2010 2011 2012 2013 2014 2015
GDP, year-on-year change in percent
Global 1 5.1 3.7 3.0 2.8 4.0 4.5
US 2.5 1.8 2.8 1.5 2.8 3.5
Euro area 1.9 1.5 –0.5 –0.4 1.3 2.1
Japan 4.7 –0.6 2.0 1.7 1.8 1.0
Oil price in USD per barrel 2 79.6 111.4 111.7 108.3 109.0 109.0
1 PPP-weighted (US, euro area, United Kingdom, Japan, China, South Korea, Taiwan,Hong Kong, Singapore, India, Brazil and Russia).
2 Level.
Sources: SNB, Thomson Financial Datastream
Quarterly Bulletin 3 / 2013 September8
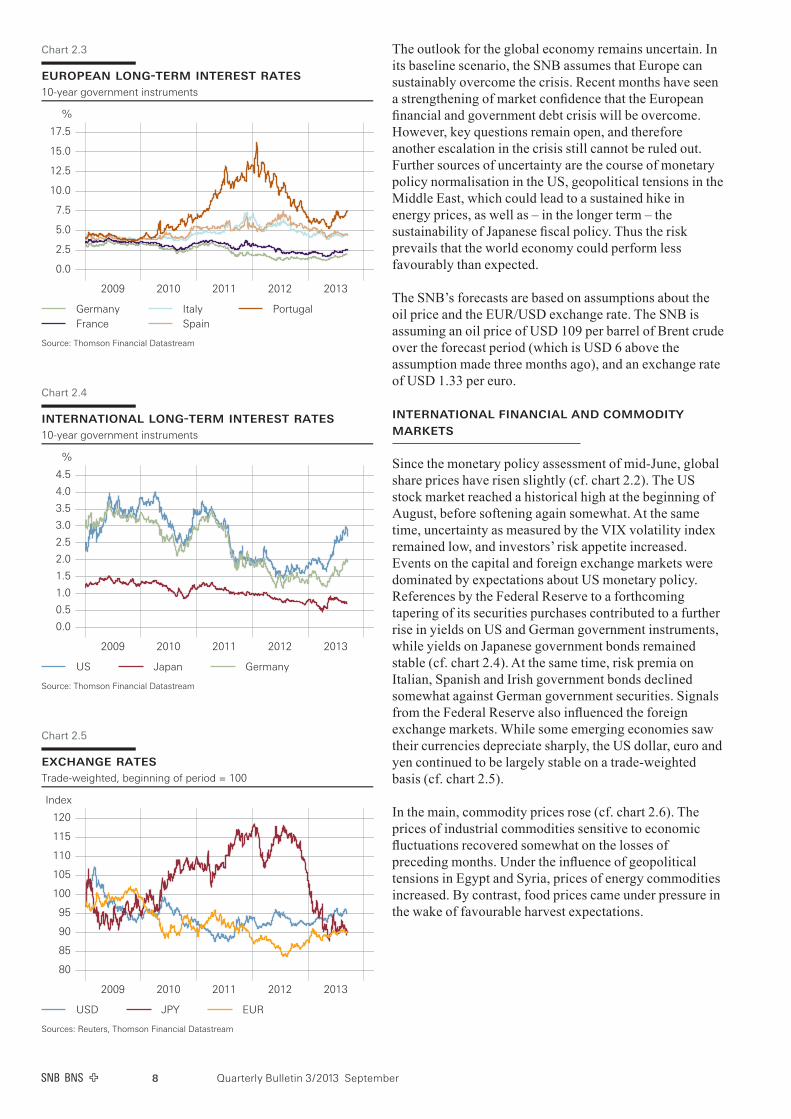
The outlook for the global economy remains uncertain. In its baseline scenario, the SNB assumes that Europe can sustainably overcome the crisis. Recent months have seen a strengthening of market confidence that the European financial and government debt crisis will be overcome. However, key questions remain open, and therefore another escalation in the crisis still cannot be ruled out. Further sources of uncertainty are the course of monetary policy normalisation in the US, geopolitical tensions in the Middle East, which could lead to a sustained hike in energy prices, as well as – in the longer term – the sustainability of Japanese fiscal policy. Thus the risk prevails that the world economy could perform less favourably than expected.
The SNB’s forecasts are based on assumptions about the oil price and the EUR/USD exchange rate. The SNB is assuming an oil price of USD 109 per barrel of Brent crude over the forecast period (which is USD 6 above the assumption made three months ago), and an exchange rate of USD 1.33 per euro.
InternatIonal fInancIal and commodIty markets
Since the monetary policy assessment of mid-June, global share prices have risen slightly (cf. chart 2.2). The US stock market reached a historical high at the beginning of August, before softening again somewhat. At the same time, uncertainty as measured by the VIX volatility index remained low, and investors’ risk appetite increased. Events on the capital and foreign exchange markets were dominated by expectations about US monetary policy. References by the Federal Reserve to a forthcoming tapering of its securities purchases contributed to a further rise in yields on US and German government instruments, while yields on Japanese government bonds remained stable (cf. chart 2.4). At the same time, risk premia on Italian, Spanish and Irish government bonds declined somewhat against German government securities. Signals from the Federal Reserve also influenced the foreign exchange markets. While some emerging economies saw their currencies depreciate sharply, the US dollar, euro and yen continued to be largely stable on a trade-weighted basis (cf. chart 2.5).
In the main, commodity prices rose (cf. chart 2.6). The prices of industrial commodities sensitive to economic fluctuations recovered somewhat on the losses of preceding months. Under the influence of geopolitical tensions in Egypt and Syria, prices of energy commodities increased. By contrast, food prices came under pressure in the wake of favourable harvest expectations.
european long-term interest rates10-year government instruments
%
0.0
2.5
5.0
7.5
10.0
12.5
15.0
17.5
2009 2010 2011 2012 2013
GermanyFrance
ItalySpain
Portugal
Source: Thomson Financial Datastream
Chart 2.3
exchange ratesTrade-weighted, beginning of period = 100
Index
80
85
90
95
100
105
110
115
120
2009 2010 2011 2012 2013
USD JPY EUR
Sources: Reuters, Thomson Financial Datastream
Chart 2.5
international long-term interest rates10-year government instruments
%
0.0
0.5
1.0
1.5
2.0
2.5
3.0
3.5
4.0
4.5
2009 2010 2011 2012 2013
US Japan Germany
Source: Thomson Financial Datastream
Chart 2.4
Quarterly Bulletin 3 / 2013 September 9
UnIted states
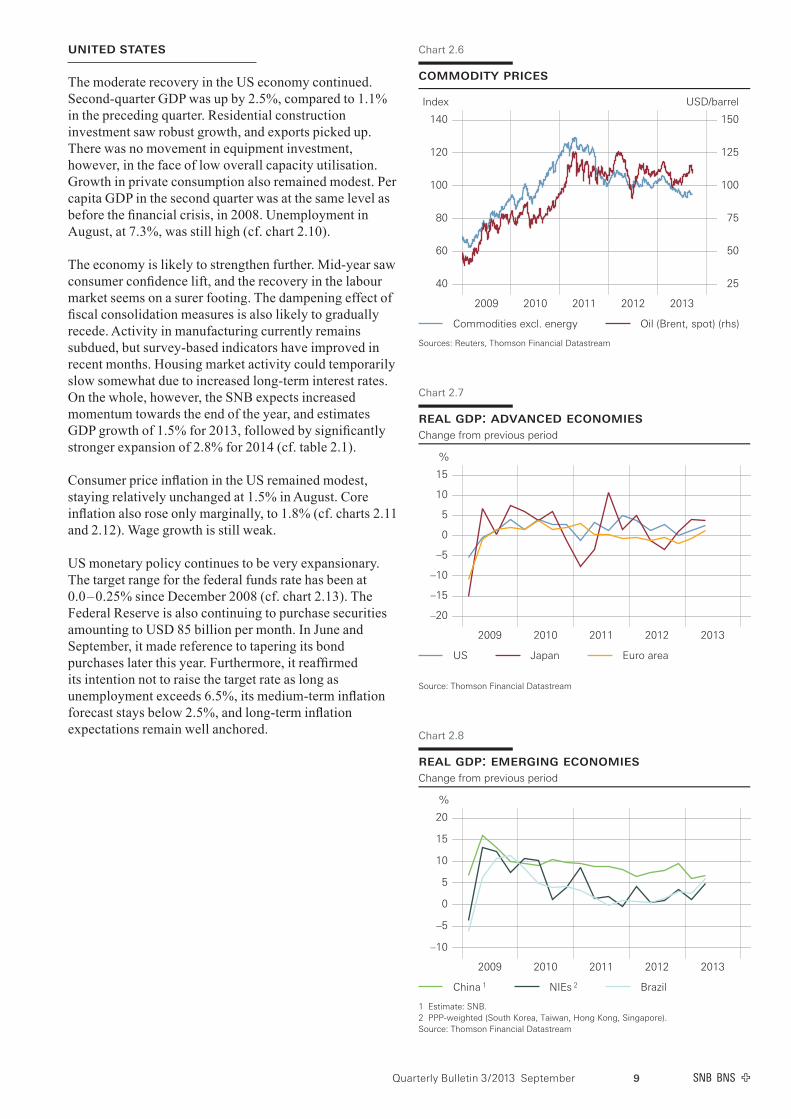
The moderate recovery in the US economy continued. Second-quarter GDP was up by 2.5%, compared to 1.1% in the preceding quarter. Residential construction investment saw robust growth, and exports picked up. There was no movement in equipment investment, however, in the face of low overall capacity utilisation. Growth in private consumption also remained modest. Per capita GDP in the second quarter was at the same level as before the financial crisis, in 2008. Unemployment in August, at 7.3%, was still high (cf. chart 2.10).
The economy is likely to strengthen further. Mid-year saw consumer confidence lift, and the recovery in the labour market seems on a surer footing. The dampening effect of fiscal consolidation measures is also likely to gradually recede. Activity in manufacturing currently remains subdued, but survey-based indicators have improved in recent months. Housing market activity could temporarily slow somewhat due to increased long-term interest rates. On the whole, however, the SNB expects increased momentum towards the end of the year, and estimates GDP growth of 1.5% for 2013, followed by significantly stronger expansion of 2.8% for 2014 (cf. table 2.1).
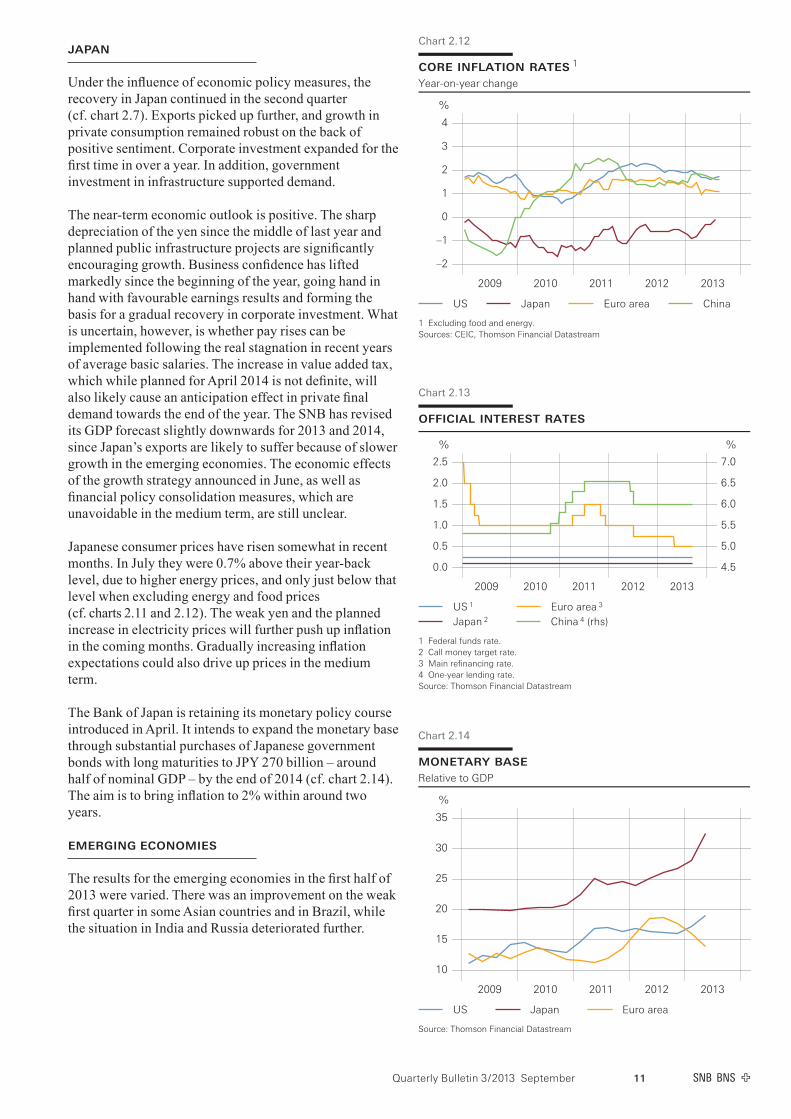
Consumer price inflation in the US remained modest, staying relatively unchanged at 1.5% in August. Core inflation also rose only marginally, to 1.8% (cf. charts 2.11 and 2.12). Wage growth is still weak.
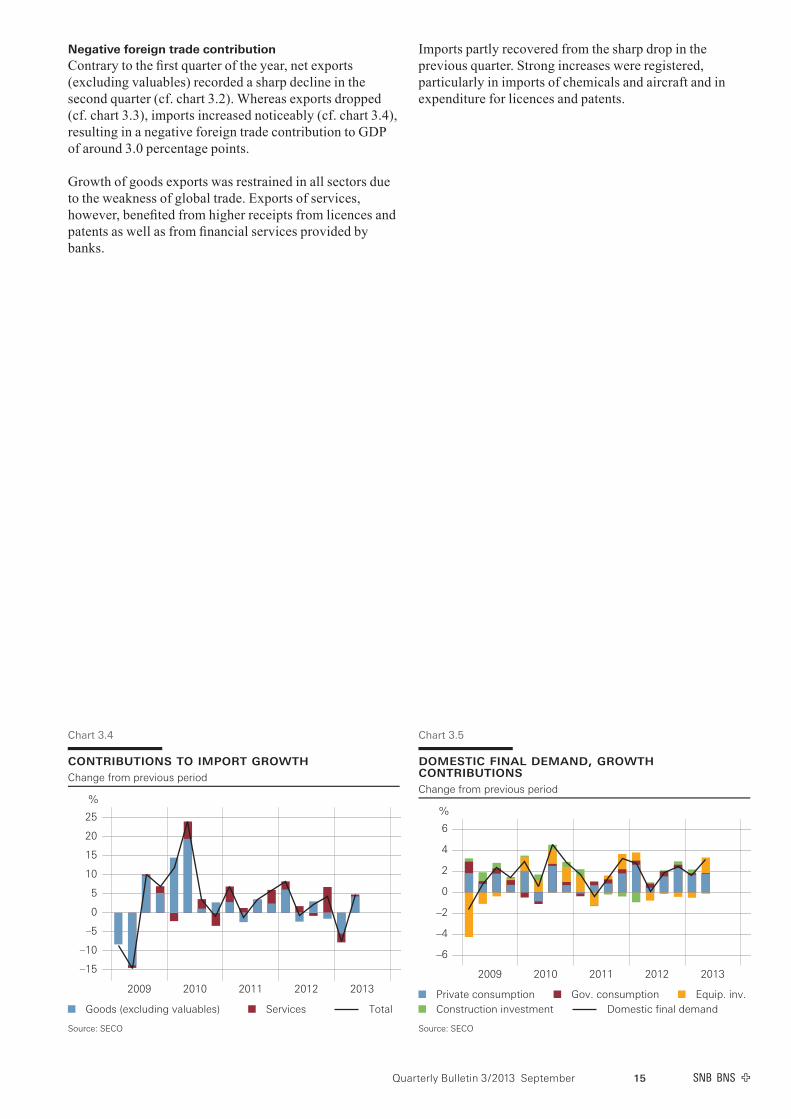
US monetary policy continues to be very expansionary. The target range for the federal funds rate has been at 0.0 – 0.25% since December 2008 (cf. chart 2.13). The Federal Reserve is also continuing to purchase securities amounting to USD 85 billion per month. In June and September, it made reference to tapering its bond purchases later this year. Furthermore, it reaffirmed its intention not to raise the target rate as long as unemployment exceeds 6.5%, its medium-term inflation forecast stays below 2.5%, and long-term inflation expectations remain well anchored.
commodity prices
Index USD/barrel
40
60
80
100
120
140
2009 2010 2011 2012 2013
25
50
75
100
125
150
Commodities excl. energy Oil (Brent, spot) (rhs)
Sources: Reuters, Thomson Financial Datastream
Chart 2.6
real gdp: emerging economiesChange from previous period
%
–10
–5
0
5
10
15
20
2009 2010 2011 2012 2013
China 1 NIEs 2 Brazil
1 Estimate: SNB.2 PPP-weighted (South Korea, Taiwan, Hong Kong, Singapore).Source: Thomson Financial Datastream
Chart 2.8
real gdp: advanced economiesChange from previous period
%
–20
–15
–10
–5
0
5
10
15
2009 2010 2011 2012 2013
US Japan Euro area
Source: Thomson Financial Datastream
Chart 2.7

Quarterly Bulletin 3 / 2013 September10
eUro area
Following six quarters of negative growth, GDP in the euro area expanded in the second quarter, by 1.2%. The main drivers were Germany and France, but many smaller member states also recorded increased economic activity. After more than two years of recession, Portugal surprised many with strong growth. In terms of demand, economic growth in the euro area was broadly based. Manufacturing activity, in particular, benefited from an increase in exports. Value added also recovered, due to weather conditions. Overall, the restrictive effect of fiscal consolidation measures dropped off somewhat, especially since some member states were allowed more time by the European Commission to reduce their government deficits. In spite of the favourable developments, the output gap was still large, and the unemployment rate continued to hover at over 12% (cf. chart 2.10).
Economic indicators point to a continued recovery in the second half of 2013. Household and business confidence has lifted in many member states. The outlook for exports has improved, and there are first signs of a revival in investment. However, business demand for credit is still restrained, and in some countries, banks are experiencing an increase in non-performing loans, which is curbing lending. On the whole, in view of the still considerable uncertainty about how to resolve the structural problems in the euro area, recovery in domestic demand is only expected to be gradual. Based on the somewhat more favourable economic data, the SNB has slightly raised its GDP forecast for the euro area to – 0.4% for 2013 and 1.3% for 2014.
Consumer price inflation in the euro area, almost unchanged in August at 1.3%, continues to be modest, while core inflation persisted at around 1.1% (cf. charts 2.11 and 2.12). Business surveys continue to suggest that there is little pressure on prices. Inflation expectations based on financial market data have increased slightly in recent months.
The ECB left its main refinancing rate at the historical low of 0.50% (cf. chart 2.13). In July it communicated for the first time that it expects its key interest rates to remain at the current or lower levels for an extended period of time.
purchasing managers’ indices (manufacturing)
Index
25
30
35
40
45
50
55
60
2009 2010 2011 2012 2013
US Japan Euro area China
Source: Thomson Financial Datastream; copyright and databaserights: Markit Economics Ltd 2009; all rights reserved
Chart 2.9
consumer pricesYear-on-year change
%
–4
–2
0
2
4
6
8
2009 2010 2011 2012 2013
US Japan Euro area China
Source: Thomson Financial Datastream
Chart 2.11
unemployment rates
%
2
4
6
8
10
12
14
2004 2005 2006 2007 2008 2009 2010 2011 2012 2013
US Japan Euro area
Source: Thomson Financial Datastream
Chart 2.10
Quarterly Bulletin 3 / 2013 September 11
Japan
Under the influence of economic policy measures, the recovery in Japan continued in the second quarter (cf. chart 2.7). Exports picked up further, and growth in private consumption remained robust on the back of positive sentiment. Corporate investment expanded for the first time in over a year. In addition, government investment in infrastructure supported demand.
The near-term economic outlook is positive. The sharp depreciation of the yen since the middle of last year and planned public infrastructure projects are significantly encouraging growth. Business confidence has lifted markedly since the beginning of the year, going hand in hand with favourable earnings results and forming the basis for a gradual recovery in corporate investment. What is uncertain, however, is whether pay rises can be implemented following the real stagnation in recent years of average basic salaries. The increase in value added tax, which while planned for April 2014 is not definite, will also likely cause an anticipation effect in private final demand towards the end of the year. The SNB has revised its GDP forecast slightly downwards for 2013 and 2014, since Japan’s exports are likely to suffer because of slower growth in the emerging economies. The economic effects of the growth strategy announced in June, as well as financial policy consolidation measures, which are unavoidable in the medium term, are still unclear.
Japanese consumer prices have risen somewhat in recent months. In July they were 0.7% above their year-back level, due to higher energy prices, and only just below that level when excluding energy and food prices (cf. charts 2.11 and 2.12). The weak yen and the planned increase in electricity prices will further push up inflation in the coming months. Gradually increasing inflation expectations could also drive up prices in the medium term.
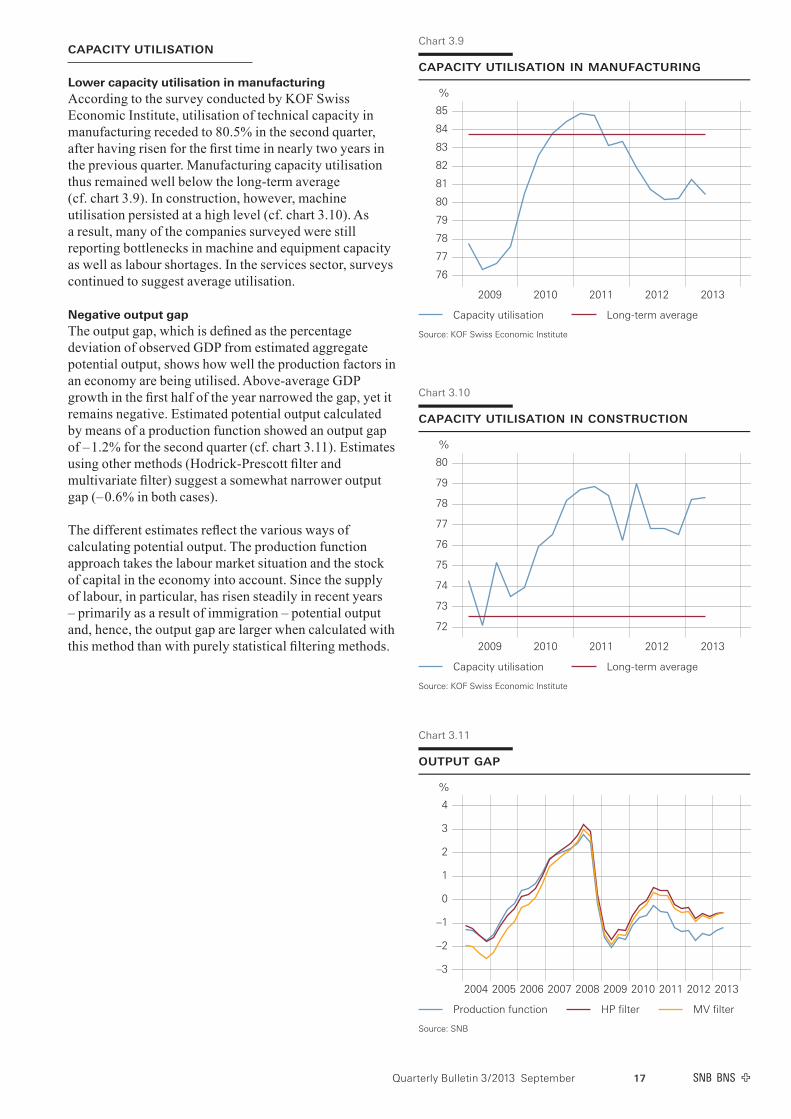
The Bank of Japan is retaining its monetary policy course introduced in April. It intends to expand the monetary base through substantial purchases of Japanese government bonds with long maturities to JPY 270 billion – around half of nominal GDP – by the end of 2014 (cf. chart 2.14). The aim is to bring inflation to 2% within around two years.
emergIng economIes
The results for the emerging economies in the first half of 2013 were varied. There was an improvement on the weak first quarter in some Asian countries and in Brazil, while the situation in India and Russia deteriorated further.
official interest rates
% %
0.0
0.5
1.0
1.5
2.0
2.5
2009 2010 2011 2012 2013
4.5
5.0
5.5
6.0
6.5
7.0
US 1
Japan 2
Euro area 3
China 4 (rhs)
1 Federal funds rate.2 Call money target rate.3 Main refinancing rate.4 One-year lending rate.Source: Thomson Financial Datastream
Chart 2.13
monetary baseRelative to GDP
%
10
15
20
25
30
35
2009 2010 2011 2012 2013
US Japan Euro area
Source: Thomson Financial Datastream
Chart 2.14
core inflation rates 1
Year-on-year change
%
–2
–1
0
1
2
3
4
2009 2010 2011 2012 2013
US Japan Euro area China
1 Excluding food and energy.Sources: CEIC, Thomson Financial Datastream
Chart 2.12

Quarterly Bulletin 3 / 2013 September12
In China, a mild recovery in consumption contributed substantially to stronger growth in the second quarter (cf. chart 2.8). However, slack demand from abroad and the further appreciation of the renminbi weighed on exports. Moreover, economic growth was checked by less expansionary lending practices, with new regulations to curb the shadow banking system, which has grown strongly in recent years, contributing to this development. In addition, temporary liquidity bottlenecks resulted in turbulence on the interbank market in June.
The newly industrialised economies of Asia also saw growth pick up in the second quarter. In Brazil, exports and investment improved, although social unrest continued to fuel uncertainty and strain private consumption. The economy in India slackened considerably.
Overall, growth in the emerging economies is likely to gather pace in the coming quarters, although the SNB expects a slower upswing than it did three months ago. Statements by the Chinese government suggest a further scaling-back of lending, which could dampen investment.
This could especially impact the newly industrialised economies of Asia and commodity exporters like Brazil. In India, Brazil and Russia, high inflation rates and restrictive monetary policy are hampering the economic upswing. Furthermore, some countries are grappling with current account deficits and other structural problems.
Consumer price inflation among the emerging economies is mixed. In some countries it remained subdued, especially in China, where annual inflation and core inflation amounted to 2.6% and less than 2% respectively in August (cf. charts 2.11 and 2.12). In countries like India and Brazil, however, it continued to be high.
The central banks of India and Brazil were challenged by high inflation at a time of slack economic activity as well as speculation about a forthcoming change in US monetary policy. Both countries saw their currencies depreciate significantly against the US dollar, leading to a reversal of capital inflows. In India, this hindered a potential easing of monetary policy. By contrast, the central bank of Brazil raised its key interest rate further in June and August.

Quarterly Bulletin 3 / 2013 September 13
3 Economic developments in Switzerland
In Switzerland, GDP growth in the second quarter exceeded expectations. According to preliminary estimates by the State Secretariat for Economic Affairs (SECO), real GDP increased by 2.1%. This growth was again driven by domestic demand. Exports, by contrast, continued to fall. On the output side, the service sector recorded a very positive development, whereas value added generated by manufacturing once again decreased.
The negative output gap narrowed thanks to the robust GDP growth. Capacity utilisation in manufacturing, however, declined and therefore remained at a low level. The number of people out of work rose slightly despite higher employment figures.
In the second half of the year, exports are likely to pick up thanks to an improved environment abroad, and a broad-based increase in GDP is expected. Based on the unexpectedly good developments in the second quarter, the SNB now anticipates GDP growth of 1.5 – 2.0% for 2013 as a whole.
aggregate demand and oUtpUt
Dynamic services sector The robust GDP growth in the second quarter was driven primarily by the services sector (cf. chart 3.1). Healthcare, financial services and insurance in particular developed in a dynamic manner. Business-related services as well as transport and communications also registered above-average growth. By contrast, value added in the manufacturing industry declined for the third quarter in a row.
contributions to growth, by sectorChange from previous period
%
–6
–4
–2
0
2
4
6
2009 2010 2011 2012 2013
ManufacturingTradeOther services
Public admin. & healthBankingConstruction
OtherGDP
Source: State Secretariat for Economic Affairs (SECO)
Chart 3.1
contributions to growth in demandChange from previous period
%
–15
–10
–5
0
5
10
15
2009 2010 2011 2012 2013
Domestic final demandExports
ImportsInventories
GDP
Source: SECO
Chart 3.2
contributions to export growthChange from previous period
%
–30
–20
–10
0
10
20
30
2009 2010 2011 2012 2013
Goods (excluding valuables) Services Total
Source: SECO
Chart 3.3

Quarterly Bulletin 3 / 2013 September14
Sound domestic demand Domestic final demand remained very robust in the second quarter (cf. chart 3.5 and table 3.1). Benefiting from the high level of immigration, private consumer spending recorded an above-average increase. Healthcare expenditure rose particularly sharply, as in the quarters before, and consumers spent more in the retail sector, too.
Special factors were behind the distinct increase in equipment investment. Investment in aircraft – a volatile segment – expanded sharply. For the rest, companies remained reticent as far as investment was concerned in view of the low utilisation of technical capacity and the uncertain global economic outlook.
The rise in construction investment came to a halt. Especially in residential construction, which is benefiting from the booming real estate market, output was unable to keep pace with new orders. Business construction for its part continued to suffer from the overall economic uncertainty.
real gdp and componentsGrowth rates on previous period in percent, annualised
2009 2010 2011 2012 2011 2012 2013
Q3 Q4 Q1 Q2 Q3 Q4 Q1 Q2
Private consumption 1.8 1.7 1.1 2.4 1.3 2.8 4.1 0.7 2.3 3.5 2.6 2.7
Government consumption 3.3 0.2 1.2 3.2 3.2 3.2 3.1 3.1 3.9 2.5 1.1 0.5
Investment in fixed assets –8.0 4.8 4.5 –0.4 0.6 4.4 –1.0 –3.1 –0.4 –0.6 –0.7 5.9
Construction 3.0 3.5 2.5 –2.9 –2.1 –3.9 –9.2 1.1 0.8 3.2 3.6 –1.3
Equipment –15.5 5.8 6.1 1.7 2.9 11.5 6.1 –6.3 –1.3 –3.5 –4.2 12.2
Domestic final demand –0.4 2.2 1.8 1.8 1.4 3.2 2.8 0.1 1.9 2.5 1.6 3.1
Change in inventories 1 0.1 0.8 –0.2 –0.1 2.3 –3.5 0.1 0.8 –1.2 1.6 –2.8 2.2
Total exports 2 –7.3 7.4 3.8 2.0 –5.7 8.1 5.0 –2.6 6.2 –1.6 1.2 –2.1
Goods 2 –11.1 9.3 6.3 1.9 –3.9 10.7 1.2 –3.6 9.8 –8.1 –1.2 –3.6
Services 1.2 3.5 –1.6 2.4 –9.6 2.2 14.3 –0.5 –1.1 14.1 5.7 1.1
Total imports 2 –5.3 9.1 3.8 3.9 3.5 6.0 8.2 –0.7 2.2 4.3 –7.7 4.8
Goods 2 –8.3 10.6 3.1 2.5 4.2 3.0 7.7 –2.9 3.8 –2.0 –7.1 5.5
Services 9.0 3.0 6.8 9.4 0.7 18.3 10.4 8.6 –3.8 32.2 –10.3 2.3
Net exports 3 –1.6 0.2 0.4 –0.5 –4.2 1.6 –0.7 –1.0 2.2 –2.6 3.7 –3.0
GDP –1.9 3.0 1.8 1.0 –0.7 0.9 1.9 –0.2 2.7 1.2 2.3 2.1
1 Contribution to growth in percentage points (including statisticaldiscrepancy).2 Excluding valuables (precious metals, precious stones and gems as well as works of art and antiques).3 Contribution to growth in percentage points.
Source: SECO
Table 3.1
Quarterly Bulletin 3 / 2013 September 15
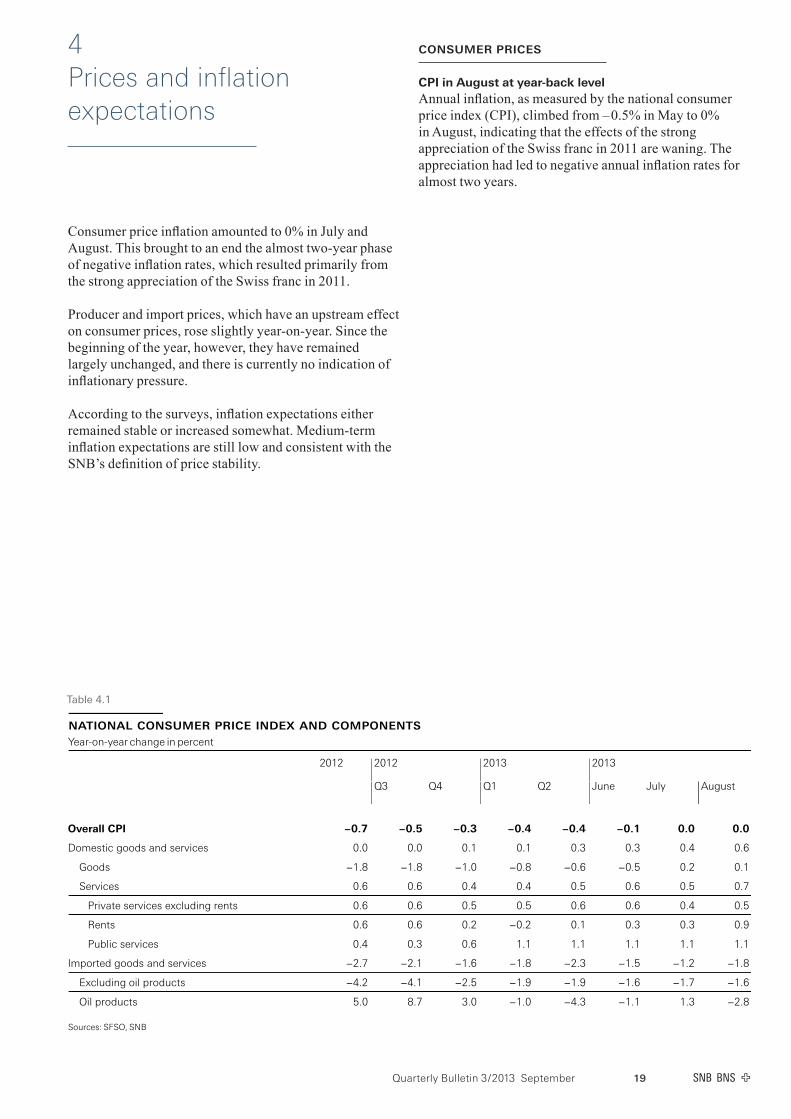
Negative foreign trade contribution Contrary to the first quarter of the year, net exports (excluding valuables) recorded a sharp decline in the second quarter (cf. chart 3.2). Whereas exports dropped (cf. chart 3.3), imports increased noticeably (cf. chart 3.4), resulting in a negative foreign trade contribution to GDP of around 3.0 percentage points.
Growth of goods exports was restrained in all sectors due to the weakness of global trade. Exports of services, however, benefited from higher receipts from licences and patents as well as from financial services provided by banks.
Imports partly recovered from the sharp drop in the previous quarter. Strong increases were registered, particularly in imports of chemicals and aircraft and in expenditure for licences and patents.
domestic final demand, growth contributionsChange from previous period
%
–6
–4
–2
0
2
4
6
2009 2010 2011 2012 2013
Private consumption Gov. consumption Equip. inv.Construction investment Domestic final demand
Source: SECO
Chart 3.5
contributions to import growthChange from previous period
%
–15
–10
–5
0
5
10
15
20
25
2009 2010 2011 2012 2013
Goods (excluding valuables) Services Total
Source: SECO
Chart 3.4

Quarterly Bulletin 3 / 2013 September16
laboUr market
The positive employment momentum continued in the second quarter. Thanks to immigration, the supply of labour again expanded considerably. The number of people out of work increased slightly despite the rise in employment. By international standards, the situation on the Swiss labour market remains favourable.
Unemployment slightly upUnemployment has been rising slowly but steadily for two years now. Between May and August, the number of people registered as unemployed with regional employment offices increased by almost 1,300 on a seasonally adjusted basis. The rate of unemployment, however, remained unchanged at 3.2% (cf. chart 3.6).
Short-time working was again low in the second quarter, affecting approximately 5,300 people in June (cf. chart 3.7).
Employment again on the increase According to the statistics published by the Swiss Federal Statistical Office (SFSO), employment continued to rise in the second quarter. Compared with the previous quarter, the number of full-time and part-time jobs increased by 1.1%. Expressed in terms of full-time equivalents, the rise in employment amounted to 1.3%. Developments in employment varied widely from one industry to another. New jobs were created in construction and various services industries, whereas manufacturing, financial services, retailers and the hospitality industry cut jobs overall (cf. chart 3.8).
unemployment rate
%
2.0
2.5
3.0
3.5
4.0
4.5
2004 2005 2006 2007 2008 2009 2010 2011 2012 2013
Seasonally adjusted Not seasonally adjusted
Unemployed registered with the regional employment offices, as a percentage ofthe labour force according to the 2000 census (labour force: 3,946,988 persons)to 2009, and according to the 2010 census (labour force: 4,322,899 persons)from 2010.Source: SECO
Chart 3.6
short-time working
In thousands In thousands
0
20
40
60
80
100
04 05 06 07 08 09 10 11 12 13
0
1
2
3
4
5
Workers affected Companies affected (rhs)
Source: SECO
Chart 3.7
full-time equivalent employmentQ1 2006 = 100
Index
97.5
100.0
102.5
105.0
107.5
110.0
112.5
115.0
2004 2005 2006 2007 2008 2009 2010 2011 2012 2013
ManufacturingConstruction
ServicesTotal
Source: Swiss Federal Statistical Office (SFSO)
Chart 3.8
Quarterly Bulletin 3 / 2013 September 17
capacIty UtIlIsatIon
Lower capacity utilisation in manufacturingAccording to the survey conducted by KOF Swiss Economic Institute, utilisation of technical capacity in manufacturing receded to 80.5% in the second quarter, after having risen for the first time in nearly two years in the previous quarter. Manufacturing capacity utilisation thus remained well below the long-term average (cf. chart 3.9). In construction, however, machine utilisation persisted at a high level (cf. chart 3.10). As a result, many of the companies surveyed were still reporting bottlenecks in machine and equipment capacity as well as labour shortages. In the services sector, surveys continued to suggest average utilisation.
Negative output gap The output gap, which is defined as the percentage deviation of observed GDP from estimated aggregate potential output, shows how well the production factors in an economy are being utilised. Above-average GDP growth in the first half of the year narrowed the gap, yet it remains negative. Estimated potential output calculated by means of a production function showed an output gap of – 1.2% for the second quarter (cf. chart 3.11). Estimates using other methods (Hodrick-Prescott filter and multivariate filter) suggest a somewhat narrower output gap (– 0.6% in both cases).
The different estimates reflect the various ways of calculating potential output. The production function approach takes the labour market situation and the stock of capital in the economy into account. Since the supply of labour, in particular, has risen steadily in recent years – primarily as a result of immigration – potential output and, hence, the output gap are larger when calculated with this method than with purely statistical filtering methods.
capacity utilisation in manufacturing
%
76
77
78
79
80
81
82
83
84
85
2009 2010 2011 2012 2013
Capacity utilisation Long-term average
Source: KOF Swiss Economic Institute
Chart 3.9
capacity utilisation in construction
%
72
73
74
75
76
77
78
79
80
2009 2010 2011 2012 2013
Capacity utilisation Long-term average
Source: KOF Swiss Economic Institute
Chart 3.10
output gap
%
–3
–2
–1
0
1
2
3
4
2004 2005 2006 2007 2008 2009 2010 2011 2012 2013
Production function HP filter MV filter
Source: SNB
Chart 3.11

Quarterly Bulletin 3 / 2013 September18
oUtlook for the real economy
Despite the surprisingly positive GDP developments in the second quarter, the SNB’s basic economic outlook has not changed greatly. Industries with a domestic focus will continue to benefit from the favourable domestic environment, which includes the labour market, immigration and lending conditions. Equipment investment, however, is likely to lose momentum considerably after an extraordinarily strong second quarter. The outlook for export-oriented industries now appears somewhat more positive thanks to the gradual global economic recovery. Initial data for the summer months suggest an upturn in exports and industrial production.
The SNB expects solid economic development in the second half of the year. For the full year 2013, it anticipates GDP growth of 1.5 – 2.0%. Unemployment seems to have peaked. The negative output gap is likely to narrow further over the coming quarters.
As outlined in chapter 2, there are still significant downside risks facing the global economy in the medium term. Despite the cautiously positive baseline scenario, downside risks thus remain for economic developments in Switzerland, too.
expected new orders
Balance
–60
–40
–20
0
20
40
60
2009 2010 2011 2012 2013
All industriesChemicals
MachineryWatchmaking
Metals
Source: KOF Swiss Economic Institute
Chart 3.13
employment outlook indicatorSeasonally adjusted
Balance
0.925
0.950
0.975
1.000
1.025
1.050
1.075
1.100
2009 2010 2011 2012 2013
Manufacturing (16%) 1
Construction (8%) 1Services (75%) 1
1 2012 employment share in brackets.Source: SFSO; seasonal adjustment: SNB
Chart 3.14
purchasing managers’ index(manufacturing)
Index
30
35
40
45
50
55
60
65
70
2009 2010 2011 2012 2013
PMI
Source: Credit Suisse
Chart 3.12
Quarterly Bulletin 3 / 2013 September 19
4 Prices and inflation expectations
Consumer price inflation amounted to 0% in July and August. This brought to an end the almost two-year phase of negative inflation rates, which resulted primarily from the strong appreciation of the Swiss franc in 2011.
Producer and import prices, which have an upstream effect on consumer prices, rose slightly year-on-year. Since the beginning of the year, however, they have remained largely unchanged, and there is currently no indication of inflationary pressure.
According to the surveys, inflation expectations either remained stable or increased somewhat. Medium-term inflation expectations are still low and consistent with the SNB’s definition of price stability.
consUmer prIces
CPI in August at year-back levelAnnual inflation, as measured by the national consumer price index (CPI), climbed from – 0.5% in May to 0% in August, indicating that the effects of the strong appreciation of the Swiss franc in 2011 are waning. The appreciation had led to negative annual inflation rates for almost two years.
Table 4.1
national consumer price index and componentsYear-on-year change in percent
2012 2012 2013 2013
Q3 Q4 Q1 Q2 June July August
Overall CPI –0.7 –0.5 –0.3 –0.4 –0.4 –0.1 0.0 0.0
Domestic goods and services 0.0 0.0 0.1 0.1 0.3 0.3 0.4 0.6
Goods –1.8 –1.8 –1.0 –0.8 –0.6 –0.5 0.2 0.1
Services 0.6 0.6 0.4 0.4 0.5 0.6 0.5 0.7
Private services excluding rents 0.6 0.6 0.5 0.5 0.6 0.6 0.4 0.5
Rents 0.6 0.6 0.2 –0.2 0.1 0.3 0.3 0.9
Public services 0.4 0.3 0.6 1.1 1.1 1.1 1.1 1.1
Imported goods and services –2.7 –2.1 –1.6 –1.8 –2.3 –1.5 –1.2 –1.8
Excluding oil products –4.2 –4.1 –2.5 –1.9 –1.9 –1.6 –1.7 –1.6
Oil products 5.0 8.7 3.0 –1.0 –4.3 –1.1 1.3 –2.8
Sources: SFSO, SNB
20 Quarterly Bulletin 3 / 2013 September
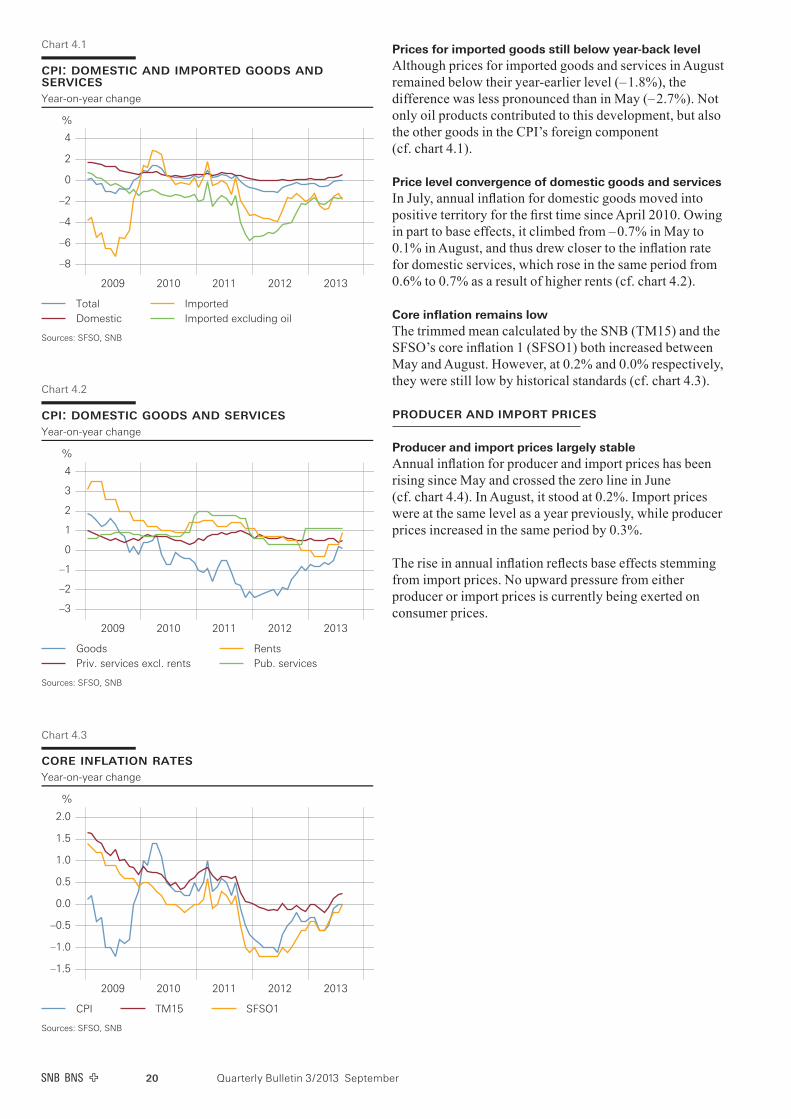
Prices for imported goods still below year-back levelAlthough prices for imported goods and services in August remained below their year-earlier level (– 1.8%), the difference was less pronounced than in May (– 2.7%). Not only oil products contributed to this development, but also the other goods in the CPI’s foreign component (cf. chart 4.1).
Price level convergence of domestic goods and servicesIn July, annual inflation for domestic goods moved into positive territory for the first time since April 2010. Owing in part to base effects, it climbed from – 0.7% in May to 0.1% in August, and thus drew closer to the inflation rate for domestic services, which rose in the same period from 0.6% to 0.7% as a result of higher rents (cf. chart 4.2).
Core inflation remains lowThe trimmed mean calculated by the SNB (TM15) and the SFSO’s core inflation 1 (SFSO1) both increased between May and August. However, at 0.2% and 0.0% respectively, they were still low by historical standards (cf. chart 4.3).
prodUcer and Import prIces
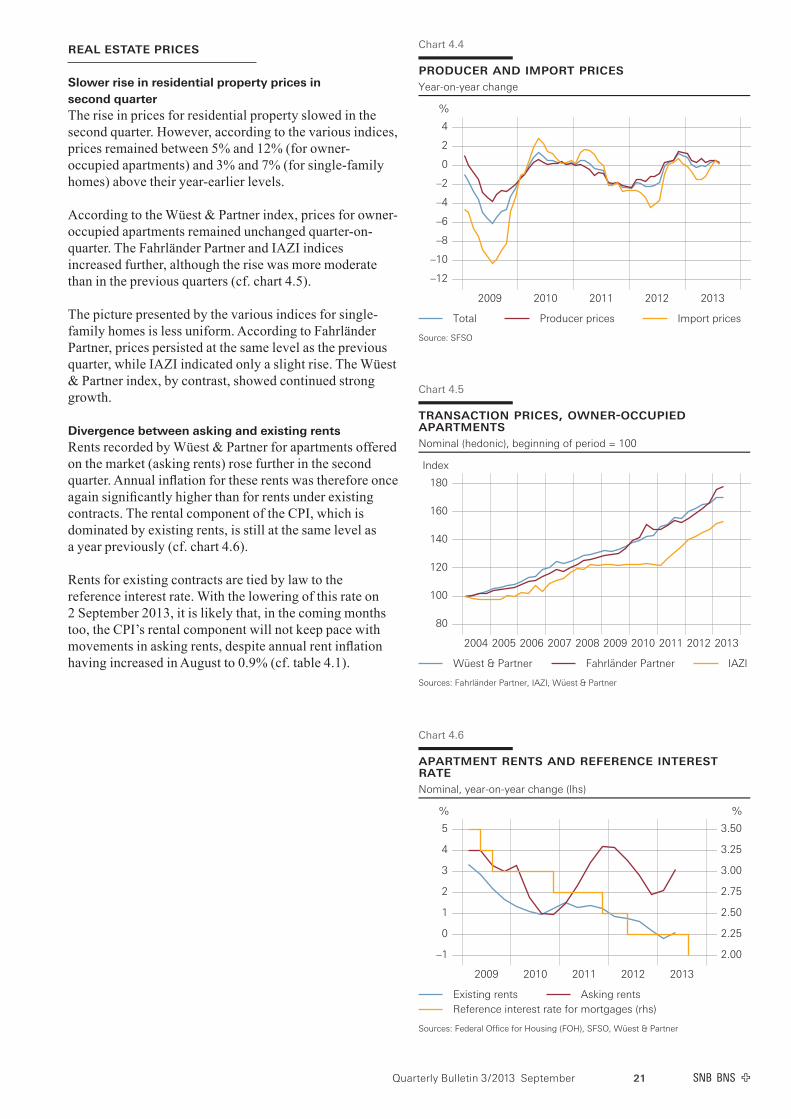
Producer and import prices largely stableAnnual inflation for producer and import prices has been rising since May and crossed the zero line in June (cf. chart 4.4). In August, it stood at 0.2%. Import prices were at the same level as a year previously, while producer prices increased in the same period by 0.3%.
The rise in annual inflation reflects base effects stemming from import prices. No upward pressure from either producer or import prices is currently being exerted on consumer prices.
core inflation ratesYear-on-year change
%
–1.5
–1.0
–0.5
0.0
0.5
1.0
1.5
2.0
2009 2010 2011 2012 2013
CPI TM15 SFSO1
Sources: SFSO, SNB
Chart 4.3
cpi: domestic goods and servicesYear-on-year change
%
–3
–2
–1
0
1
2
3
4
2009 2010 2011 2012 2013
GoodsPriv. services excl. rents
RentsPub. services
Sources: SFSO, SNB
Chart 4.2
cpi: domestic and imported goods andservicesYear-on-year change
%
–8
–6
–4
–2
0
2
4
2009 2010 2011 2012 2013
TotalDomestic
ImportedImported excluding oil
Sources: SFSO, SNB
Chart 4.1
21Quarterly Bulletin 3 / 2013 September
real estate prIces
Slower rise in residential property prices in second quarterThe rise in prices for residential property slowed in the second quarter. However, according to the various indices, prices remained between 5% and 12% (for owner-occupied apartments) and 3% and 7% (for single-family homes) above their year-earlier levels.
According to the Wüest & Partner index, prices for owner-occupied apartments remained unchanged quarter-on-quarter. The Fahrländer Partner and IAZI indices increased further, although the rise was more moderate than in the previous quarters (cf. chart 4.5).
The picture presented by the various indices for single-family homes is less uniform. According to Fahrländer Partner, prices persisted at the same level as the previous quarter, while IAZI indicated only a slight rise. The Wüest & Partner index, by contrast, showed continued strong growth.
Divergence between asking and existing rentsRents recorded by Wüest & Partner for apartments offered on the market (asking rents) rose further in the second quarter. Annual inflation for these rents was therefore once again significantly higher than for rents under existing contracts. The rental component of the CPI, which is dominated by existing rents, is still at the same level as a year previously (cf. chart 4.6).
Rents for existing contracts are tied by law to the reference interest rate. With the lowering of this rate on 2 September 2013, it is likely that, in the coming months too, the CPI’s rental component will not keep pace with movements in asking rents, despite annual rent inflation having increased in August to 0.9% (cf. table 4.1).
transaction prices, owner-occupiedapartmentsNominal (hedonic), beginning of period = 100
Index
80
100
120
140
160
180
2004 2005 2006 2007 2008 2009 2010 2011 2012 2013
Wüest & Partner Fahrländer Partner IAZI
Sources: Fahrländer Partner, IAZI, Wüest & Partner
Chart 4.5
producer and import pricesYear-on-year change
%
–12
–10
–8
–6
–4
–2
0
2
4
2009 2010 2011 2012 2013
Total Producer prices Import prices
Source: SFSO
Chart 4.4
apartment rents and reference interestrateNominal, year-on-year change (lhs)
% %
–1
0
1
2
3
4
5
2009 2010 2011 2012 2013
2.00
2.25
2.50
2.75
3.00
3.25
3.50
Existing rents Asking rentsReference interest rate for mortgages (rhs)
Sources: Federal Office for Housing (FOH), SFSO, Wüest & Partner
Chart 4.6

22 Quarterly Bulletin 3 / 2013 September
InflatIon eXpectatIons
Inflation expectations remain lowSurveys conducted among households and experts suggest that short-term inflation expectations will remain unchanged or increase slightly. According to these surveys, the expected rate of inflation will stay at a low level.
The quarterly survey conducted by SECO in July shows that 50% of households surveyed expected prices to rise moderately, while 6% anticipated a strong rise in prices. These proportions are up on the April survey. The proportion of respondents expecting prices to either remain stable or fall decreased accordingly (cf. chart 4.7).
According to the Credit Suisse ZEW Financial Market Report, the majority of financial analysts surveyed in August (71%) predicted that annual inflation rates would stay unchanged at a low level for the next six months. A further 26% expected inflation rates to climb in this period, while only very few analysts predicted declining rates.
Information on quantitative inflation expectations is provided by the talks held by the SNB delegates for regional economic relations with companies from all sectors of the economy as well as by the CFO survey conducted by Deloitte. The talks held in the third quarter by SNB delegates indicate that inflation expectations over a six to twelve-month horizon were slightly higher than in the previous quarter, at 0.5%. The survey by Deloitte in the second quarter showed that inflation was expected to amount to 1.2% in two years.
price expectationsSurvey on expected movements in prices for coming 12 months
%
0
10
20
30
40
50
60
2009 2010 2011 2012 2013
DecreaseUnchanged
Modest increaseStrong increase
Sources: SECO, SNB
Chart 4.7

23Quarterly Bulletin 3 / 2013 September
5 Monetary developments
Compared to the second quarter, long-term interest rates rose significantly in Switzerland, as in other larger economies. This increase was linked to expectations that monetary policy in the US would be somewhat less expansionary. While short-term interest rates remained unchanged, both bond yields and interest rates on mortgage loans with longer maturities were up.
The rise in long-term interest rates had an impact on growth in the money supply, which eased slightly at a high level. However, growth in lending remained strong, reflecting the fact that interest rates are still extremely low in historical terms.
Since the last monetary policy assessment, the Swiss franc exchange rate has changed little. The negative yields on Confederation money market debt register claims suggest substantial demand for secure investments persists. Interest rates in the secured money market are still negative. The value of the Swiss franc remains high.
sUmmary of monetary polIcy sInce the last assessment
Continuation of the monetary policy announced in September 2011In the past quarter, the SNB maintained unchanged the monetary policy which it announced in September 2011 and has reiterated at subsequent assessments. On 6 September 2011, the SNB set a minimum exchange rate of CHF 1.20 to the euro. In August that year, it had already narrowed the target range for the three-month Libor to 0.0 – 0.25%.
Sight deposits at the SNB virtually unchangedSince the June monetary policy assessment, total sight deposits held with the SNB have remained almost unchanged. In the week ending 13 September 2013 (final calendar week before the mid-September assessment), they totalled CHF 369.5 billion, compared to CHF 370.7 billion in the final calendar week before the mid-June assessment. Between the assessments in mid-June and mid-September, they averaged CHF 370.1 billion. Of this amount, CHF 318.0 billion was accounted for by the domestic banks’ sight deposits and the remaining CHF 52.1 billion by other deposits at sight.
On 26 June 2013, PostFinance Ltd was granted a banking licence, and since then its sight deposit account has been reported under domestic banks’ sight deposits rather than other Swiss franc deposits at sight, as previously. Consequently domestic banks’ sight deposits have risen, mainly at the expense of other deposits at sight, while total sight deposits have remained largely unchanged (cf. ‘Monetary and credit aggregates’, pp. 27 – 29).
Banks’ surplus reserves remain highStatutory minimum reserves averaged CHF 14.5 billion between 20 May and 19 August 2013. This represents an increase of 7.8% over the previous period (20 February 2012 to 19 May 2013), which is partly attributable to the fact that PostFinance is now subject to minimum reserve requirements. On average, banks exceeded the requirement by some CHF 297.6 billion (previous period: CHF 274.9 billion). Thus, banks’ surplus reserves have remained exceptionally high.

24 Quarterly Bulletin 3 / 2013 September
money and capItal market Interest rates
Money market rates remain lowThe situation on the money market has hardly changed since the monetary policy assessment in June. The supply of liquidity has remained high, and this is reflected both in the minimal trading volume and in the low money market interest rates (cf. chart 5.1). Thus the three-month Libor amounted to two basis points in mid-September. In the secured money market, interest rates remained negative. For money market debt register claims, too, yields at issue were still in negative territory, although they nudged up by a few basis points.
Higher long-term interest ratesDuring the course of the third quarter, yields on long-term government bonds increased. This rise reflects, first and foremost, expectations of a less expansionary monetary policy in the US. It occurred in all major economies apart from Japan. In mid-September, yields on ten-year Swiss Confederation bonds reached a level of around 1.2%, a significant advance of 0.3 percentage points compared to the previous quarter. In historical terms, the level is still low.
Steeper yield curveCombined with the stable short-term interest rates, the higher long-term interest rates resulted in a steeper yield curve (cf. chart 5.2). The spread between the yield on ten-year Confederation bonds and the three-month Libor was around 1.2 percentage points in mid-September, compared with 0.9 percentage points in mid-June.
Slightly higher real interest ratesWith long-term inflation expectations unchanged, the increase in long-term interest rates led to higher long-term real interest rates. The estimated ten-year real interest rates shown in chart 5.3 rose by some 0.4 percentage points compared to the previous quarter, to 0.7%. Calculation of these real interest rates is based on the ten-year yield on Confederation bonds and the estimated inflation expectations for the same time horizon, determined using a VAR model.
money market rates
%
–0.75
–0.50
–0.25
0.00
0.25
0.50
0.75
1.00
2009 2010 2011 2012 2013
3M LiborTarget range
SNB repo rateSNB reverse repo rate
Sources: Bloomberg, Reuters, SNB
Chart 5.1
estimated real interest rate10-year Confederation bondsInflation expectations estimated with VAR model
%
0.00
0.25
0.50
0.75
1.00
1.25
1.50
1.75
2009 2010 2011 2012 2013
Source: SNB
Chart 5.3
term structure of swiss confederationbondsAfter Nelson-Siegel-Svensson. Years to maturity (hor. axis)
%
–0.25
0.00
0.25
0.50
0.75
1.00
1.25
1.50
1.75
0 5 10 15 20
Mid-September 2013Mid-June 2013
Mid-March 2013
Source: SNB
Chart 5.2

25Quarterly Bulletin 3 / 2013 September
eXchange rates
Swiss franc temporarily weaker against euro and US dollarMarket expectations about the future policy of the major central banks have had a strong impact on exchange rate movements since the monetary policy assessment in mid-June. In an environment of speculation about a possible reduction in securities purchases by the Federal Reserve, the Swiss franc weakened against the US dollar as well as, to a lesser extent, against the euro at the end of June and beginning of July. However, this did not persist, and by mid-September, the Swiss franc was again trading close to its mid-June level against the US dollar and the euro (cf. chart 5.4).
Monetary conditions largely unchangedSimilar to the nominal external value of the Swiss franc, short-term interest rates have hardly changed by comparison with the mid-June level. As a result, monetary conditions as measured by the Monetary Conditions Index (MCI) have remained largely unchanged.
The MCI shown in chart 5.5 combines changes in the three-month Libor with the nominal export-weighted external value of the Swiss franc. To take account of uncertainty regarding the relative impact of changes in interest rates and exchange rates, two different weightings are used for the MCI (3:1 and 5:1). The index is reset to zero at the time of the most recent monetary policy assessment, so a negative MCI value signifies an easing of monetary conditions.
Real external value of Swiss franc still at a high levelIn August, the real export-weighted external value of the Swiss franc was at the same level as in the year-back month (cf. chart 5.6). It thus remains well above the long-term average. Consequently, the Swiss franc is still high.
exchange rates
0.7
0.8
0.9
1.0
1.1
1.2
1.3
2009 2010 2011 2012 2013
1.0
1.1
1.2
1.3
1.4
1.5
1.6
USD in CHF EUR in CHF (rhs)
Source: SNB
Chart 5.4
external value of swiss francExport-weighted, January 1999 = 100
Index
90
95
100
105
110
115
120
125
130
135
2004 2005 2006 2007 2008 2009 2010 2011 2012 2013
In real terms (24 countries)
Source: SNB
Chart 5.6
mci nominal
–0.8
–0.6
–0.4
–0.2
0.0
0.2
0.4
0.6
Apr 13 May Jun Jul Aug Sep
MCI 3:1 MCI 5:1
Source: SNB
Chart 5.5
26 Quarterly Bulletin 3 / 2013 September
stock markets
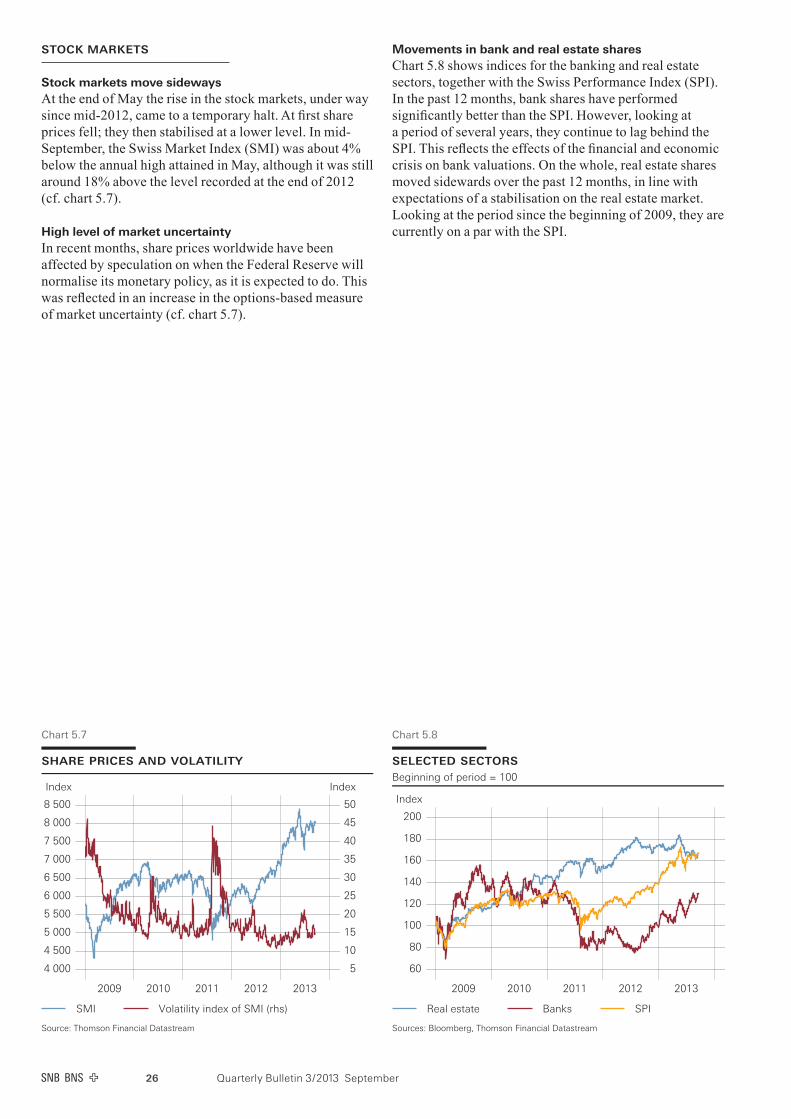
Stock markets move sideways At the end of May the rise in the stock markets, under way since mid-2012, came to a temporary halt. At first share prices fell; they then stabilised at a lower level. In mid-September, the Swiss Market Index (SMI) was about 4% below the annual high attained in May, although it was still around 18% above the level recorded at the end of 2012 (cf. chart 5.7).
High level of market uncertaintyIn recent months, share prices worldwide have been affected by speculation on when the Federal Reserve will normalise its monetary policy, as it is expected to do. This was reflected in an increase in the options-based measure of market uncertainty (cf. chart 5.7).
Movements in bank and real estate sharesChart 5.8 shows indices for the banking and real estate sectors, together with the Swiss Performance Index (SPI). In the past 12 months, bank shares have performed significantly better than the SPI. However, looking at a period of several years, they continue to lag behind the SPI. This reflects the effects of the financial and economic crisis on bank valuations. On the whole, real estate shares moved sidewards over the past 12 months, in line with expectations of a stabilisation on the real estate market. Looking at the period since the beginning of 2009, they are currently on a par with the SPI.
share prices and volatility
Index Index
4 000
4 500
5 000
5 500
6 000
6 500
7 000
7 500
8 000
8 500
2009 2010 2011 2012 2013
5
10
15
20
25
30
35
40
45
50
SMI Volatility index of SMI (rhs)
Source: Thomson Financial Datastream
Chart 5.7
selected sectorsBeginning of period = 100
Index
60
80
100
120
140
160
180
200
2009 2010 2011 2012 2013
Real estate Banks SPI
Sources: Bloomberg, Thomson Financial Datastream
Chart 5.8
27Quarterly Bulletin 3 / 2013 September
monetary and credIt aggregates
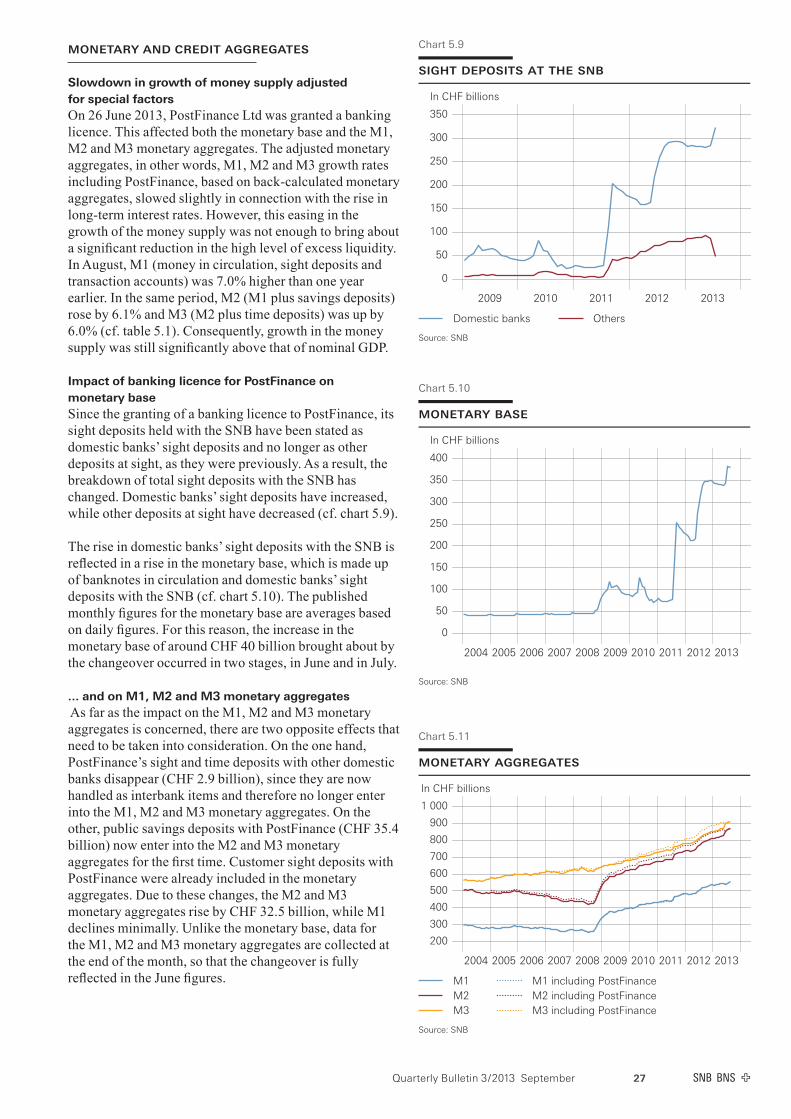
Slowdown in growth of money supply adjusted for special factors On 26 June 2013, PostFinance Ltd was granted a banking licence. This affected both the monetary base and the M1, M2 and M3 monetary aggregates. The adjusted monetary aggregates, in other words, M1, M2 and M3 growth rates including PostFinance, based on back-calculated monetary aggregates, slowed slightly in connection with the rise in long-term interest rates. However, this easing in the growth of the money supply was not enough to bring about a significant reduction in the high level of excess liquidity. In August, M1 (money in circulation, sight deposits and transaction accounts) was 7.0% higher than one year earlier. In the same period, M2 (M1 plus savings deposits) rose by 6.1% and M3 (M2 plus time deposits) was up by 6.0% (cf. table 5.1). Consequently, growth in the money supply was still significantly above that of nominal GDP.
Impact of banking licence for PostFinance on monetary baseSince the granting of a banking licence to PostFinance, its sight deposits held with the SNB have been stated as domestic banks’ sight deposits and no longer as other deposits at sight, as they were previously. As a result, the breakdown of total sight deposits with the SNB has changed. Domestic banks’ sight deposits have increased, while other deposits at sight have decreased (cf. chart 5.9).
The rise in domestic banks’ sight deposits with the SNB is reflected in a rise in the monetary base, which is made up of banknotes in circulation and domestic banks’ sight deposits with the SNB (cf. chart 5.10). The published monthly figures for the monetary base are averages based on daily figures. For this reason, the increase in the monetary base of around CHF 40 billion brought about by the changeover occurred in two stages, in June and in July.
... and on M1, M2 and M3 monetary aggregates As far as the impact on the M1, M2 and M3 monetary aggregates is concerned, there are two opposite effects that need to be taken into consideration. On the one hand, PostFinance’s sight and time deposits with other domestic banks disappear (CHF 2.9 billion), since they are now handled as interbank items and therefore no longer enter into the M1, M2 and M3 monetary aggregates. On the other, public savings deposits with PostFinance (CHF 35.4 billion) now enter into the M2 and M3 monetary aggregates for the first time. Customer sight deposits with PostFinance were already included in the monetary aggregates. Due to these changes, the M2 and M3 monetary aggregates rise by CHF 32.5 billion, while M1 declines minimally. Unlike the monetary base, data for the M1, M2 and M3 monetary aggregates are collected at the end of the month, so that the changeover is fully reflected in the June figures.
sight deposits at the snb
In CHF billions
0
50
100
150
200
250
300
350
2009 2010 2011 2012 2013
Domestic banks Others
Source: SNB
Chart 5.9
monetary base
In CHF billions
0
50
100
150
200
250
300
350
400
2004 2005 2006 2007 2008 2009 2010 2011 2012 2013
Source: SNB
Chart 5.10
monetary aggregates
In CHF billions
200
300
400
500
600
700
800
900
1 000
2004 2005 2006 2007 2008 2009 2010 2011 2012 2013
M1M2M3
M1 including PostFinanceM2 including PostFinanceM3 including PostFinance
Source: SNB
Chart 5.11

28 Quarterly Bulletin 3 / 2013 September
M1, M2 and M3 monetary aggregates with PostFinance for the period before June 2013The rise in the M2 and M3 monetary aggregates in June is due to a statistical effect without any economic consequences. It therefore makes sense to describe movements in the monetary aggregates using adjusted time series including PostFinance, as was done at the beginning of this chapter. The adjusted monthly series for the period from January 2005 to May 2013 may be found in table B2a of the Monthly Statistical Bulletin, available at www.snb.ch, Publications, Statistical Publications.
Chart 5.11 shows that movements before June 2013 in the adjusted M2 and M3 series including PostFinance were similar to those in the unadjusted series, and that the differences between them were relatively minor. However, the break in the unadjusted series in June 2013 results in growth rates for M2 and M3 that are unsuitable for assessing developments in the money supply. In the case of M1, there is no visible break, due to the fact that customer sight deposits at PostFinance were already included before the banking licence was granted.
Continued strong growth in mortgage lendingIn the second quarter, Swiss franc bank lending was 3.5% above the year-back level (Q1: 3.8%). This slowdown in lending growth is attributable to other loans (in other words, those not secured by mortgages). The strong growth in mortgage lending continued (cf. table 5.1).
Table 5.1
monetary aggregates and bank loansYear-on-year change in percent
2012 2012 2013 2013
Q3 Q4 Q1 Q2 June July August
M1 (incl. PostFinance) 1 11.8 12.6 11.2 11.5 11.0 8.1 7.3 7.0
M2 (incl. PostFinance) 1 10.3 11.0 10.0 10.1 9.4 7.2 6.5 6.1
M3 (incl. PostFinance) 1 9.6 10.5 10.5 10.2 9.3 7.3 6.5 6.0
Bank loans total 2, 4 3.9 3.7 4.0 3.8 3.5 3.6 3.9
Mortgage claims 2, 4 4.8 4.6 4.5 4.5 4.6 4.5 4.6
Households 3, 4 4.9 4.8 4.5 4.2 4.1 4.0 4.0
Private companies 3, 4 4.9 4.4 4.9 5.5 6.4 6.6 6.7
Other loans 2, 4 –0.1 –0.8 1.6 0.4 –1.5 –1.0 0.3
Secured 2, 4 3.0 3.2 7.9 5.1 2.2 2.0 0.3
Unsecured 2, 4 –2.0 –3.2 –2.3 –2.6 –3.9 –2.8 0.2
1 On 26 June 2013, PostFinance was granted a banking licence. The growth rates are based on monetary aggregate figures adjusted retroactively for the period January 2005 toMay 2013 (cf.Monthly Statistical Bulletin, table B2a online, and ’Information on SNB statistics’,August 2013, p.III).
2 Monthly balance sheets.3 Credit volume statistics.4 Growth rates for the bank loans item and for its components include information provided by banks on changes in their classificationpractices. Consequently, they may deviate
from growth rates published in theMonthly Bulletin of Banking Statistics.
Source: SNB

29Quarterly Bulletin 3 / 2013 September
Since the beginning of the financial and economic crisis, the volume of other loans has shown a flat path, after having grown strongly in the economic boom of the years prior to the crisis. Since other loans are usually highly cyclical, this development is in line with a subdued level of economic activity. In the second quarter, other loans in Swiss francs contracted by 1.0% compared to the year-back quarter. The breakdown of other loans into secured and unsecured loans shows a slight rise in secured loans since 2009, while unsecured loans registered a slight decrease (cf. chart 5.12).
In the second quarter, mortgage claims, which account for four-fifths of total bank lending, increased by 4.6% compared to the year-back quarter. Despite the recent increase in mortgage rates, the level of interest rates remains very low in historical terms and this continues to boost the rise in mortgage lending. The strong growth originates from domestically-focused banks, in particular (cf. chart 5.13).
Countercyclical capital buffer activatedOn 13 February 2013, for the first time, the Federal Council made use of the possibility foreseen in the Capital Adequacy Ordinance (CAO) and activated the countercyclical capital buffer (CCB) on the proposal of the SNB. The CCB must be held from 30 September 2013. The SNB hopes that the activation of the CCB will, first and foremost, improve the banking sector’s resilience. However, it should also help to counter a further build-up of imbalances in the mortgage and real estate markets.
Increasing imbalances in mortgage and real estate marketsOn the basis of the developments during the past quarters, it is evident that, despite occasional encouraging signs, the all-clear cannot be given. Growth in mortgage lending remains high and significantly exceeds that of nominal GDP. Although the rates of growth for mortgage lending to households are down, those for companies outside the financial industry have advanced (cf. chart 5.14). Moreover, real estate prices, which were already elevated, have risen to an even higher level. As a result, the imbalances on the mortgage and real estate markets have increased further.
growth of mortgages by bank categoriesYear-on-year change
%
0
2
4
6
8
10
2004 2005 2006 2007 2008 2009 2010 2011 2012 2013
Big banksCantonal banks
Raiffeisen banksOther banks
Source: SNB
Chart 5.13
mortgages by sectorsUtilisation, year-on-year change
%
3.0
3.5
4.0
4.5
5.0
5.5
6.0
6.5
2009 2010 2011 2012 2013
Households Non-financial corporations
Source: SNB
Chart 5.14
mortgage claims and other loans
In CHF billions In CHF billions
675
700
725
750
775
800
825
850
875
2009 2010 2011 2012 2013
50
60
70
80
90
100
110
120
130
Mortgage claims Other loans, unsecured (rhs)Other loans, secured (rhs)
Source: SNB
Chart 5.12

Business cycle trendsSNB regional network
Report for the attention of the Governing Board of the Swiss National Bank for its quarterly assessment of September 2013
Third quarter of 2013 The Swiss National Bank’s delegates for regional economic relations are constantly in touch with companies from different areas of the economy. This report is based on discussions conducted in July and August 2013 with 203 managers and entrepreneurs on the current and future situation of their companies and on the economy in general. The selection of companies differs from one quarter to the next. It reflects the industrial structure of the Swiss economy, based on the breakdown of the GDP (excluding agriculture and public services).
Regions Delegates Central Switzerland Walter Näf Eastern Switzerland Jean-Pierre Jetzer Geneva Jean-Marc Falter Italian-speaking Switzerland Fabio Bossi Mittelland Martin Wyss Northwestern Switzerland Daniel Hanimann Vaud-Valais Aline Chabloz Zurich Markus Zimmerli
31Quarterly Bulletin 3 / 2013 September
sUmmary
According to this survey, growth in Switzerland was robust in the third quarter of 2013, and was broad-based in terms of sector. Momentum in manufacturing gained markedly, which showed itself in greater utilisation.
Exporters reported a brisk level of demand from the US. The relatively favourable economic situation in Switzerland had a stimulating effect. By contrast, demand from Europe – except Germany – was lacking again. The minimum exchange rate against the euro, as a stabilising factor for business planning, continued to be appreciated.
While margins were lower than usual in all three sectors, the large number of streamlining measures effected recently are having a beneficial impact, particularly in manufacturing. Demand for labour increased only slightly compared with the previous quarter.
The outlook for real growth in turnover over the next few months remains cautiously optimistic in all industries. The demand for staff is likely to rise slightly. Investment is expected to continue at the same level.
Latent uncertainty about economic and financial developments in Europe remains, but has decreased further. Entrepreneurs also believe that various political initiatives in Switzerland are adding an element of uncertainty with regard to future regulations.
bUsIness actIVIty
Manufacturing: Noticeable improvementManufacturing saw a noticeable improvement in business activity both quarter-on-quarter and year-on-year. Half of the companies surveyed posted higher sales than in the previous quarter, while turnover remained the same at around 40% of the companies.
A significant upturn in business was reported by representatives of the chemical industry and manufacturers of basic metals. Pharmaceutical companies and manufacturers of precision instruments also saw greater turnover in comparison to the previous quarter. Business activity in the food and machinery industries was flat.
Domestic demand remained high. Exporters continued to be seriously affected by the recession in southern Europe. Demand from the rest of Europe, too, remained subdued, while demand from the US, South America, Russia, and – slightly below previous levels – from Asia acted as a stimulus. Some sectors also benefited from high demand from South Africa and Australia.
Construction: Continued momentumIn real terms, turnover in construction again rose significantly compared with the previous quarter, and was also much higher than a year ago. Both the ongoing brisk level of demand and, in comparison to the previous quarter, ideal weather conditions contributed to the good business results. About half the companies surveyed reported a quarter-on-quarter rise in seasonally adjusted turnover, while the other half stated that turnover was unchanged from the previous quarter.
The momentum of business activities in structural engineering was very lively. Civil engineering and the finishing trade also reported turnover well in excess of the previous and year-back periods. Whereas residential construction remained brisk, commercial and industrial construction activity continued to be modest. Only a few respondents referred to real estate risks.
Services: Moderate growthThe services sector continued to report moderate growth spanning a wide range of industries. About 40% of the companies surveyed reported a rise in turnover, with another 40% stating that turnover was unchanged from the previous quarter.
Companies in the following sectors reported a relatively good level of business momentum: IT, hospitality, transport, facility management services, auditing, and staff recruitment. In wholesale and retail, momentum was less pronounced than in the previous quarter. Cross-border shopping continued to be an issues in some border regions. Furthermore, businesses felt the effect of increasing online purchases.

Quarterly Bulletin 3 / 2013 September32
Companies from the advertising industry and individual vehicle traders reported little change in business activity compared with the previous quarter. Banks only saw a minimal rise in comparison to the previous quarter, but a noticeable improvement year-on-year. This growth was driven by both interest differential business and commission income. However, various industries still feel the impact of the banks’ cost saving efforts on their business. Change in the banking sector is continuing.
The excellent weather conditions had a positive impact on mountain resorts that are highly dependent on day trippers. The demand from Swiss residents and tour groups from Asia and the Arab countries was particularly buoyant. There was a tentative increase in the number of guests from Europe. Hospitality overall continued to see the slightly improved business momentum that began in the previous quarter. However, industry representatives continue to describe business as very volatile. Structural changes in the form of modernisation and consolidation are expected to continue in this sector, too.
The majority of respondents from all three sectors did not consider the banks' lending policies to be a limiting factor.
capacIty UtIlIsatIon
On balance, utilisation of production capacity and infrastructure was again judged to be normal. Within the industries, capacity utilisation remained rather uneven.
Companies in the manufacturing industry rated their overall capacity utilisation as slightly greater than normal, which represents an appreciable increase compared with the previous quarter. A relatively high level was reported in the chemical and pharmaceutical industries, in watchmaking and precision instruments, as well as in metal processing. Capacity utilisation in the machine industry remained lower than normal.
In construction, utilisation of technical capacities was generally higher than otherwise normal for this time of year. This applied not only to companies in structural and civil engineering but also to the finishing trade. In many cases, order books are already full for months ahead.
In the services sector, utilisation of infrastructure (i.e. primarily office and retail space, as well as transport capacity) was again reported to be at a normal level overall. The transport sector as well as architectural and engineering firms reported high levels of utilisation. In contrast, relatively low levels of capacity utilisation were reported by various wholesalers, and also by banks. Representatives from recruitment agencies, tour operators and hotels reported normal levels of capacity utilisation.
demand for laboUr
Slightly greater demand for staffThe overall demand for labour increased slightly. Changes in staffing policy were only mentioned in individual cases, especially by export-oriented companies catering to specific foreign markets currently in recession. Wherever possible, the number of temporary staff is adjusted first when it comes to coping with a change in demand. There are still marked differences between the various industries in their assessment as to whether their staffing level is appropriate.
The manufacturing companies surveyed felt that their headcounts corresponded almost exactly to requirements. Manufacturers of precision instruments continued to assess their headcounts as on the low side; companies in metal processing and the pharmaceutical industry came to same conclusion. Businesses in the food industry, as well as plastics manufacturers and furniture makers, stated that headcounts were more or less in line with requirements, whereas companies in the machine and textile industries considered themselves somewhat overstaffed.
The construction industry continued to report that its headcounts were generally rather low in all segments. Management and specialists are still sought after.
In the services sector, staff levels were considered appropriate overall. IT companies, in particular, again stated that staff levels were somewhat low. Architectural and engineering firms as well as facility management services also indicated recruitment needs. The market for engineers is particularly sparse, with companies actively recruiting from one another. Wholesalers and retailers as well as the transport industry reported appropriate staffing levels.
Continued high level of spontaneous job applicationsOverall, the companies surveyed considered the process of recruiting staff to be roughly as challenging and time-consuming as before. In many cases, the required personnel can still only be found abroad. Many respondents mentioned a continued high level of spontaneous job applications, especially from southern Europe. Furthermore, a significantly larger number of applicants are responding to recruitment advertisements.
Wood and paper processing firms, companies in the mechanical and civil engineering industries, wholesalers, restaurants and the advertising industry were finding the recruitment process somewhat easier than usual. Recruitment was perceived anew as rather more difficult for the IT industry in particular, and continuously so for architectural and engineering firms.
Quarterly Bulletin 3 / 2013 September 33
prIces, margIns and earnIngs sItUatIon
Margins slightly lower than usualOne-third of the companies surveyed reported margins as being slightly lower than usual overall, and one-quarter recorded higher margins than normal. Margins in manufacturing and services are still rated as somewhat narrower than usual, albeit to a lesser extent than in the previous quarter. Many companies are continuing to optimise costs and raise efficiency, however an increasing number of respondents reported that such crisis-related measures have now largely been implemented. Margins are most commonly improved with new products, services and client segments, and also the opening of new markets. Price increases are also possible in some cases. Numerous companies from all three sectors of the economy stressed the stabilising effect the minimum exchange rate against the euro has had for their companies, whether for invoicing, budgeting, or planning in general.
In manufacturing, profit margins in many areas are lower than usual. This applies, in particular, to the metals processing and machine industries and to plastics processing firms. Furniture manufacturers are also reporting lower-than average margins. By contrast, margins are relatively good for firms producing precision instruments. The exchange rate problem still poses a challenge for some manufacturing firms, especially as demand in some specific target markets has weakened. These companies expect purchase and sale prices to remain stable in the coming months.
In construction, companies in structural engineering and the finishing trade reported normal margins, while companies in civil engineering recorded lower than average margins. As the next few months are expected to see the cost of construction materials to remain stable, and a slight decrease in construction prices is anticipated, pressure on margins could rise somewhat.
In the services sector, most industries were again confronted with unusually low margins. The worst-affected were various wholesalers, partly due to diverging purchase and sale prices. The situation in the hotel industry overall, and also in banking, has improved, with both reporting normal margins. Retailers also state that their margin situation has remained normal.
oUtlook
Confident optimism Uncertainty over future developments has decreased slightly overall since the last survey. The somewhat more favourable economic outlook for Europe gave companies a certain degree of hope. Respondents remain confident about developments in demand in other parts of the world and in Switzerland. What continues to be unclear, however, is the sustainability of solutions to the European debt crisis. A relatively large number of companies surveyed mentioned the numerous political initiatives within Switzerland and the increasingly complex regulatory environment as adding a slight degree of uncertainty to future business conditions.
Overall, companies in all three sectors expect turnover to rise in the next six months. Corporate recruitment plans also envisage a slight increase in headcounts over this time horizon. In this regard, the position remains practically unchanged from that in the previous quarter.
In manufacturing, companies continue to be confident about their business outlook: representatives from almost all industries are anticipating slight rises in turnover over the next six months, only some individual companies are expecting flat growth.
In construction, seasonally adjusted turnover should continue to rise slightly over the next few months, as should capacity utilisation and the number of staff employed. This industry remains optimistic overall and is not expecting a significant downturn in the current year. However, individual companies in civil engineering expect their turnover and capacity utilisation to decline. This reflects an accumulation of projects waiting to be approved, but also a certain level of caution by the public sector in order to save money.
Services sector companies surveyed are also generally upbeat about their business outlook for the next six months. As in the previous quarter, no segment is forecasting a downturn in turnover within this time horizon.
Both capacity utilisation and headcounts can be expected to rise slightly again in the services sector over the next few months. Companies’ investment plans in all three sectors for the year ahead suggest that these expenditures will increase only very slightly. The industry’s investment projects are marginally less restrictive than previously.

Chronicle of monetary events
The chronicle summarises the most recent monetary events. For events dating further back, please refer to SNB press releases and the Annual Report at www.snb.ch.
35Quarterly Bulletin 3 / 2013 September
At its quarterly assessment of 19 September, the SNB reaffirms that it will maintain the minimum exchange rate of CHF 1.20 per euro. The SNB continues to stand ready to enforce the minimum exchange rate, if necessary, by buying foreign currency in unlimited quantities, and to take further measures as required. In the view of the SNB, the Swiss franc is still high. The minimum exchange rate prevents an undesired tightening of monetary conditions were the upward pressure on the Swiss franc to intensify once again. The target range for the three-month Libor will stay at 0.0 – 0.25%.
At its quarterly assessment of 20 June 2013, the SNB reaffirms that it will maintain the minimum exchange rate of CHF 1.20 per euro. In the view of the SNB, the Swiss franc is still high. The minimum exchange rate remains important in order to avoid an undesirable tightening of monetary conditions in the event of sudden upward pressure on the Swiss franc. The SNB continues to stand ready to enforce the minimum exchange rate, if necessary, by buying foreign currency in unlimited quantities, and to take further measures as required. The target range for the three-month Libor remains unchanged at 0.0 – 0.25%.
At its quarterly assessment of 14 March 2013, the SNB reaffirms that it will continue to enforce the minimum exchange rate of CHF 1.20 per euro with the utmost determination and will, if necessary, buy foreign currency in unlimited quantities for this purpose. The minimum exchange rate is an important instrument in avoiding an undesirable tightening of monetary conditions. The Swiss franc is still high. The target range for the three-month Libor remains unchanged at 0.0 – 0.25%. The SNB stands ready to take further measures at any time.
On 13 February 2013, the Federal Council activates the countercyclical capital buffer, following the SNB’s proposal. This move is in reaction to the growing imbalances on the mortgage and real estate markets. The level of the capital buffer is set at 1% of risk-weighted mortgage loans financing residential property located in Switzerland. The deadline for compliance by the relevant banks is 30 September 2013.
At its quarterly assessment of 13 December 2012, the SNB reaffirms that it will continue to enforce the minimum exchange rate of CHF 1.20 per euro with the utmost determination and is prepared to buy foreign currency in unlimited quantities for this purpose. Even at the current rate, the SNB considers the Swiss franc to be still high. The SNB is leaving the target range for the three-month Libor unchanged at 0.0 – 0.25%. If necessary, it stands ready to take further measures at any time.
At its quarterly assessment of 13 September 2012, the SNB reaffirms that it will maintain the minimum exchange rate of CHF 1.20 per euro and will enforce it with the utmost determination. It remains prepared to buy foreign currency in unlimited quantities for this purpose. In the view of the SNB, the Swiss franc is still high and is weighing on the Swiss economy. The target range for the three-month Libor remains unchanged at 0.0 – 0.25%. If necessary, the SNB stands ready to take further measures at any time.
September 2013
June 2013
March 2013
February 2013
December 2012
September 2012

Published by Swiss National Bank Economic Affairs Börsenstrasse 15 P.O. Box CH-8022 Zurich
Design Interbrand Ltd, Zurich
Typeset and printed by Neidhart + Schön AG, Zurich
Language versions: The Quarterly Bulletin is available in printed form in German (ISSN 1423–3789) and French (ISSN 1423–3797).
The Quarterly Bulletin can also be downloaded from the SNB website in the following language versions: English: www.snb.ch, Publications, Quarterly Bulletin (ISSN 1662–257X) German: www.snb.ch, Publikationen, Quartalsheft (ISSN 1662–2588) French: www.snb.ch, Publications, Bulletin trimestriel (ISSN 1662–2596) Italian (Business cycle trends): www.snb.ch, Pubblicazioni, Pubblicazioni economiche, Bollettino trimestrale
Website www.snb.ch
Copyright © The Swiss National Bank (SNB) respects all third-party rights, in particular rights relating to works protected by copyright (information or data, wordings and depictions, to the extent that these are of an individual character).
SNB publications containing a reference to a copyright (© Swiss National Bank/SNB, Zurich/year, or similar) may, under copyright law, only be used (reproduced, used via the internet, etc.) for non-commercial purposes and provided that the source is mentioned. Their use for commercial purposes is only permitted with the prior express consent of the SNB.
General information and data published without reference to a copyright may be used without mentioning the source.
To the extent that the information and data clearly derive from outside sources, the users of such information and data are obliged to respect any existing copyrights and to obtain the right of use from the relevant outside source themselves.
Limitation of liability The SNB accepts no responsibility for any information it provides. Under no circumstances will it accept any liability for losses or damage which may result from the use of such information. This limitation of liability applies, in particular, to the topicality, accuracy, validity and availability of the information. © Swiss National Bank, Zurich/Berne 2013


Qu
arte
rly
Bu
lleti
n
3 / 2
013
S
epte
mb
er