Quarterly Assessment of Macroeconomic Developments No. 35 ...
15
Quarterly Assessment of Macroeconomic Developments No. 35, Q II/2021 1 Summary The easing of containment measures as a result of the progress marked in managing the pandemic that was accompanied by mass vaccination and declining of the infection rates, was reflected in the economic recovery in the euro area. In Q2 2021, economic activity was characterized by real annual growth of 13.7%, from the decline recorded in the previous quarter of 1.3%. The second quarter of 2021 was also positively affected by the increase in external demand and significant fiscal stimulus. Also the region countries started with an economic recovery, after being affected by the Covid-19 pandemics. In Q1 2021, estimates suggest that the region countries were characterized with an average economic growth of 0.9%, while the IMF forecasts for the whole year of 2021 suggest an increase in economic activity of 5.1% for the region. Kosovo’s economy is also estimated to have been recovered in the first half of 2021, being attributed to the easing of restrictive measures as a result of the improvement of the health crisis in this period. According to KAS estimates, real GDP in Q1 2021 has marked an accelerated growth of 5.6%, an increase that is estimated to have continued also in Q2 2021. These estimates are based on increased exports of goods and services, consumption and public investments, remittances, as well as increased industrial production and retail trade. Consumer prices and other price indexes have marked high increase in the first half of 2021. However, the increase in prices turns out to be driven by temporary internal and external factors that are mainly attributed to the effect of recovery from the pandemic crisis (details in box no. 1). The increase of the economic activity in the reporting period was accompanied by an improvement of the budget revenues performance. Budget revenues, in Q2 2021, marked an increase of 45.3%, while budget expenditures marked a decline of 4.6%, making the Kosovo budget record a primary surplus of EUR 46.9 million. Public debt has continued with double-digit annual growth of 24.3% and has reached the value of EUR 1.6 billion, while as a percentage of GDP, it has reached 23.2% in Q2 2021. Against the previous year, financial system expanded with an accelerated pace, primarily being supported by the developments in the banking and pension sector. Assets of financial system reached the value of EUR 8.3 billion, in Q2 2021. In the banking sector, the activity was supported by the growth of lending and deposits, while the growth recorded in the pension sector was attributed to the increase of contributions collected from contributors and the positive return on investments. The current account deficit has doubled in Q2 2021, mainly due to the increase in the goods deficit and the decline in the positive balance of primary income, while the balance of services and secondary income has improved. The trade deficit of goods was EUR 952.0 million or 56.6% higher compared to Q2 2020, a dynamic that was mainly attributed to the increase of import, despite the considerable increase of export. Within the balance of payments, a considerable increase was marked also by remittances in Q2 2021 (24.8%), and FDI (78.8%). Quarterly Assessment of Macroeconomic Developments No. 35, Q II/2021 PUBLISHER: ©Central Bank of the Republic of Kosovo, Economic Analysis and Financial Stability Department. Address: Garibaldi 33, Prishtinë 10000, Tel: ++383 38 222 055, Fax: ++383 38 243 763 E-mail: [email protected] Users of the data are required to cite the source. Any needed correction will be made in the electronic version. This publication includes the data available until 30 June 2021.
Transcript of Quarterly Assessment of Macroeconomic Developments No. 35 ...

Quarterly Assessment of Macroeconomic Developments No. 35, Q II/2021
1
Summary
The easing of containment measures as a result of the
progress marked in managing the pandemic that was
accompanied by mass vaccination and declining of the
infection rates, was reflected in the economic recovery in
the euro area. In Q2 2021, economic activity was
characterized by real annual growth of 13.7%, from the
decline recorded in the previous quarter of 1.3%. The
second quarter of 2021 was also positively affected by the
increase in external demand and significant fiscal
stimulus. Also the region countries started with an
economic recovery, after being affected by the Covid-19
pandemics. In Q1 2021, estimates suggest that the region
countries were characterized with an average economic
growth of 0.9%, while the IMF forecasts for the whole year
of 2021 suggest an increase in economic activity of 5.1%
for the region.
Kosovo’s economy is also estimated to have been recovered
in the first half of 2021, being attributed to the easing of
restrictive measures as a result of the improvement of the
health crisis in this period. According to KAS estimates,
real GDP in Q1 2021 has marked an accelerated growth
of 5.6%, an increase that is estimated to have continued
also in Q2 2021. These estimates are based on increased
exports of goods and services, consumption and public
investments, remittances, as well as increased
industrial production and retail trade.
Consumer prices and other price indexes have marked
high increase in the first half of 2021. However, the
increase in prices turns out to be driven by temporary
internal and external factors that are mainly
attributed to the effect of recovery from the pandemic
crisis (details in box no. 1).
The increase of the economic activity in the reporting
period was accompanied by an improvement of the budget
revenues performance. Budget revenues, in Q2 2021,
marked an increase of 45.3%, while budget expenditures
marked a decline of 4.6%, making the Kosovo budget
record a primary surplus of EUR 46.9 million. Public debt
has continued with double-digit annual growth of 24.3%
and has reached the value of EUR 1.6 billion, while as a
percentage of GDP, it has reached 23.2% in Q2 2021.
Against the previous year, financial system expanded
with an accelerated pace, primarily being supported by
the developments in the banking and pension sector.
Assets of financial system reached the value of EUR 8.3
billion, in Q2 2021. In the banking sector, the activity was
supported by the growth of lending and deposits, while the
growth recorded in the pension sector was attributed to
the increase of contributions collected from contributors
and the positive return on investments.
The current account deficit has doubled in Q2 2021,
mainly due to the increase in the goods deficit and the
decline in the positive balance of primary income, while
the balance of services and secondary income has
improved. The trade deficit of goods was EUR 952.0
million or 56.6% higher compared to Q2 2020, a dynamic
that was mainly attributed to the increase of import,
despite the considerable increase of export. Within the
balance of payments, a considerable increase was marked
also by remittances in Q2 2021 (24.8%), and FDI (78.8%).
Quarterly Assessment of Macroeconomic Developments
No. 35, Q II/2021
PUBLISHER: ©Central Bank of the Republic of Kosovo, Economic Analysis and Financial Stability Department.
Address: Garibaldi 33, Prishtinë 10000, Tel: ++383 38 222 055, Fax: ++383 38 243 763 E-mail: [email protected]
Users of the data are required to cite the source. Any needed correction will be made in the electronic version.
This publication includes the data available until 30 June 2021.

Quarterly Assessment of Macroeconomic Developments No. 35, Q II/2021
2
CONTENTS
Summary ------------------------------------------------------------------------------------------------------------------------- i
Euro area and Western Balkans ----------------------------------------------------------------------------------------- 4
Kosovo’s Economy ---------------------------------------------------------------------------------------------------------- 5
Real Sector ------------------------------------------------------------------------------------------------------------------- 5
Box 1. Inflation dynamics during the COVID-19 pandemics and its determinants ------------------- 6
Fiscal Sector ----------------------------------------------------------------------------------------------------------------- 9
Financial Sector ----------------------------------------------------------------------------------------------------------- 10
External Sector ------------------------------------------------------------------------------------------------------------ 11
CHARTS AND TABLES
Chart 1. GDP growth rate and inflation rate in euro area ---------------------------------------------------------------------------------- 04
Chart 2. Real GDP growth rate and main contributors to the growth ------------------------------------------------------------------- 05
Chart 3. Current account deficit and its components --------------------------------------------------------------------------------------- 11
Chart 4. Export and import of goods ----------------------------------------------------------------------------------------------------------- 11
Chart 5. Export of goods -------------------------------------------------------------------------------------------------------------------------- 12
Chart 6. Import of goods -------------------------------------------------------------------------------------------------------------------------- 12
Chart 7. Remittances ------------------------------------------------------------------------------------------------------------------------------- 13
Chart 8. Structure o foreign direct investments ---------------------------------------------------------------------------------------------- 13
Table 1. Real GDP growth rate in Western Balkans ---------------------------------------------------------------------------------------- 05
Table 2. Annual Inflation rate in Western Balkans ------------------------------------------------------------------------------------------- 05
Table 3. Macroeconomic selected indicators ------------------------------------------------------------------------------------------------- 15
Quarterly Assessment of Macroeconomic Developments No. 35, Q II/2021
3
ABBREVIATIONS
CBK Central Bank of the Republic of Kosovo
CPI Consumer Price Index
ECB Central European Bank
EUR Euro currency
FDI Foreign Direct Investments
GDP Gross Domestic Product
IMF International Monetary Fund
IPI Import Price Index
KAS Kosovo Agency of Statistics
MF Ministry of Finance of the Republic of Kosovo
WEO World Economic Outlook
Quarterly Assessment of Macroeconomic Developments No. 35, Q II/2021
4
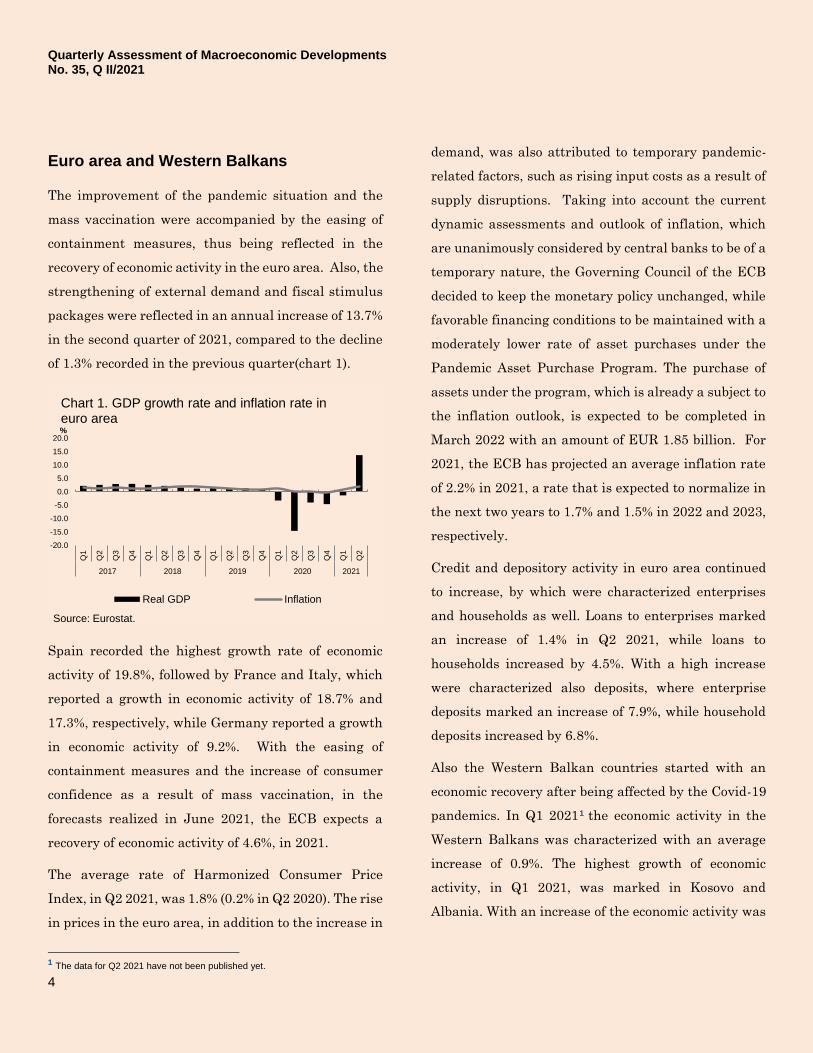
Euro area and Western Balkans
The improvement of the pandemic situation and the
mass vaccination were accompanied by the easing of
containment measures, thus being reflected in the
recovery of economic activity in the euro area. Also, the
strengthening of external demand and fiscal stimulus
packages were reflected in an annual increase of 13.7%
in the second quarter of 2021, compared to the decline
of 1.3% recorded in the previous quarter(chart 1).
Spain recorded the highest growth rate of economic
activity of 19.8%, followed by France and Italy, which
reported a growth in economic activity of 18.7% and
17.3%, respectively, while Germany reported a growth
in economic activity of 9.2%. With the easing of
containment measures and the increase of consumer
confidence as a result of mass vaccination, in the
forecasts realized in June 2021, the ECB expects a
recovery of economic activity of 4.6%, in 2021.
The average rate of Harmonized Consumer Price
Index, in Q2 2021, was 1.8% (0.2% in Q2 2020). The rise
in prices in the euro area, in addition to the increase in
1 The data for Q2 2021 have not been published yet.
demand, was also attributed to temporary pandemic-
related factors, such as rising input costs as a result of
supply disruptions. Taking into account the current
dynamic assessments and outlook of inflation, which
are unanimously considered by central banks to be of a
temporary nature, the Governing Council of the ECB
decided to keep the monetary policy unchanged, while
favorable financing conditions to be maintained with a
moderately lower rate of asset purchases under the
Pandemic Asset Purchase Program. The purchase of
assets under the program, which is already a subject to
the inflation outlook, is expected to be completed in
March 2022 with an amount of EUR 1.85 billion. For
2021, the ECB has projected an average inflation rate
of 2.2% in 2021, a rate that is expected to normalize in
the next two years to 1.7% and 1.5% in 2022 and 2023,
respectively.
Credit and depository activity in euro area continued
to increase, by which were characterized enterprises
and households as well. Loans to enterprises marked
an increase of 1.4% in Q2 2021, while loans to
households increased by 4.5%. With a high increase
were characterized also deposits, where enterprise
deposits marked an increase of 7.9%, while household
deposits increased by 6.8%.
Also the Western Balkan countries started with an
economic recovery after being affected by the Covid-19
pandemics. In Q1 20211 the economic activity in the
Western Balkans was characterized with an average
increase of 0.9%. The highest growth of economic
activity, in Q1 2021, was marked in Kosovo and
Albania. With an increase of the economic activity was
-20.0
-15.0
-10.0
-5.0
0.0
5.0
10.0
15.0
20.0
Q1
Q2
Q3
Q4
Q1
Q2
Q3
Q4
Q1
Q2
Q3
Q4
Q1
Q2
Q3
Q4
Q1
Q2
2017 2018 2019 2020 2021
%
Source: Eurostat.
Real GDP Inflation
Chart 1. GDP growth rate and inflation rate in euro area

Quarterly Assessment of Macroeconomic Developments No. 35, Q II/2021
5
characterized also Serbia, whereas other countries
have marked a decline (table 1). For Q2 2021, only the
Statistical Office of Serbia has published GDP
estimates, which suggest that economic activity in
Serbia has increased by 13.7%, from 1.8% as it was in
Q1 2021. IMF forecasts suggest an increase of the
economic activity in the region of 5.1%, for the year of
2021.
Table 1. Real GDP growth rate in W. Balkans
Source: National Statistics Offices of the respective countries
An increase of inflation rate was reported also in the
Western Balkan countries, as a result of the growth of
the domestic demand and the increase of prices in
international markets. The average inflation rate, in
Q2 2021, was 2.4%. Serbia recorded the highest
inflation growth rate of 3.2%, while Albania recorded a
lower rate compared to other countries (1.8%) (table 2).
Table 2. Annual inflation rate in W. Balkans
Source: National Statistics Offices of the respective countries
In terms of developments in the banking sector,
Western Balkan countries recorded an increase of 7.4%
in lending activity, representing the same rate
compared to Q2 2020. The highest growth rate was
recorded in Kosovo (12.2%), followed by Serbia (7.0%),
Montenegro (6.8%), Albania (5.9%) and North
Macedonia (5.1%). Deposits marked an average
increase of 10.7%, representing a higher growth rate
compared to the increase of 9.4% recorded in Q2 2020.
The highest increased rate of deposits was marked in
Kosovo and Serbia (14.7%, and 12.1%, respectively),
followed by Montenegro (11.4%), Albania (8.6%) and
North Macedonia (6.8%).
During Q2 2021, EUR appreciated against the Turkish
lira (33.8%), the US dollar (9.6%), the Swiss franc
(3.5%), while it depreciated against the British pound
(2.8%), the Albanian lek (1.2%), Croatian kuna (0.6%),
etc.
Kosovo’s Economy
Real Sector
As a result of the ease of containment measures for
protecting the public health, economic activity has
marked an increase in the first half of 2021. Based on
KAS estimates, real GDP marked an accelerated
increase of 5.6%, during Q1 2021. Consumption and
investments have contributed positively with 7.5% and
4.6%, respectively, while net exports have had negative
contribution on the economic activity with 6.5
percentage points (chart 2).
According to KAS, the highest GDP growth rate, in Q1
2021, was recorded in the sectors of health and social
work (26.3%), construction (11.5%), public administra-
Description 2019 Q1 2019 Q2 2019 Q3 2019 Q4 2020 Q1 2020 Q2 2020 Q3 2020 Q4 2021 Q1
Serbia 2.6 2.9 4.9 6.3 5.2 -6.3 -1.4 -1.0 1.8
Montenegro 3.2 3.6 5.2 3.7 2.6 -20.3 -26.9 -7.5 -6.4
Kosovo 4.3 2.9 6.0 5.6 1.6 -7.1 -6.3 0.8 5.6
North Macedonia 1.4 4.3 3.6 3.3 0.9 -14.9 -3.3 -0.7 -1.9
Albania 2.3 2.1 4.2 -0.1 -2.8 -11.3 -3.5 2.4 5.5
Description 2019 Q1 2019 Q2 2019 Q3 2019 Q4 2020 Q1 2020 Q2 2020 Q3 2020 Q4 2021 Q1 2021 Q2
Kosovo 3.2 3.3 2.6 1.7 1.1 0.2 -0.4 -0.1 0.6 2.1
Montenegro 0.4 0.5 -0.1 1.1 0.5 -1.1 -1.4 -1.3 -0.1 2.3
North Macedonia 1.2 1.2 0.6 0.0 0.6 0.5 1.5 2.2 2.0 2.8
Serbia 2.4 2.3 1.3 1.4 1.7 1.0 1.9 1.6 1.4 3.2
Albania 1.6 1.4 1.4 1.3 1.6 1.9 1.4 1.6 0.9 1.8
2.4
4.8
4.5
4.72.9
4.4 3.74.1 4.3 2.9
6.05.6
1.6
-7.1
-6.3
0.8
5.6
-20.0
-15.0
-10.0
-5.0
0.0
5.0
10.0
15.0
Q1 Q2 Q3 Q4 Q1 Q2 Q3 Q4 Q1 Q2 Q3 Q4 Q1 Q2 Q3 Q4 Q1
2017 2018 2019 2020 2021
Source: KAS and CBK calculations.
Consumption Investments Net exports Real GDP growth
Chart 2. Real GDP growth rate and main contributors to the growth

Quarterly Assessment of Macroeconomic Developments No. 35, Q II/2021
6
tion (10.2%), education (9.6%) and financial activities
and insurance (8.9%). Also in the trade sector was
marked an increase of 2.3%, which is one the sectors
with the highest share to total economic activity.
Conversely, a decline of 9.9% was marked in the sector
of supply with electricity and gas. A decrease in
economic activity was also recorded in the extractive
industry sector (-5.9%) and transport and storage (-
3.1%).
Estimates of the CBK suggest that the accelerated
increasing trend of the economic activity has continued
also in Q2 2021. These estimates are based on direct or
indirect indicators which show the increase of export of
goods and services in the reporting period, the increase
of consumption and public investments, the increase of
remittances, etc. On the other side, the considerable
high increase of goods import has contributed
negatively to the increase of real GDP in the reporting
period.
The increase of economic activity during Q2 2021 is
also evidenced by the short-term statistics of industrial
production and those of retail trade. The average
industrial production index has increased by 30.8%,
where the sector of processing industry has increased
by 43.6%, the extractive industry sector by 12.7%, etc.
Conversely, the average retail turnover index
increased by 14.4%.
2 Consumer Price Index; Producer Price Index; Import Price Index; Construction
Cost Index.
Box 1. Inflation dynamics during the COVID-19 pandemics and its determinants
The pandemic crisis has been translated into an economic
and social crisis, where measures of social distancing and
increased uncertainty resulted in a decline in economic
activity accompanied by a contraction in investments, a
sharp decline in exports of services, and a decline in imports
of goods and services. The decline marked in GDP of 3.0% in
2020 was reflected in the deterioration of labor market
dynamics, widening of the current account deficit and
increasing budget deficit and public debt.
As a result of these economic developments, also the inflation
rate was characterized by notable fluctuations. As shown in
chart 1, during 2020 the inflation rate has decreased
significantly (negative rate in recent months), while 2020
ended with an average inflation rate of 0.2% (2.7% in 2019).
The change in the general internal and external
macroeconomic dynamics in 2021 was accompanied by an
increase in general prices, measured through the four indices
compiled by KAS.2 By July 2021, the average consumer
price rate reached1.6%, an increase that was mainly
recorded in the communication means (16.2%),
alcoholic beverages and tobacco (3.4%), transportation
(2.0%), health services (1.6%), etc. Price increase was
also observed in producer price index, import price index and
especially in the prices of construction. Producer price index
recorded an average increase of 2.8% in the first half of 2020,
mainly due to the increase in metal ore extraction (29.7%),
electricity, gas, steam and air conditioning supply (5.7%),
metal production (5.0%), etc. In the same period, an increase
of 5.1% is evidenced by the import price index, an increase
mainly driven by prices of base metals (13.7%), mineral
products (11.3%), plastics (8.8%), etc.

Quarterly Assessment of Macroeconomic Developments No. 35, Q II/2021
7
The construction cost index in the first half of 2021
increased by 8.7%, mainly due to the increase in the
cost of materials by 12.4%, the cost of energy by 5.6%
and the cost of machinery by 2.8%.
The inflation dynamics in Kosovo are mainly determined by
domestic demand and the inflation fluctuations in the
euro area. While during the last year the decline in domestic
demand was accompanied by a slowdown in price growth, the
recovery in aggregate demand in 2021 was also translated
into an increase in the inflation rate. In addition, the
fluctuation of the inflation rate during the pandemic can be
attributed to several temporary factors, such as the
redistribution of expenditures and developments in the labor
market.
The pandemic has affected a redistribution of consumer
spending into different categories. During the period
when the strictest restrictive measures were in force,
expenses for tourism, travel, clothing and footwear, etc. were
almost non-existent, in contrast to the increase in health
expenses, home-related items (including food and equipment
needed to work and learn at home). Such an issue was
observed from the decline, namely the growth of economic
activity in the respective sectors during 2020. More
specifically, in the transport and storage sector it was marked
the highest decline in economic activity (-22.6%), followed by
hotels and restaurants (-20.4%) as well as in the arts,
entertainment and recreation sector (-16.7%). On the other
hand, the highest growth of economic activity was recorded
in the health sector and social work activities (18.4%).
Similar movements were recorded in the consumer basket,
where transport prices marked the highest decline (-5.8%),
followed by recreation and culture prices (-0.6%), while prices
of health services and food prices marked an increase of 4.7%
and 1.6%, respectively.
Another determinant of inflation dynamics are the
developments in the labor market, as an increase in
unemployment or a decrease in wages affects the decline in
purchasing power and potential consumer spending. Official
labor market statistics show that the average unemployment
rate in 2020 has marked a slight increase to 25.9% from
25.7%, as it was in 2019. The rise in unemployment rate
has been limited by fiscal support for firms and
employees by the government but also by the fact that
businesses in sectors affected by the pandemic crisis
have managed the downturn by reducing incomes and
working hours, rather than dismissing employees. The
average gross salary in Kosovo marked a decline of 2.3%
during 2020.
Due to the pandemic that resulted in the closure and
reduction of business activity, gross salary in the private
sector decreased by 7.5% while gross salary in the public
sector increased by 6.8%, which can be attributed to
additional payments to the sectors which were more exposed
to the virus.
Since Kosovo’s economy is small and opened to other
countries, external factors are important determinants
of inflation dynamics in the country. As a consequence
of Covid-19 pandemic, during 2020 it was marked a decline
in import prices of 1.9%. Prices of mineral products, as well
as prices of textile products marked the highest decline (-
15.9% and -13.8%, respectively), while prices of base metals
decreased by 2.2%. In the first half of 2021, when the
situation with the Covid-19 pandemic began to improve,
-2.0
-1.0
0.0
1.0
2.0
3.0
4.0
Janua
ryF
ebru
ary
Marc
hA
pril
May
June
July
August
Septe
mber
Octo
ber
Novem
ber
Decem
ber
Janua
ryF
ebru
ary
Marc
hA
pril
May
June
July
August
Septe
mber
Octo
ber
Novem
ber
Decem
ber
Janua
ryF
ebru
ary
Marc
hA
pril
May
June
July
August
Septe
mber
Octo
ber
Novem
ber
Decem
ber
Janua
ryF
ebru
ary
Marc
hA
pril
May
June
2018 2019 2020 2021
Source: KAS and CBK calculations.
Chart 1. Overall inflation and core inflation, annual change in percent

Quarterly Assessment of Macroeconomic Developments No. 35, Q II/2021
8
import prices increased by 5.1%. The highest increase in
import prices was marked by base metals (13.7%), mineral
products (11.3%), plastics (8.8%), leather (8.8%), and edible
oils (8.1%).
The impact of external factors on inflation dynamics in
Kosovo can well be observed through the price index of
tradable components and the price index of non-tradable
components. As shown in chart 2, the overall price
fluctuation in Kosovo is more determined by tradable
components against non-tradable components. This is due to
the fact that the vast majority of the Kosovar consumer
basket consists of tradable components (about 82% in 2021),
while the rest (mainly services) consists of non-tradable
components.
By June 2021, the prices of tradable goods and services
increased by 1.8%, from 0.4%, as it was in the same period of
2020. On the other hand, non-tradable goods and services
recorded an inflation rate of 1.0% from the rate of 1.3% as it
was in the same period of 2020. The increase in inflation of
tradable goods and services is mainly attributed to the
increase in import prices.
Inflation dynamics in Kosovo are also determined by the very
high share of products with seasonal price movements, such
as: food, alcoholic beverages and tobacco and energy. The
share of these categories in the Kosovan consumer basket in
2021 is about 54.1% (39.9% of food and non-alcoholic
beverages) and has remained almost unchanged over the
years, which is significantly higher compared to the average
of euro area (31.3%) and closer to the average of the region
countries (52.0%). Prices of these products determined the
price fluctuations during the past years not only because of
the high share that they have in the consumer basket but also
because the movement of these prices has been more
significant. This makes the impact of these categories to total
movement of prices to be higher than in other countries
which have lower share of these categories in the consumer
basket.
Core inflation, which excludes categories which are
characterized by a more pronounced change in prices,
presents a clearer picture regarding inflation in Kosovo. As
shown in chart 3, core inflation has historically been
lower than the overall inflation and has marked a more
approximate movement compared to the overall
inflation fluctuation in the euro area.
In the first half of 2021, a similar movement of overall
and core inflation was observed compared to inflation
in the euro area. Therefore, core inflation was 1.2% and
overall inflation was 1.3% (table 1), while inflation in the euro
area was 1.4 percent, in the first half of 2021.
Price level dynamics are not expected to change in the second
half of 2021.
-4.0
-3.0
-2.0
-1.0
0.0
1.0
2.0
3.0
4.0
5.0
6.0
2015 2016 2017 2018 2019 2020 Jun2021
Tradable Non-tradable Total CPI
Chart 2. The indices of tradable and non-tradable components
Source: KAS and CBK calculations.
-2
-1
0
1
2
3
4
2015 2016 2017 2018 2019 2020 Jun2021
Overall inflation in Kosovo Overall inflation in Kosovo
Overall inflation in euro area
Chart 3. Overall inflation and core inflation, annual growth in percent
Source: KAS and CBK calculations.

Quarterly Assessment of Macroeconomic Developments No. 35, Q II/2021
9
Table 1. Contribution of specific categories to total inflation, in Q1 2021
Source: KAS and CBK calculations
Domestic economic recovery and inflationary pressures from
outside are expected to affect the inflation rate in the country.
For 2021, the CBK anticipates that the average inflation rate
will be around 3.2%, while at the end of the year, in December
2021, the inflation rate is projected to be 5.4%. The CBK
forecasts are mainly based on the trend, but also on the forecasts
for price movements of trading partners, especially in the euro
area, when it is considered the high rate of price correlation in
Kosovo and those in the euro area. Also commercial banks, in
the last survey conducted in June 2021, have stated that they
expect the inflation rate to be significantly higher compared to
the previous year (1.9%). Similar dynamics of price increase are
expected also in the main trading partners. According to the
ECB, the inflation rate in the euro area is projected to be 1.9% in
2021, reaching the highest level of 2.6% in Q4 2021, while the
countries of the region are facing an even higher growth rate of
prices. The increase of inflationary pressures on the global level
are generally expected to stabilize as the main drivers of these
pressures this year are estimated to be temporary. Potentially
more stable growth of inflation or inflation expectations could be
accompanied by tightening of monetary policy and tightening of
global financial conditions, thus weighing on economic recovery,
especially in developing countries which have higher needs for
external financing. In Kosovo, the increase of inflation rate in
2021, accompanied by a decrease in the average salary, gives an
indication of a potential decline in purchasing power, having a
potential chain effect on businesses. The ECB forecasts for a
decline in the inflation rate in the next two years give positive
signals for the continuation of the overall recovery process from
the effects of the pandemic.
3 Within budget revenues are not included receipts from financing.
Fiscal Sector
Budget revenues3 in the first half of 2021 marked an
increase of 29.2% while budget expenditures4 marked
an increase of 10.3%. Only in Q2 2021, budget revenues
amounted to EUR 527.6 million, representing an
annual growth of 45.3%, while budget expenditures in
this quarter declined by 4.6% and reached the value of
euro 480.7 million. Consequently, Kosovo’s budget
recorded a primary budget surplus of EUR 46.9 million
during this quarter.
The recovery of the economic activity results to have
affected the considerable increase of direct tax
revenues of 63.0%, in Q2 2021. Tax on personal income,
as the main category of the direct tax revenues,
increased by 37.3%, while tax on corporate income
increased by 80.9%. With an increase of domestic
demand, which has affected the growth of imports of
goods, there has been marked an increase of 44.0% also
in indirect tax revenues, a category that dominates
budget revenues by around 75%. In Q2 2021, indirect
tax revenues amounted to EUR 395.9 million, where
VAT and excise as the two main categories of indirect
tax revenues marked a growth of 54.9% and 26.9%,
respectively.
The main category which contributed to the decline of
budget expenditures, during Q2 2021, was the one of
subsidies and transfers, which reached the value of
EUR 167.6 million, representing a decline of 18.0%,
compared to Q2 2020. Also, expenses on salaries
marked a slight decline of 2.6%, reaching the value of
EUR 167.3 million, while government expenditures on
goods and services (including municipal utilities)
4 Within budget revenues are not included financing payments.
2015 2016 2017 2018 2019 2020 Jun 2021
CPI 100.0% -0.5 0.3 1.5 1.1 2.7 0.2 1.3
Split of CPI
Food and non-alc. beverages 39.9% 0.3 -0.6 1.4 1.8 6.0 1.6 0.1
Energy 7.8% 1.6 -2.2 4.5 -2.7 0.1 0.2 -2.0
Other goods 18.3% 3.1 4.0 1.4 0.6 1.4 0.0 0.9
Services 34.0% -5.1 0.3 0.4 0.6 0.6 0.9 3.5
Core inflation, except:
Food and non-alc. beverages 60.1% -0.2 0.2 0.9 0.5 0.5 -0.5 1.3
Food, non-alcoholic beverages and energy 52.4% -0.8 0.6 0.5 0.7 0.5 -0.5 1.4
Food, non-alcoholic beverages, energy, alcoholic beverages and tobacco46.0% -1.2 0.1 0.3 0.5 0.3 -0.5 1.2
DescriptionWeight
2021
Annual average grow th, %

Quarterly Assessment of Macroeconomic Developments No. 35, Q II/2021
10
marked an increase of 17.8% and reached the value of
EUR 74.7 million. Capital expenditures, in Q2 2021,
reached the value of EUR 71.1 million or 10.8% more
compared with Q2 2020.
Public debt, in Q2 2021, reached EUR 1.6 billion, which
is for 24.3% higher compared to Q2 2020. As a
percentage to GDP, public debt reached 23.2%, from
18.2% as it was in Q2 2020. The increase of public debt
is attributed to the growth of domestic debt of 20.0%
(which reached EUR 1.06 billion), and the increase of
external debt of 33.1% (which reached EUR 571.6
million). The threshold of public debt in Kosovo is set
by law at 40% of GDP, and consequently the level of
23.2% ranks Kosovo in the position of the country with
the lowest level of public debt compared to the region
countries. Nevertheless, this low level of public debt
may quickly surge in the future as a result of the
negative impact of Covid-19 pandemic in Kosovo’s
economy and due to the Government’s plans to finance
the budget deficit through the public debt.
Financial Sector5
Assets of the financial system at the end of June 2021
reached a value of EUR 8.31 billion, representing an
annual increase of 12.2%. Also on quarterly basis,
financial system expanded, mainly being supported by
the banking sector (deposits) and pension sector
(collected contributions and return on investments).
Also other sectors had positive contribution to the
growth, albeit at low level due to the low weight they
have in the financial system.
5 For more information on financial sector, please refer to: Quarterly Assessment
of Financial System (Q2 2021) published at the CBK website.
On quarterly basis, the banking sector activity within
assets was supported by the increase in lending,
whereas other balance sheet items declined (balance
sheets with commercial banks, investments in
securities, and money held at commercial banks).
Whereas, within liabilities, deposits marked the most
significant increase in this quarter (mainly from
deposits collected from households) and equity
(realized profit).
Indicators that measure the soundness of the banking
sector suggest that at the end of Q2 2021 the banking
sector marked an improvement in the level of liquidity,
capitalization, profitability and higher quality of the
loan portfolio.
Pension sector was characterized with positive
dynamics in overall assets and investments
performance as well, in Q2 2021. The increase in
contributions collected during this period as well as the
positive return on investments contributed to the
increase in the sector’s assets, despite the impact that
the withdrawal of 10% of funds from contributors, an
opportunity which terminated at the beginning of this
quarter.
During the second quarter of 2021, with an increase
were characterized also assets of insurance sector.
Also, accelerated growth was marked by gross written
premiums against claims incurred, which resulted in
positive performance of the sector in this quarter.
Compared to last year, the microfinance sector marked
an acceleration of lending activity, translated into an
acceleration of assets growth on a quarterly basis. The

Quarterly Assessment of Macroeconomic Developments No. 35, Q II/2021
11
sector also closed the second quarter with a positive
financial result and a satisfactory level of credit
portfolio quality based on the low level of
nonperforming loans.
During the second quarter of 2021, the Government of
Kosovo issued debt in the amount of EUR 100.0
million, through treasury bonds with a maturity of 3 to
10 years. Also, in auctions during this quarter, the
submitted bidding amount to invest in government
bonds exceeded the offer by 1.46 times.
External Sector
External sector of the economy was the main channel
through which was transmitted the economic and
social crises driven by the Covid-19 pandemic in
Kosovo. The current account deficit, which in 2020 was
increased for 20.4%, has continued with an accelerated
trend also in 2021. Only in Q2 2021, the current
account deficit has doubled from EUR 144.8 million, as
it was in Q2 2020, to EUR 295.5 million, in Q2 2021.
6
The source of data for import and export of goods in Kosovo is Kosovo Agency
of Statistics.
This increase of the current account deficit is
attributable to the increase of the goods deficit and the
decline in the positive balance of primary income, while
the balance of services and secondary income has
improved (chart 3).
Export 6 of goods, only in Q2 2021, has marked an
increase of 64.7%, while import of goods increased by
57.9%. Despite the higher growth rate of exports, the
significantly higher level of imports of goods has led to
an increase in the trade deficit of goods by 56.6%,
reaching the level of EUR 952.0 million (chart 4).
The value of exports of goods, in Q2 2021, was EUR
191.1 million and almost all export categories marked
an increase, while the highest increase compared to the
same period of 2020, was marked in base metals,
plastic and rubber products, mineral products, etc.
(chart 5).
About 36% of exported goods consists of base metal
products, where the changes in metal prices in
international markets reflect the nominal value of
exports. Base metal prices in Q2 2021 marked an
-1000
-800
-600
-400
-200
0
200
400
Deficit of currentaccount
Goods Services Primary income Secondary income
Q2 2018 Q2 2019 Q2 2020 Q2 2021
Chart 3. Current account deficit and its components, EUR million
Source: CBK.
-1500
-1000
-500
0
500
1000
1500
Q2 2018 Q2 2019 Q2 2020 Q2 2021
Source: KAS.
Exports Imports Trade balance
Chart 4. Export and import of goods, EUR million
Quarterly Assessment of Macroeconomic Developments No. 35, Q II/2021
12
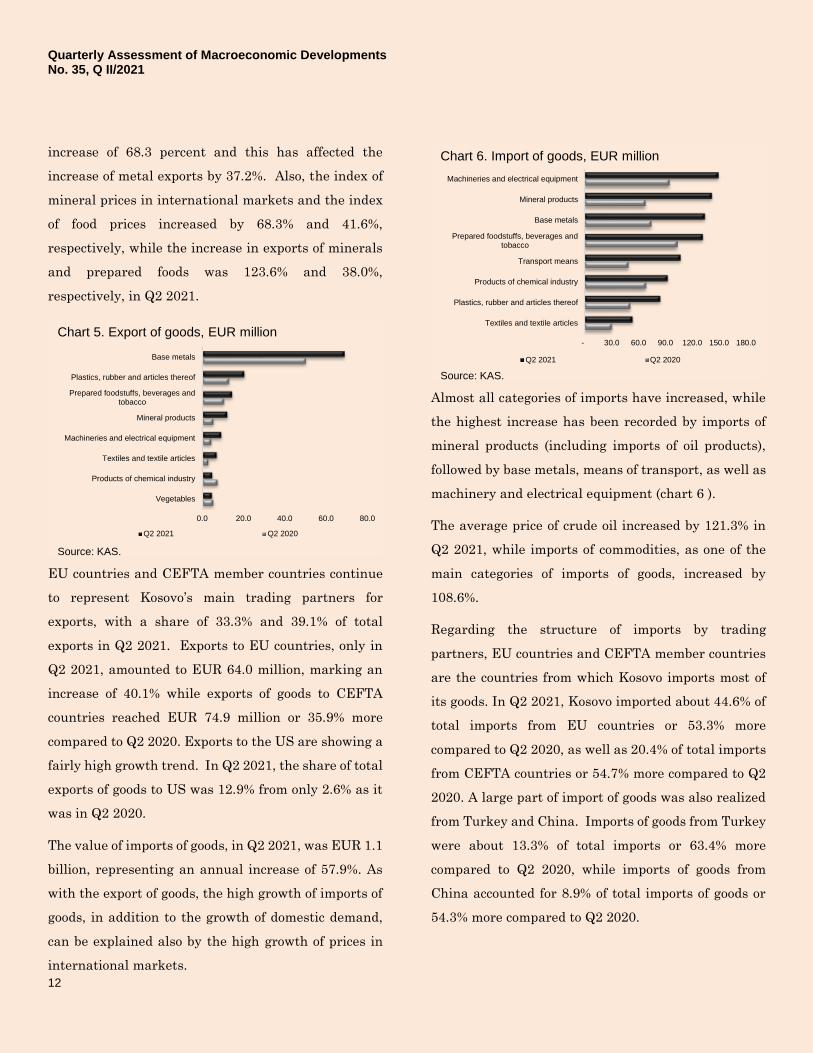
increase of 68.3 percent and this has affected the
increase of metal exports by 37.2%. Also, the index of
mineral prices in international markets and the index
of food prices increased by 68.3% and 41.6%,
respectively, while the increase in exports of minerals
and prepared foods was 123.6% and 38.0%,
respectively, in Q2 2021.
EU countries and CEFTA member countries continue
to represent Kosovo’s main trading partners for
exports, with a share of 33.3% and 39.1% of total
exports in Q2 2021. Exports to EU countries, only in
Q2 2021, amounted to EUR 64.0 million, marking an
increase of 40.1% while exports of goods to CEFTA
countries reached EUR 74.9 million or 35.9% more
compared to Q2 2020. Exports to the US are showing a
fairly high growth trend. In Q2 2021, the share of total
exports of goods to US was 12.9% from only 2.6% as it
was in Q2 2020.
The value of imports of goods, in Q2 2021, was EUR 1.1
billion, representing an annual increase of 57.9%. As
with the export of goods, the high growth of imports of
goods, in addition to the growth of domestic demand,
can be explained also by the high growth of prices in
international markets.
Almost all categories of imports have increased, while
the highest increase has been recorded by imports of
mineral products (including imports of oil products),
followed by base metals, means of transport, as well as
machinery and electrical equipment (chart 6 ).
The average price of crude oil increased by 121.3% in
Q2 2021, while imports of commodities, as one of the
main categories of imports of goods, increased by
108.6%.
Regarding the structure of imports by trading
partners, EU countries and CEFTA member countries
are the countries from which Kosovo imports most of
its goods. In Q2 2021, Kosovo imported about 44.6% of
total imports from EU countries or 53.3% more
compared to Q2 2020, as well as 20.4% of total imports
from CEFTA countries or 54.7% more compared to Q2
2020. A large part of import of goods was also realized
from Turkey and China. Imports of goods from Turkey
were about 13.3% of total imports or 63.4% more
compared to Q2 2020, while imports of goods from
China accounted for 8.9% of total imports of goods or
54.3% more compared to Q2 2020.
0.0 20.0 40.0 60.0 80.0
Vegetables
Products of chemical industry
Textiles and textile articles
Machineries and electrical equipment
Mineral products
Prepared foodstuffs, beverages andtobacco
Plastics, rubber and articles thereof
Base metals
Q2 2021 Q2 2020
Chart 5. Export of goods, EUR million
Source: KAS.
- 30.0 60.0 90.0 120.0 150.0 180.0
Textiles and textile articles
Plastics, rubber and articles thereof
Products of chemical industry
Transport means
Prepared foodstuffs, beverages andtobacco
Base metals
Mineral products
Machineries and electrical equipment
Q2 2021 Q2 2020
Chart 6. Import of goods, EUR million
Source: KAS.
Quarterly Assessment of Macroeconomic Developments No. 35, Q II/2021
13
Within the balance of payments, trade of services was the
component that suffered the sharpest decline during 2020, as
a direct consequence of the restrictive measures taken to
manage the health crises. With the easing and lifting the
restrictive measures, also the trade in services has begun to
normalize. In Q2 2021, the balance in trade of services
reached a value of EUR 137.6 million, from EUR 7.7 million
as it was in Q2 2020. The value of export of services amounted
to EUR 332.1 million, from EUR 114.6 millions, as it was in
Q2 2020. The highest growth was marked by export of travel
services, transport, construction, etc. Also the import of
services marked a slight increase in Q2 2021, where the value
of services imported amounted to EUR 194.5 million (EUR
106.8 million in Q2 2020). The highest increase was marked
in travel services, transport and in pension and insurance
services. It is worth mentioning that the export and import of
services was higher compared to Q2 2019 by 9.0 and 16.5%,
respectively.
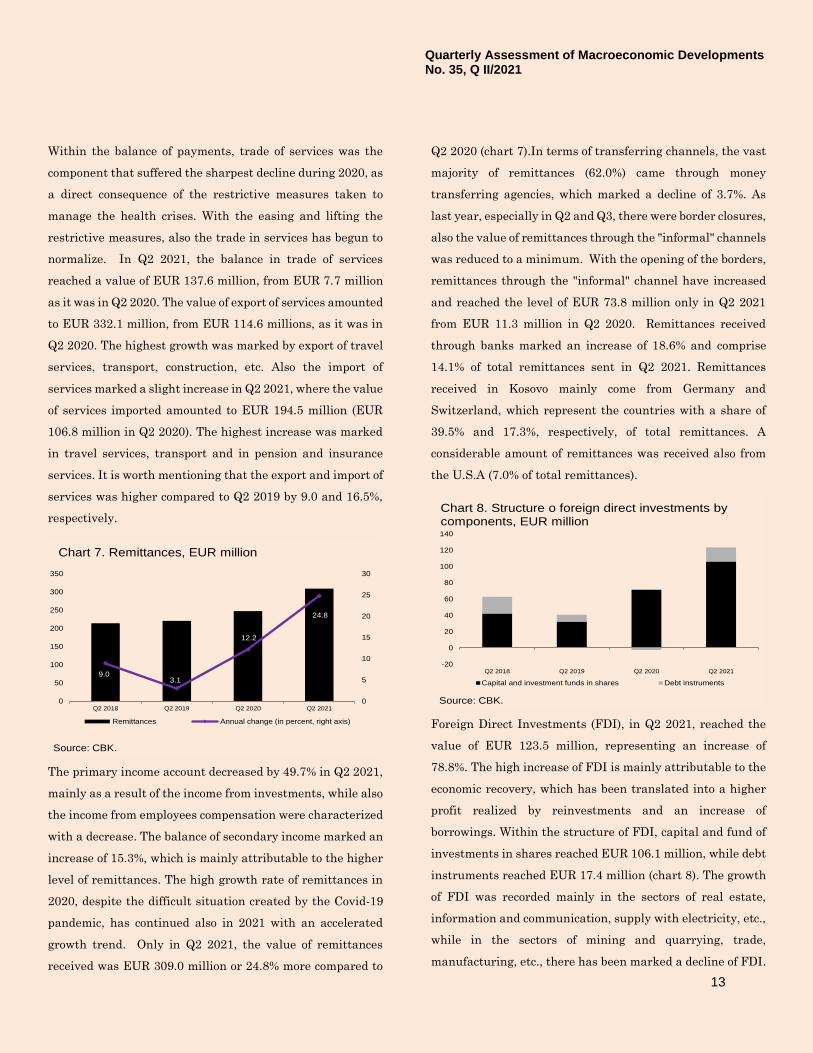
The primary income account decreased by 49.7% in Q2 2021,
mainly as a result of the income from investments, while also
the income from employees compensation were characterized
with a decrease. The balance of secondary income marked an
increase of 15.3%, which is mainly attributable to the higher
level of remittances. The high growth rate of remittances in
2020, despite the difficult situation created by the Covid-19
pandemic, has continued also in 2021 with an accelerated
growth trend. Only in Q2 2021, the value of remittances
received was EUR 309.0 million or 24.8% more compared to
Q2 2020 (chart 7).In terms of transferring channels, the vast
majority of remittances (62.0%) came through money
transferring agencies, which marked a decline of 3.7%. As
last year, especially in Q2 and Q3, there were border closures,
also the value of remittances through the "informal" channels
was reduced to a minimum. With the opening of the borders,
remittances through the "informal" channel have increased
and reached the level of EUR 73.8 million only in Q2 2021
from EUR 11.3 million in Q2 2020. Remittances received
through banks marked an increase of 18.6% and comprise
14.1% of total remittances sent in Q2 2021. Remittances
received in Kosovo mainly come from Germany and
Switzerland, which represent the countries with a share of
39.5% and 17.3%, respectively, of total remittances. A
considerable amount of remittances was received also from
the U.S.A (7.0% of total remittances).
Foreign Direct Investments (FDI), in Q2 2021, reached the
value of EUR 123.5 million, representing an increase of
78.8%. The high increase of FDI is mainly attributable to the
economic recovery, which has been translated into a higher
profit realized by reinvestments and an increase of
borrowings. Within the structure of FDI, capital and fund of
investments in shares reached EUR 106.1 million, while debt
instruments reached EUR 17.4 million (chart 8). The growth
of FDI was recorded mainly in the sectors of real estate,
information and communication, supply with electricity, etc.,
while in the sectors of mining and quarrying, trade,
manufacturing, etc., there has been marked a decline of FDI.
9.03.1
12.2
24.8
0
5
10
15
20
25
30
0
50
100
150
200
250
300
350
Q2 2018 Q2 2019 Q2 2020 Q2 2021
Source: CBK.
Remittances Annual change (in percent, right axis)
Chart 7. Remittances, EUR million
-20
0
20
40
60
80
100
120
140
Q2 2018 Q2 2019 Q2 2020 Q2 2021
Source: CBK.
Capital and investment funds in shares Debt instruments
Chart 8. Structure o foreign direct investments by components, EUR million

Quarterly Assessment of Macroeconomic Developments No. 35, Q II/2021
14
The suggested citation of this publication:
CBK (2021): Quarterly Assessment of Macroeconomic Developments No. 35 Q2 2021, Central Bank of the Republic of
Kosovo
References
CBK (2021):
a) Monthly Statistics Bulletin: https://bqk-kos.org/publications/monthly-statistics-bulletin/?lang=en
b) Official CBK statistics, Time series: https://bqk-kos.org/statistics/time-series/?lang=en
c) Results announcements of government securities auctions : https://bqk-kos.org/announcements/government-securities-2/?lang=en
KAS (2021):
a) Harmonized index of Consumer Prices: https://ask.rks-gov.net/en/kosovo-agency-of-statistics/add-news/harmonized-index-of-consumer-prices-june-2021
b) Producer Price Index: https://ask.rks-gov.net/en/kosovo-agency-of-statistics/add-news/producer-price-index-q2-2021
c) Import Price Index: https://ask.rks-gov.net/en/kosovo-agency-of-statistics/add-news/import-price-index-q2-2021
d) Statistical Report on economic enterprises: https://ask.rks-gov.net/en/kosovo-agency-of-statistics/add-news/statistical-repertoire-on-
economic-enterprises-in-kosovo-q2-2021
e) External trade statistics: https://ask.rks-gov.net/en/kosovo-agency-of-statistics/add-news/international-trade-statistics-june-2021
IMF (2021): World Economic Outlook: World Economic Outlook (imf.org)
Quarterly Assessment of Macroeconomic Developments No. 35, Q II/2021
15
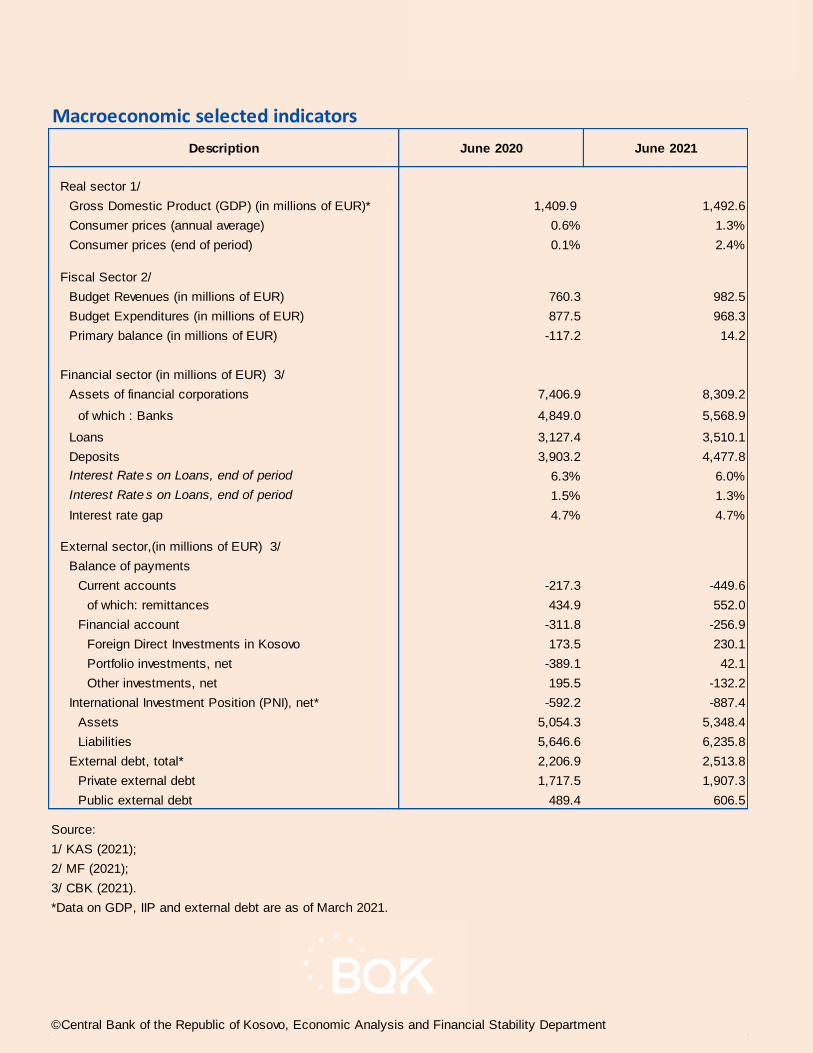
Macroeconomic selected indicators
Description June 2020 June 2021
Real sector 1/
Gross Domestic Product (GDP) (in millions of EUR)* 1,409.9 1,492.6
Consumer prices (annual average) 0.6% 1.3%
Consumer prices (end of period) 0.1% 2.4%
Fiscal Sector 2/
Budget Revenues (in millions of EUR) 760.3 982.5
Budget Expenditures (in millions of EUR) 877.5 968.3
Primary balance (in millions of EUR) -117.2 14.2
Financial sector (in millions of EUR) 3/
Assets of financial corporations 7,406.9 8,309.2
of which : Banks 4,849.0 5,568.9
Loans 3,127.4 3,510.1
Deposits 3,903.2 4,477.8
Interest Rate s on Loans, end of period 6.3% 6.0%
Interest Rate s on Loans, end of period 1.5% 1.3%
Interest rate gap 4.7% 4.7%
External sector,(in millions of EUR) 3/
Balance of payments
Current accounts -217.3 -449.6
of which: remittances 434.9 552.0
Financial account -311.8 -256.9
Foreign Direct Investments in Kosovo 173.5 230.1
Portfolio investments, net -389.1 42.1
Other investments, net 195.5 -132.2
International Investment Position (PNI), net* -592.2 -887.4
Assets 5,054.3 5,348.4
Liabilities 5,646.6 6,235.8
External debt, total* 2,206.9 2,513.8
Private external debt 1,717.5 1,907.3
Public external debt 489.4 606.5
Source:
1/ KAS (2021);
2/ MF (2021);
3/ CBK (2021).
©Central Bank of the Republic of Kosovo, Economic Analysis and Financial Stability Department
*Data on GDP, IIP and external debt are as of March 2021.