QUANTITATIVE XRD ANALYSIS OF DIFFERENT COAL … · Quantitative XRD analysis appears to be better...
15
QUANTITATIVE XRD ANALYSIS OF DIFFERENT COAL SAMPLES TO UNDERSTAND THEIR ASHING PROCESS DURING THE INITIAL STAGES OF COMBUSTION. N. Tshiongo-Makgwe 1 University of Johannesburg, Faculty of Engineering and the Built Environment, School of Mining, Metallurgy and Chemical Engineering, Department of Metallurgy, South Africa, POBOX 526, Wits 2050, South Africa ABSTRACT Coals in general have very complex chemistry and depending on the intended usage, further challenges are experienced. Such challenges vary from the methods mining and cleaning that should be employed to yield the best quality coal for the specified usage and the final products which are produced from coal use. It is therefore very important to understand the chemistry of raw coal and the ashing properties of such coals and the information from this work can also assist in highlighting the environmental and health aspects that are linked to processing and usage of coal. This work focused on a qualitative studies using XRD to analyze five different coal samples and the chemistry change during the ashing process which takes place during the coal combustion process. An ashing process was conducted on the five samples at 350⁰C, 500⁰C, 750⁰C and 1000⁰C and their results where compared to the composition of the raw coal. The results from this work showed that there are up to 40 major phase-mineral compositions found in the samples analyzed, of which some of them are one phase-mineral composition that appears as different phases/forms in the coal ash. Key words: ash composition, XRD analysis, combustion, phase-mineral 1. INTRODUCTION Coal in South Africa is dominantly utilised in electricity generation followed by the metallurgical industry and a smaller percentage in synthetic fuel. For these different intended usages, there are requirements from the user that coal producers should know and ensure that their beneficiation processes for effectively production of coals that meets those specifications. Before designing a coal processing and beneficiation method or the proper usage, it is very important to determine the 1 Corresponding author. Tel.: +27(0) 11 559 6168 cell +27(0) 84 714 2162 E-mail address: [email protected]
Transcript of QUANTITATIVE XRD ANALYSIS OF DIFFERENT COAL … · Quantitative XRD analysis appears to be better...

QUANTITATIVE XRD ANALYSIS OF DIFFERENT COAL SAMPLES
TO UNDERSTAND THEIR ASHING PROCESS DURING THE INITIAL
STAGES OF COMBUSTION.
N. Tshiongo-Makgwe1
University of Johannesburg, Faculty of Engineering and the Built Environment, School of
Mining, Metallurgy and Chemical Engineering, Department of Metallurgy, South Africa,
POBOX 526, Wits 2050, South Africa
ABSTRACT
Coals in general have very complex chemistry and depending on the intended
usage, further challenges are experienced. Such challenges vary from the methods
mining and cleaning that should be employed to yield the best quality coal for the
specified usage and the final products which are produced from coal use. It is
therefore very important to understand the chemistry of raw coal and the ashing
properties of such coals and the information from this work can also assist in
highlighting the environmental and health aspects that are linked to processing and
usage of coal. This work focused on a qualitative studies using XRD to analyze five
different coal samples and the chemistry change during the ashing process which
takes place during the coal combustion process. An ashing process was conducted
on the five samples at 350⁰C, 500⁰C, 750⁰C and 1000⁰C and their results where
compared to the composition of the raw coal. The results from this work showed that
there are up to 40 major phase-mineral compositions found in the samples analyzed,
of which some of them are one phase-mineral composition that appears as different
phases/forms in the coal ash.
Key words: ash composition, XRD analysis, combustion, phase-mineral
1. INTRODUCTION Coal in South Africa is dominantly utilised in electricity generation followed by the
metallurgical industry and a smaller percentage in synthetic fuel. For these different
intended usages, there are requirements from the user that coal producers should
know and ensure that their beneficiation processes for effectively production of coals
that meets those specifications. Before designing a coal processing and
beneficiation method or the proper usage, it is very important to determine the
1 Corresponding author. Tel.: +27(0) 11 559 6168 cell +27(0) 84 714 2162 E-mail address:

different minerals contained in the coal body and their effects on the utilization
processes. In so doing, coal producers should also be mindful of environmental
pollution that are associated with the production and usage of coal due to its mineral
composition. Such environmental pollutions include the solid and effluents wastes
generated in the beneficiation process, the waste produced in coal usage such as
the fly ash, bottom ash and the off gases that are released (Winburn et al. 2000). All
this requires a good understanding of the formation, mineral compositions and
properties of coal associated with both beneficiation and utilization process. Previous
research have been done on the compositions and properties of solid combustion
waste from various coal fired power stations around the world (Vassilev et al. 2005),
and emphasis was made on the importance of knowledge relating to the origin,
utilization, environmental, technological problems and chemical and phase-mineral
compositions associated with coal.
There are different analytical methods used to determine the mineral composition of
coal and numerous authors who have studied these. Of these methods, powder X-
ray diffraction (XRD) has been the most utilised (van Alphen 2007)(Winburn et al.
2000)(Saikia, Boruah, and Gogoi 2007)(Mahadevan 1940) (Ritz and Klika 2010).
Scanning electron microscopy with XRF combination (SEM-XRD) is another method
used widely (Ritz and Klika 2010) for determination of elemental individual minerals.
There are also other sophisticated methods like Computer-controlled SEM
(CC_SEM)as stated in (van Alphen 2007) (Ritz and Klika 2010)and automatic image
analysis SEM (AIA_SEM) (Ritz and Klika 2010) and simple methods based on the
recalculation of chemical analysis to normative minerals.
There are various limitations that are linked to the methods listed above, and such
include XRD which has low detection limit for minerals with low ash content (Ritz and
Klika 2010). Quantitative XRD analysis appears to be better suited for characterising
complex materials (Winburn et al. 2000) like coal and coal ash which has many
phase compositions.
Analysis of the waste products from coal combustions are just as important to study
as they are similarly complex in composition depending on the coal. The ash is
formed from Inorganic matter in coal which includes (Ritz and Klika 2010) (Vassilev
et al. 2005)(Zhang, Han, and Xu 2003) compounds dissolved in pore solutions in
coal, chemical elements bonded to organic parts, and crystalline or amorphous form
of minerals. Determination of qualitative and quantitative determination of organic
minerals is impacted greatly by crystalline minerals (Ritz and Klika 2010).
Inorganic elements in coal is comprised of three group; major elements group (more
than 1000 ppm concentration), minor elements group (between 100 and 1000 ppm
concentration) and trace elements group (less than 100ppm concentration) (Zhang,

Han, and Xu 2003). Of the latter elements groups; elements like Al, Si, Fe, Ca, Mg,
Na, K, Cl and S are the typical major elements, elements such as Ba, P and Ti are
the most common minor elements found in coal,(Zhang, Han, and Xu 2003) and
there is a wide range of trace elements in coal and ash waste. The major elements
are highly responsible for slag formation and environmental pollutions associated
with coal combustion. Minor and trace elements do not have proven impact on the
environment.
The current paper is aiming at studying ash products of coal samples at different
temperatures to assess the improvement that can be made in the detection limit of
the studied samples. Objectives of this work is to characterise and understand
phase-mineral and chemical compositions of the different South African coal, and to
predict potential possible environmental concerns related to ash formed from this
coals.
2. EXPERIMENTAL
2.1 Sample preparation
Five different coal samples from around South Africa where used for this study. The
samples where ground to powder form. The samples where split using a rotary
splitter and packaged, and samples of approximately 1g were taken for the different
tests performed. Moisture content, volatile matter, ash composition and calorific
value studied by proximate analysis.
2.2 Combustion process A temperature controlled furnace was used to ash the samples at the different
temperatures. Preheated furnace to a stabilised required temperature. A crucible
containing the samples was placed in the furnace for 90 minutes. The samples were
left to cool down in ambient temperature overnight. The samples were analysed
using XRD in the in-house laboratory.
3. RESULTS AND DISCUSSIONS
Organic and inorganic matter in coal can be identified easily because of the colour
difference even with the naked eye. Figure 1 depletes difference in reflection and
dullness in colour, at the same time indicating complexity in composition of a single
coal particle.

Figure 1: Coal Samples with mineral matter and different maceral compositions.
3.1 Characterisation of coal samples
Proximate analysis conducted on the initial coal samples for percentage moisture,
volatile matter (VM), ash composition and calorific value (CV). This was conducted
five times on the same conditions and the average results are tabulated below.
Table 1: Proximate analysis results for the five samples considered.
Sample %Moisture % Vol Matter
% Ash Fixed carbon
CV
1 6.15 22.32 20.70 50.82 23.63
2 2.86 17.15 38.75 41.24 18.23
3 7.35 22.39 24.60 45.66 20.91
4 4.29 23.04 31.29 41.37 20.30
5 7.35 22.12 24.36 46.17 20.59
From the proximate analysis all of the samples had displayed similar results except
for sample 2 with less than 3% moisture content while the rest are between 4% and
8%, they also have between 22%-23% volatile matter while sample 2 has only 17%
volatile matter. In terms of percentage ash, sample two is still the odd one out at
above 38% while the rest are between 20-31%. The same behaviour is displayed on
CV and the only composite of coal that displayed a different behaviour even though
still the lowest fixed carbon was closer to sample 4.
Proximate analyses provide basic coal properties and characteristics, but XRD
analyses provides in-depth minerals and phase mineral composition. From
proximate analyses percentage ash content is obtained, but the compositional
minerals in the ash can require more advance analyses.

3.2 Evaluations of minerals in the samples by XRD
XRD analysis yielded 40 inclusive phase-minerals which were observed in the
samples. During the combustion process the first stage is characterised by
decomposition of coal organic components followed by the release when ignited as
per the combustion process. This work was conducted to understand the
volatilization or release of major elements at different temperature and their modes
of occurrence, concentration, physical changes and chemical reactions that takes
place during the combustion process. This was assessed by the amount of phase
minerals detected on the raw coal as compared to what is detected on various ash
compositions analysed by XRF.
Quantitative analysis of different mineral phases using XRD as an effective tool has
been proven by not giving individual diffraction patterns for the individual minerals
content (Ward, Nunt-Jaruwong, and Swanson 2005). This was confirmed that it can
be done for South African coals, and results are tabled in Table 2-6 and diffraction
patters for phase mineral compositions listed on Figure 2-6 for the five samples that
were considered for this study.
Table 2: Mineralogy of quantitate phase minerals percentage in weight assessed using XRD at different temperatures for sample 1.
Mineral phase names Chemical formula
Raw 350°c 500°c 750°c 1000°c
Aluminium Iron ( Al0.25 Fe0.75 ) 2.77
Anatase Ti O2 2.974 0.738 1.739 3.161
Aragonite Ca ( C O3 ) 3.434 3.245
Calcium carbonate Ca C O3 3.092 1.567 1.633
Calcium Iron Oxide Ca Fe O2 2.634
Calcium Manganese CaMn4 0.898
Calcium Silicon Oxide Ca Si O3 2.993
Calcium Sulphate Ca S O4 1.127
Carbon C 2.37
Dolomite Ca Mg ( C O3 )2 2.794
gypsum Ca S O4 ·2 H2 O 3.145 3.01 3.135
Gypsum, syn Ca ( S O4 ) ( D2 O )2 3.137
Hematite HP,Iron(3) Fe2 O3 1.53 3.053 2.702
Iron diiron(3) oxide Fe3 O4 2.694
Iron sulfate FeSO4 3.279
Iron sulfide Fe S 1.671 3.139
Kaolinite Al4 ( O H )8 ( Si4 O10 ) 1.015 1.72 1.791 3.227
Lime, syn Ca O 3.101 2.986
Magnesiorferrite, syn Fe2 Mg O4 2.856
Magnesite, HP Mg ( C O3 ) 3.156
Magnetite High Hp Mg ( C O3 ) 2.683
Monticellite, HP Ca Mg Si O4 3.32
plumbojarosite Pb Fe6 ( S O4 )4 ( O 3.183 3.457 3.196 2.924 3.177
Pyrite Fe S2 3.245 1.711
Quartz, low ,alpha -Si Si O2 0.557
Quartz, syn Si O2 0.418 0.85 0.743
Quartz,low HP, syn Si O2 0.373
Titanium Oxide Ti O 1.42
% of minerals at different temparatures
Sample 1
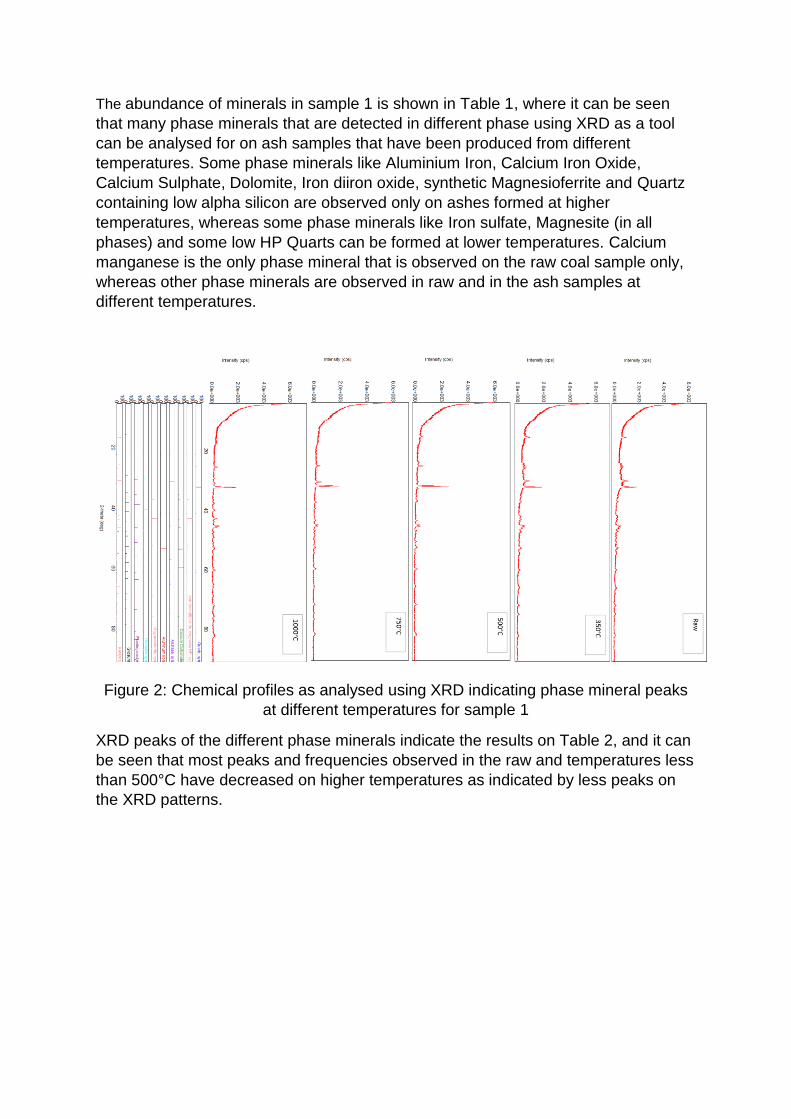
The abundance of minerals in sample 1 is shown in Table 1, where it can be seen
that many phase minerals that are detected in different phase using XRD as a tool
can be analysed for on ash samples that have been produced from different
temperatures. Some phase minerals like Aluminium Iron, Calcium Iron Oxide,
Calcium Sulphate, Dolomite, Iron diiron oxide, synthetic Magnesioferrite and Quartz
containing low alpha silicon are observed only on ashes formed at higher
temperatures, whereas some phase minerals like Iron sulfate, Magnesite (in all
phases) and some low HP Quarts can be formed at lower temperatures. Calcium
manganese is the only phase mineral that is observed on the raw coal sample only,
whereas other phase minerals are observed in raw and in the ash samples at
different temperatures.
Figure 2: Chemical profiles as analysed using XRD indicating phase mineral peaks
at different temperatures for sample 1
XRD peaks of the different phase minerals indicate the results on Table 2, and it can
be seen that most peaks and frequencies observed in the raw and temperatures less
than 500°C have decreased on higher temperatures as indicated by less peaks on
the XRD patterns.

Table 3: Mineralogy of quantitate phase minerals percentage in weight assessed
using XRD at different temperatures for sample 2.
Figure 3: Chemical profiles as analysed using XRD indicating phase mineral
peaks at different temperatures for sample 2
Sample 2 was not different as compared to sample 1, as there are more phase
minerals observed on the low temperature ashes than the higher temperatures. Even
though there was the difference in the initial coal quality for the different samples,
sample 2 behaved the same way in terms of phase minerals observed by XRD.
Mineral phase names Chemical formula
Raw 350°c 500°c 750°c 1000°c
Anatase, syn Ti O2 2.985 3.006
Anhydrite Ca ( S O4 ) 3.138
Chlorite-llb-4
( Mg11.06 Fe0.94 ) ( ( Si5.22
Al2.78 ) O20 ( O H )16 ) 1.384
Chlorite-serpentine
( Mg , Al )6 ( Si , Al )4 O10 ( O
H )8 1.148
Graphite-2H,syn C 1.607
gypsum Ca S O4 ·2 H2 O 2.815 3.231 3.178 3.24 1.998
Hematite HP,Iron(3) Fe2 O3 3.13 3.128 1.118
kaolite-1A Al2 Si2 O5 ( O H )4 1.031 1.221
Kaolite-1Ad Al4 ( O H )8 ( Si4 O10 ) 1.878
Lime, syn Ca O 1.765 2.124 1.506
muscovite K Mg Al Si4 O10 ( O H )2 1.782
plumbojarosite Pb Fe6 ( S O4 )4 ( O 3.159 3.221 1.773 3.363 3.374
Quartz, alpha low Si O2 0.744 0.454
Quartz, syn Si O2 1.048
Quartz,low HP, syn Si O2 0.39 0.489
Rutile,syn Ti O2 3.057 3.299
Vaterite Ca C O3 3.039
Vaterite, syn Ca C O3 3.004 3.014 1.491
Sample 2
% of minerals at different temparatures
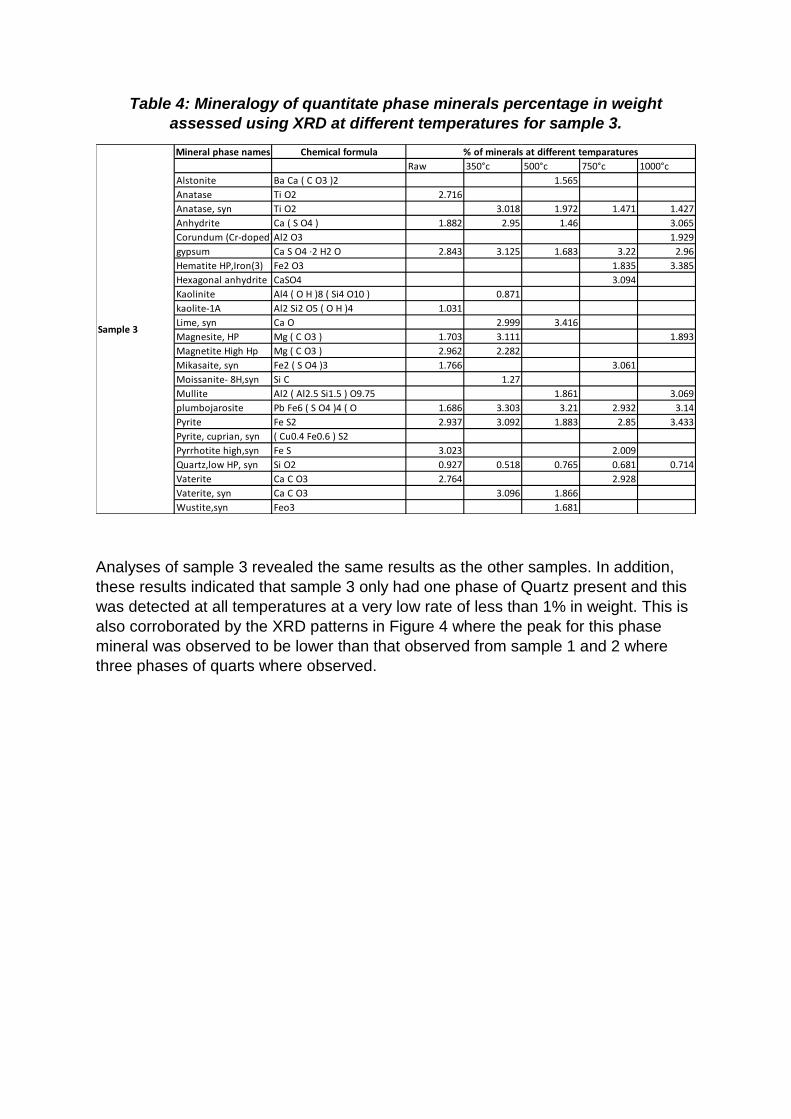
Table 4: Mineralogy of quantitate phase minerals percentage in weight
assessed using XRD at different temperatures for sample 3.
Analyses of sample 3 revealed the same results as the other samples. In addition,
these results indicated that sample 3 only had one phase of Quartz present and this
was detected at all temperatures at a very low rate of less than 1% in weight. This is
also corroborated by the XRD patterns in Figure 4 where the peak for this phase
mineral was observed to be lower than that observed from sample 1 and 2 where
three phases of quarts where observed.
Mineral phase names Chemical formula
Raw 350°c 500°c 750°c 1000°c
Alstonite Ba Ca ( C O3 )2 1.565
Anatase Ti O2 2.716
Anatase, syn Ti O2 3.018 1.972 1.471 1.427
Anhydrite Ca ( S O4 ) 1.882 2.95 1.46 3.065
Corundum (Cr-doped)Al2 O3 1.929
gypsum Ca S O4 ·2 H2 O 2.843 3.125 1.683 3.22 2.96
Hematite HP,Iron(3) Fe2 O3 1.835 3.385
Hexagonal anhydrite CaSO4 3.094
Kaolinite Al4 ( O H )8 ( Si4 O10 ) 0.871
kaolite-1A Al2 Si2 O5 ( O H )4 1.031
Lime, syn Ca O 2.999 3.416
Magnesite, HP Mg ( C O3 ) 1.703 3.111 1.893
Magnetite High Hp Mg ( C O3 ) 2.962 2.282
Mikasaite, syn Fe2 ( S O4 )3 1.766 3.061
Moissanite- 8H,syn Si C 1.27
Mullite Al2 ( Al2.5 Si1.5 ) O9.75 1.861 3.069
plumbojarosite Pb Fe6 ( S O4 )4 ( O 1.686 3.303 3.21 2.932 3.14
Pyrite Fe S2 2.937 3.092 1.883 2.85 3.433
Pyrite, cuprian, syn ( Cu0.4 Fe0.6 ) S2
Pyrrhotite high,syn Fe S 3.023 2.009
Quartz,low HP, syn Si O2 0.927 0.518 0.765 0.681 0.714
Vaterite Ca C O3 2.764 2.928
Vaterite, syn Ca C O3 3.096 1.866
Wustite,syn Feo3 1.681
Sample 3
% of minerals at different temparatures

Figure 4: Chemical profiles as analysed using XRD indicating phase mineral
peaks at different temperatures for sample 3.
Although sample 4 had phase minerals like quartz in two different forms, the amount
of other minerals were higher with Gypsum higher than 3% for sample 4. It was also
indicated by the XRD patterns that were observed. When phase mineral weight
compositions are higher, this also affects the peaks of the XRD patterns.
Table 5: Mineralogy of quantitate phase minerals percentage in weight
assessed using XRD at different temperatures for sample 4.
Mineral phase names Chemical formula
Raw 350°c 500°c 750°c 1000°c
Anatase Ti O2 1 522
Anatase, syn Ti O2 1.774 1.898
Anhydrite Ca ( S O4 ) 1.442
Aragonite Ca ( C O3 ) 1.95 2.141
Corundum (Cr-doped)Al2 O3 1.878 1.783
Dolomite Ca Mg ( C O3 )2 3.23 1.442 3.135 1.734
gypsum Ca S O4 ·2 H2 O 3.076 2.854 1.657 2.875 3.127
Hematite HP,Iron(3) Fe2 O3 1.412 1.947 2.043
kaolite-1A Al2 Si2 O5 ( O H )4 0.796 1.236
Lime, syn Ca O 3.045 1.62 1.79 1.258
Magnesite, HP Mg ( C O3 ) 2.931 1.247
Magnetite High Hp Mg ( C O3 ) 1.902
Mikasaite, syn Fe2 ( S O4 )3 1.566
Mullite Al2 ( Al2.5 Si1.5 ) O9.75 1.733 2.939 3.35
plumbojarosite Pb Fe6 ( S O4 )4 ( O 1.46 3.109 2.113 2.384 3.425
Pyrite Fe S2 1.915 3.455 3.402
Quartz, syn Si O2 0.987
Quartz,low HP, syn Si O2 0.716 0.524 0.678 0.906
Rutile,syn Ti O2 2.014
Vaterite Ca C O3 2.937
Vaterite, syn Ca C O3 1.642 3.212
Sample 4
% of minerals at different temparatures

For sample 4, most phase minerals were observed on the ash formed in higher
temperatures as shown in Table 5. Phase minerals like Magnesite and Magnetite are
observed only at the raw coal sample and ashes formed at the highest temperature.
Small but measurable amounts of quarts have been observed in two phases, but
generally higher amounts observed on other phase minerals.
Figure 5: Chemical profiles as analysed using XRD indicating phase mineral
peaks at different temperatures for sample 4
Results from this work indicates that profiling the sample using XRD is required
because all even though the samples can be classified in the same group, when it
comes the quantitative minerals contained and how they are formed in different
temperatures different results are obtained. Better understanding of the sample
would be made with such profiling.

Table 6: Mineralogy of quantitate phase minerals percentage in weight
assessed using XRD at different temperatures for sample 5.
Sample 5 has high mineral concentrations in weight percentages on the raw and
lower temperatures and lower on the high temperature ashes. The XRD patters
showed the same with lower peaks at the higher temperatures and high peaks at
lower temperatures.
Figure 6: Chemical profiles as analysed using XRD indicating phase mineral
peaks at different temperatures for sample 5
Mineral phase names Chemical formula
Raw 350°c 500°c 750°c 1000°c
Anatase, syn Ti O2 1.892 0.757
Anhydrite Ca ( S O4 ) 2.031 1.043 1.365
Aragonite Ca ( C O3 ) 3.209 0.922
Dolomite Ca Mg ( C O3 )2 3.207 1.106
Graphite-2H,syn C 0.556
gypsum Ca S O4 ·2 H2 O 1.79 1.784 2.977 1.092
Hematite HP,Iron(3) Fe2 O3 1.446 1.583 1.29
Kaolinite Al4 ( O H )8 ( Si4 O10 ) 0.651
kaolite-1A Al2 Si2 O5 ( O H )4 1.068
Lime, syn Ca O 2.988 1.721 1.289
Magnesite, HP Mg ( C O3 ) 1.648 0.781
Mikasaite Fe2 ( S O4 )3 1.818 1.362
Mullite Al2 ( Al2.5 Si1.5 ) O9.75 2.903 1.463 1.505 2.846 0.82
muscovite K Mg Al Si4 O10 ( O H )2
plumbojarosite Pb Fe6 ( S O4 )4 ( O 3.11 1.488 0.903 1.626 3.172
Pyrite Fe S2 2.85 1.604 2.85 2.85 0.921
Quartz, syn Si O2 1.546 0.757
Quartz,low HP, syn Si O2 1.088 1.337
Rutile,syn Ti O2 2.887 0.862
Vaterite, syn Ca C O3 1.429
Sample 5
% of minerals at different temparatures

Coal properties depends mainly on its physical and chemical structure and variety in
the organic and inorganic matter (Saikia, Boruah, and Gogoi 2007) (Saikia and
Boruah 2008), and the properties of South African coals are no different as the
phase minerals contained would determine the properties. Properties of coal will
determine the usage of coal, the changes and phase transformation during
combustion process. The current work indicates that to be able to determine the
later, qualitative and quantitative analysis and profiling of coal is required. The
mineral matter in coal affects coal usages (Tshiongo and Mulaba-bafubiandi 2013).
XRD is a powerful profiling tool in coal characterisation and acceptance for the
intended usage.
From the overall results, aluminium appears as part of two-phase minerals
(Aluminium Iron and Kaolinite). From the two phase minerals there are no traces of
Aluminium Iron detected on raw coal and those combusted at lower temperatures
from (350-750○C), the only observation of this mineral is at 1000○C. When compared
to Kaolinite, smaller content where detected at lower temperatures and a higher
amount at 1000○C.
Silicon appeared in four phase minerals, where Calcium Silicon oxide is at higher
temperature ashes and Monticellite, HP at lower temperature but the other
occurrence being Kaolinite and Quarts in all temperatures. Calcium Silicon oxide is
formed from reactions of coal compositions and this reaction of formation from Lime
and Quartz according to the following reaction (Wang et al. 2016);
CaO + SiO2 = CaSiO3
Figure 7 indicates the relationship between Monticellite and Calcium Silicon oxide,
where they exist together but one decreases in weight percentage as the other
increases. This explains the results were either one is found at lower temperatures
and the other at high temperature respectively.

Figure 7: Phase equilibrium diagram of the join W–D of the ternary system
SiO2–CaO–MgO (Diba et al. 2014)
From the phase equilibrium above, it is evident that most of the SiO2-CaO-MgO
phase minerals exist together and this is proven by the obtained results. Their
compositions even at the low ash temperatures investigated in this work is always
vice-versa for example where compositions of Monticellite is higher there is lower
composition in %weight of Calcium Silicon Oxide . This behaviour is noted by the
results were either one will be observed at any temperature.
4. SUMMARY
From the proximate analysis, sample 2 is the least desirable as it has higher ash
content, low volatiles and lower CV as compared to the other samples. Chemical
composition of coal varies greatly even if the proximate analyses classify it as the
same type or rank. This is despite the region of the samples, and the current work
proved this. The variety in composition in coal and its heterogeneity is due to the
phase mineral compositions.
Coal quality has no impact on the detection limit of the raw and ash samples, this is
shown by the similarities of the peaks and the detection of different mineral phases
as indicated by the results. It is therefore recommended that before utilising any coal,
it is better to profile the samples to know the phase minerals that are formed at the
temperature that coal will be subjected to. An amount of individual elements presents
can be estimated using these results using the recalculation methods. Reactions that
are taking place during the combustion process, together with the products formed
from the different reactions can be identified.

This would give information that is useful to identify the mineral formed at these
temperatures and ways to deal with the hazards they pose to humans and the
environment when such coal are combusted. The total summative 40 phase minerals
observed from the samples considered therefore confirm coal being a
heterogeneous matter. It is therefore not adequate to characterise coal on just the
proximate and ultimate analysis without deeper understanding of the coal in
question. XRD is therefore an adequate and reliable way of quantitative analyses of
minerals present in the coal and ash samples and this analytical technique can be
used to profile the different coal sample and their ashes formed.
5. ACKNOWLEDGEMENTS
I would like to thank Bongumusa Mhlanga for his diligent work in the laboratory. I will
also like to express gratitude to the University of Johannesburg, department of
Metallurgy and the support staff who assisted in the work.
6. REFERENCES
Alphen, C. van. 2007. “Automated Mineralogical Analysis of Coal and Ash Products - Challenges and Requirements.” Minerals Engineering 20 (5): 496–505. doi:10.1016/j.mineng.2006.12.013.
Diba, Mani, Ourania-Menti Goudouri, Felipe Tapia, and Aldo R. Boccaccini. 2014. “Magnesium-Containing Bioactive Polycrystalline Silicate-Based Ceramics and Glass-Ceramics for Biomedical Applications.” Current Opinion in Solid State and Materials Science 18 (3): 147–67. doi:10.1016/j.cossms.2014.02.004.
Mahadevan, C. 1940. “Studies in Coal by X-Ray Diffraction Methods.”
Ritz, M., and Z. Klika. 2010. “Determination of Minerals in Coal by Methods Based on the Recalculation of the Bulk Chemical Analysis.” Acta Geodyn.Geomater 7 (4): 453–60.
Saikia, Binoy K, and Rajani K Boruah. 2008. “Structural Studies of Some Indian Coals by Using X-Ray Diffraction Techniques” 16: 89–94.
Saikia, Binoy K, R K Boruah, and P K Gogoi. 2007. “FT-IR and XRD Analysis of Coal from Makum Coalfield of Assam.” Earth Syst. Sci 116 (6): 575–79.
Tshiongo, N, and A Mulaba-bafubiandi. 2013. “South African Coal and Its Abrasiveness Index determination:An Account of Challanges.” In Southern African Universities Power Engineering Conference (SAUPEC).
Vassilev, Stanislav V., Christina G. Vassileva, Ali I. Karayigit, Yilmaz Bulut, Andres Alastuey, and Xavier Querol. 2005. “Phase–mineral and Chemical Composition of Composite Samples from Feed Coals, Bottom Ashes and Fly Ashes at the Soma Power Station, Turkey.” International Journal of Coal Geology 61 (1): 35–63.

doi:10.1016/j.coal.2004.06.004.
Wang, Fanmao, Jijun Wu, Wenhui Ma, Min Xu, Yun Lei, and Bin Yang. 2016. “Removal of Impurities from Metallurgical Grade Silicon by Addition of ZnO to Calcium Silicate Slag.” Separation and Purification Technology 170: 248–55. doi:10.1016/j.seppur.2016.06.060.
Ward, Colin R., Sorawit Nunt-Jaruwong, and Jeni Swanson. 2005. “Use of Mineralogical Analysis in Geotechnical Assessment of Rock Strata for Coal Mining.” International Journal of Coal Geology 64 (1–2): 156–71. doi:10.1016/j.coal.2005.03.014.
Winburn, Ryan S, Stephanie L Lerach, Bryan R Jarabek, Marissa A Wisdom, Dean G Grier, and Gregory J Mccarthy. 2000. “Quantitative XRD Analysis of Coal Combustion by-Products by the Rietveld Method. Testing with Standard Mixture.” International Centre for Diffraction Data ( ICDD), Advances in X-Ray Analysis. 42 (C): 387–96.
Zhang, Jun, Chun Li Han, and Yi Qian Xu. 2003. “The Release of the Hazardous Elements from Coal in the Initial Stage of Combustion Process.” Fuel Processing Technology 84 (1–3): 121–33. doi:10.1016/S0378-3820(03)00049-3.
kagisoma
Text Box
ISBN 978-1-86822-690-0