Quantitative Traits Modes of Selection - David Boglerdavidbogler.com/Evolution-Lectures/Lecture...
62
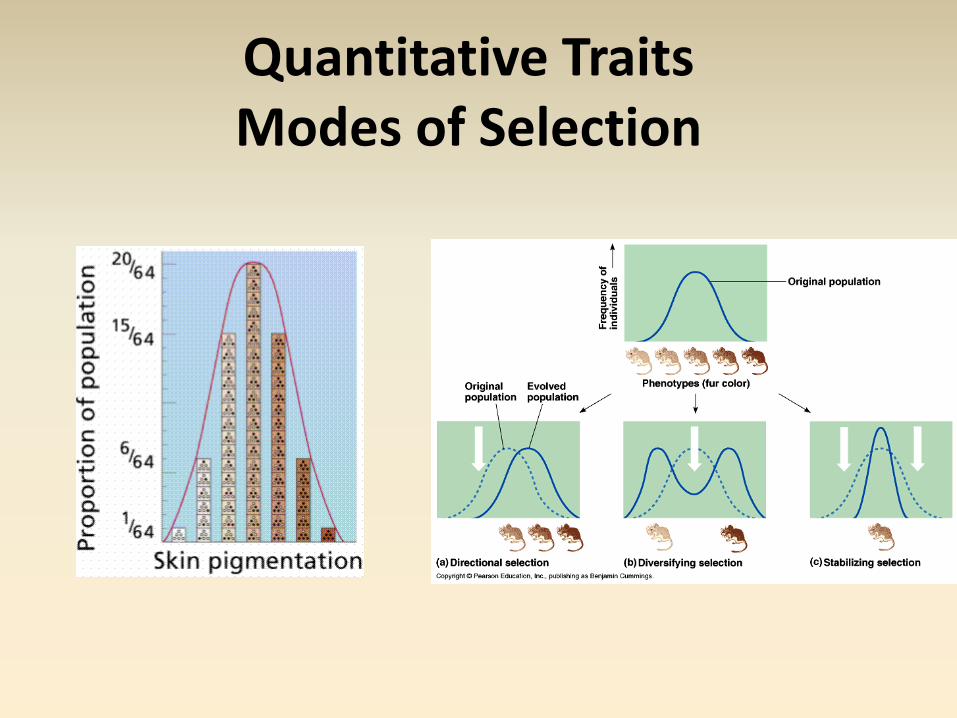
Quantitative Traits Modes of Selection
Transcript of Quantitative Traits Modes of Selection - David Boglerdavidbogler.com/Evolution-Lectures/Lecture...
Quantitative Traits Modes of Selection
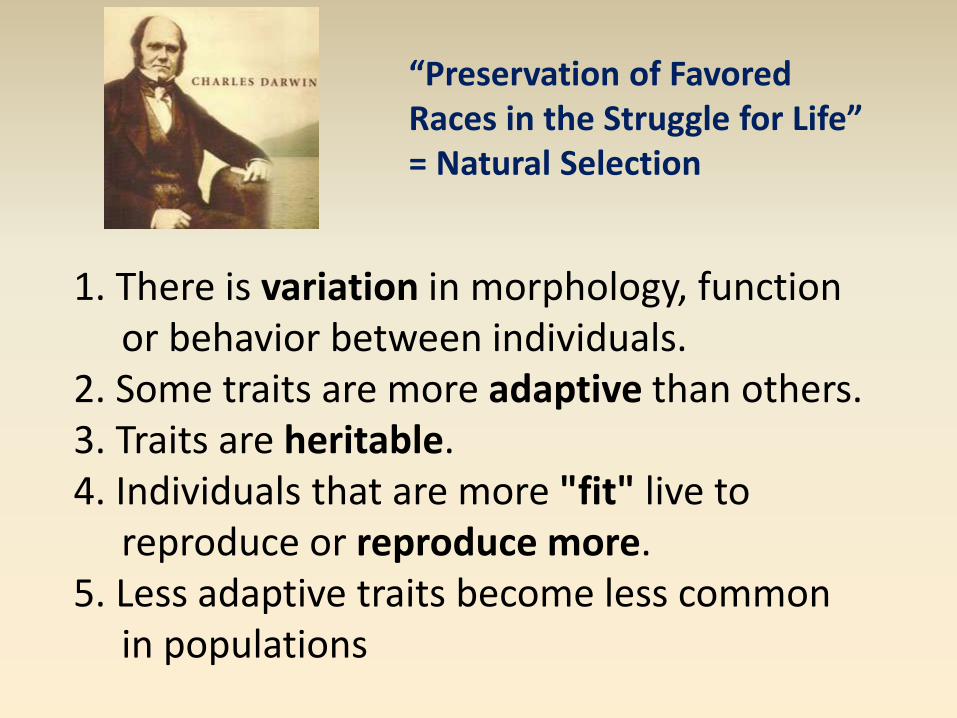
1. There is variation in morphology, function or behavior between individuals.
2. Some traits are more adaptive than others. 3. Traits are heritable. 4. Individuals that are more "fit" live to
reproduce or reproduce more. 5. Less adaptive traits become less common
in populations
“Preservation of Favored Races in the Struggle for Life” = Natural Selection
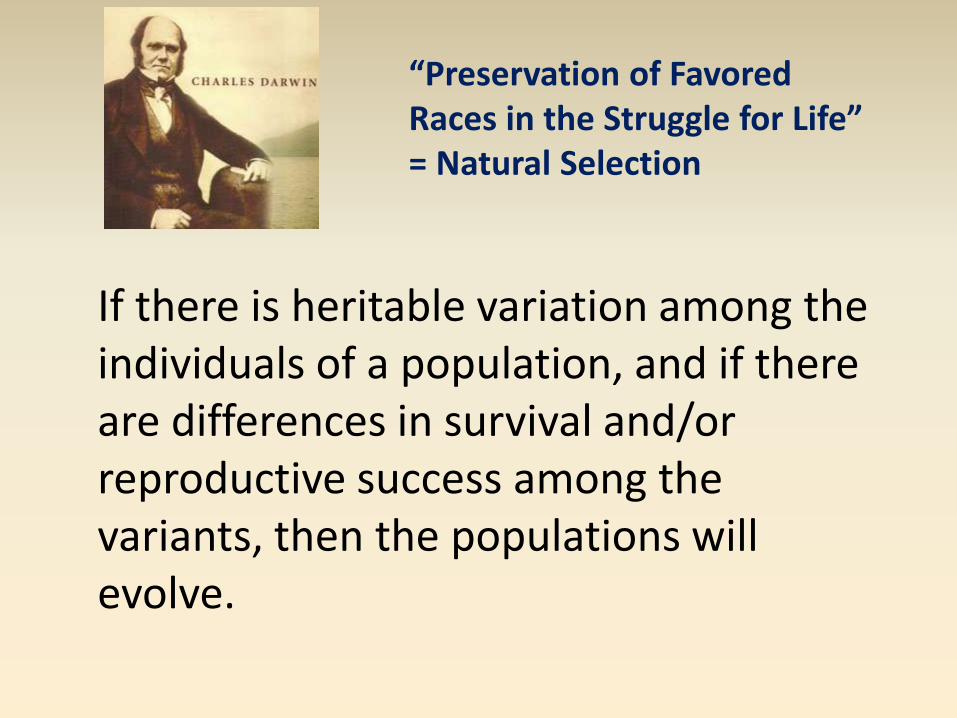
If there is heritable variation among the individuals of a population, and if there are differences in survival and/or reproductive success among the variants, then the populations will evolve.
“Preservation of Favored Races in the Struggle for Life” = Natural Selection
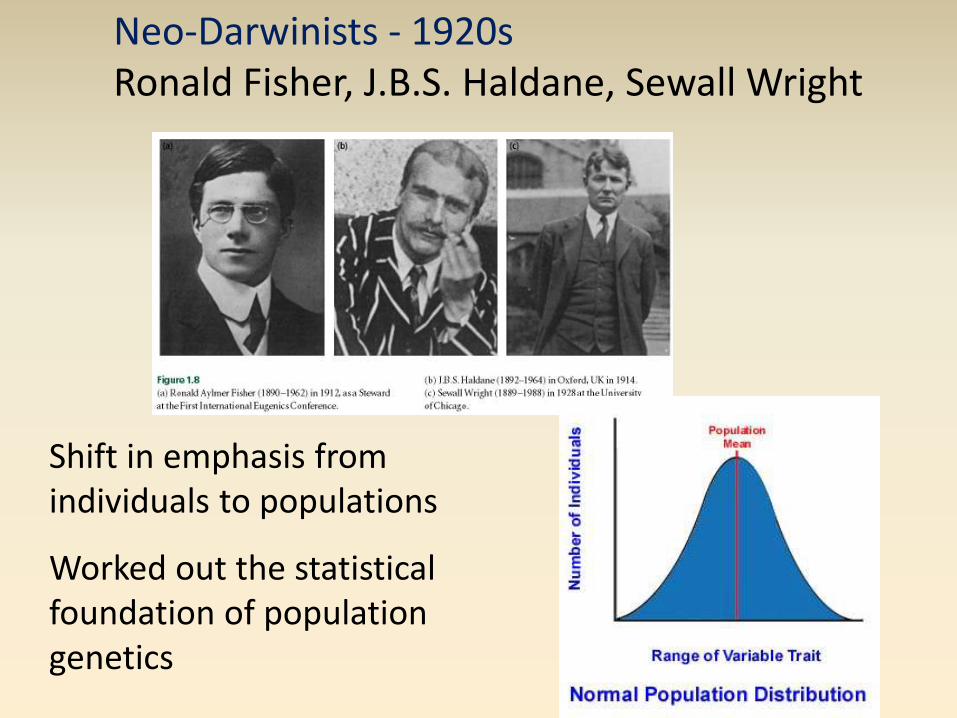
Shift in emphasis from individuals to populations
Worked out the statistical foundation of population genetics
Neo-Darwinists - 1920s Ronald Fisher, J.B.S. Haldane, Sewall Wright

5
Simply Inherited and Polygenic Traits
Simply inherited traits: traits affected by one or few genes (coat color, presence of horns, shape of seed in garden pea, …..).
Phenotypes of simply inherited traits are placed into categories (qualitative or categorical or discontinuous traits)
Not affected or very little affected by the environment.

Snapdragons – incomplete dominance for flower color
How can discrete alleles be the basis of continuous variation?
Simple Inheritance
0.50
0.25 0.00

Additive – each R allele adds the same amount to the phenotype
R = “+” r = “0”
How can discrete alleles be the basis of continuous variation?
Polygenic Inheritance
R1R2 R1r2 r1R2 r1r2
R1R2
R1r2
r1R2
r1r2
R1R1R2R2 R1R1R2r2 R1r1R2r2 R1r1R2R2
R1R1R2r2
R1r1R2R2
R1R1r2r2 R1r1R2r2 R1r1r2r2
R1r1R2r2 r1r1R2R2 r1r1R2r2
R1r1R2r2 R1r1r2r2 r1r1r2r2 r1r1R2r2
6/16
4/16
1/16
0
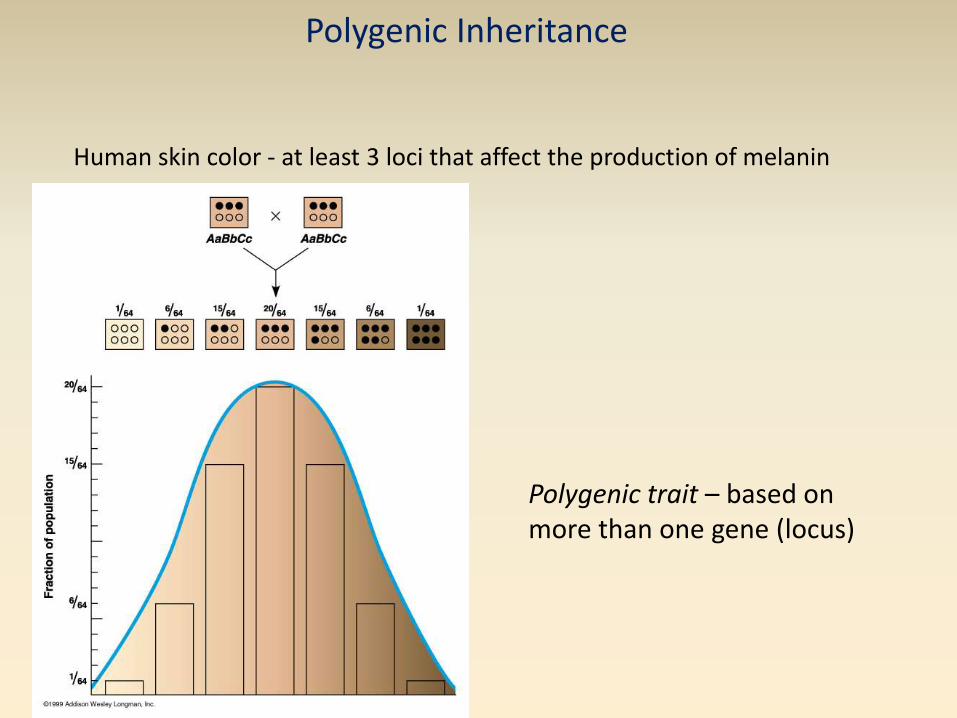
Polygenic trait – based on more than one gene (locus)
Human skin color - at least 3 loci that affect the production of melanin
Polygenic Inheritance
Polygenic Inheritance
Polygenic inheritance is a characteristic showing continuous variation and is controlled by the alleles of more than one gene
The more genes involved the more intermediate phenotypes that can be produced
The effects of the genes are additive (each dominant allele of each gene adds a contribution towards the characteristic controlled by the gene)


11
Polygenic Inheritance
Generally described in numbers.
Typically quantitative or continuous in their expression (quantitative or continuous traits)
Polygenic traits are affected by the environment.
They generally have a normal distribution

In general, the distribution of quantitative traits values in a population follows the normal distribution (also known as Gaussian distribution or bell curve). These curves are characterized by the mean (mid-point) and by the variance (width). Often standard deviation, the square root of variance, is used as a measure of the curve’s width.
Normal Distribution

13
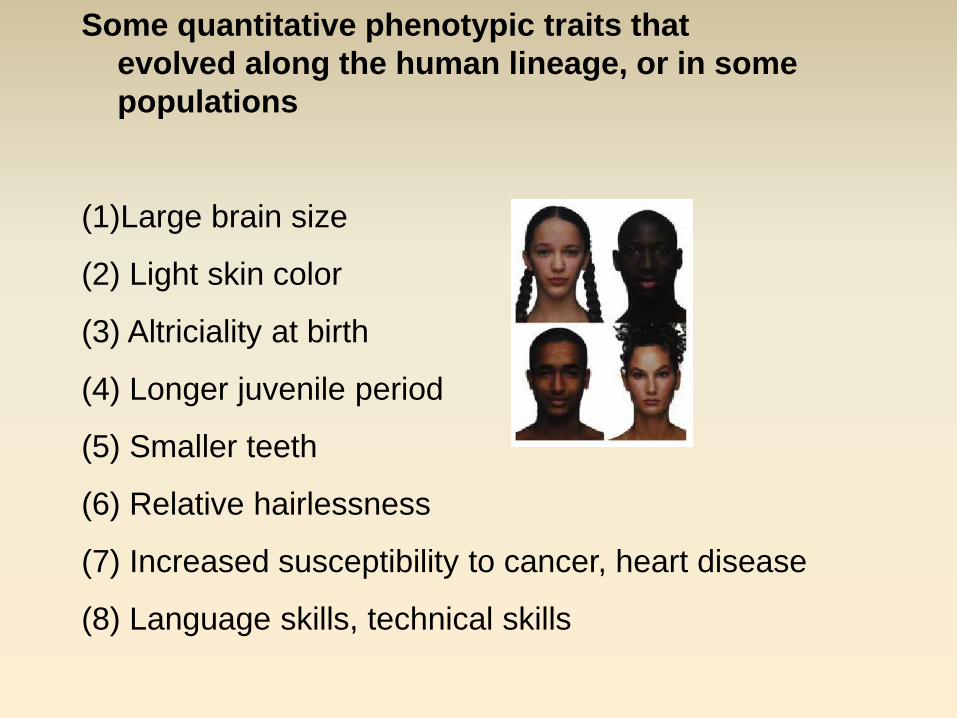
Some quantitative phenotypic traits that
evolved along the human lineage, or in some
populations
(1)Large brain size
(2) Light skin color
(3) Altriciality at birth
(4) Longer juvenile period
(5) Smaller teeth
(6) Relative hairlessness
(7) Increased susceptibility to cancer, heart disease
(8) Language skills, technical skills

1. How do genetics and the environment affect a trait?
2. Which and how many genes produce a set of phenotypes for a trait; where in the genome are they located?
3. Do some genes play a major role, whereas other genes modify or play a small role?
4. How does selection affect the trait? What form of selection?
Some of the big questions of
quantitative genetics analysis
16
Quantitative Genetics: is the science which deals with the inheritance of quantitative traits.
Quantitative genetics allows us to measure the degree to which variation in a trait is heritable (and therefore can respond to selection).
We can also measure the strength of selection
Combining heritability and strength of selection allows us to predict evolutionary change in response to selection.
Quantitative Trait Loci – QTLs
Portion of a genome that influence
quantitative traits. Identify QTLs by identifying co-inheritance of
specific genetic marker alleles (such as Single Nucleotide Polymorphism or microsatellites) with the phenotypic trait
QTLs are identified by genetic mapping using DNA markers.
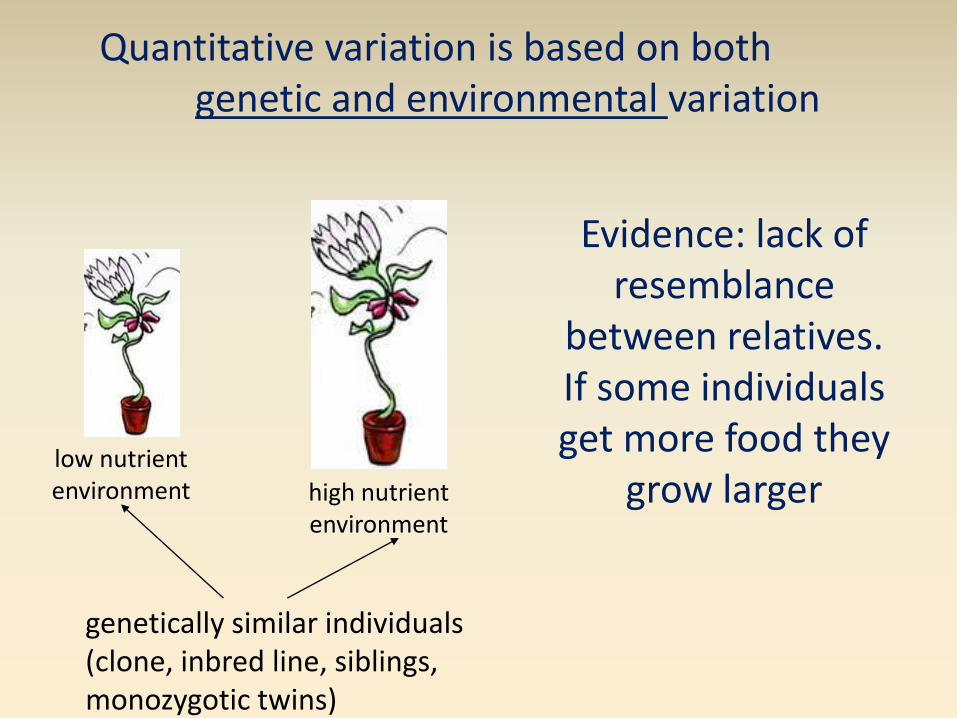
Evidence: lack of resemblance
between relatives. If some individuals get more food they
grow larger
genetically similar individuals (clone, inbred line, siblings, monozygotic twins)
low nutrient environment high nutrient
environment
Quantitative variation is based on both genetic and environmental variation

19
The basic model for quantitative traits
P = G + E
P = phenotypic value for the trait of one individual (plant or animal).
G = the effect of the genes carried by the individual (genotypic value).
E = the effect of the environmental factors on the phenotype of the animal.
Effect of Environment
Many characteristics which show continuous variation (e.g. height, foot size, etc.) are influenced by the environment
They are dependant on favourable environmental conditions for their full phenotypic expression.
For example, regardless of how many dominant alleles for height that a person inherits, he or she will not reach their full potential for height without consuming an adequate diet during childhood and adulthood.

21
Heritability (Simplified)
Heritability in the broad sense (H2): is the proportion of the total phenotypic variance that is due to all genetic effects (additive, dominance and epistasis ):
P
G
V
VH 2
It measures the strength of the relationship between the phenotypic values of the individuals and their genotypic values.
Heritability means that offspring should resemble their parents and relatives
Variation due to genetics ____________________
Total phenotypic variation Genetics + Environment

22
Heritability in the narrow sense (h2): is the proportion of the phenotypic variance that is due to additive genetic effects only.
P
A
V
Vh 2
It measures two things: 1.The degree to which the offspring resemble
their parents in the phenotype for a trait. 2.The strength of the relationship between the
phenotypic values and the additive genetic effects (the relationship between P and A).
Estimating Heritability
(1) Analyze related individuals: twins of different type, or parents and offspring
(2) Measure the response of a population, in the next generation, to selection

The slope of the regression line is .75, which indicates high heritability.

Heritable Variation – compare parents and offspring
Heritable = variation can be passed from parents to offspring
mother’s flower size predicts offspring’s flower size

John and Julian Lennon
Parents and Children - about 50% shared genes
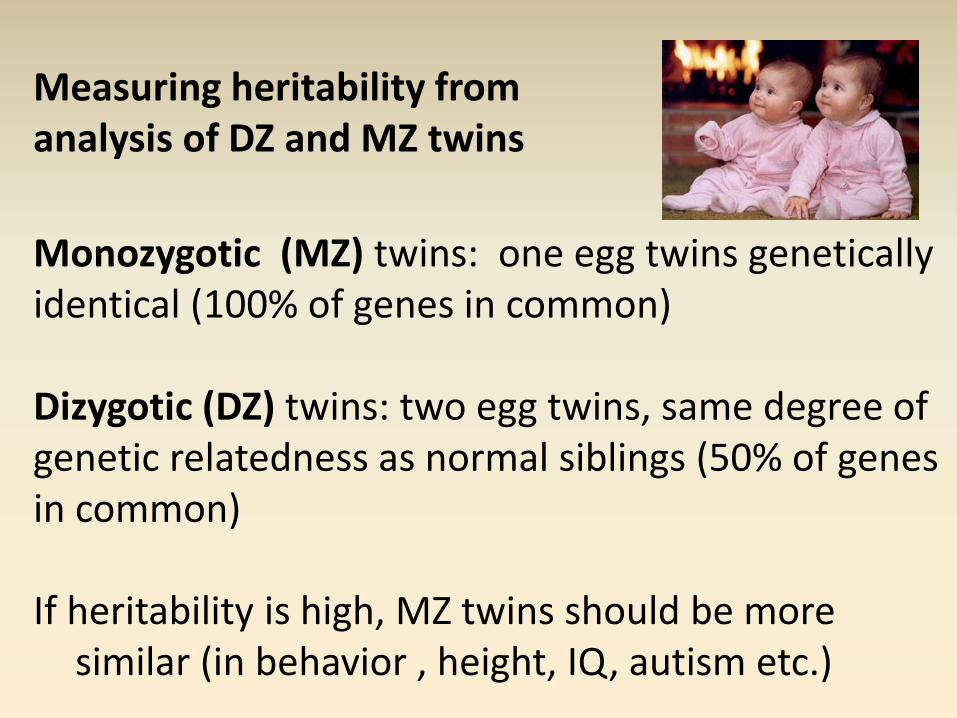
Measuring heritability from analysis of DZ and MZ twins
Monozygotic (MZ) twins: one egg twins genetically identical (100% of genes in common) Dizygotic (DZ) twins: two egg twins, same degree of genetic relatedness as normal siblings (50% of genes in common) If heritability is high, MZ twins should be more
similar (in behavior , height, IQ, autism etc.)
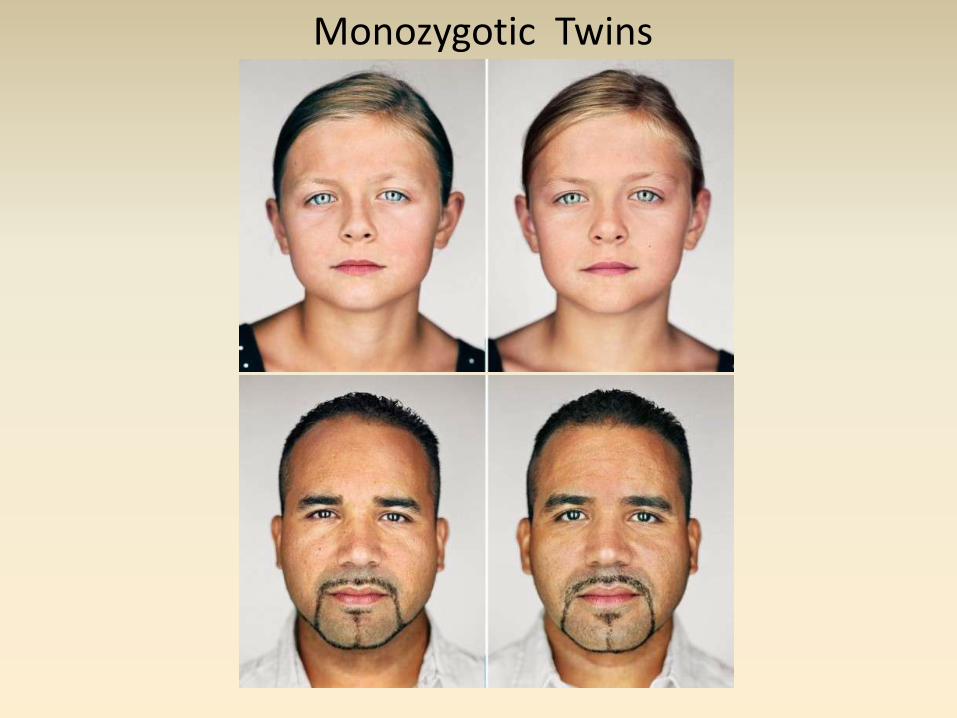
Monozygotic Twins
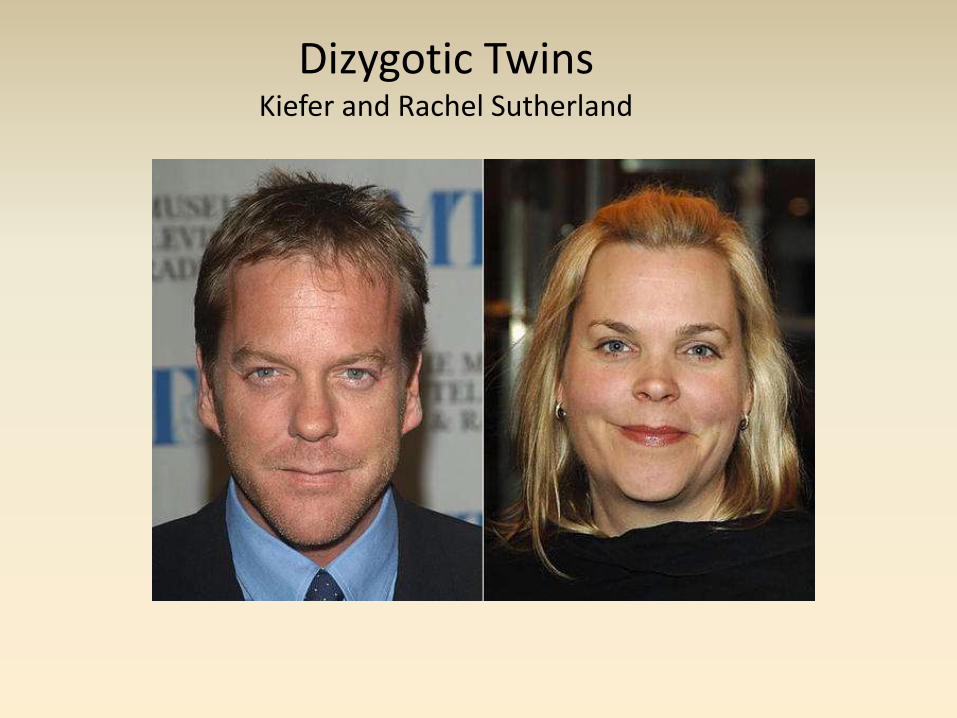
Dizygotic Twins Kiefer and Rachel Sutherland
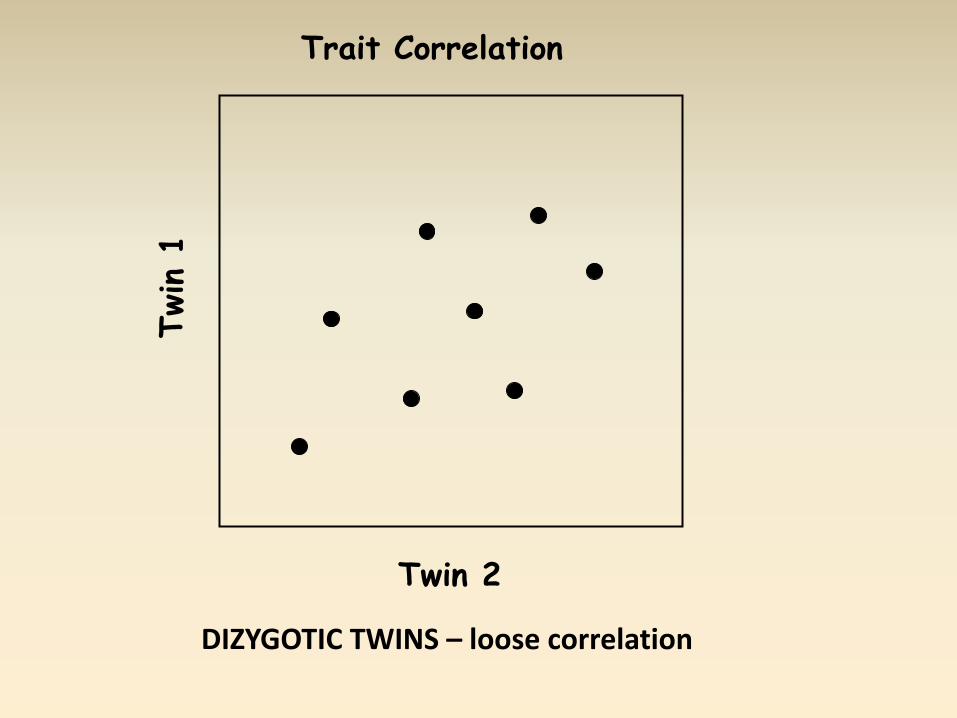
Twin 2
DIZYGOTIC TWINS – loose correlation
Trait Correlation

Twin 2
MONOZYGOTIC TWINS – tight correlation
CORRELATION

Reaction norms of plant height in individuals of yarrow Achillea millefolium grown from seed obtained at low-, mid-, and high-elevation sites in California and raised in transplant gardens at three elevations. Clausen, Keck, Heisey, 1948
Common Garden Experiment

Heritability of different human traits
0 – 1 (low to high)
TRAIT HERITABILITY
Fingerprint pattern >0.9
Height 0.7
IQ 0.7
Triglyceride 0.7
Autism, schizophrenia 0.3-0.6
Weight 0.5
Cholesterol level 0.45
Blood pressure 0.4
Handedness 0.3
Fertility 0.1
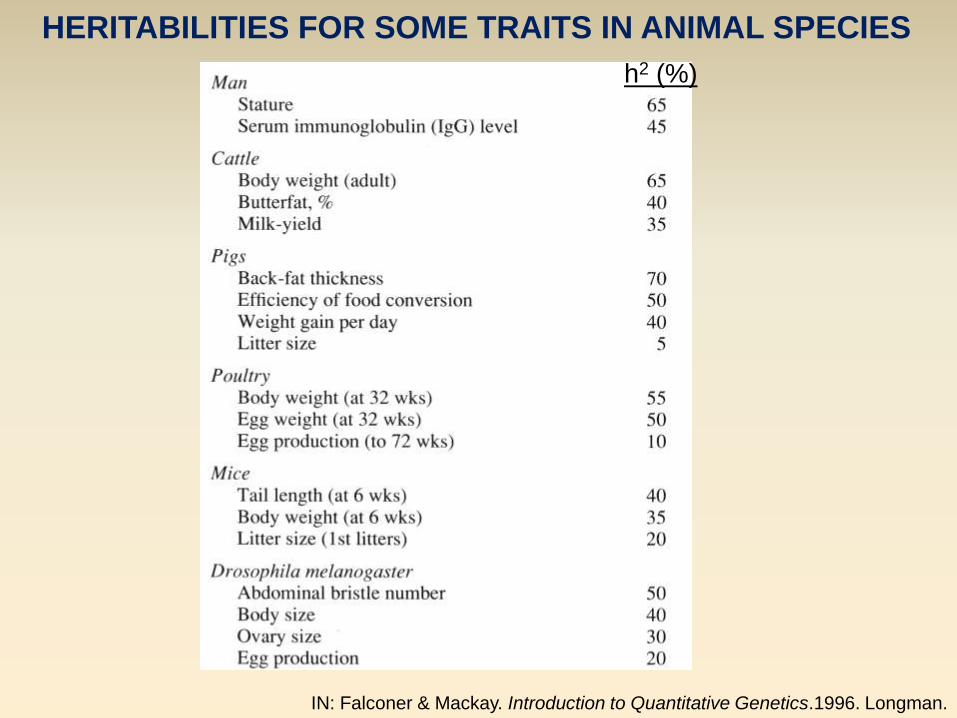
IN: Falconer & Mackay. Introduction to Quantitative Genetics.1996. Longman.
HERITABILITIES FOR SOME TRAITS IN ANIMAL SPECIES
h2 (%)

mean trait value of selected individuals
Quantifying Selection - Selection Differential
number of individuals
body size (or other trait)
Selection differential
S = - mean trait value before selection
5 6
S = 6 – 5 = 1

Response to selection
Measure response to artificial selection Response to Selection = R R = H X Selection Differential

Importance of Heritability Measures the degree to which variation in a
quantitative trait can be passed from parent to offspring; how well parent’s trait predicts offspring’s trait
Heritability is very important in selection (in genetic improvement of crops and breeds)
It determines if phenotypic selection would be efficient or not:
Small heritability: phenotypic selection is not efficient (low accuracy of selection).
High heritability: phenotypic selection is efficient (high accuracy of selection)

Selection

“This preservation of favourable individual differences and variations, and the destruction of those that are injurious, I have called Natural Selection….”
Charles Darwin
The Origin of Species 1859

Remember the idea….
….more organisms born than can survive and reproduce
….variation among individuals in the population
….some of this variation is heritable
….variation in form leads to variation in survival.
Therefore, over generations, the population changes in response to the environment.
Some call it “survival of the fittest”.
Darwin called it natural selection.
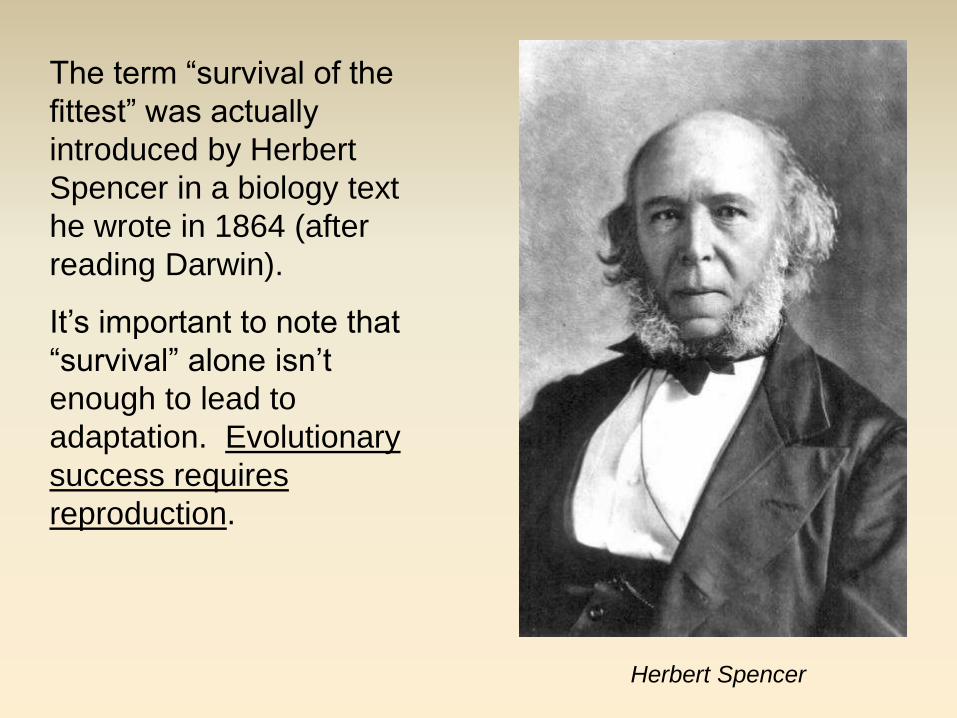
The term “survival of the
fittest” was actually
introduced by Herbert
Spencer in a biology text
he wrote in 1864 (after
reading Darwin).
It’s important to note that
“survival” alone isn’t
enough to lead to
adaptation. Evolutionary
success requires
reproduction.
Herbert Spencer
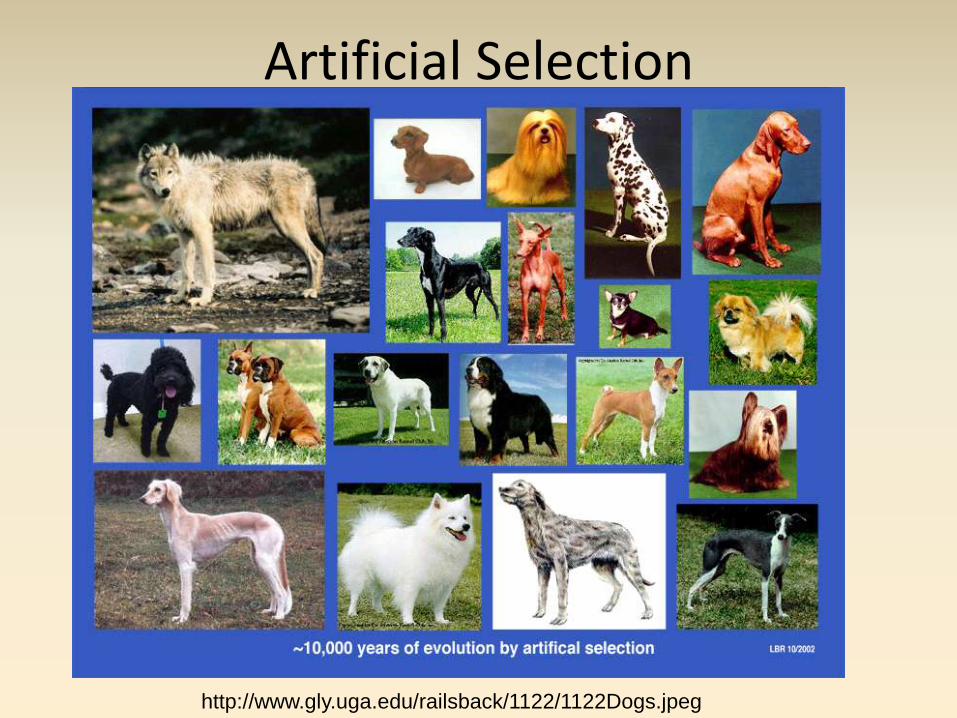
Artificial Selection
http://www.gly.uga.edu/railsback/1122/1122Dogs.jpeg

Artificial Selection
http://www.bio.miami.edu/dana/160/artificialselection.jpg
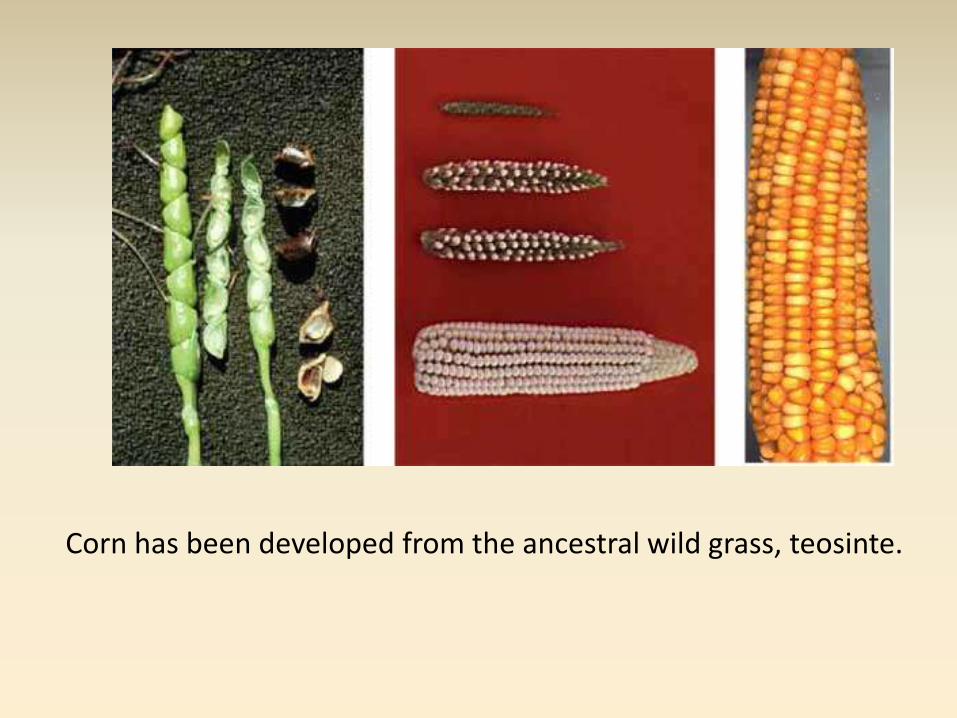
Corn has been developed from the ancestral wild grass, teosinte.
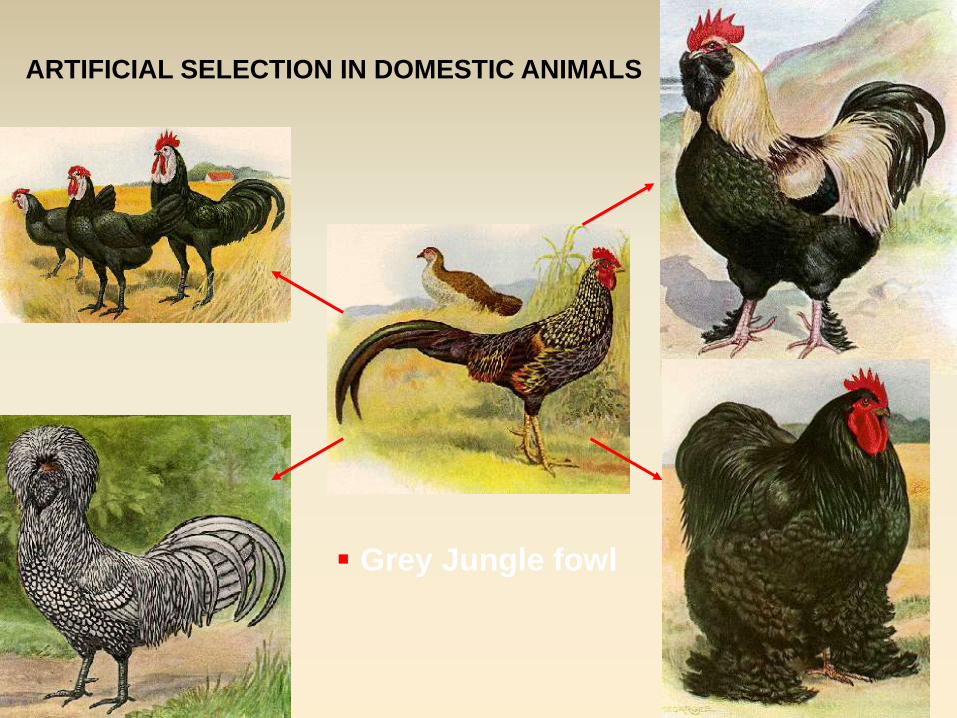
ARTIFICIAL SELECTION IN DOMESTIC ANIMALS
Grey Jungle fowl
Natural Selection
Some individuals in a population, because of their phenotypic characteristics, produce more offspring that themselves live to reproduce.
– Natural selection can favor, disfavor, or conserve the genetic make-up of a population.

The environmental factors leading to selection may be either…..
…biotic
…or abiotic.
Agents of Natural Selection
Abiotic factors – Climate
– Geology
– Other non-living factors
Biotic factors – Competition
• Food, Shelter, Mating
– Interspecies Interactions • Predation
– Sexual Selection
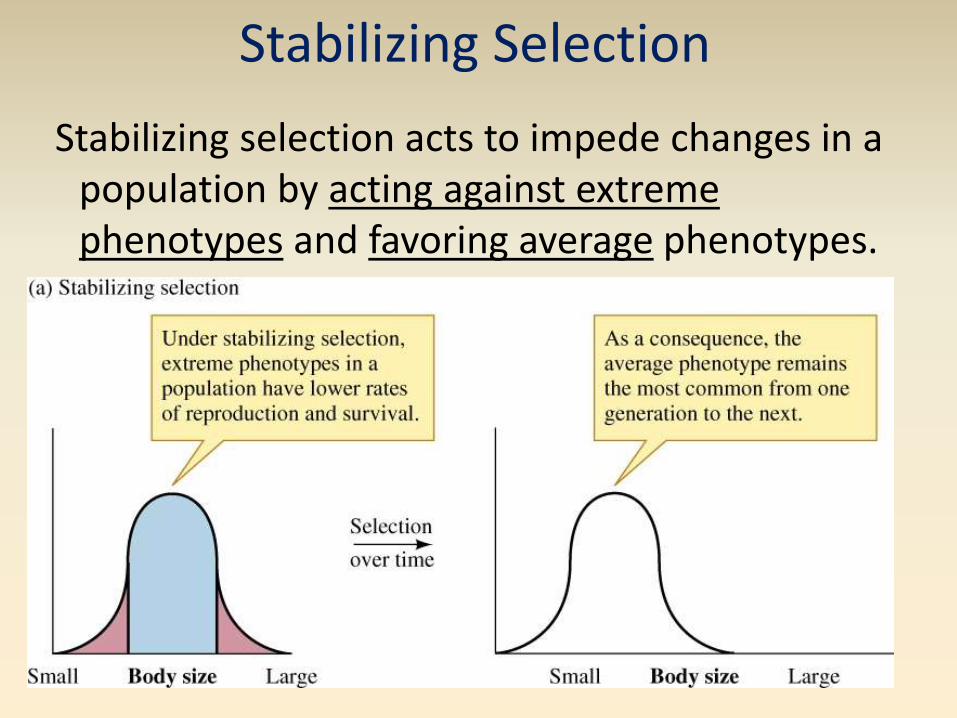
Stabilizing Selection
Stabilizing selection acts to impede changes in a population by acting against extreme phenotypes and favoring average phenotypes.

Stabilizing selection

Directional Selection
Directional selection leads to changes in phenotypes by favoring an extreme phenotype over other phenotypes in the population.
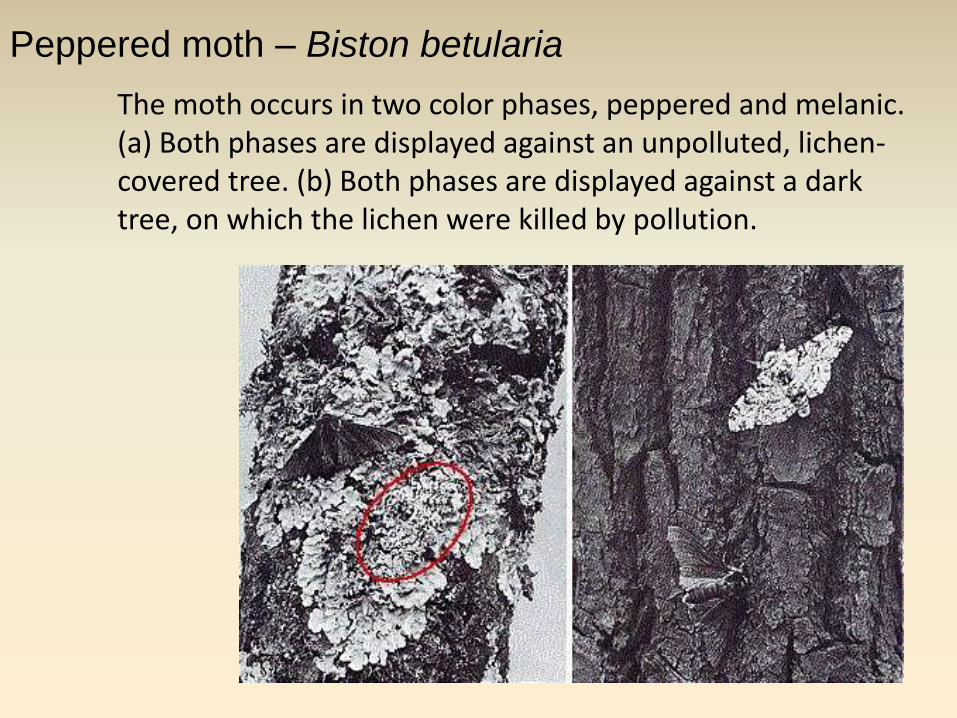
The moth occurs in two color phases, peppered and melanic. (a) Both phases are displayed against an unpolluted, lichen-covered tree. (b) Both phases are displayed against a dark tree, on which the lichen were killed by pollution.
Peppered moth – Biston betularia
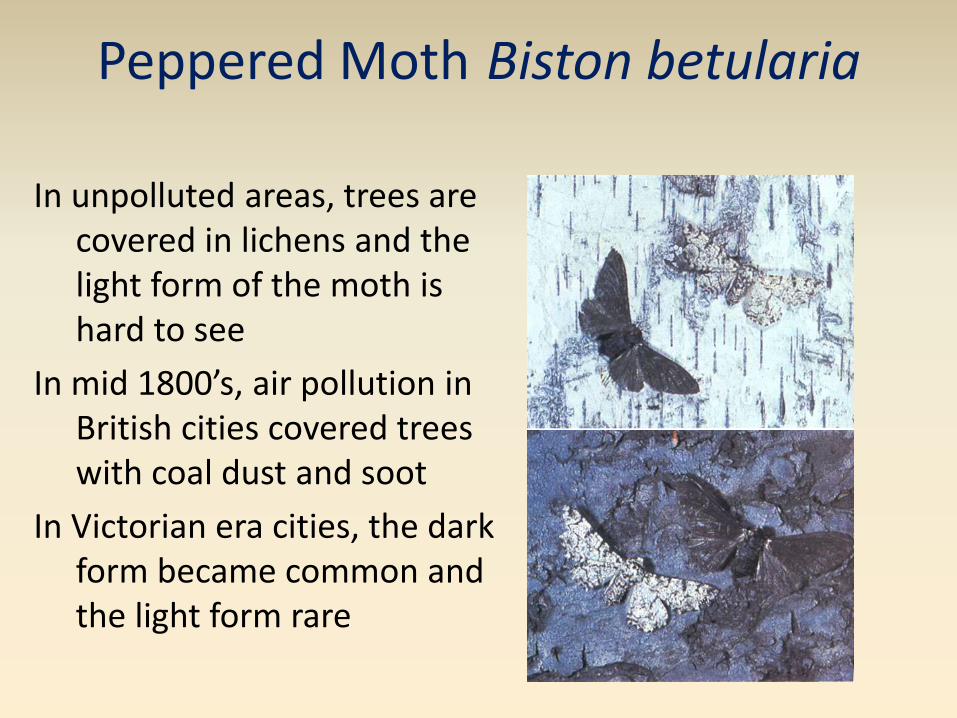
Peppered Moth Biston betularia
In unpolluted areas, trees are covered in lichens and the light form of the moth is hard to see
In mid 1800’s, air pollution in British cities covered trees with coal dust and soot
In Victorian era cities, the dark form became common and the light form rare
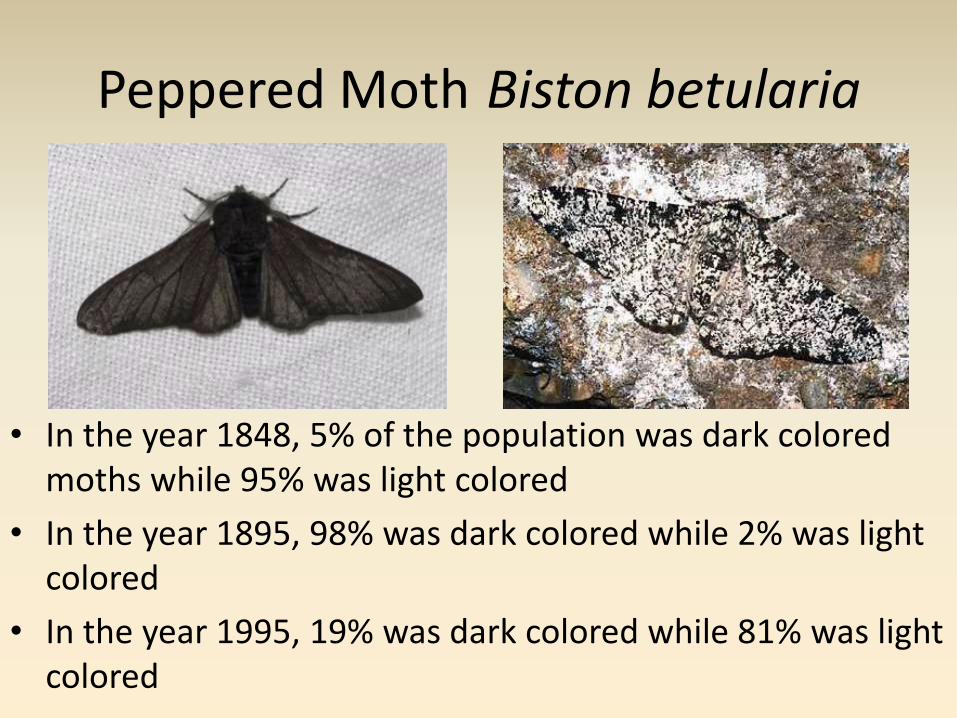
Peppered Moth Biston betularia
• In the year 1848, 5% of the population was dark colored moths while 95% was light colored
• In the year 1895, 98% was dark colored while 2% was light colored
• In the year 1995, 19% was dark colored while 81% was light colored
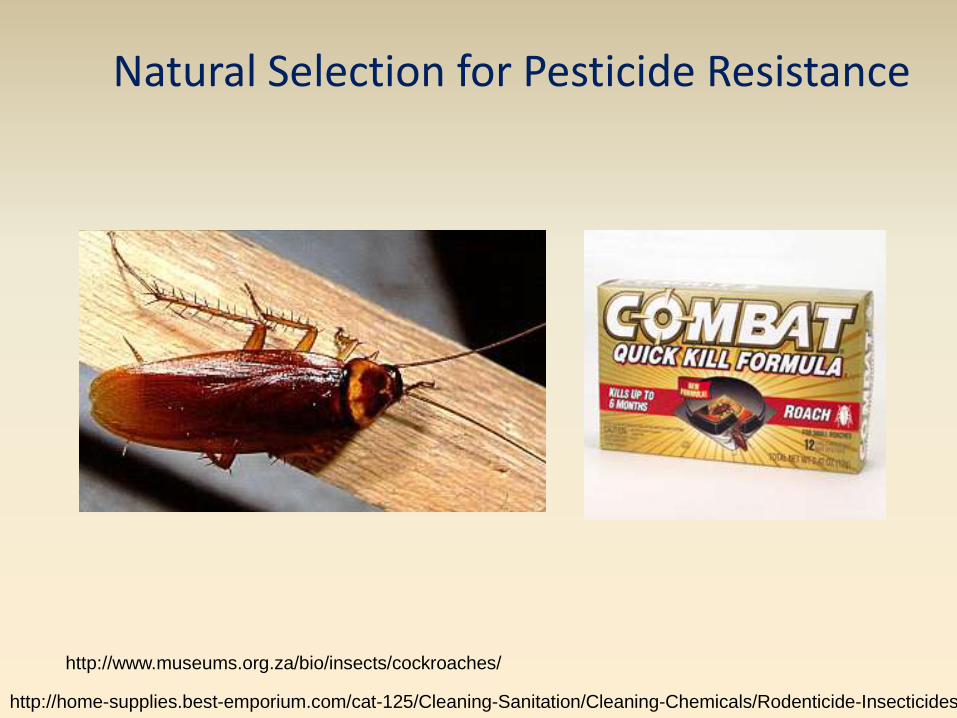
Natural Selection for Pesticide Resistance
http://www.museums.org.za/bio/insects/cockroaches/
http://home-supplies.best-emporium.com/cat-125/Cleaning-Sanitation/Cleaning-Chemicals/Rodenticide-Insecticides/

We can look at the evolution of resistance to insecticides as an example of natural selection
DDT is very effective in its first use. Over time, however,
DDT-resistant mosquitoes begin to appear
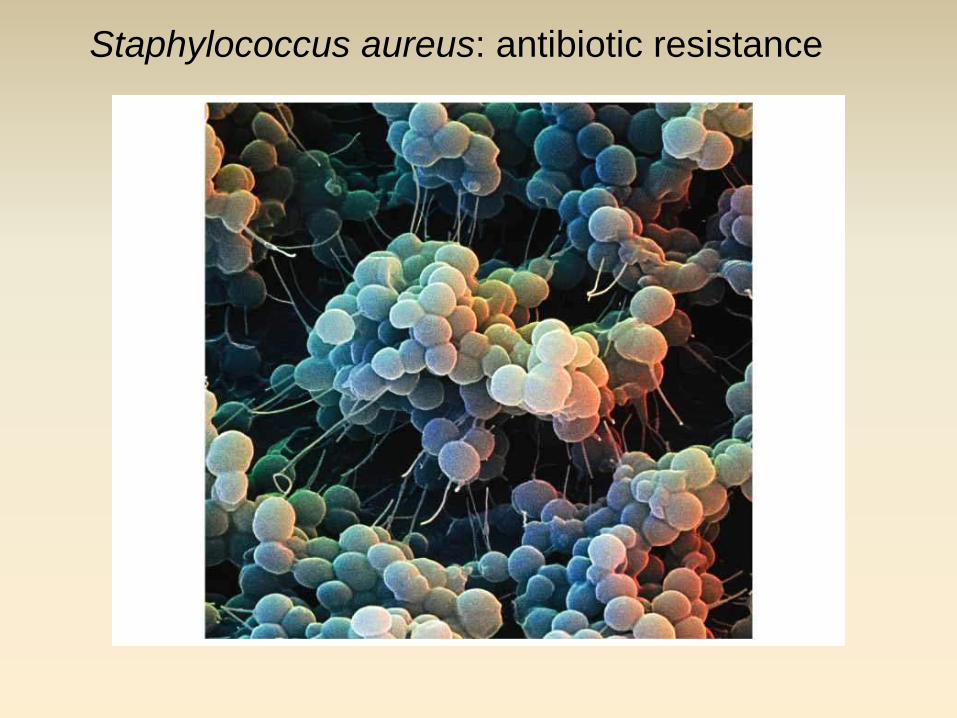
Staphylococcus aureus: antibiotic resistance

Disruptive Selection Disruptive selection creates bimodal distributions by
favoring two or more extreme phenotypes over the average phenotype in a population.
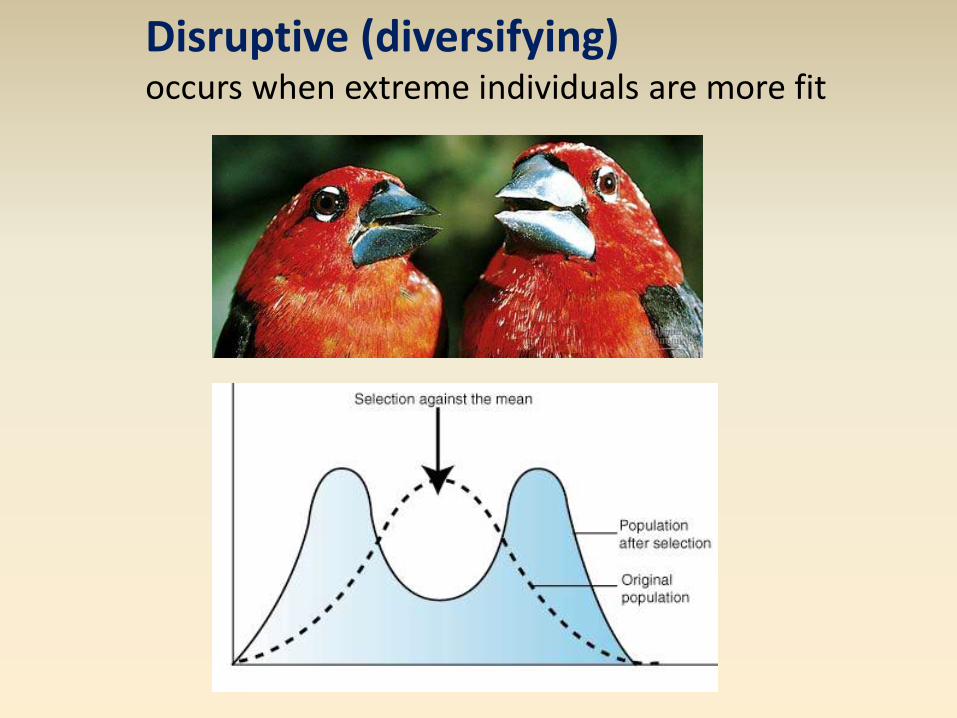
Disruptive (diversifying) occurs when extreme individuals are more fit

These African finches depend on the seeds of two different types of sedge, one that produces a soft seed and the other a much harder seed.
Finches with small bills are efficient
at feeding on soft seeds. Birds with larger bills are able to
crack the hard seeds. A study of 2700 finches produced
the findings which appears to be observable evidence for disruptive selection.

rock pocket mouse one phenotype is favored on the lava flows and the other is favored on the sandstone rocks

End