QUANTITATIVE THERMAL ANALYSIS OF CLAY...
13
QUANTITATIVE THERMAL ANALYSIS OF CLAY MINERALS By the late E. B. ALLISON Atomic Energy Research Establishment, Harwell [Read 5th November, 1954] ABSTRACT Vold's mathematical analysis of the d.t.a, curve has been applied to Murray's data on the dehydration of clays. Owing to experimental uncertainties, values for the heats of dehydration are lower than those determined by other methods. The first ruder law is obeyed and the activation energies of dehydration are of the same order as those derived from isothermal data; rates of dehydration are, however, higher. Furthermore, Smith's constant heat flow method has been used to deter- mine specific heats and heats of dehydration of clays, and the effect of sample porosity upon the results has been determined. The thermal data has also been used to estimate the amount of clay mineral present. The kinetics of the dehydration process, evaluated from the apparent specific heat-temperature curves, follow a first order reaction curve. The activation energies obtained are, however, higher than those de- rived from other data. INTRODUCTION Attempts have been made to determine the heats of dehydration of clays by two methods, namely, (1) by applying Vold's analysis (1949) to normal differential thermal analysis curves, and (2) by employing the constant heat flow method developed by Smith (1940). Since powdered clay samples were used throughout this work giving rise to thermal gradients within the specimen, part of the work has been concerned with a study of the effect of these gradients upon the thermal data obtained. In addition, an attempt has been made to derive the kinetics of the dehydration process from the thermal data for comparison with isothermal data. APPLICATION OF VOLD'S ANALYSISTO THE DEHYDRATIONOF CLAYS The shape of a differential thermal curve depends upon several factors, namely, the kinetics of the reaction, the magnitude of the heat effect within the sample and the thermal diffusivity of the materials and containers. Furthermore, even when the reaction is complete, there is a finite differential temperature. Thus there are two problems to be solved :-- (a) At what point on the d.t.a, curve does the reaction cease? (b) To what extent is tbe curve influenced by thermal diffusivity? Vold has shown that these problems can be solved by applying the analysis outlined below. The rate of flow of heat into the sample and reference materials can be expressed by the equations :-- dqs/dt=Ks(Tw - Ts) + ~(Tr - Ts) + ~zs(To - Ts) (1) and dqr/dt=Kr(Tw -Tr) + a(Ts -Tr) + err(To - T r ) (2) 242
Transcript of QUANTITATIVE THERMAL ANALYSIS OF CLAY...

QUANTITATIVE THERMAL ANALYSIS OF CLAY MINERALS
By the late E. B. ALLISON
Atomic Energy Research Establishment, Harwell
[Read 5th November, 1954]
ABSTRACT Vold's mathematical analysis of the d.t.a, curve has been applied to
Murray's data on the dehydration of clays. Owing to experimental uncertainties, values for the heats of dehydration are lower than those determined by other methods. The first ruder law is obeyed and the activation energies of dehydration are of the same order as those derived from isothermal data; rates of dehydration are, however, higher. Furthermore, Smith's constant heat flow method has been used to deter- mine specific heats and heats of dehydration of clays, and the effect of sample porosity upon the results has been determined. The thermal data has also been used to estimate the amount of clay mineral present. The kinetics of the dehydration process, evaluated from the apparent specific heat-temperature curves, follow a first order reaction curve. The activation energies obtained are, however, higher than those de- rived from other data.
INTRODUCTION Attempts have been made to determine the heats of dehydration of
clays by two methods, namely, (1) by applying Vold's analysis (1949) to normal differential thermal analysis curves, and (2) by employing the constant heat flow method developed by Smith (1940). Since powdered clay samples were used throughout this work giving rise to thermal gradients within the specimen, part of the work has been concerned with a study of the effect of these gradients upon the thermal data obtained. In addition, an attempt has been made to derive the kinetics of the dehydration process from the thermal data for comparison with isothermal data.
APPLICATION OF VOLD'S ANALYSIS TO THE DEHYDRATION OF CLAYS The shape of a differential thermal curve depends upon several
factors, namely, the kinetics of the reaction, the magnitude of the heat effect within the sample and the thermal diffusivity of the materials and containers. Furthermore, even when the reaction is complete, there is a finite differential temperature. Thus there are two problems to be solved : - -
(a) At what point on the d.t.a, curve does the reaction cease? (b) To what extent is tbe curve influenced by thermal diffusivity?
Vold has shown that these problems can be solved by applying the analysis outlined below.
The rate of flow of heat into the sample and reference materials can be expressed by the equations : - -
dqs/dt=Ks(Tw - Ts) + ~(Tr - Ts) + ~zs(To - Ts) (1) and dqr/dt=Kr(Tw -Tr ) + a(Ts - T r ) + err(To - T r ) (2)
242

QUANTITATIVE THERMAL ANALYSIS 243
where dqs/dt--rate at which heat is received by the sample, dqr/dt=rate at which heat is received by the reference.
Kr and Ks ----the heat transfer coefficients between the furnace wall and the materials. (These are made as nearly identical as possible by choice of reference material and cell design).
~--the heat transfer coefficient between the cells, ar and as=the heat losses (chiefly along the thermocouple wires),
T w - ~ 'furnace wall, Yr = I I reference, Ts----- temperature of sample, To= external environment.
The linear relation between rate of heat transfer and temperature difference as given in equations (1) and (2) is applicable when the materials are contained in a solid block.
The rate of heat flow into the sample and reference materials can also be represented by the equations :--
dqs/dt= Cs.dTs/dt + A H.df/dt (3) dqr/dt=Cr.dTr/dt (4)
where Cs=the heat capacity of the sample crucible + contents, Cr=the heat capacity of the reference crucible + contents,
AH=the heat of reaction, and df/dt=the rate of fractional transformation of the sample.
In addition, if the two materials are located symmetrically within the furnace, we can write:--
K s = K r - gK (5) and as = ar - ~a (6)
where 3K and 3a are very small. Combining equations (1) to (6) gives a general equation of the
form :-- d(Tr - Ts) AH.df [ Cr] dTr
_ _ ( K r + a r + 2a) (Tr - Ts) + ~ + 1 - Css dt dt Cs
+ -~s [ 3K(Tw - Ts) - 3a(Ts - To) ] (7)
putting y : T r - Ts, A = ( K r + ar + 2~)/Cs and
ys= [(Cs - Cr)dTr/dt + ~K(Tw - Ts) - 3a(Ts - To)] / (Kr + ar + 2a),
we have:-- AH df dy + A(y -Ys) (8) Cs dt dt
Before the heat of reaction can be evaluated from the d.t.a, curves, it is necessary to determine the "end point" as follows. From equation (8), when the reaction is complete, df/dt is zero and the equation can be integrated provided the following conditions are fulfilled :--

244 E.B. ALLISON
(a) dTr/dt is constant. The experimental conditions are adjusted so that this requirement is satisfied.
(b) (Tw-Ts) is constant. In practice, (Tw- Ts) probably varies very slowly.
(c) ( T s - To) is constant. Actually ( T s - To) varies, but since it is multiplied by a very small factor (~a) it can be assumed to remain sensibly constant.
Integration of equation (8) between the limits y=y and Y~Yl, t z t and t=t 1 gives the following relationship between y and t : - -
y : y s [ 1 - e - A ( t - t l ) ] +yre -A( t - t~) (9)
This equation shows that as the time (t) approaches infinity, the value of y approaches a limit Ys. A plot of loge (y - Ys) against time (t) is a straight line of slope 'A' beyond the point at which the reaction is complete. Thus the end point of the reaction is obtained by plotting the logarithm of the differential temperature against time, the plot usually being started at the appex of the thermal peak. The point at which there is a deviation from a linear relationship is the end point of the reaction. In addition, the slope (A) of the line, i.e., the rate at which the differential temperature returns to the base line, is a measure of the mean thermal diffusivity of the system.
The value of AH/Cs can be obtained by integration of equation (8) between the appropriate limits. The simplest method is to integrate graphically, the integral of the second term on the right hand side of the equation ~ being the area under the peak. AH may then be evaluated providing that the value Cs is known. Again, once AH/Cs has been determined, the variation of df/dt with temperature can be calculated (equation 8).
Differential thermal analysis curves for a number of clays were determined by Murray (1948) and these curves have been analysed by Vold's method.
Heats of Dehydration. The points at which the dehydration is complete have been obtained from the curves as described above. In the present work, as can be seen in Fig. 1, log10 (y -Ys) has been plotted against temperature (T) instead of time (t); this is justified since the experimental conditions are such that dT/dt is constant. Reasonably straight lines are obtained; the slopes of these lines together with the end point temperatures (points x in Fig. 1) are tabulated below in Table 1.
TABLE l--End Point Temperatures and "A" Values for Several Clays
Clay
Supreme kaolin K. Plastic kaolin Newton Abbot ball clay Wyoming bentonite
Temperature (~ at which dehydration is complete
610 590 570 700
Slope (A)
0'306 0-105 0-133 0.287
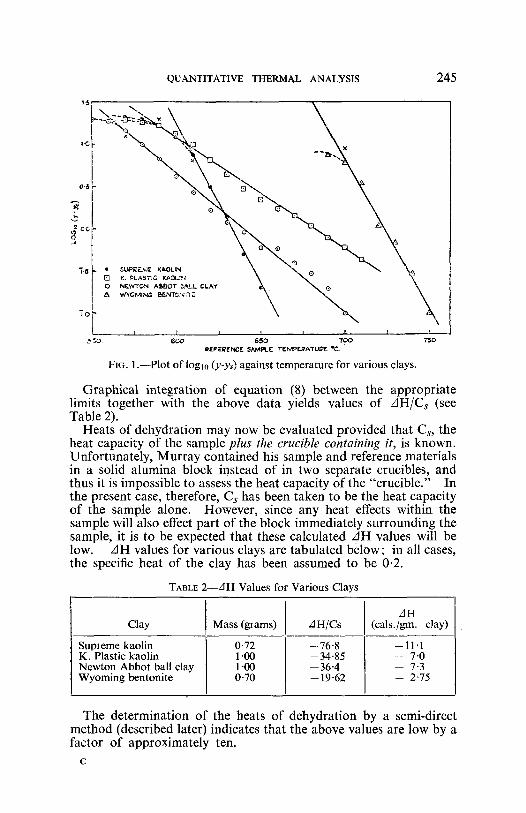
QUANTITATIVE THERMAL ANALYSIS 245
1 . I I I = t I -~ 5tO. 6 C O 6 5 0 " /CO 7 5 0
w t t F E I ~ N C E SA~tlILP" T I r M g E J ~ A T U ~ E or=.
FIG. 1 .--Plot of log10 (y-ys) against temperature for various clays.
Graphical integration of equation (8) between the appropriate limits together with the above data yields values of AH/Cs (see Table 2).
Heats of dehydration may now be evaluated provided that Cs, the heat capacity of the sample plus the crucible containing it, is known. Unfortunately, Murray contained his sample and reference materials in a solid alumina block instead of in two separate crucibles, and thus it is impossible to assess the heat capacity of the "crucible." In the present case, therefore, Cs has been taken to be the heat capacity of the sample alone. However, since any heat effects within the sample will also effect part of the block immediately surrounding the sample, it is to be expected that these calculated zJH values will be low. AH values for various clays are tabulated bdow; in all cases, the specific heat of the clay has been assumed to be 0-2.
TABLE 2--AH Values for Various Clays
Clay
Sup] eme kaolin K. Plastic kaolin Newton Abbot ball clay Wyoming bentonite
Mass (grams)
0"72 1-00 1"00 0-70
AH/Cs
--76'8 --34"85 --36"4 - - 1 9 " 6 2
AH (cals./gm. clay)
-11.1 - 7.0 - 7.3 - 2.75
The determination of the heats of dehydration by a semi-direct method (described later) indicates that the above values are low by a factor of approximately ten.

246 E.B. ALLISON
Kinetics of Dehydration. The rates of dehydration can be readily calculated at various temperatures from equation (8). However, before the kinetic constants for the process can be calculated, the relation between the rate of transformation and the amount of material transformed has to be known.
It was assumed that dehydration obeys a simple chemical rate equation of the form : - - df/dt=k(l _f)n (10) where df/dt=the rate of fractional transformation,
./"=the amount transformed, k = a temperature dependent velocity constant,
and n = a positive whole number.
o
15
o-5
00 Q O
T5
T-O
IS
~O
1.18 1 2 0 1.2Z 1-24 1,2G 1.28 1 3 0 I-~h~. I ~ 4 1 3 6 ~3B
IO ~/T,o K FIG. 2 . - -A r rhen ins plots f o r K . Plastic kao l i n assuming 1st and 2nd o rder
reactions.
Two sets of velocity constants thus obtained for the dehydration of K. Plastic kaolin, the values of n being assumed to be 1 and 2 re- spectively, are plotted against the reciprocal of the absolute temper- ature in Fig. 2 which shows tha ta linear relationship is obtained when the value of n equals 1. This indicates that the dehydration follows a first order law; Murray's isothermal data (1949) is in agreement with this finding.
Arrhenius plots for other clays are plotted in Fig. 3, it being as- sumed that dehydration follows a first order law. Murray's iso- thermal data are included for comparison. The velocity constants derived from the d.t.a, curves are appreciably higher than those

QUANTITATIVE THERMAL ANALYSIS 247
determined isothermally, while the activation energies, tabulated below, are of the same order.
TABLE 3--Comparison of Activation Energies
E (cals./mole) E (cals./mole) Clay From d.t.a. Curves Isothermal Data
Supreme kaolin 55,000 44,830 K. Plastic kaolin 57,700 36,690 Newton Abbot bali clay 42,800 40,660 Wyoming bentonite 54,000 57,640
o - o ~ SUPS[ME KAOLIN NEWTON ABBOT WYOMING ~NTCN,'TE
+ \ \
To
\ + I I I I
FIG. 3.--Arrehnius plots for various clays (Vold's analysis).
The Arrhenius equation : - - k = A e - E/RT
implies that the velocity constant (k) is zero at 0~ In practice, however, transformation occurs at a definite temperature (the tran- sition point). Consequently, a plot of log k against l /T deviates from the linear relationship as the transition point is approached. This effect is illustrated by the curve for Wyoming bentonite (Fig. 3).
DETERMINATION OF THERMAL DATA BY SMITH'S METHOD The basis of the method is the measurement of the rate of rise in temperature of
a sample under standardised heating conditions. From a comparison of the tem- perature-time curve with that for a reference material of known specific heat, the specific heat of the sample under test can be derived. The simplest method of obtaining reproducible heat flow conditions is to place the specimen in a thick- walled refractory container across the walls of which a constant e.m.f, is main: tained. The factors governing the rate of heat flow through the container, namely the conductivity, size and shape of the container and the temperature
248 E . B . ALLISON
difference across the container walls, are therefore constant. Thus the heat flow will be constant at any given temperature. Smith's method possesses ~veral advantages : - -
(a) Quantitative thermal data are obtained from the curves. (b) SmaU heat effects can be detected at a temperature only a few degrees
different from that at which a major effect has occurred. (c) Even if quantitative measurements are not required, the method is pre-
ferable to conventional differential thermal analysis. With the former method, the furnace temperature is held constant when there is a thermal arrest; thus thermal gradients are reduced with the result that sharper thermal arrests are obtained.
The sensitivity of the apparatus can be increased by replacing tbe refractory container by two concentric cylinders, inside of which is placed a very thin- walled crucible; this arrangement has a lower heat capacity.
In practice, the heat flow also heats an indeterminate part of the container, and hence a blank run must be carried out. Heat capaci- ties can thus be determined by the use of the following heat flow equations : -
Blank (i.e., empty crucible): dq/dt ~Cc.dTc/dt (1 la) Standard (sample of known
specific heat): dq/dt=(Cc ~ CA) dTA/dt (1 lb) Sample: dq/dt=(Cc-~ Cs) dTs/dt (1 lc)
where dq/dt--rate of heat flow, C : h e a t capacity,
and dT/dt=rate of rise of temperature.
The subscripts c, A and s refer to the crucible, standard and sample respectively. Elimination of the heat capacity of the crucible from these equations gives the following relations : - -
dq _ CA (12a) dt dt/dTA - dt/dTc
and dq__ Cs (12b) dt dt/dTs - dt/dTc
The heat capacity of a sample can be obtained by the use of equation (12b), the value of dq/dt, of course, being obtained by calibration of the apparatus against a material of known specific heat [.equation (12a)].
If a transformation occurs over a range of temperature, the latent heat will appear as apparent specific heat. The area of the peak in the apparent specific heat-temperature curve then gives the heat of transformation in calories/gram. The apparatus was calibrated against calcined alumina, the specific heats of which were calculated from the e q u a t i o n : -
C=24.6 + 6 • 10-3.T - 7 • 105.T -2 where C ~ m o l a r specific heat and T - t empe ra tu r e in degrees absolute.
Effect of Thermal Gradients on the Apparent Specific Heat Values. Thermal gradients within the powder samples will affect the heat flow conditions and consequently the apparent specific heat values. The magnitude of this effect was investigated by determining the specific

QUANTITATIVE THERMAL ANALYSIS 249
heat-temperature curves for samples of zinc oxide of widely varying porosity. The sample densities are tabulated b e l o w : ~
TAaLE 4--Packing Densities of Zinc Oxide Samples
Sample No. Wt. of ZnO(gm.)
5"463 7.500
13"872 15-237
Relative density of ZnO
0"975/V 1 "339/V 2"475/V 2.722/V
Relative density of ZnO
Relative density of A1203
0"401 0'550 1-018 1.120
t
("
-A
FIG. 6.--Apparent specific heat-- temperature curves for various
FIG. 4.--Inverse heating rate curves clays (Montmorillonitic minerals). for clays.
Typical inverse heating rate curves obtained for zinc oxide and the variation of specific heat with temperature, show that the apparent specific heat values are markedly dependent upon the packing density of the sample, the values being closer to the true value as the ratio relative density of sample approaches unity. Hence in all subsequent relative density of standard experiments the sample has been packed to the same relative density as that of the standard material (alumina). The experiments with zinc oxide also illustrated one of the limitations of the powder methods. Sintering of the powder occurs at high temperatures so that the material shrinks away from the sides of the crucible. The heat

250 E.B. ALLISON
flow conditions are thus altered and the apparent specific heat values increase rapidly.
Dehydration of Clay Minerals. Apparent specific heat-temper- ature curves were determined for several kaolinites and montmoril- lonites, the clays being packed to the same relative density as that of the alumina used for calibration. Typical inverse heating rate curves for clays (not from the same batches used by Murray) are shown in Fig. 4. Well-defined endothermic peaks occur in the region of l l0~ at which temperature the hygroscopic moisture is given off, while a further peak (or peaks) occurs in the range 500 ~ to 700~ when the lattice water is removed. The specific heat-temperature curves derived from equation (12b) are plotted in Figs. 5 to 7, and
c~ x~OO o I �9 3 5 6 7 8,
8 i I i t I I
S~:~ H'[ 4
4
SP HT.
K. PL45TICKAOLIN
CHINA CLAY
H A L L O ~ I T [ ~'DJF.81FL Dlrl~lkR~)
I
P ' A : - - I " " " 0 I - - - ' - - ' ~ 1 ~ I J ~' 3 4. _4 6 7 8
"c. x I 0 0
Flo. 5.--Apparent specific heat-temperature curves for various clays (kaolin group).
QUANTITATIVE THERMAL ANALYSIS 251
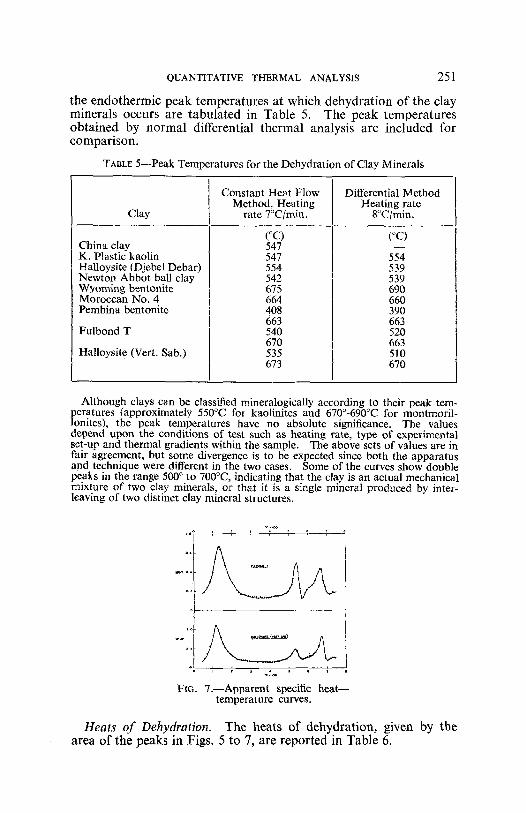
the endothermic peak temperatures at which dehydration of the clay minerals occurs are tabulated in Table 5. The peak temperatures obtained by normal differential thermal analysis are included for comparison.
TABLE 5--Peak Temperatures for the Dehydration of Clay Minerals
Clay
China clay K. Plastic kaolin Halloysite (Djebel Debar) Newton Abbot ball clay Wyoming bentonite Moroccan No. 4 Pembina bentonite
Fulbond T
Halloysite (Vert. Sab.)
Constant Heat Flow Method, Heating
rate 7~
(~ 547 547 554 542 675 664 4O8 663 540 670 535 673
Differential Method Heating rate
8~
(o~
554 539 539 690 660 390 663 520 663 510 670
Although clays can be classified mineralogically according to their peak tem- peratures (approximately 550~ fol kaolinites and 670~176 for montmoril- !onites), the peak temperatures have no absolute significance. The values depend upon the conditions of test such as heating rate, type of experimental set-up and thermal gradients within the sample. The above sets of values are in fair agreement, but some divergence is to be expected since both the apparatus and technique were different in the two cases. Some of the curves show double peaks in the range 500 ~ to 700~ indicating that the clay is an actual mechanical mixture of two clay minerals, or that it is a single mineral produced by inter- leaving of two distinct clay mineral structures.
~ 4
D I
F~G. 7.--Apparent specific heat-- temperature curves.
Heats of Dehydration. T h e hea t s o f dehyd ra t i on , g iven by t h e a rea o f t he peaks in Figs . 5 to 7, a re r e p o r t e d in T a b l e 6.

252 E. B. ALLISON
TABLE 6 - - H e a t s o f D e h y d r a t i o n fo r V a r i o u s Clays
C lay A H (ca lor ies /g in . c lay)
C h i n a c lay . . . . . . . . . . . . K . P las t ic kao l in .... .... N e w t o n A b b o t ball c lay .... Ha l loys i t e (Djebe l D e b a r ) .... W y o m i n g ben ton i t e . . . . . . . . P e m b i n a be n ton i t e . . . . . . . . M o r o c c a n N o . 4 . . . . . . . .
- 1 1 5 - lO.a, -- 71 - 91
- 29 -- 23
Values of AH in calories/gm, water were also calculated; these ranged' from 600-900, and 700-1,100 calories/gin, water for the montmorillonites and kaolinites respectively. The highest value obtained for the heat Of dehydration was 115 calories/gm, clay. This was obtained for China clay, one of the purest of the kaolin minerals. Taking this figure as a standard (i.e., as being equivalent to 100~ clay mineral), the amount of clay mineral present in K. Plastic kaolin and Newton Abbot ball clay has been calculated. The values obtained, 90% and 62% for K. Plastic kaolin and Newton Abbot ball clay respectively, are in reasonable agreement with rational analysis figures (85~ and 69%).
Kinetics of Dehydration. The heat absorbed, i.e., the area under the apparent specific heat-temperature curve, is proportional to the amount of dehydration which has occurred. Thus the course of the transformation can be followed by determining the area under the peak (Figs. 5 to 7) at regular temperature intervals.
0 C~T~NT Mt~T FLOW ~
+ IbOT~I~eMAL Mt~r~T~ (~JmeeAv)
O, i l A,O~INI T f-- M ~ TIV~I~. ONTIC.
0 ~IO ,~I0 550 STo 5~0 ~IO e3o ~ e?o ~9o
T~PteAvO~t "c
FiG. 8.--Comparison of reaction velocity--temperature curves for kaolinite and montmorillonite.
Velocity constants and activation energies were derived as de- scribed in a previous section, i.e., it was assumed that dehydration obeys a simple chemical rate equation (equation 10). The velocity constants obtained for K. Plastic kaolin were plotted and it was again seen that dehydration followed a first order law. From Arrhenius plots for the various clays the energies of activation for kaolinites were as follows in cals./mole. K. Plastic kaolin, 79,200; China

QUANTITATIVE THERMAL ANALYSIS 253
clay, 80,500; Newton Abbot ball clay, 95,600. The Arrhenius plots for the montmorillonites, however, were curved, indicating that the dehydration process may be more complex than that of a first order reaction. The shape and position of the Arrhenius plot, .particularly at the low temperature end of the transformation range, is, however, dependent upon the transition point chosen. Thus, in some cases, curvature of the Arrhenius plot may be due to incorrect choice of the transition point.
A comparison of the velocity constants derived from thermal data and from Murray's isothermal loss-in-weight data (Fig. 8) shows that the main point of difference is that the thermal method gives higher activation energies.
CONCLUSIONS Heats of dehydration of clays, obtained by application of Vold's
analysis to d.t.a, curves, are lower than those determined by other methods. This is due to uncertainties introduced experimentally. Kinetic data evaluated from the d.t.a, curves show that a first order law is obeyed and the activation energies of dehydration (40-60,000 cals./mole) are in fair agreement with isothermal data.
Specific heats and heats of dehydration of clays have also been measured directly using the constant heat flow method of Smith. Experiments with powdered zinc oxide showed that the apparent specific heat values are markedly dependent upon the porosity of the sample, the most accurate values being obtained when the porosity of the sample is the same as that of the reference material used for calibration of the apparatus. The heats of dehydration thus measured range from 70 to 115 cals./gm, clay (or 700-1,100 cals./gm. water) for the kaolins, while the values for montmorillonites are in the range 20 to 50 cals./gm, clay (or 600-900 cals./gm, water).
Estimation of the amount of clay mineral present in two of the kaolins examined, it being assumed that 100% clay mineral cor- responds to a AH of 115 cals./gm, clay, gave reasonable agreement with rational analysis figures.
Calculation of kinetic data from the specific heat-temperature curves shows that dehydration follows a first order law. The velocity constants thus determined are in reasonable agreement with iso- thermal data, the main point of difference being that the former method gives higher activation energies.
REFERENCES Murray, P. 1948 UnpuNished Data. Murray, P. and White, J. 1949 Trans. Brit. Ceram. Soc., 48, 187. Smith, C. S, 1940 A.LM.E., 137, 236. Vold, M. J. 1949 Anal. Chem., 21, 683.
DISCUSSION Mr G. Brown asked if the shelf-like indentations towards the end of
the endothermic peaks for K. Plastic kaolin and Newton Abbot ball clay were due to traces of montmorillonite or chlorite.

254 E. B. ALLISON
Dr Allison said that he had not carried out an X-ray examination of the samples. The samples had been obtained from Dr White, so perhaps he could supply further information.
Dr J. White replied that those particular samples had not been examined.
Dr R. C. Mackenzie then asked if there were any indentations towards the end of the endothermic peaks in the apparently pure kaolinites.
Dr P. Murray replied that there were, and thought that they were possibly due to the fact that the loss of water led to collapse of the lattice, with the result that the final traces of water were difficult to remove.
Mr Brown thought such indentations would be due to montmoril- lonite held by the charges, on faces and on edges, and that neutralisa- tion with deflocculation had given a mixture.
Dr Mackenzie did not agree with this hypothesis. Mr G. Henderson said that it was of interest to note that K. Plastic
kaolin and Wyoming bentonite had rather similar foundry properties, and this was the only kaolin with such a similarity.
Dr White added to this by stating that the dry strength of clays increased with even small bentonite additions.
Mr R. F. YOuell stated that very pure nacrite also showed such an indentation.
Mr L Havemaar added that the d.t.a, curves for kaolins investi- gated in the A.P.I. projects did not show any shelf-like indentations.
Dr G. Nagelschmidt warned against the danger of rational analysis giving the wrong answer.