Quantitative mechanical analysis of thin compressible ...
10
Quantitative mechanical analysis of thin compressible polymer monolayers on oxide surfaces† Qian Huang, a Ilsun Yoon, a Josh Villanueva, a Kanguk Kim b and Donald J. Sirbuly * ab A clear understanding of the mechanical behavior of nanometer thick films on nanostructures, as well as developing versatile approaches to characterize their mechanical properties, are of great importance and may serve as the foundation for understanding and controlling molecular interactions at the interface of nanostructures. Here we report on the synthesis of thin, compressible polyethylene glycol (PEG) monolayers with a wet thickness of <20 nm on tin dioxide (SnO 2 ) nanofibers through silane-based chemistries. Nanomechanical properties of such thin PEG films were extensively investigated using atomic force microscopy (AFM). In addition, tip–sample interactions were carefully studied, with different AFM tip modifications (i.e., hydrophilic and hydrophobic) and in different ionic solutions. We find that the steric forces dominate the tip–sample interactions when the polymer film is immersed in solution with salt concentrations similar to biological media (e.g.,1 phosphate buffer solution), while van der Waals and electrostatic forces have minimal contributions. A Dimitriadis thin film polymer compression model shows that the linear elastic regime is reproducible in the initial 50% indentation of these films which have tunable Young's moduli ranging from 5 MPa for the low molecular weight films to 700 kPa for the high molecular weight PEG films. Results are compared with the same PEG films deposited on silicon substrates which helped quantify the structural properties and understand the relationship between the structural and the mechanical properties of PEG films on the SnO 2 fibers. Introduction Oxide nanomaterials such as silicon oxide, iron oxide and tita- nium oxide offer a broad range of physical and chemical prop- erties that make them excellent candidates for novel biotechnological applications in medical diagnostics and ther- apeutics. 1–3 For example, colloidal suspensions of oxide nano- particles are currently being investigated for enhanced in vivo imaging contrast agents, drug vehicular systems and mamma- lian toxicity study targets. 4,5 However, without a chemically robust and benign outer coating, these oxide materials can oen interfere with biological functions, or their efficacy in vivo can be reduced due to promoted particle aggregation and/or reduced retention/circulation time. To overcome the difficulty of the high reactive surface of oxide nanomaterials and their sensitivity to adsorbates, the oxide surfaces are typically modied to reduce the surface energy and allow for more chemical neutrality in biological environments. Due to the low surface charge density, tunable surface coverage, long-term stability, and non-toxicity properties of polymers such as polyethylene glycol (PEG), these materials have been extensively used as passivating lms on nanomaterials for biological applications. 6–8 Besides the chemical properties of PEG lms there is also of signicant interests in tuning their mechanical properties, particularly in the case of extremely thin (<20 nm) polymer lms. It is not only important to control the thickness and mechanical properties of thin polymer lms for understanding molecular interactions with target materials in vitro and in vivo, but compressible lms can also be used for mechanical feed- back in novel nanoscale sensor designs for biological applica- tions. 9,10 There are several methods to study the mechanical properties of ultrathin polymer lms in the dry state; 11–14 however, there are currently few reports on the stiffness of thin, uniform polymer monolayers deposited on oxide nanoparticles and/or oxide nanober structures in the liquid state, which is likely rooted in the challenges associated with synthesizing conformal, uniform monolayer lms and the difficulties in accurately quantifying the mechanical properties at the nano- meter scale at the same time. 15–18 Many theories have been proposed to explain the interaction forces involved in nano- meter thickness polymer deformations. 19–24 For example, Spencer et al. reported on the absorption of a copolymer a Department of NanoEngineering, University of California, La Jolla, San Diego, CA 92093, USA. E-mail: [email protected] b Materials Science and Engineering, University of California, La Jolla, San Diego, CA 92093, USA † Electronic supplementary information (ESI) available: Tip radius determination and image reconstruction, thickness of oxide layer, and Young's moduli dependence on contact point assignment. See DOI: 10.1039/c4sm01530d Cite this: Soft Matter, 2014, 10, 8001 Received 12th July 2014 Accepted 13th August 2014 DOI: 10.1039/c4sm01530d www.rsc.org/softmatter This journal is © The Royal Society of Chemistry 2014 Soft Matter, 2014, 10, 8001–8010 | 8001 Soft Matter PAPER Open Access Article. Published on 13 August 2014. Downloaded on 12/25/2021 5:53:08 AM. This article is licensed under a Creative Commons Attribution 3.0 Unported Licence. View Article Online View Journal | View Issue
Transcript of Quantitative mechanical analysis of thin compressible ...

Soft Matter
PAPER
Ope
n A
cces
s A
rtic
le. P
ublis
hed
on 1
3 A
ugus
t 201
4. D
ownl
oade
d on
12/
25/2
021
5:53
:08
AM
. T
his
artic
le is
lice
nsed
und
er a
Cre
ativ
e C
omm
ons
Attr
ibut
ion
3.0
Unp
orte
d L
icen
ce.
View Article OnlineView Journal | View Issue
Quantitative mec
aDepartment of NanoEngineering, Universit
92093, USA. E-mail: [email protected] Science and Engineering, Univers
92093, USA
† Electronic supplementary information (Eand image reconstruction, thickness odependence on contact point assignment
Cite this: Soft Matter, 2014, 10, 8001
Received 12th July 2014Accepted 13th August 2014
DOI: 10.1039/c4sm01530d
www.rsc.org/softmatter
This journal is © The Royal Society of C
hanical analysis of thincompressible polymer monolayers on oxidesurfaces†
Qian Huang,a Ilsun Yoon,a Josh Villanueva,a Kanguk Kimb and Donald J. Sirbuly*ab
A clear understanding of the mechanical behavior of nanometer thick films on nanostructures, as well as
developing versatile approaches to characterize their mechanical properties, are of great importance and
may serve as the foundation for understanding and controlling molecular interactions at the interface of
nanostructures. Here we report on the synthesis of thin, compressible polyethylene glycol (PEG)
monolayers with a wet thickness of <20 nm on tin dioxide (SnO2) nanofibers through silane-based
chemistries. Nanomechanical properties of such thin PEG films were extensively investigated using
atomic force microscopy (AFM). In addition, tip–sample interactions were carefully studied, with different
AFM tip modifications (i.e., hydrophilic and hydrophobic) and in different ionic solutions. We find that the
steric forces dominate the tip–sample interactions when the polymer film is immersed in solution with
salt concentrations similar to biological media (e.g., 1� phosphate buffer solution), while van der Waals
and electrostatic forces have minimal contributions. A Dimitriadis thin film polymer compression model
shows that the linear elastic regime is reproducible in the initial 50% indentation of these films which
have tunable Young's moduli ranging from 5 MPa for the low molecular weight films to 700 kPa for the
high molecular weight PEG films. Results are compared with the same PEG films deposited on silicon
substrates which helped quantify the structural properties and understand the relationship between the
structural and the mechanical properties of PEG films on the SnO2 fibers.
Introduction
Oxide nanomaterials such as silicon oxide, iron oxide and tita-nium oxide offer a broad range of physical and chemical prop-erties that make them excellent candidates for novelbiotechnological applications in medical diagnostics and ther-apeutics.1–3 For example, colloidal suspensions of oxide nano-particles are currently being investigated for enhanced in vivoimaging contrast agents, drug vehicular systems and mamma-lian toxicity study targets.4,5 However, without a chemicallyrobust and benign outer coating, these oxide materials can oeninterfere with biological functions, or their efficacy in vivo can bereduced due to promoted particle aggregation and/or reducedretention/circulation time. To overcome the difficulty of the highreactive surface of oxide nanomaterials and their sensitivity toadsorbates, the oxide surfaces are typically modied to reducethe surface energy and allow for more chemical neutrality in
y of California, La Jolla, San Diego, CA
ity of California, La Jolla, San Diego, CA
SI) available: Tip radius determinationf oxide layer, and Young's moduli. See DOI: 10.1039/c4sm01530d
hemistry 2014
biological environments. Due to the low surface charge density,tunable surface coverage, long-term stability, and non-toxicityproperties of polymers such as polyethylene glycol (PEG), thesematerials have been extensively used as passivating lms onnanomaterials for biological applications.6–8
Besides the chemical properties of PEG lms there is also ofsignicant interests in tuning their mechanical properties,particularly in the case of extremely thin (<20 nm) polymerlms. It is not only important to control the thickness andmechanical properties of thin polymer lms for understandingmolecular interactions with target materials in vitro and in vivo,but compressible lms can also be used for mechanical feed-back in novel nanoscale sensor designs for biological applica-tions.9,10 There are several methods to study the mechanicalproperties of ultrathin polymer lms in the dry state;11–14
however, there are currently few reports on the stiffness of thin,uniform polymer monolayers deposited on oxide nanoparticlesand/or oxide nanober structures in the liquid state, which islikely rooted in the challenges associated with synthesizingconformal, uniform monolayer lms and the difficulties inaccurately quantifying the mechanical properties at the nano-meter scale at the same time.15–18 Many theories have beenproposed to explain the interaction forces involved in nano-meter thickness polymer deformations.19–24 For example,Spencer et al. reported on the absorption of a copolymer
Soft Matter, 2014, 10, 8001–8010 | 8001

Soft Matter Paper
Ope
n A
cces
s A
rtic
le. P
ublis
hed
on 1
3 A
ugus
t 201
4. D
ownl
oade
d on
12/
25/2
021
5:53
:08
AM
. T
his
artic
le is
lice
nsed
und
er a
Cre
ativ
e C
omm
ons
Attr
ibut
ion
3.0
Unp
orte
d L
icen
ce.
View Article Online
consisting of PEG chains graed on the poly(L-lysine) backboneon niobium oxide substrates, and studied the mechanicalproperties of different PEG graing densities via colloid-probeatomic force microscopy (AFM) under varying ionicstrength.25–28 There are also many reports on how salt, temper-ature and approach velocity inuence the mechanical proper-ties of PEG brushes.29–32 However, the absolute stiffness valueshave not been reported, which makes the comparison betweendifferent studies difficult. Also, there is a substantial amount ofwork on developing force–indentation models and character-izing micron thick lms,33–36 but these models tend to breakdown for nanoscale lms with thicknesses < 20 nm becausemany interaction forces, such as van der Waals interactions,electric double layer (EDL) forces, and attractive hydrophobicinteractions, complicate themechanical response of the lms atthese scales.37
Here we investigate synthetic approaches to creating thin,mechanically compliant PEG monolayer lms on single crys-talline tin dioxide (SnO2) nanobers38 and characterize theirelastic properties using AFM. Silane-based chemistries areexploited to generate smooth, conformal brush structures witha thickness of <20 nm in solution. The strength of the tip–sample interactions are extensively examined with differentAFM tip modications and in different ionic solutions, whichlays the foundation for accurate characterization of themechanical properties. Our results show that there exists ahighly reproducible linear elastic regime that spans the initial50% indentation and that the mechanical properties of the PEGlms can be tuned from 5 MPa to 700 kPa by altering themolecular weight (MW) of the polymer chains.
ExperimentalMaterials
PEG-silanes (MW ¼ 2000 Da, 5000 Da, 10 000 Da) werepurchased from Laysan Bio. All the other reagents and solventswere purchased from Fisher Scientic.
Nanober chip fabrication
Silicon wafers (111) were rst cleaned in a piranha solution(1 : 3 30% H2O2/conc. H2SO4, Caution: piranha solution is astrong oxidant and can cause explosions when mixed withorganic solvents) at 90 �C for 10 min. The silicon substrateswere then immersed in HF for 5 min to completely remove thesurface oxide followed by a soak in an RCA 1 solution (NH4-OH : H2O2 : H2O 1 : 1 : 5) and RCA 2 solution (HCl : H2O2 : H2O1 : 1 : 5), each at 70 �C for 10 min, to grow a clean native oxidelayer. The silicon substrates were rinsed with deionized water(18 UM, MilliQ) then blown dry with nitrogen. The SnO2
nanobers were synthesized via a thermal vaporization processas described elsewhere.39,40 The cross-sectional dimensions ofthe nanobers range from 200–700 nm. The clean SnO2 nano-bers were then transferred to the silicon substrates using a3-axis micromanipulator. Aer a 10 min oxygen plasma treat-ment, the nanober chips were rinsed with water and driedunder nitrogen.
8002 | Soft Matter, 2014, 10, 8001–8010
PEG lms
The high MW PEG silanes are insoluble in the toluene solutionsat room temperature. To improve solubility and promote thereaction to occur between the PEG silane and nanobers, thenanober chips were allowed to react overnight at 50 �C with0.2 mM PEG silane in an anhydrous toluene solution in a dry airprotected glove box. A 0.1% v/v HCl catalyst was added to drivethe reaction.41–43 Aerwards, the chips were rinsed thoroughlywith toluene, acetone, and methanol. The wafers were thenblown dried and kept in the dry box until testing. For TEManalysis, the SnO2 nanobers were suspended over 50 mm wide� 3 mm deep trenches etched in silicon to allow the PEG todeposit around the entire ber and simplify the transfer of theber to the TEM grids using the micromanipulator.
AFM characterization
A multimode AFM (Veeco Nanoscope IV) was used to carry outthe imaging and force–indentation experiments. The drythickness and dry imaging was measured using silicon probesin tapping mode. The incompressible wet thickness wasmeasured in contact mode under an applied force of 5.5 nN.The force–indentation measurements were conducted incontact mode in 1� phosphate buffered solution (PBS) toreduce electrostatic interactions between the tip and surfaceexcept when electric double layer forces were purposefullybeing probed. The AFM was programmed to indent on the PEGlms with a maximum force of 5.5 nN during a 100 nmapproach at a speed of 0.1 Hz. Each force curve consisted of1024 points along the AFM approach and retraction sections.Force mapping was used for indenting the PEG lms on SnO2
nanobers at a speed of 1 Hz for each force curve with aresolution of 512 points at each node of a square grid (16 � 16)distributed in a 500 nm � 500 nm area. The AFM probes usedfor the uidic measurements were triangular SiN MLCTprobes (Bruker, Santa Barbara, CA) with a tip radius r ¼ 30 nmand a spring constant k ¼ 0.14 � 0.02 N m�1. The tip radiuswas calibrated by scanning electron microscopy (Fig. S1†) andimaging (under contact mode) sharp features on a standardRS-12M sample from Bruker (Fig. S2†).44,45 The spring constantof the tip was quantied using the thermal tune method on aseparate Veeco Nanoscope V controller AFM.46 The opticalsensitivity of the AFM system was assessed by indenting on aclean silicon surface in 1� PBS.
Tip functionalization
To render the tips hydrophilic, and get rid of the silicone oil andcontaminations on the commercial SiN tips,47 the tips werecleaned by rst exposing the tips to a UV/ozone plasma for 15min, then dipping in a hot freshly prepared piranha solution for15 min, followed by rinsing with copious amounts of deionizedwater and nitrogen drying. To render the tips hydrophobic, theclean tips were reacted with a 5 mM solution of trimethoxy-(propyl) silane in toluene overnight. Aer chemical modica-tion, the tips were rinsed thoroughly with toluene, acetone,methanol, and dried with nitrogen.48
This journal is © The Royal Society of Chemistry 2014

Paper Soft Matter
Ope
n A
cces
s A
rtic
le. P
ublis
hed
on 1
3 A
ugus
t 201
4. D
ownl
oade
d on
12/
25/2
021
5:53
:08
AM
. T
his
artic
le is
lice
nsed
und
er a
Cre
ativ
e C
omm
ons
Attr
ibut
ion
3.0
Unp
orte
d L
icen
ce.
View Article Online
Results and discussionPEG lms and thickness characterization
A favorable approach to coat a polymer on the surface of anoxide material is a silane coupling reaction. Fig. 1 illustrates thechemical reaction scheme for the PEG graing. A silanecoupling reaction was chosen to covalently link PEG on theoxide surface of silicon and SnO2 nanobers since the chemicalapproach produces higher density, and more stable, PEGmonolayer lms compared to other reported methods.49,50 Tooptimize the synthetic condition, we introduced an oxygenplasma etch to hydroxylate the surface,51 rather than the typicalpiranha treatment followed by sonication, since the bubblesformation during piranha cleaning can dislodge the nanobersfrom the substrate. Our silane reactions used much lower PEGconcentrations compared to other synthetic processes, but evenwith the smaller reactant amounts our lms showed thick-nesses similar to other oxide surfaces.49 To determine theroughness of the PEG lms on the silicon in an aqueous envi-ronment, AFM topography images were captured and the rmsroughness was extracted. The roughness of the unmodiedsilicon surface was found to be around 1 A and aer modifyingthe surface with PEG lms, all of the measured roughnessvalues were less than 2 A (Fig. 2). The AFM images also revealedthat the PEG monolayers were continuous and pit-free. Weconverted the raw data with tip deconvolution technique(provided by Gwyddion52 soware) and found there to be nodifference before and aer surface reconstruction (Fig. S3†),indicating that the image captures the true morphology of thePEG lm. Our wet rms roughness values are lower than the dryroughness (z3 A) (Fig. S4†) which is similar to the dry reported
Fig. 1 Synthetic scheme for grafting PEG layers onto the silicon oxide a
Fig. 2 AFM topographic images of PEG films (on silicon) of varyingmolecbuffer.
This journal is © The Royal Society of Chemistry 2014
roughness for lower molecular weight PEG-silanes (MW z 500Da) deposited on silicon.42,53
The thicknesses of the as-deposited PEG lms on siliconsubstrates were then analyzed using a nanober mask method.With this procedure nanobers were used as masks to protectthe underlying silicon substrate (Fig. 3a) from the graingchemistry. Aer depositing the PEG lms on the substrates, thenanober masks were removed using a 3-axis micromanipu-lator so we could image the dry thickness of the PEG lm(Fig. 3b) and incompressible wet thickness when the materialsare immersed in solution (Fig. 3c). The thickness of the step inthe AFM image is a combination of the PEG lm thickness andthe oxide layer thickness (ca. 1 nm) formed during the oxygenplasma step (Fig. S5†).54–57 Table 1 lists the corrected thick-nesses extracted from the AFM images on the silicon substrates.The data shows that the dry thickness and the incompressiblewet thickness are very similar for all the different MWs. Thisimplies that the longer PEG chains gra to the surface with alower density, compared to the lower MW chains, so that all theMWs end up with roughly the same thickness in the dry state.PEG lms deposited on the SnO2 nanobers were also charac-terized using high-resolution transmission electron microscopy(TEM). As shown in Fig. 4, the PEG deposition creates smoothand conformal coatings on the SnO2 nanober with a drythickness of around 2 nm.
Tip–sample interactions and ionic effects
When using AFM probes to characterize the mechanic proper-ties of a thin lm, there exists several surface interaction forcesthat need to be understood to properly quantify the truemechanical response of the polymer. For example, local tip–
nd tin dioxide surfaces.
ular weight (2k, 5k, 10k) along with line profiles across the film in 1� PBS
Soft Matter, 2014, 10, 8001–8010 | 8003

Fig. 3 (a) Scheme of the nanofibermaskmethod. Step 1– place a nanofiber on a clean silicon substrate; Step 2– oxygen plasma treat the chip toform a native oxide layer (�1 nm thick); Step 3 – deposit PEG coating and remove the nanofiber with a 3-axis micromanipulator; Step 4 –characterize film using AFM. (b) AFM images and associated line profiles of PEG films on silicon substrates in air under tapping mode. (c) AFMimages and associated line profiles of PEG films in the same position as (b) in a 1� PBS buffer solution under contact mode.
Soft Matter Paper
Ope
n A
cces
s A
rtic
le. P
ublis
hed
on 1
3 A
ugus
t 201
4. D
ownl
oade
d on
12/
25/2
021
5:53
:08
AM
. T
his
artic
le is
lice
nsed
und
er a
Cre
ativ
e C
omm
ons
Attr
ibut
ion
3.0
Unp
orte
d L
icen
ce.
View Article Online
sample interaction forces such as electrostatic and van derWaals forces have to be decoupled from steric interactionsbetween the tip and polymer chains to minimize the errorsduring the mechanical characterization. Feldman et al. haveshown that oligo(ethylene glycol) single monolayers formed ongold and silver substrates have different graing densities, andtherefore exhibit different hydrophilic and hydrophobic prop-erties.58 In this work we compared the force–separation curvesof PEG lms on silicon surfaces using both hydrophilic andhydrophobic functionalized tips to see if there are any domi-nant surface interactions that can contribute to the measuredmechanical resistance of the lms.59 Fig. 5 shows that theresponses for all MWs are fairly similar, indicating there are no
8004 | Soft Matter, 2014, 10, 8001–8010
attractive hydrophobic interactions that have been previouslyreported for high density oligo(ethylene glycol) monolayers onsilver surfaces.58 Our data also suggests that the short propylgroups used to render the tips hydrophobic do not interferewith the mechanical properties of the PEG lm. Therefore, wechose to use the hydrophobic tips for mechanical measure-ments since they are less susceptible to fouling and contami-nations, which could complicate the mechanical measurementsby introducing unknown tip–sample interactions.
The majority of tip–sample interactions are due to EDL forcesthat arise when two charged surfaces are brought in close prox-imity of each other. These surface effects strongly depend on theionic strength of the surrounding medium, in which counter ions
This journal is © The Royal Society of Chemistry 2014

Table 1 Structural properties of PEG films on silicon substrates
MW (Da) hdrya (nm) hincompressible
b (nm) hcompressiblec (nm) h0
d (nm) hwete/hdry sf (nm) RF
g (nm)
2k 2.42 � 0.05 3.01 � 0.04 3.45 � 0.35 4.43 � 0.16 2.67 2.59 � 0.14 3.545k 2.32 � 0.03 2.95 � 0.05 6.37 � 0.32 9.02 � 0.27 4.02 3.59 � 0.16 6.1310k 2.20 � 0.05 3.01 � 0.08 10.36 � 1.96 15.39 � 0.81 6.08 4.55 � 0.37 9.29
a Average thicknesses of the PEG monolayer, hdry, were obtained frommultiple AFM images in the dry state (Fig. 3b). b Incompressible thicknesses,hincompressible, were obtained from the AFM images of the PEG monolayers at around 5.5 nN force in 1� PBS (Fig. 3c). c Compressible thicknesses,hcompressible, were obtained from the indentation distance during the force–indentation curves with a maximum force of 5.5 nN. d The polymerequilibrium thickness, h0, was calculated from Milner's polymer brush theory.23 e Wet thickness, hwet, is the sum of hincompressible andhcompressible.
f Average separation between chains sites, s, was calculated from Milner's polymer brush theory. g Flory radius, Rf ¼ l(MWPEG/MWEG)
3/5, where l is length of the PEG monomer (l ¼ 0.358 nm),8 and MWPEG and MWEG are the MWs of PEG and ethylene glycol (44 Da),respectively.
Fig. 4 High-resolution TEM images of PEG films on SnO2 nanofibers.
Paper Soft Matter
Ope
n A
cces
s A
rtic
le. P
ublis
hed
on 1
3 A
ugus
t 201
4. D
ownl
oade
d on
12/
25/2
021
5:53
:08
AM
. T
his
artic
le is
lice
nsed
und
er a
Cre
ativ
e C
omm
ons
Attr
ibut
ion
3.0
Unp
orte
d L
icen
ce.
View Article Online
in the solution screen the surface charge and alter the repulsive orattractive forces between the surfaces. To analyze EDL forces, wecarried out numerous nanoindentation experiments in differentsalt concentrations and monitored the local interactions thatoccurred as the tip was brought in close proximity to the substrate.It was found that all the force curves, independent of the MW ofthe PEG, were identical for ionic strengths ranging from 1–10�PBS. At these salt concentrations the Debye length is <3 nm andhas minimal effects on the compression of the lms. Importantly,slight variations in salt concentration around 150 mM (equivalentto 1� PBS and similar to that found in biological media) did notinuence the AFM force curves. However, in the case of lower ionicstrengths, the Debye length exceeds that of the lm thicknessesand starts to alter the nanoindentation curves. The effect from lowionic strength on the nano-indentation curves is translated topremature force signatures during the AFM approach curves,making it hard to assign the contact point. Properly assigning thecontact point is critical for accurately deriving the mechanicalproperties of the lm. In our data the contact point was identied
Fig. 5 Force–separation curves for different MW PEG films depositedon silicon surfaces using hydrophobic tips [2k (black), 5k (red) and 10k(blue)] and hydrophilic tips [2k (gray), 5k (pink) and 10k (azure)].
This journal is © The Royal Society of Chemistry 2014
as the point where the force is higher than twice of the standarddeviation of the noise level compared to when the tip is in freespace. Overall, when the contact point (Fig. 6b–d, black dots)occurs at a distance larger than the electrostatic interactiondistance determined from the bare substrates (Fig. 6a, yellow dots),the force–separation response is generated from steric repulsion;otherwise the indentation curves are a convolution of both stericand tip–sample electrostatic interactions. Similar results are alsodiscussed by Pasche et al. where they investigated the forceindentation curve of PLL-g-PEG copolymers in different bufferconcentration and showed that PEG layers thicker than the Debyelength can shield the electrostatic forces.25,26
Fig. 6 Force–separation curves on a bare silicon surface for differentPEGMWs and various salt concentrations. The yellow dots indicate thestart points of the electrostatic forces whereas the black dots repre-sent the contact point (when the AFM tip comes in physical contactwith the PEG monolayer).
Soft Matter, 2014, 10, 8001–8010 | 8005

Soft Matter Paper
Ope
n A
cces
s A
rtic
le. P
ublis
hed
on 1
3 A
ugus
t 201
4. D
ownl
oade
d on
12/
25/2
021
5:53
:08
AM
. T
his
artic
le is
lice
nsed
und
er a
Cre
ativ
e C
omm
ons
Attr
ibut
ion
3.0
Unp
orte
d L
icen
ce.
View Article Online
Structural properties of the PEG lms
Multiple force–indentation curves were measured at differentlm locations on the SnO2 nanobers dispersed on the siliconsubstrates (Fig. 7a), and for a given MW they all showed similarelastic behavior at various cycling frequencies (0.1–4 Hz).However, to decrease the noise of the force curves the approachspeeds were kept low (#1 Hz). Fig. 7b shows representativeforce–indentation curves for PEG 2k, 5k, and 10k, on siliconsubstrates and tin dioxide nanobers in 1� PBS. An importantstructural parameter for the PEG lms is the inter-chainspacing, s, which could be calculated from the dry thickness ofthe lm. However, we wanted to investigate the spacing betweenchains when the lm is in the uncompressed or elastic regime.It is found from the indentation experiments that the incom-pressible thickness (once the lm is fully collapsed under force)did not contribute much to the elastic properties of the initialcompression, but if the incompressible thickness is used toquantify the inter-chain spacing the stiffness values were over-estimated. A more reasonable approach is to t the force–separation curve with a polymer compression model and usethe model to calculate the distance between the chains. The deGennes model assumes a uniform density throughout thelm,19,20 whereas Milner and colleagues use a mean-eld theoryto show that the self-similar concentration prole of the poly-mer brush is parabolic.21–24 Milner's theory provides a betterdescription of our polymer material and can be represented bythe following expressions:60–62
F ¼ 2pRE ¼ �2pR
ðDh0
p�D�dD
¼ 4pRP0
"h0
Dþ�D
h0
�2
� 1
5
�D
h0
�5
� 9
5
#(1)
Fig. 7 (a) Forcemapping images of SnO2 fibers with different molecular wdifferent molecular weight (2k, 5k and 10k) on a silicon substrate comparewas used to fit the curves (red).
8006 | Soft Matter, 2014, 10, 8001–8010
P0 ¼ kBTN
2
�p2
12
�1=3l4=3
s10=3(2)
h0 ¼ (12/p2)1/3N(l)5/3/D2/3 (3)
where D is the separation between the AFM tip and substrateminus the incompressible PEG lm thickness, F is the forcebetween the AFM tip and PEG lm, R is the radius of the AFMtip, h0 is the equilibrium polymer brush thickness, kB is Boltz-mann's constant, T is the temperature, N is the number of PEGrepeat units, l is the PEG monomer length (�0.358 nm),8 and sis the distance between graed chains (the tting parameter).We t the force–separation curves to Milner's theory whenD > 0.2hcompressible, where hcompressible is the indentationdistance, because the AFM has limitations in the high forceregion (D < 0.2hcompressible) where the polymer chains are dis-placed laterally instead of being further compressed.63 Table 1(silicon) and Table 2 (SnO2 nanober) summarize importantparameters extracted from the force–separation curves. Inter-estingly, h0 is larger than hcompressible for all tested molecularweights. Considering that the noise of our instrument is around10 pN, we anticipate an underestimation of the thickness whichis what we observe. The difference between h0 and hcompressible
for the low MW PEG 2k is small which is likely due to theformation of a dense lm. However h0 is much larger thanhcompressible for both 5k and 10k which is interpreted as soerlms with longer compression distances.
To get a more detailed understanding of the packinggeometry of the PEG, we compared the chain spacing with theFlory radius in different conformations. All of our lms obey thecondition of s < RF, where RF is the Flory radius.64 Therefore, allPEG chains in our system have a brush-like structure where thetotal wet thickness hwet is a summation of the incompressiblewet thickness hincompressible and the probe indentation distance
eight PEG coatings. (b) Force–separation curves (black) of PEG films ofd with indentations on SnO2 nanofibers. Milner's polymer brush model
This journal is © The Royal Society of Chemistry 2014
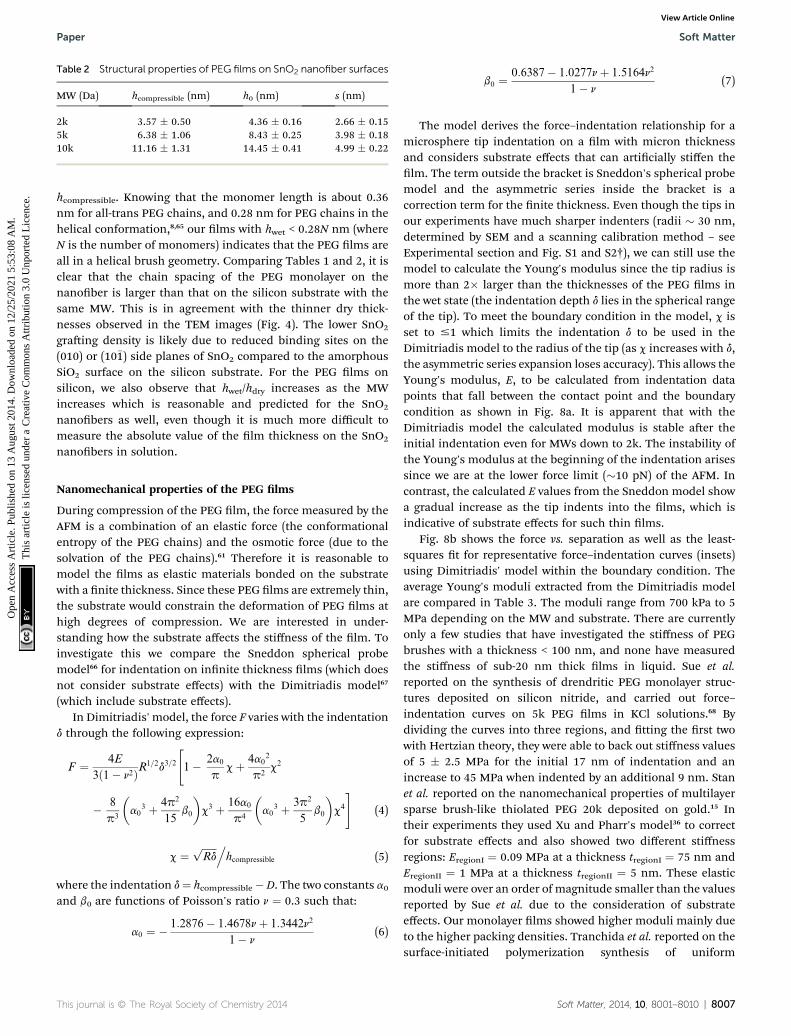
Table 2 Structural properties of PEG films on SnO2 nanofiber surfaces
MW (Da) hcompressible (nm) h0 (nm) s (nm)
2k 3.57 � 0.50 4.36 � 0.16 2.66 � 0.155k 6.38 � 1.06 8.43 � 0.25 3.98 � 0.1810k 11.16 � 1.31 14.45 � 0.41 4.99 � 0.22
Paper Soft Matter
Ope
n A
cces
s A
rtic
le. P
ublis
hed
on 1
3 A
ugus
t 201
4. D
ownl
oade
d on
12/
25/2
021
5:53
:08
AM
. T
his
artic
le is
lice
nsed
und
er a
Cre
ativ
e C
omm
ons
Attr
ibut
ion
3.0
Unp
orte
d L
icen
ce.
View Article Online
hcompressible. Knowing that the monomer length is about 0.36nm for all-trans PEG chains, and 0.28 nm for PEG chains in thehelical conformation,8,65 our lms with hwet < 0.28N nm (whereN is the number of monomers) indicates that the PEG lms areall in a helical brush geometry. Comparing Tables 1 and 2, it isclear that the chain spacing of the PEG monolayer on thenanober is larger than that on the silicon substrate with thesame MW. This is in agreement with the thinner dry thick-nesses observed in the TEM images (Fig. 4). The lower SnO2
graing density is likely due to reduced binding sites on the(010) or (10�1) side planes of SnO2 compared to the amorphousSiO2 surface on the silicon substrate. For the PEG lms onsilicon, we also observe that hwet/hdry increases as the MWincreases which is reasonable and predicted for the SnO2
nanobers as well, even though it is much more difficult tomeasure the absolute value of the lm thickness on the SnO2
nanobers in solution.
Nanomechanical properties of the PEG lms
During compression of the PEG lm, the force measured by theAFM is a combination of an elastic force (the conformationalentropy of the PEG chains) and the osmotic force (due to thesolvation of the PEG chains).61 Therefore it is reasonable tomodel the lms as elastic materials bonded on the substratewith a nite thickness. Since these PEG lms are extremely thin,the substrate would constrain the deformation of PEG lms athigh degrees of compression. We are interested in under-standing how the substrate affects the stiffness of the lm. Toinvestigate this we compare the Sneddon spherical probemodel66 for indentation on innite thickness lms (which doesnot consider substrate effects) with the Dimitriadis model67
(which include substrate effects).In Dimitriadis' model, the force F varies with the indentation
d through the following expression:
F ¼ 4E
3ð1� n2ÞR1=2d3=2
"1� 2a0
pcþ 4a0
2
p2c2
� 8
p3
�a0
3 þ 4p2
15b0
�c3 þ 16a0
p4
�a0
3 þ 3p2
5b0
�c4
#(4)
c ¼ffiffiffiffiffiffiRd
p .hcompressible (5)
where the indentation d¼ hcompressible� D. The two constants a0and b0 are functions of Poisson's ratio n ¼ 0.3 such that:
a0 ¼ � 1:2876� 1:4678nþ 1:3442n2
1� n(6)
This journal is © The Royal Society of Chemistry 2014
b0 ¼0:6387� 1:0277nþ 1:5164n2
1� n(7)
The model derives the force–indentation relationship for amicrosphere tip indentation on a lm with micron thicknessand considers substrate effects that can articially stiffen thelm. The term outside the bracket is Sneddon's spherical probemodel and the asymmetric series inside the bracket is acorrection term for the nite thickness. Even though the tips inour experiments have much sharper indenters (radii � 30 nm,determined by SEM and a scanning calibration method – seeExperimental section and Fig. S1 and S2†), we can still use themodel to calculate the Young's modulus since the tip radius ismore than 2� larger than the thicknesses of the PEG lms inthe wet state (the indentation depth d lies in the spherical rangeof the tip). To meet the boundary condition in the model, c isset to #1 which limits the indentation d to be used in theDimitriadis model to the radius of the tip (as c increases with d,the asymmetric series expansion loses accuracy). This allows theYoung's modulus, E, to be calculated from indentation datapoints that fall between the contact point and the boundarycondition as shown in Fig. 8a. It is apparent that with theDimitriadis model the calculated modulus is stable aer theinitial indentation even for MWs down to 2k. The instability ofthe Young's modulus at the beginning of the indentation arisessince we are at the lower force limit (�10 pN) of the AFM. Incontrast, the calculated E values from the Sneddon model showa gradual increase as the tip indents into the lms, which isindicative of substrate effects for such thin lms.
Fig. 8b shows the force vs. separation as well as the least-squares t for representative force–indentation curves (insets)using Dimitriadis' model within the boundary condition. Theaverage Young's moduli extracted from the Dimitriadis modelare compared in Table 3. The moduli range from 700 kPa to 5MPa depending on the MW and substrate. There are currentlyonly a few studies that have investigated the stiffness of PEGbrushes with a thickness < 100 nm, and none have measuredthe stiffness of sub-20 nm thick lms in liquid. Sue et al.reported on the synthesis of drendritic PEG monolayer struc-tures deposited on silicon nitride, and carried out force–indentation curves on 5k PEG lms in KCl solutions.68 Bydividing the curves into three regions, and tting the rst twowith Hertzian theory, they were able to back out stiffness valuesof 5 � 2.5 MPa for the initial 17 nm of indentation and anincrease to 45 MPa when indented by an additional 9 nm. Stanet al. reported on the nanomechanical properties of multilayersparse brush-like thiolated PEG 20k deposited on gold.15 Intheir experiments they used Xu and Pharr's model36 to correctfor substrate effects and also showed two different stiffnessregions: EregionI ¼ 0.09 MPa at a thickness tregionI ¼ 75 nm andEregionII ¼ 1 MPa at a thickness tregionII ¼ 5 nm. These elasticmoduli were over an order of magnitude smaller than the valuesreported by Sue et al. due to the consideration of substrateeffects. Our monolayer lms showed higher moduli mainly dueto the higher packing densities. Tranchida et al. reported on thesurface-initiated polymerization synthesis of uniform
Soft Matter, 2014, 10, 8001–8010 | 8007

Fig. 8 (a) Young's moduli of PEG films with different molecular weight as a function of indentation. Moduli are extracted using a Dimitriadismodel (squares) which are compared to those calculated from a Sneddon model (circles). Black squares (silicon, Dimitriadis model), red squares(nanofiber, Dimitriadis model), black circles (silicon, Sneddonmodel), red circles (nanofiber, Sneddonmodel). (b) Force–separation curves of PEGfilms with different molecular weight [2k (black line), 5k (red line), 10k (blue line)] on a silicon surface (left) compared to curves on a SnO2 (right)nanofiber. The gray line is the force–separation curve on a bare silicon surface. Insets: force–indentation curves for different molecular weights[2k (black square), 5k (red triangle) and 10k (blue circle)]. The solid linear lines are fits using a Dimitriadis model.
Fig. 9 A cartoon showing the different states of the PEG monolayersas a function of molecular weight and local environment (air vs.water).
Soft Matter Paper
Ope
n A
cces
s A
rtic
le. P
ublis
hed
on 1
3 A
ugus
t 201
4. D
ownl
oade
d on
12/
25/2
021
5:53
:08
AM
. T
his
artic
le is
lice
nsed
und
er a
Cre
ativ
e C
omm
ons
Attr
ibut
ion
3.0
Unp
orte
d L
icen
ce.
View Article Online
poly(diethylene glycol methylether methacrylate) (PDEGMA)brushes deposited on gold with a thickness of�80� 20 nm andelastic modulus of 0.76 � 0.2 MPa in a buffered solution usingSneddon's model.69 In addition, they synthesized poly(oligo-ethylene glycol methylether methacrylate) (POEGMA) brusheson gold and extracted an elastic modulus of �3.24 � 0.2 MPa.Our stiffness values were calculated on much thinner (<20 nm)PEG monolayer lms, and are comparable to what Tranchidaet al. have calculated for much thicker brush structures.Furthermore, we have taken extreme care in isolating thesubstrate effects from the pure elastic behavior of the lms. Partof this process also includes properly assigning the contactpoint. If the contact point is altered even by 15% of thecompressible thickness the extracted moduli uctuate by up to50% (Fig. S6†). Considering all these factors, we are condentthat our procedures provide accurate values for the stiffness ofPEG monolayers and can be leveraged to probe the mechanicalproperties of other thin, compressible layers.
In the previous section we showed that the expansion ratiohwet/hdry increases as the MW increases. The data in Table 3 also
Table 3 Young's modulus of the PEG films on Si substrates and SnO2 n
MW (Da) 2k 2k nanober
Young's modulusa (MPa) 4.99 � 1.61 4.65 � 2.78Linear stiffness length ratiob 0.40 � 0.003 0.40 � 0.006
a Young's moduli are calculated from the Dimitriadis t. b Linear stiffnessover the total compressible thickness.
8008 | Soft Matter, 2014, 10, 8001–8010
validates this trend by showing that longer chains (larger MW)produce a larger compressibility of the PEG brushes (Fig. 9). Wealso observe a slight soening of the PEG coatings when graedto the SnO2 surface. As indicated earlier, when discussing thegraing density differences, this is likely caused by the lowernumber of binding sites on the single crystalline side surfacesof the SnO2 nanobers compared to the amorphous silica
anofibers
5k 5k nanober 10k 10k nanober
2.57 � 0.68 1.43 � 0.82 1.52 � 0.35 0.69 � 0.320.46 � 0.008 0.46 � 0.028 0.58 � 0.059 0.60 � 0.040
length ratio is the ratio of the length where the Young's modulus is linear
This journal is © The Royal Society of Chemistry 2014

Paper Soft Matter
Ope
n A
cces
s A
rtic
le. P
ublis
hed
on 1
3 A
ugus
t 201
4. D
ownl
oade
d on
12/
25/2
021
5:53
:08
AM
. T
his
artic
le is
lice
nsed
und
er a
Cre
ativ
e C
omm
ons
Attr
ibut
ion
3.0
Unp
orte
d L
icen
ce.
View Article Online
surface. Besides the expansion ratio, it is interesting to nd thatthe linear stiffness length ratios, dened as the compressionlength where the Young's modulus is linear over the totalcompressible thickness, are all over 40% of the total indenta-tion thickness (Table 3). As the molecular weight increase to10k, the linear stiffness length ratio increases to 60%. Thisnding is similar to what Tranchida et al. observe for theirthicker spin coated lms, where they modeled the lms as amattress of non-interacting springs and veried that theYoung's modulus of their 90 nm thick lms are linear up to acompression of �50%.70 The linear regime of our thin lms ismuch larger than what has been reported in literature (�10%)which indicates that the PEG brush monolayers behave morelike a bed of springs instead of a continuous lm up to anindentation of�50%.We attempted to t our force curves usingthe graded model,11 but this failed likely due to the largedifference in stiffness between the polymer monolayer andunderlying substrate.
To understand why the tting model breaks down at higherforces and compression, we have to consider several propertiesof the system including the conformational changes in thepolymer, as well as solvent exclusion mechanisms. Since thePEG brushes are in a helical structure they allow stronghydrogen bonding between the oxygen atoms of the PEG chainsand the water molecules. Therefore, it is expected that highercompressions will force water to be excluded from the chains,leading to an increase in the effective stiffness. The initial 50%of the indentation ts well using Dimitriadis' model and can beconsidered as a linear elastic regime, which is minimallyaffected by local solvation shells and intermolecular interac-tions. As the lm is compressed further by the AFM tip, the PEGchains are subject to solvent exclusion effects and inter- andintra-chain interactions. These effects are difficult to incorpo-rate into the model which breaks down at higher indentation.Importantly, the linear elastic regime is highly predictable andreproducible, which is shown throughout our data.
Conclusion
We have demonstrated a facile route to graing thin,compressible PEG monolayers on SnO2 nanobers and havedescribed a universal method for quantifying their structuraland nanomechanical properties in liquid using AFM. Thenanomechanical properties of the PEG lms were isolated fromother interactions including electrostatic and van der Waalsinteractions using hydrophobic modied AFM tips. All of thetested PEG MWs (2k, 5k, 10k) show that the dominant forcesmeasured by the AFM stem from steric interaction in solutionswhen the ionic strength is equal to or greater than that found inbiological media. The dry and wet states of the PEG lms onsilicon were probed using a nanobermasking technique whichallowed us to directly extract thicknesses of the thin lms. AFMforce–indentation curves showed wide tunability in the nano-mechanical properties of the PEG chains by simply controllingthe MW of the starting materials. The higher MW PEG exhibitedsmaller Young's moduli due to a higher expansion ratio. Thephysical properties of the lms deposited on the nanober
This journal is © The Royal Society of Chemistry 2014
surfaces also showed soer mechanical properties compared tosilicon-supported lms due to slightly lower densities. Ourmethod for quantifying the stiffness of thin polymer lms isvalid when the indentation and lm thickness is constrained todimensions less than the tip radius. These ndings not onlyprovide impactful information for oxide systems designed tocontrol molecular interactions on surfaces, but these lmscould play a signicant role in the develop of novel opto-mechanical instrumentation that utilizes the mechanical feed-back from polymer lms to transduce molecular level forces.
Acknowledgements
The authors acknowledge the National Science Foundation(NSF, contract no. 1150952) and the University of California,Office of the President (UC-LFRP, contract no. 130585-001). Wewould like to thank Dr Fernando Arce and Mr Joon Lee for helpwith the AFM probe calibration and insightful discussions.
References
1 T. Gillich, C. Acikgoz, L. Isa, A. D. Schluter, N. D. Spencer andM. Textor, ACS Nano, 2013, 7(1), 316–329.
2 C. L. Lay, H. Q. Liu, D. C. Wu and Y. Liu, Chem.–Eur. J., 2010,16(10), 3001–3004.
3 J. Peyre, V. Humblot, C. Methivier, J. M. Berjeaud andC. M. Pradier, J. Phys. Chem. B, 2012, 116(47), 13839–13847.
4 S. Sharma, R. W. Johnson and T. A. Desai, Langmuir, 2004,20(2), 348–356.
5 S. Sharma, R. W. Johnson and T. A. Desai, Biosens.Bioelectron., 2004, 20(2), 227–239.
6 H. Xu, F. Yan, E. E. Monson and R. Kopelman, J. Biomed.Mater. Res., Part A, 2003, 66(4), 870–879.
7 I. M. Rio-Echevarria, F. Selvestrel, D. Segat, G. Guarino,R. Tavano, V. Causin, E. Reddi, E. Papini and F. Mancin, J.Mater. Chem., 2010, 20(14), 2780–2787.
8 S. Upadhyayula, T. Quinata, S. Bishop, S. Gupta,N. R. Johnson, B. Bahmani, K. Bozhilov, J. Stubbs, P. Jreij,P. Nallagatla and V. I. Vullev, Langmuir, 2012, 28(11), 5059–5069.
9 I. Yoon, S. E. Baker, K. Kim, Y. M. Wang, S. C. Esener andD. J. Sirbuly, Nanoscale, 2013, 5(2), 552–555.
10 I. Yoon, S. E. Baker, K. Kim, N. O. Fischer, D. Heineck,Y. M. Wang, S. C. Esener and D. J. Sirbuly, Nano Lett.,2013, 13(4), 1440–1445.
11 H. Shulha, A. Kovalev, N. Myshkin and V. V. Tsukruk, Eur.Polym. J., 2004, 40(5), 949–956.
12 C. M. Stafford, C. Harrison, K. L. Beers, A. Karim, E. J. Amis,M. R. Vanlandingham, H. C. Kim, W. Volksen, R. D. Millerand E. E. Simonyi, Nat. Mater., 2004, 3(8), 545–550.
13 C. M. Stafford, B. D. Vogt, C. Harrison, D. Julthongpiput andR. Huang, Macromolecules, 2006, 39(15), 5095–5099.
14 Y. J. Sun, B. Akhremitchev and G. C. Walker, Langmuir, 2004,20(14), 5837–5845.
15 G. Stan, F. W. DelRio, R. I. MacCuspie and R. F. Cook, J. Phys.Chem. B, 2012, 116(10), 3138–3147.
Soft Matter, 2014, 10, 8001–8010 | 8009

Soft Matter Paper
Ope
n A
cces
s A
rtic
le. P
ublis
hed
on 1
3 A
ugus
t 201
4. D
ownl
oade
d on
12/
25/2
021
5:53
:08
AM
. T
his
artic
le is
lice
nsed
und
er a
Cre
ativ
e C
omm
ons
Attr
ibut
ion
3.0
Unp
orte
d L
icen
ce.
View Article Online
16 G. Duner, E. Thormann, A. Dedinaite, P. M. Claesson,K. Matyjaszewski and R. D. Tilton, So Matter, 2012, 8(32),8312–8320.
17 J. L. Cuellar, I. Llarena, S. E. Moya and E. Donath,Macromolecules, 2013, 46(6), 2323–2330.
18 I. M. Nnebe and J. W. Schneider, Macromolecules, 2006,39(10), 3616–3621.
19 P. G. de Gennes, Adv. Colloid Interface Sci., 1987, 27(3–4),189–209.
20 S. Alexander, J. Phys. (Paris), 1977, 38(8), 983–987.21 S. T. Milner, T. A. Witten and M. E. Cates, Macromolecules,
1988, 21(8), 2610–2619.22 S. T. Milner, T. A. Witten and M. E. Cates, Macromolecules,
1989, 22(2), 853–861.23 S. T. Milner, Science, 1991, 251(4996), 905–914.24 S. T. Milner, T. A. Witten and M. E. Cates, Europhys. Lett.,
1988, 5(5), 413–418.25 S. Pasche, J. Voros, H. J. Griesser, N. D. Spencer and
M. Textor, J. Phys. Chem. B, 2005, 109(37), 17545–17552.26 S. Pasche, M. Textor, L. Meagher, N. D. Spencer and
H. J. Griesser, Langmuir, 2005, 21(14), 6508–6520.27 M. Heuberger, T. Drobek and N. D. Spencer, Biophys. J., 2005,
88(1), 495–504.28 T. Drobek, N. D. Spencer andM. Heuberger,Macromolecules,
2005, 38(12), 5254–5259.29 A. S. Lea, J. D. Andrade and V. Hlady, Colloids Surf., A, 1994,
93, 349–357.30 S. C. McLean, H. Lioe, L. Meagher, V. S. J. Craig and
M. L. Gee, Langmuir, 2005, 21(6), 2199–2208.31 H. J. Butt, M. Kappl, H. Mueller, R. Raiteri, W. Meyer and
J. Ruhe, Langmuir, 1999, 15(7), 2559–2565.32 C. Dicke and G. Hahner, J. Phys. Chem. B, 2002, 106(17),
4450–4456.33 D. Tranchida, S. Piccarolo and M. Soliman, Macromolecules,
2006, 39(13), 4547–4556.34 H. J. Gao, C. H. Chiu and J. Lee, Int. J. Solids Struct., 1992,
29(20), 2471–2492.35 N. Gavara and R. S. Chadwick, Nat. Nanotechnol., 2012, 7(11),
733–736.36 H. T. Xu and G. M. Pharr, Scr. Mater., 2006, 55(4), 315–318.37 D. C. Lin and F. Horkay, So Matter, 2008, 4(4), 669–682.38 M. Law, D. J. Sirbuly, J. C. Johnson, J. Goldberger,
R. J. Saykally and P. D. Yang, Science, 2004, 305(5688),1269–1273.
39 Z. W. Pan, Z. R. Dai and Z. L. Wang, Science, 2001, 291(5510),1947–1949.
40 D. J. Sirbuly, M. Law, H. Q. Yan and P. D. Yang, J. Phys. Chem.B, 2005, 109(32), 15190–15213.
41 Z. H. Yang, J. A. Galloway and H. U. Yu, Langmuir, 1999,15(24), 8405–8411.
42 A. Papra, N. Gadegaard and N. B. Larsen, Langmuir, 2001,17(5), 1457–1460.
43 M. Q. Zhang, T. Desai and M. Ferrari, Biomaterials, 1998,19(10), 953–960.
8010 | Soft Matter, 2014, 10, 8001–8010
44 J. S. Villarrubia, Surf. Sci., 1994, 321(3), 287–300.45 J. S. Villarrubia, J. Res. Natl. Inst. Stand. Technol., 1997,
102(4), 425–454.46 J. L. Hutter and J. Bechhoefer, Rev. Sci. Instrum., 1993, 64(11),
3342.47 Y. S. Lo, N. D. Huefner, W. S. Chan, P. Dryden, B. Hagenhoff
and T. P. Beebe, Langmuir, 1999, 15(19), 6522–6526.48 Z. Q. Wei, C. Wang and C. L. Bai, Surf. Sci., 2000, 467(1–3),
185–190.49 R. Schlapak, D. Armitage, N. Saucedo-Zeni, M. Hohage and
S. Howorka, Langmuir, 2007, 23(20), 10244–10253.50 M. Cerruti, S. Fissolo, C. Carraro, C. Ricciardi, A. Majumdar
and R. Maboudian, Langmuir, 2008, 24(19), 10646–10653.51 A. U. Alam, M. M. R. Howlader and M. J. Deen, ECS J. Solid
State Sci. Technol., 2013, 2(12), 515–523.52 Gwyddion– Free SPM data analysis soware, http://
gwyddion.net/.53 F. Cecchet, B. De Meersman, S. Demoustier-Champagne,
B. Nysten and A. M. Jonas, Langmuir, 2006, 22(3), 1173–1181.54 S. Yamamoto, M. Ejaz, Y. Tsujii, M. Matsumoto and
T. Fukuda, Macromolecules, 2000, 33(15), 5602–5607.55 J. Fick, R. Steitz, V. Leiner, S. Tokumitsu, M. Himmelhaus
and M. Grunze, Langmuir, 2004, 20(10), 3848–3853.56 B. Bilen, Y. Skarlatos, G. Aktas, M. N. Inci, T. Dispinar,
M. M. Kose and A. Sanyal, J. Appl. Phys., 2007, 102(7), 073534.57 S. Acikgoz, B. Bilen, M. M. Demir, Y. Z. Menceloglu,
Y. Skarlatos, G. Aktas and M. N. Inci, Opt. Rev., 2008, 15(2),84–90.
58 K. Feldman, G. Hahner, N. D. Spencer, P. Harder andM. Grunze, J. Am. Chem. Soc., 1999, 121(43), 10134–10141.
59 J. Israelachvili, Proc. Natl. Acad. Sci. U. S. A., 1997, 94(16),8378–8379.
60 K. Hristova and D. Needham, J. Colloid Interface Sci., 1994,168(2), 302–314.
61 A. K. Kenworthy, K. Hristova, D. Needham andT. J. Mcintosh, Biophys. J., 1995, 68(5), 1921–1936.
62 P. Hamilton-Brown, T. Gengebach, H. J. Griesser andL. Meagher, Langmuir, 2009, 25(16), 9149–9156.
63 S. J. Oshea, M. E. Welland and T. Rayment, Langmuir, 1993,9(7), 1826–1835.
64 J. N. Israelachvili, Intermolecular and Surface Forces,Academic press, 2011.
65 P. Harder, M. Grunze, R. Dahint, G. M. Whitesides andP. E. Laibinis, J. Phys. Chem. B, 1998, 102(2), 426–436.
66 I. N. Sneddon, Int. J. Eng. Sci., 1965, 3(1), 47–57.67 E. K. Dimitriadis, F. Horkay, J. Maresca, B. Kachar and
R. S. Chadwick, Biophys. J., 2002, 82(5), 2798–2810.68 Z. Y. Suo, F. T. Arce, R. Avci, K. Thieltges and B. Spangler,
Langmuir, 2006, 22(8), 3844–3850.69 D. Tranchida, E. Sperotto, T. Staedler, X. Jiang and
H. Schonherr, Adv. Eng. Mater., 2011, 13(10), B369–B376.70 D. Tranchida, I. Lilge and H. Schonherr, Polym. Eng. Sci.,
2011, 51(8), 1507–1512.
This journal is © The Royal Society of Chemistry 2014