Quantitative Mapping of Pore Fraction Variations in ...
38
NASA Technical Paper 3377 August 1993 Quantitative Mapping of Pore Fraction Variations in Silicon Nitride Using an Ultrasonic Contact Scan Technique Don J. Roth, James D. Kiser, Suzanne M. Swickard, Steven A. Szatmary, and David P. Kerwin
Transcript of Quantitative Mapping of Pore Fraction Variations in ...

NASATechnicalPaper3377
August 1993
Quantitative Mapping ofPore Fraction Variationsin Silicon Nitride Usingan Ultrasonic ContactScan Technique
Don J. Roth,
James D. Kiser,
Suzanne M. Swickard,
Steven A. Szatmary,
and David P. Kerwin

NASATechnicalPaper3377
1993
Quantitative Mapping ofPore Fraction Variationsin Silicon Nitride Usingan Ultrasonic ContactScan Technique
Don J. Roth,James D. Kiser,and Suzanne M. SwickardLewis Research CenterCleveland, Ohio
Steven A. Szatmaryand David P. KerwinCleveland State UniversityCleveland, Ohio
National Aeronautics andSpace Administration
Office of ManagementScientific and TechnicalInformation Program

Trade names or manufacturers' names are used in this report for identificationonly. This usage does not constitute an official endorsement, either expressed orimplied, by the National Aeronautics and Space Administration.

iii
Contents
Page
1.0 Summary . . . . . . . . . . . . . . . . . . . . . . . . . . . . . . . . . . . . . . . . . . . . . . . . . . . . . . . . . . . . . . . . . . . . . . 12.0 Introduction . . . . . . . . . . . . . . . . . . . . . . . . . . . . . . . . . . . . . . . . . . . . . . . . . . . . . . . . . . . . . . . . . . . 13.0 Background . . . . . . . . . . . . . . . . . . . . . . . . . . . . . . . . . . . . . . . . . . . . . . . . . . . . . . . . . . . . . . . . . . . . 2
3.1 Importance of Si3N4 . . . . . . . . . . . . . . . . . . . . . . . . . . . . . . . . . . . . . . . . . . . . . . . . . . . . . . . . . . . . . . . . . . . . . . . . . 23.2 Relationships Between Ultrasonic Properties and Experimental Variables . . . . . . . . . . . . . . . . 23.3 Ultrasonic Measurements . . . . . . . . . . . . . . . . . . . . . . . . . . . . . . . . . . . . . . . . . . . . . . . . . . . . . . . 6
4.0 Experiment . . . . . . . . . . . . . . . . . . . . . . . . . . . . . . . . . . . . . . . . . . . . . . . . . . . . . . . . . . . . . . . . . . . . 74.1 Si3N4 Samples . . . . . . . . . . . . . . . . . . . . . . . . . . . . . . . . . . . . . . . . . . . . . . . . . . . . . . . . . . . . . . . 74.2 Ultrasonic Contact Scanning . . . . . . . . . . . . . . . . . . . . . . . . . . . . . . . . . . . . . . . . . . . . . . . . . . . . 94.3 Further Characterization . . . . . . . . . . . . . . . . . . . . . . . . . . . . . . . . . . . . . . . . . . . . . . . . . . . . . . . 10
5.0 Results and Discussion . . . . . . . . . . . . . . . . . . . . . . . . . . . . . . . . . . . . . . . . . . . . . . . . . . . . . . . . . . . 105.1 Ultrasonic Contact Scan Images and Properties Versus Frequency . . . . . . . . . . . . . . . . . . . . . . 105.2 Comparison of Contact Scan Results With Those From Other Techniques . . . . . . . . . . . . . . . . 165.3 Comparison of Si3N4 Disks . . . . . . . . . . . . . . . . . . . . . . . . . . . . . . . . . . . . . . . . . . . . . . . . . . . . . 185.4 Correlation of Ultrasonic Properties With Each Other and With Microstructure . . . . . . . . . . . . 215.5 Comparison of Ultrasonic Contact Scan Images for Scans on Machined and
Polished Disk Faces . . . . . . . . . . . . . . . . . . . . . . . . . . . . . . . . . . . . . . . . . . . . . . . . . . . . . . . . . . . 225.6 Dry- Versus Wet-Coupled Vpulse Images . . . . . . . . . . . . . . . . . . . . . . . . . . . . . . . . . . . . . . . . . . . 245.7 Longitudinal Versus Shear-Wave Vpulse Images and Poisson's Ratio Maps . . . . . . . . . . . . . . . . 245.8 Experimental Versus Expected Results for Frequency and Pore Fraction Dependence . . . . . . . 255.9 Correlation of Ultrasonic Contact Scan Results With Physical Properties . . . . . . . . . . . . . . . . . 27
6.0 Further Discussion . . . . . . . . . . . . . . . . . . . . . . . . . . . . . . . . . . . . . . . . . . . . . . . . . . . . . . . . . . . . . . 277.0 Conclusions . . . . . . . . . . . . . . . . . . . . . . . . . . . . . . . . . . . . . . . . . . . . . . . . . . . . . . . . . . . . . . . . . . . . 27Appendixes
A - Errors Associated With Pulse-Echo Measurements . . . . . . . . . . . . . . . . . . . . . . . . . . . . . . . . . . . 29B - Fabrication of Si3N4 Samples . . . . . . . . . . . . . . . . . . . . . . . . . . . . . . . . . . . . . . . . . . . . . . . . . . . . 31C - Symbols . . . . . . . . . . . . . . . . . . . . . . . . . . . . . . . . . . . . . . . . . . . . . . . . . . . . . . . . . . . . . . . . . . . . . 32
References . . . . . . . . . . . . . . . . . . . . . . . . . . . . . . . . . . . . . . . . . . . . . . . . . . . . . . . . . . . . . . . . . . . . . . . . 33

1
1.0 Summary
An ultrasonic scan procedure using the pulse-echo contactconfiguration was employed to obtain maps of pore fractionvariations in sintered silicon nitride samples in terms of ultra-sonic material properties. Ultrasonic velocity, attenuation coeffi-cient, and reflection coefficient images were obtainedsimultaneously over a broad band of frequencies (e.g., 30 to110 MHz) by using spectroscopic analysis. Liquid and mem-brane (dry) coupling techniques and longitudinal and shear-waveenergies were used. The major results include the following:Ultrasonic velocity (longitudinal and shear wave) images revealedand correlated with the extent of average through-thicknesspore fraction variations in the silicon nitride disks. Attenuationcoefficient images revealed pore fraction nonuniformity due tothe scattering that occurred at boundaries between regions ofhigh and low pore fraction. Velocity and attenuation coeffi-cient images were each nearly identical for machined andpolished disks, making the method readily applicable tomachined materials. Velocity images were similar for wet andmembrane coupling. Maps of apparent Poisson’s ratio con-structed from longitudinal and shear-wave velocities quanti-fied Poisson’s ratio variations across a silicon nitride disk.Thermal wave images of a disk indicated transient thermalbehavior variations that correlated with observed variations inpore fraction and velocity and attenuation coefficients.
2.0 Introduction
Traditional nondestructive evaluation (NDE) imaging meth-ods applicable to the characterization of high-performancematerials, such as vehicular engine ceramics and composites,include x-radiography, ultrasonic imaging, and thermal in-spection (ref. 1). In their standard configurations, these meth-ods measure an amplitude of transmission of the respectiveenergy used. These methods provide an efficient, quasi-quantitative measure of material homogeneity but may lackthe precision necessary for microstructure evaluation for high-performance materials (refs. 2 and 3). The use of materials indemanding high-performance applications will require detailedquantitative knowledge of microstructural and compositionalvariability for defining acceptable levels of variability and forrejecting those materials and processes that yield sample-to-
sample and within-sample variations likely to result in unac-ceptable property (e.g., strength, thermal conductivity, oroxidation resistance) variations. Variability must be preciselycharacterized either directly in terms of property measure-ment or indirectly through microstructural characterizationwhere microstructure-property relations have been previouslyestablished. In support of the latter, quantitative NDE meth-ods for the determination of the global microstructural stateare currently being developed and refined to aid in advancedmaterials development efforts (refs. 4 to 7).
Repeated, uniformly spaced ultrasonic contact measure-ments have been successful in previous studies for quantifyingand mapping inhomogeneity in various ceramics (SiC, Al2O3,YBa2Cu3O7) and metals in terms of ultrasonic material prop-erties (refs. 6 and 8 to 12). Such ultrasonic material propertiesinclude velocity, reflection coefficient, and attenuation coeffi-cient. In most cases, velocity mapping has been the preferredultrasonic property map due to its repeatable nature, relativelylow sensitivity to material surface condition and edge effects(ref. 13), and relative ease of quantitatively interpreting resultsin terms of microstructural features (ref. 14). Spatial micro-structural variations previously characterized in terms of ultra-sonic velocity include variations in pore fraction, granulartexture, and residual stress (refs. 9, 10, and 12). Reflectioncoefficient and attenuation coefficient maps derived fromcontact scanning have been used to a lesser extent for charac-terizing spatial variations in polycrystalline materials (ref. 6)because of an expected sensitivity to surface condition (ref. 15)and edge effects (ref. 13) and more difficulty in quantitativelyinterpreting results in terms of microstructrual features (ref. 6).
In this study, the ultrasonic contact pulse-echo method wasused in an automated scanning configuration in an attempt toquantify and map nonuniformity in polished and machinedsintered silicon nitride (Si3N4) disks containing distinct re-gions of high pore fraction formed during sintering. Here, theconfiguration was significantly (hardware and software) modi-fied from that of previous approaches (refs. 9, 10, and 16).Modification allowed the examination of any two-dimen-sional, complex-shaped (e.g., circular, tensile shaped) sampleby using small-diameter probes. The modification also al-lowed the use of dry as well as wet coupling and thus shear aswell as longitudinal wave energies. Reflection coefficient,attenuation coefficient, and velocity maps of the Si3N4 diskswere formed over a wide frequency range (e.g., 30 to 110 MHz)by using spectral analysis after acquisition of ultrasonic

2
waveform data. These three types of ultrasonic property mapswere examined to determine which ultrasonic property map ismost effective in characterizing nonununiformity and thenature of the correlation, if any, between different ultrasonicproperty maps. Spectral analysis was employed to determineif inhomogeneity was a function of frequency and to character-ize elastic (dispersion) behavior for Si3N4. Additionally, mapsof Poisson’s ratio for a disk were constructed from longitudinaland shear-wave velocity images. Thermal wave imaging andVickers microhardness measurements were used to determineif physical behavior variations correlated with pore fractionvariations that had been characterized metallographically andin ultrasonic images. A positive correlation would indicate theusefulness of the ultrasonic measurement as an aid for predict-ing physical behavior.
The authors wish to thank the Metallographic Support Stafffor their help in sample preparation and analysis, James R.Bodis for his help in obtaining ultrasonic C-scan and microfocusradiography images, and Maurice Bales of Bales Scientific,Inc., and Elliot Cramer of NASA Langley Research Center fortheir help in obtaining thermal wave images.
3.0 Background
3.1 Importance of Si3N4
The past 20 years have seen significant interest in ceramicmaterials for high-temperature structural applications, such asvehicular engines (refs. 17 and 18). Si3N4 is a candidatematerial for such applications because of its low density, highmelting point, high strength, and resistance to wear, thermalshock, and creep (refs. 17 and 18). Si3N4 has application as amonolithic material, a toughened monolithic material, and thematrix material in ceramic matrix composites (refs. 17 to 19).The Si3N4 used in this study can also be considered a modelmaterial for demonstrating the capabilities of the modifiedultrasonic contact scan technique.
3.2 Relationships Between Ultrasonic Properties andExperimental Variables
The significant material-behavior-related variables in thisstudy were ultrasonic frequency and pore fraction. A detaileddiscussion follows concerning expected relationships betweenthese variables and the ultrasonic reflection coefficient, at-tenuation coefficient, and velocity for Si3N4 when the contactpulse-echo experimental technique (refs. 20 and 21) is used. Inthis technique, an ultrasonic pulse generated by a piezoelectriccrystal is propagated into a buffer rod-couplant-sample con-figuration (figs. 1(a) and (b)). In this investigation, the bufferrod, the couplant, and the sample are fused silica (SiO2),diffusion pump fluid, and Si3N4, respectively. The ultrasoundreflects off the front and back surfaces of the sample and travelsback to the crystal. Figures in the immediate upcoming
sections show the expected frequency and pore fraction depen-dence of velocity, reflection coefficient, and attenuation coef-ficient for the following conditions: contact pulse-echoconfiguration, frequency range of 30 to 110 MHz, pore fraction
Figure 1.—Ultrasonic measurement method (FS = front-surface reflection; B1 = first back-surface reflection; B2 = second back-surface reflection).
Vo
ltag
e
Time(b) Resulting waveforms for pulse-echo contact technique.
FS B1 B2
(a) Diagram of buffer rod-couplant-sample pulse-echo contact configuration.
Back surface
Specimen
Frontsurface
Buffer rod
Piezo-electric crystal To pulser-receiver
Couplant (membrane or liquid)
X
AAAAAA
FS
B1
B2
(c) Schematic (top view) of ultrasonic contact scan procedure showing examples of successive transducer positions along X- and Y-dimensions of sample.
Sample top surface
Y
X

3
Figures 2(a) and (c) show the expected theoretical dependenceof the ultrasonic velocity in Si3N4 (VSi3N4
) on pore fraction andfrequency by using equation (2). The velocity VSi3N4
is expectedto linearly decrease with increasing pore fraction (from 1.12 cm/µsec at full density to about 1.06 cm/µsec for 0.1 pore fraction) for
.4
Figure 2.—Expected dependence of ultrasonic velocity in Si3N4 on pore fraction and frequency.
Vel
oci
ty, V
Si 3
N4, c
m/µ
sec
0 .3Pore fraction, P
.9
1.3
.7
1.1
.5.2.1
(c) Theoretical velocity versus frequency for various pore fractions (eq. (2)).
.100 .06Pore fraction, P
1.08
1.12
1.06
1.10
1.04.04.02 .08
(a) Theoretical velocity versus pore fraction for various frequencies (eq. (2)).
Frequency, f, 40, 60, 80, and 100 MHz
(b) Measured velocity versus pore fraction where VSi3N4 =
–0.014 x Percent porosity + 1.12 was previously observed empirically (0.98 correlation coefficient; ref. 14).
11030 70Frequency, f, MHz
1.08
1.12
1.06
1.10
50 90
Pore fraction,
P0.01
.03
.05
.07AAAAAAAAAAAAAAAAAAAAAAAAAAA
AAAAAAAAAAAAAAAAAAAAAAAAAAAAAAAAAAAAAAAAAAAAAAAAAAAAAAAAAAAAAAAAAAAAAAAAAAAAAAAAAAAAAAAAAAAAAAAAAAAAAAAAAAAAAAAAAAAAAAAAAAAAAAAAAAAAAAAAAAAAAAAAAAAAAAAAAAAAAAAAAAAAAAAAAAAAAAAAAAAAAAAAAAAAAAAAAAAAAAAAAAAAAAAAAAAAAAAAAAAAAAAAAAAAAAAAAAAAAAAAAAAAAAAAAAAAAAAAAAAAAAAAAAAAAAAAAAAAAAAAAAAAAAAAAAAAAAAAAAAAAAAAAAAAAAAA
range of 0 to 0.1, pore radius of 1 µm, and ultrasonic velocityin fully dense Si3N4 of 1.12 cm/µsec.
Velocity.—Brittle materials, such as monolithic ceramics,generally exhibit linear elastic behavior at room temperature(ref. 22), and therefore dispersion (velocity varying with fre-quency, ref. 23) and frequency-dependent attenuation are notexpected to be present to the extent that they would be forviscoelastic media, such as polymeric materials, where energyabsorption is the dominant attenuation mechanism (refs. 24and 25). However, the presence of defects in ceramics, such aspores, grain boundaries, and dislocations, can lead to frequency-dependent effects because ultrasonic energy is scattered fromsuch defects. For the case of multiple scattering where thescatterers are cavities, a low cavity concentration exists, andRayleigh scattering predominates, Sayers has shown the fol-lowing relationship for velocity (refs. 26 and 29):
V V P A B kao= + + ( )[ ]{ }1 0 5 12. ( )
where A and B are constants that depend on the ratio oflongitudinal to shear-wave velocity,ka = 2π af/V, P is porefraction, Vo is the velocity in a fully dense material containingno pores, V is the velocity in a material containing pores, a ispore radius, and f is frequency. For the Si3N4 in this study, VL/VS ≈ 1.8; thus A =21.1 and B =21.8 according to Sayers’analysis (ref. 26). Equation (1) thus becomes
V P
fa
Si N3 41 12 1 0 5
1 1 1 82
1 122
2
= +
×
. / sec .
. .. / sec
( )
cm
cm
µ
πµ
2 2
Figure 1.—Concluded.
(d) Schematic (three-dimensional view) showing volume of sample ultrasonically interrogated at each scan point for velocity and attenuation coefficient measurements.
Schematic of volume of sample ultrasonically interrogated at each scan point
Impinging ultrasonic pulse Thickness
DX
AAAAAAAAAAAAAAAAAAAAAAAAAAAAAAAAAAAAAAAAAAAAAAAAAAAAAAAAAAAAAAAAAAAAAAAAAAAAAAAAAAAAAAAAAAAAAAAAAAAAAAAAAAAAAAAAAAAAAAAAA

4
all frequencies and to show little dependence on frequencyover the specified frequency range. Figure 2(b) shows velocityversus pore fraction for Si3N4, where the relationshipVSi3N4
=20.014× Percent porosity+1.12 was previously ob-served empirically (0.98 correlation coefficient) in reference14.
Reflection coefficient.—The theoretical expression for thebuffer rod-couplant-sample (BCS) pressure reflection coeffi-cient is (ref. 28)
R
Z
Z
f X
Vj
Z
Z
Z
Z
f X
V
Z
Z
f X
Vj
Z
Z
Z
Z
f X
V
=
( )
+
( )
+
( )
+ +
( )
12 2
12 2
1
3 2
2
3
1
2 2
1
3 2
2
3
1
2
2 2cos sin
cos sin
π δ π δ
π δ π δ
22
3
( )
where f is the frequency of the ultrasonic transducer; V2 is thevelocity of sound in the couplant layer; Z1, Z2, and Z3 are theacoustic impedance of the buffer rod, couplant, and sample,respectively; and δX is the couplant thickness. The magnitudeof this complex expression is (ref. 15)
R
Z
Z
f X
V
Z
Z
Z
Z
f X
V
Z
Z
f X
V
Z
Z
Z
Z
=
+
+ + +
( )
( )
( )
12 2
12 2
1
3
22
2
2
3
1
2
22
2
1
3
22
2
2
3
1
2
22
2 2cos sin
cos sin
π δ π δ
π δ π ff X
V
δ( )
2
1
2
4( )
The acoustic impedance of the sample Z3 is given by (ref. 13)
Z V3 3 3 5= ρ ( )
where ρ3 and V3 are the sample density and velocity, respec-tively. As the number of scatterers at the material surfaceincreases, it is expected that ρ3 and V3 will be altered, changingZ3 and thus altering R. The manner in which R is expected tochange with material change depends on the compositionalnature of the scatterer (pore, second-phase inclusion, etc.). Forexample, if the scatterers are pores, Z3 is expected to decreasewith increasing volume fraction of pores as ρ3 and V3 areeffectively decreased according to (ref. 14)
Z P V P3 0 3 0 31 1 6= ( ) ( )ρ , , ( )2 2
where ρ0,3, V0,3, and P are the density of a sample with nopores, the velocity in a sample with no pores, and the porefraction in the sample, respectively. Substituting the right
side of equation (6) into equation (4) for Z3 and substitutingthe values δX = 1 µm, ZSiO2
= 1.31 g/cm-sec, Zcouplant =0.15 g/cm-sec, ρ0,Si3N4
= 3.3 g/cm3, and V0,Si3N4 = 1.12 g/cm3
in equation (4) allows the magnitude of the reflection coeffi-cient RSi3N4
for the buffer (SiO2) - couplant (Dow Corning704) - sample (Si3N4) configuration used in this study to beexpressed in terms of frequency and pore fraction. Figures 3(a)and (b) show the expected dependence of the theoreticalreflection coefficient RSi3N4
on pore fraction and frequencyfor the BCS configuration of this study (couplant thickness,1 µm). The reflection coefficient RSi3N4
is expected to linearlydecrease with increasing pore fraction for all frequencies andmore steeply at lower frequencies and to increase with in-creasing frequency for all pore fractions.
Changing the pore fraction may also affect the averagesurface roughness, which may then alter the average couplantthickness δX and change RSi3N4
. Figure 3(c) shows the fre-quency dependence of RSi3N4
for several different couplantthicknesses for frequencies from 30 to 110 MHz. For a givenfrequency, RSi3N4
increases with increasing couplant thick-ness. For a given couplant thickness, RSi3N4
increases withincreasing frequency except for larger couplant thicknessessuch as 5 µm, where RSi3N4
initially increases slightly withincreasing frequency and then begins to decrease slightly withincreasing frequency at about 75 MHz.
Attenuation coefficient.—A theory has been developed forattenuation due to grain scattering from equiaxed grains in asingle-phase, fully dense polycrystalline solid. This theorypredicts that attenuation is a function of average grain size D,sonic wavelength λ, and frequency f and that this functionalitydepends on the ratio of sonic wavelength to grain size. Table Ireviews the frequency dependence of the attenuation coeffi-cient and the scattering mechanisms for polycrystalline mate-rials (ref. 13). Most materials have a range of grain sizes andcontain additional scatterers besides grain boundaries, such aspores, second-phase inclusions, and dislocations, that affectthe attenuation coefficient.
The two-phase scattering theory developed by Truell for thecase where scattering from individual scatterers is indepen-dent relates the frequency and the size and number of sphericalscatterers to the attenuation coefficient α according to (refs. 27and 29)
α γ= 1
27no ( )
where no is the number of scatterers per unit volume and γ isthe scattering cross section, which is a function of frequencyand scatterer radius (refs. 27 and 29). The normalized scatter-ing cross section γN is defined as (refs. 27 and 29)
γ γπn
a= 2 8( )

5
TABLE I.—FREQUENCY DEPENDENCE OFATTENUATION COEFFICIENT ANDSCATTERING MECHANISMS FORPOLYCRYSTALLINE MATERIALS
[Experimental constants Ci are dependent ongrain, geometric and elastic anisotropy, density,
and longitudinal and shear-wave velocity factors.]
Wavelength/grain sizerelation
Independentλ>>Dλ~Dλ<<D
Attenuationmechanism
True absorptionRayleigh scatteringPhase scatteringDiffusion scattering
Attenuationcoefficient
αa=CafαR= CRD3f 4
αp= CpDf 2
αd= Cd/D
150
Figure 3.—Expected dependence of theoretical BCS reflection coefficient on pore fraction, frequency, and couplant thickness for buffer of SiO2, couplant of Dow Corning 704 oil, and Si3N4 sample.
The
ore
tical
ref
lect
ion
coef
ficie
nt, R
Si 3
N4
0 100Frequency, f, MHz
.8
1.0
.7
.9
50
(c) Reflection coefficient versus frequency for various couplant thicknesses (eq. (4)).
.100 .06Pore fraction, P
.88
1.00
.82
.94
.76.04.02 .08
(a) Reflection coefficient versus pore fraction for various frequencies. (Couplant thickness, 1 µm.)
Frequency, f,
MHz
(b) Reflection coefficient versus frequency for various pore fractions. (Couplant thickness, 1 µm.)
1500 60Frequency, f, MHz
.52
.76
.40
.64
30 90
2
.5
0.25
.88
1.00
120
5
Couplant thickness,
dx,µm
100
80
60
40
A
Porefraction,
P
0.07.05.03.01
AAAAAAAAAAAAAAAAAAAAAAAAAAAAAAAAAAAAAAAAAAAAAAAAAAAAAAAAAAAAAAAAAAAAAAAAAAAAAAAAAAAAAAAAAAAAAAAAAAAAAAAAAAAAAAAAAAAAAAAAAAAAAAAAAAAAAAAAAAAAAAAAAAAAAAAAAAAAAAAAAAAAAAAAAAAAAAAAAAAAAAAAAAAAAAAAAAAAAAAAAAAAAAAAAAAAAAAAAAAAAAAAAAAAAAAAAAAAAAAAAAAAAAAAAAAAAAAAAAAAAAAAAAAAAAAAAAAAAAAAAAAAAAAAAAAAAAAAAAAAAAAAAAAAAAAAAAAAAAAAAAAAAAAAAAAAAAAAAAAAAAAAAAAA
where a here is the scatterer radius. Reference 27 used the two-phase scattering theory to show that the attenuation coefficientdue to scattering from cavities and inclusions increases withincreasing frequency.
Reference 30 has calculated relative changes in the normal-ized scattering cross section due to scattering from pores inSi3N4 as a function of wavenumber times scatterer radius ka,as shown in figure 4(a). Since ka = (2πaf)/(VSi3N4
), whereVSi3N4
is the velocity of ultrasound in Si3N4, relative change inthe normalized scattering cross section is a function of fre-quency for a given pore radius and VSi3N4
. Thus, it is possibleto estimate changes in the Si3N4 attenuation coefficient as afunction of pore concentration (number of pores per cubiccentimeter) and changes in frequency by using the followingmethodology and figure 4(a):
(1) Assume a constant VSi3N4 of 1.08 cm/µsec and an average
pore radius a of 1 µm (or 0.0001 cm). Then, the x axis infigure 4(a) becomes (5.831024 sec) f, where f is in megahertz.
(2) Select a frequency range over which it is desired todetermine attenuation coefficient changes (e.g., 30 to 110 MHz).
(3) From the curve shown in figure 4(a), relative changes innormalized scattering cross section can be determined forchanges (increases) in frequency, and a relationship can bederived between ∆γN and ∆f. A relationship was derived byusing nonlinear regression analysis with a power functionmodel ∆ ∆γ N
bb f b= ( ) +1 32 , forcing the b2 exponent to be 0.5
(the curve shape in fig. 4(a) approximates γ N=(ka)0.5). For anf of 40 to 110 MHz (corresponding to a ∆f of 10 to 80 MHzfrom a reference frequency of 30 MHz),
∆ ∆γ N f
Si N3 40 3396 0 6352 90 5= ( ). . ( ). 2
where ∆γN is in nepers (1 neper = 8.686 dB) and ∆f is inmegahertz. This relationship, shown in figure 4(b), has acoefficient of determination of 0.9996 and a final sum ofsquares residuals of 0.0013.

6
Figure 4.—Expected changes in normalized scattering cross section and attenuation coefficient for Si3N4.
(c) Expected dependence of changes in aSi3N4 (DaSi3N4
) due to
.120 .6ka
–40
0
–60
–20
–80.4.2 .8
(a) Relative changes in normalized scattering cross section due to scattering from pores in Si3N4
as a function of wavenumber times scatterer radius ka. From reference 30.
Region of curve corresponding to f = 30 to 110 MHz for a = 1 µm and VSi3N4
= 1.08 cm/µsec
8040Change in frequency from 30 MHz, Df, MHz
10
30
0
20
20 60
Pore concentration
107/cm3
40
40 50 60 70 80 90 100 110Actual frequency, f, MHz
108/cm3
109/cm3
Cha
nge
in a
tten
uatio
n co
effic
ient
, D
aS
i 3N
4, nep
ers/
cm
.10
No
rmal
ized
sca
tter
ing
cr
oss
sec
tion,
g/p
a2 ,
dB
Cha
nge
in n
orm
aliz
ed s
catt
erin
g
cro
ss s
ectio
n, D
gN
= D
g/p
a2, n
eper
s
8040Change in frequency from 30 MHz, Df, MHz
1.2
2.0
.4
1.6
20 60
2.4
40 50 60 70 80 90 100 110Actual frequency, f, MHz
703010 50
.8
(b) Expected changes in normalized scattering cross section as function of change in frequency from 30 MHz (corresponding to frequency of 40 to 110 MHz for pore radius of 1 µm and velocity in Si3N4( ) of 1.08 cm/µsec (derived from fig. 4(a)).VSi3N4
703010 50
scattering from pores on positive changes in frequency from 30 MHz for several pore concentrations (eq. (12)).
AAAAAAAAAAAAAAAAAAAAAAAAAAAAAAAAAAAAAAAAAAAAAAAAAAAAAAAAAAAAAAAAAAAAAAAAAAAAAAAAAAAAAAAAAAAAAAAAAAAAAAAAAAAAAAAAAAAAAAAAAAAAAAAAAAAAAAAAAAAAAAAAAAAAAAAAAAAAAAAAAAAAAAAAAAAAAAAAAAAAAAAAAAAAAAAAAAAAAAAAAAAAAAAAAAAAAAAAAAAAAAAAAAAAAAAAAAAAAAAAAAAAAAAAAAAAAAAAAAAAAAAAAAAAAAAAAAAAAAAAAAAAAAAAAAAAAAAAAAAAAAAAAAAAAAAAAAAAAAAAAAAAAAAAAAAAAAAAAAAAAAAAAAAAAAAAAAAAAAAA
From equation (7), for constant no, changes in attenuationcoefficient as a function of changes in scattering cross section canbe expressed as
∆ ∆α γ= 1
210no ( )
Rearranging equation (8) and substituting for γ in equation (10)gives
∆ ∆α π γ= 10
211
8 22 cmno N ( )
Substituting the right side of equation (9) into equation (11)gives
∆ ∆α πSI Ncm
3 4
10
20 3396 0 6352 12
8 20 5=
( )[ ]
2
2n fo . . ( ).
where ∆αSi3N4 is in nepers per centimeter and ∆f is in mega-
hertz. This relationship ignores the scattering conditions andfrequency relationships shown in table I and just takes intoaccount the shape of the curve in figure 4(b). From the ratio ofthe sonic wavelength (~200 µm) to the average scatterer (grainand pore) size (~1 µm) observed for the Si3N4 used in this study,one would predict Rayleigh scattering (α proportional to f 4).Figure 4(c) shows the expected dependence of changes inαSi3N4
(∆αSi3N4) on positive changes in frequency ∆f from 30
MHz, assuming that pore scattering is the sole cause of attenu-ation for several different values of pore concentration (numberof pores per cubic centimeter) no. The αSi3N4
is expected toincrease with increasing frequency for any pore concentration,but the change only becomes significant for no ≥ 108 pores/cm3.
For nonindependent scattering (i.e., multiple scattering con-ditions where the scatterers become sufficiently dense andclosely spaced and where the wavelength becomes comparableto the scatterer size), equation (7) cannot be used to predict theattenuation coefficient (ref. 29).
3.3 Ultrasonic Measurements
Velocity.—Velocity can be determined in several ways byusing the pulse-echo configuration. In this study, cross-correlation and phase methods were used by applying fre-quency-domain signal processing techniques. In thecross-correlation method, the time delay τo between the back-surface-reflected pulses B1(t) and B2(t) (figs. 1(a) and (b)) wasobtained by cross-correlating the pulses with digital signalprocessing (ref. 21), and the velocity V was obtained from τoand the sample thickness X according to (ref. 21)

7
VX
o= 2 13
τ( )
Velocity determined from cross-correlation is essentially apulse velocity because the entire wave train (containing abroad band of frequencies) is considered in the calculation.Cross-correlation is a preferred method for determining veloc-ity, since it produces accurate velocities even with noisysignals (ref. 21). If pulse smearing occurs owing to dispersion-and/or frequency-dependent attenuation, phase methods(ref. 31) where the velocity is determined for a particularfrequency may yield more accurate results. The frequency-dependent phase velocity is given by (ref. 13)
V f
2X f( ) = ( ) =2141 2
πθ
θ θ θ∆
∆, ( )2
where
θ11 1
115f
B f
B f( ) =
( )[ ]( )[ ]
tan
Im
Re( )2
θ21 2 16f
B f
B f2( ) =
( )[ ]( )[ ]
tan
Im
Re( )2
where f is frequency and B1( f ) and B2( f ) are the Fouriertransformations of the time-domain pulses B1(t) and B2(t),respectively.
Attenuation coefficient.—The frequency-dependent attenu-ation coefficient for the pulse-echo configuration is given by(refs. 6 and 13)
α fX
B f R f
B f( ) =
( ) ( )( )
1
2171
2ln ( )
where R( f ) is the frequency-dependent reflection coefficient
R fFS f
FS f( ) =
( )( )
2
118( )
f is frequency, FS1( f ) and FS2( f ) are the Fourier magni-tude spectra of the time-domain pulses FS1(t) and FS2(t)without and with the sample present on the buffer rod, respec-tively, and B1( f ) and B2( f ) are the Fourier magnitudespectra of the time-domain pulses B1(t) and B2(t), respectively.
The errors associated with velocity, reflection coefficient,and attenuation coefficient measurements obtained by usingthe contact pulse-echo method are discussed in appendix A.
4.0 Experiment
4.1 Si3N4 Samples
In this investigation, seven β-Si3N4 disk-shaped samples(labeled SN1 to SN7) approximately 3.5 cm in diameter and0.3 cm thick were manufactured. Details of the fabricationprocess are given in appendix B. The Si3N4 disks were3.24± 0.03 g/cm3 (> 98 percent theoretical density) as deter-mined from immersion density measurements. From quantita-tive image analysis at 4003 and 8003, pore dimensions werefound to range from ≤1 µm (~90 percent of the pores) to aslarge as 10µm with an average of approximately 1 µm. Graindimensions for representative plasma-etched (ref. 32) sectionsof samples ranged from approximately 0.5 to 10 µm, with anaverage grain dimension of approximately 1µm from scanningelectron microscopy (SEM) analysis at 20003 to 10 0003.
At the locations where disk separators (setters) had touchedthe disks during sintering, visibly lighter colored regions(relative to the surrounding regions on the disks) were noted.In some cases, three such regions were apparent on each sideof the disk (fig. 5). For one of the disks, no such regions werevisible. It was deter-mined that these lighter areas contained asignificantly higher volume fraction of pores than did thesurrounding regions (fig. 6). Also, the central sections of thedisks were generally more porous than the edge regions.Figures 7(a) and (b) show the percent of porosity on the surfaceand the average percent of porosity for lines through a section
Figure 5.—Disk SN6 showing three visibly lighter colored regions (relative to surrounding regions). The other side of this disk showed the same pattern but offset 60°.
1 cm
8
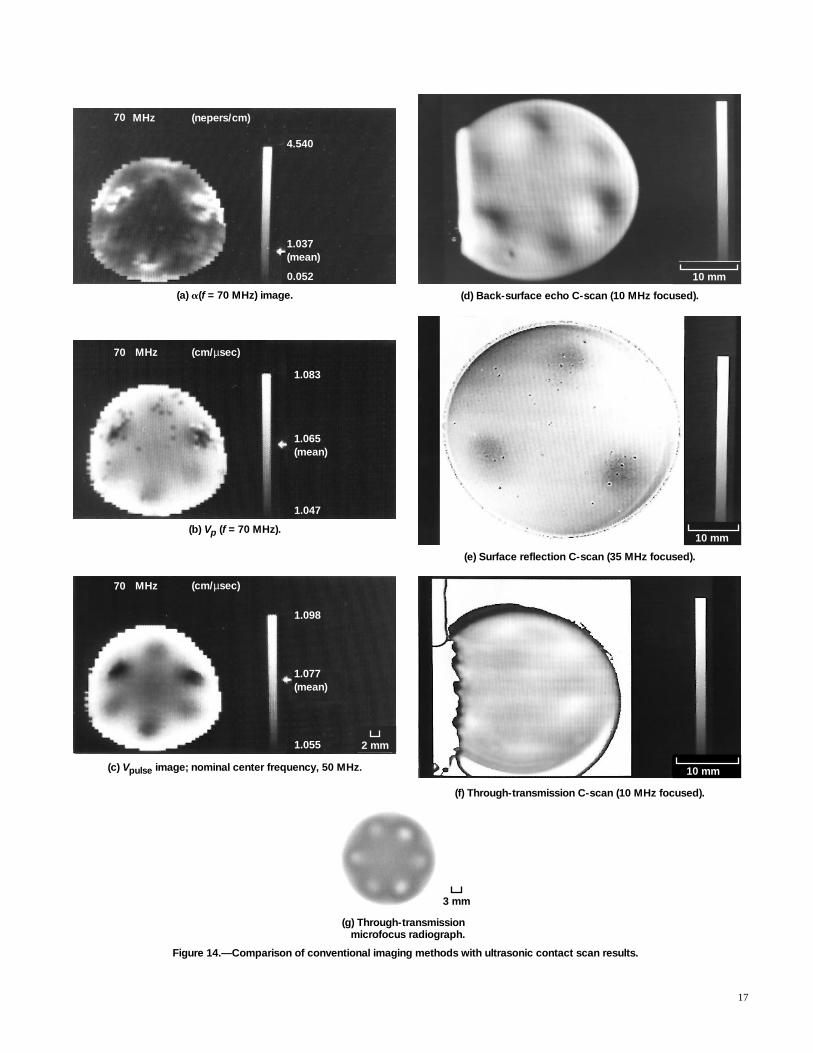
thickness, respectively, from quantitative image analysis at8003 of disk SN2 for various locations. Figures 8(a) and (b)show representative profiles of percent of porosity versusdepth through the thickness for the lighter colored and darkercolored surrounding regions, respectively.
Energy-dispersive and wavelength-dispersive x-ray scansshowed no chemical (silicon, nitrogen, oxygen, yttrium, orboron) differences between the high-pore-fraction region andthe surrounding regions. SEM analysis revealed no obviousgrain size distribution differences between the high-pore frac-tion region and the surrounding regions. For one sample areaexamined in disk SN2, an yttria-rich glass phase was identifiedat grain boundaries that was approximtely 30 percent lessprevalent in the high-pore-fraction region (~0.09 volume
fraction glass-rich phase) than in the surrounding region (~0.12volume fraction glass-rich phase). For the same area, an approx-imately 53 difference in pore fraction was noted between thehigh-pore-fraction region (~0.05 pore fraction) and the surround-ing region (~0.01 pore fraction). In some cases, a glass-likematerial was observed at the bottom of and lining the pores.This material was not identified by using x-ray diffraction andenergy-dispersive spectroscopy. A trace amount of an ironsilicide phase was also identified at the grain boundaries. Figure 9shows typical surface profiles for machined and polished surfacesof the Si3N4 disks. Machined disk surfaces were characterized byless than 1-µm peak-to-peak roughness. No differences in sur-face condition were observed between polished regions at adisk center and at a high-pore-fraction area.
Figure 7.—Pore fraction profiles from quantitative image analysis at 800x of disk SN2 for various locations.
Ave
rag
e p
oro
sity
thr
oug
h se
ctio
n th
ickn
ess,
per
cent
(b) Average through-thickness pore fraction at selected positions of disk SN2.
400 20Position, mm
1
3
2
10 30
Rightedge
4
*
*
*
*
*
Lighter region
Center
Lighter region
Leftedge
Po
rosi
ty a
t d
isk
surf
ace,
per
cent
(a) Pore fraction on disk surface.0
1
3
2
Rightedge
4
5
*
*
*
*
*
Lighter region
Center
Lighter region
Leftedge
Figure 6.—Photomicrographs of disk SN2.
100 mm
(a) Lighter colored, more porous region.
(b) Surrounding darker colored, less porous region.
(b)
(a)

9
Figure 9.—Typical surface profiles for surfaces of Si3N4 disks.
Sur
face
ro
ughn
ess,
Å
(c) Polished, at lighter colored, more porous region.
10000 400Distance, µm
0
–20x103
200 800600
(b) Polished, in center.
0
–20x103
(a) Machined.
0
–20x103
4.2 Ultrasonic Contact Scanning
Ultrasonic measurements using the pulse-echo contact tech-nique were obtained over an ordered array of points across theentire surface of each Si3N4 sample disk by means of anautomated scanning technique (fig. 1). A single transducer incombination with spectral analysis allowed complete materialcharacterization over a wide band of frequencies. This methodresults in considerable time savings over scanning using dis-crete frequency techniques. The scan technique was hardwareand software modified from that of previous approaches (refs. 9,10, and 16) to allow the scanning of entire samples withoutprobe damage due to movement over sample edges (ref. 16),the use of transducer probes having buffer rod faces as small as
0.25 in. (0.6 cm) in diameter, and the use of membrane (dry)coupled (allowing shear-wave scans) as well as liquid (wet)coupled measurements.
The sample disks were mounted in a Lucite holder inpreparation for scanning. Each scan consisted of a 47- by 41-grid of measurements with each measurement separated fromthe next by 1 mm. Scans were run twice in most cases to verifyreproducibility. Scanning was accomplished through the useof computer-controlled x-, y-, and z-micropositioner tablesthat were used (1) to position the sample and holder under thetransducer probe, (2) to raise the sample and holder so that theprobe was in contact with the sample (the contact force on theprobe for each measurement in a scan was 12± 0.1 lb forwet-coupled scans and 20± 0.1 lb for dry-coupled scans; thecouplant layer thus should be approximately uniform for allmeasurements in the scan), (3) to bring the sample away fromthe probe after the measurement was made, and (4) to reposi-tion the sample in the x- or y-direction (1-mm increment) forthe next measurement. Echo waveforms from the sample frontand back surfaces were digitized (512-point horizontal and512-point vertical resolution), averaged over 64 waveforms,and stored. Each waveform was digitized at the voltage gainsetting that allowed use of the full vertical resolution capabilityof the digitizer.
Digitized waveforms were Fourier transformed and subse-quently processed to yield ultrasonic properties. Beam-spreading diffraction corrections were made to the amplitudespectra of each echo according to the method of Papadakis(ref. 33). (The effect of diffraction on the phase of the ultra-sonic waveforms is small, and no corrections to phase weremade (ref. 24). Ultrasonic images were constructed over awide band of frequencies (e.g., 30 to 110 MHz, at 10-MHzintervals) from reflection coefficent, attenuation coefficient,and phase velocity values obtained at each scan point. Onecross-correlation velocity image for each scan was also
4
2
0
8
6
(a) Lighter colored, more porous region.
4
2
0 .5 1.0 1.5 2.0 2.5Distance from top surface, mm
(b) Darker colored, less porous surrounding region.
Po
rosi
ty, p
erce
nt
Darker region Lighter region
1 mm
Figure 8.—Pore fraction profiles from quantitative image analysis at 800x of pore fraction versus depth through thickness for disk SN2

10
constructed. The velocity and attenuation coefficient imagescan be thought of as two-dimensional projections representingaveraged microstructural information for the volume of samplescanned (fig. 1(d)). A computer program was written to allowcontinuous image formation at discrete frequencies and subse-quent storage on an optical disk. A continuous scale consistingof 256 shades of gray (or color) and linear interpolationbetween points allowed the display of spatial variations inthese ultrasonic properties. A data clipping or filtering schemewas performed to remove faulty property values resulting fromincorrect digitization and edge effects. Failure to apply thefiltering resulted in misleading images and poor contrastbetween non-uniformities and surrounding regions in the disk.
Transducers used were broadband 10-MHz longitudinalwave, 5-MHz shear wave, 50-MHz longitudinal wave, and125-MHz longitudinal wave with the megahertz value denot-ing the nominal center frequency. The 10-MHz longitudinaland 5-MHz shear- wave transducers consisted of a criticallydamped lead metaniobate crystal with an active diameter of0.6 cm bonded to a polystyrene buffer rod 0.6 cm in diameterand 0.8 cm in length. A thin (0.04 cm) pliable polymer materialattached to the buffer rod allowed ultrasound to be transmittedinto the sample without the need for liquid coupling (Ultran,Boalsburg, PA). The 50- and 125-MHz longitudinal wavetransducers consisted of a lead metaniobate crystal with anactive diameter of 0.3 cm bonded to a silica glass buffer rod0.6 cm in diameter and 0.8 cm in length (Panametrics, Waltham,MA). Liquid couplant (diffusion pump fluid, 704 type, DowCorning, Midland, MI) was necessary between the transducerprobe and the sample to allow ultrasonic transmission. Con-tamination from the couplant was assumed to be minimalbecause of the high average density (>98 percent) of thesamples. Pulser receivers of 0.01 to 10 MHz and 1- to 150-MHzbandwidth were used with the 5- and 10-MHz and 50- and125-MHz transducers, respectively. Signal-to-noise ratios werehigh (~250) for the wet-coupled configuration and moderate tolow (~10 to 50) for the dry-coupled configuration.
4.3 Further Characterization
Ultrasonic immersion C-scans.—Immersion (water)C-scans were obtained by using 10- and 35-MHz focusedtransducers to qualitatively examine the uniformity of theSi3N4 disk samples and to compare them with contact scanimages of the samples. Data were acquired every 100 µm inboth the x- and y-directions. Transmission amplitude imageswere obtained by gating front and back surface reflections, andtransmitted pulses were obtained by using pulse-echo andthrough-transmission techniques, respectively. Scans wererun with the polished faces facing the sending transducer. Theimages show the amplitude of ultrasonic transmission in termsof gray scale with lighter gray scale corresponding to higherultrasonic transmission. Images were contrast expanded foroptimum viewing of nonuniformity.
X-ray radiography.–Microfocus radiography was used toqualitatively examine the uniformity of the disk samples and tocompare them with contact scan images of the samples. Radio-graphs were made through the thickness of the disks withconventional contact methods under conditions optimized toyield high accuracy and contrast. The source-to-disk distancewas approximately 18 in., and the exposure conditions were 35kV, 10 mA, and 4 min. The print images show x-ray attenua-tion in terms of gray scale, with lighter gray scale correspond-ing to lower attenuation (greater porosity).
Thermal wave imaging.–Thermal wave imaging was usedto determine if thermal behavior variations correlated withpore fraction variations that had been characterized metallo-graphically and in ultrasonic images of disk SN6. The polishedsurface of disk SN6 was coated with a high-emissivity materialto allow maximum absorption of thermal radiation into thesample. Four flashlamps were located at 45° angles to, and18 in. away from, the polished surface. The lamps were usedto externally heat SN6. Each flashlamp’s power was 1.5 kJ. Ahigh-resolution infrared camera was located in front of the diskon the same side as the flash lamps, and data were obtained ata rate of 20 frames per second. The images show thermalenergy density (temperature) in terms of gray scale, withlighter gray scale corresponding to higher thermal energydensity (temperature).
Microhardness measurements.–Vickers microhardnessmeasurements were used to determine if hardness variationscorrelated with pore fraction variations that had been charac-terized metallographically and in ultrasonic images of diskSN3. Microhardness measurements were performed at theregions of high pore fraction and at surrounding regions ofaverage pore fraction in a polished cross section of SN3.Measurements were made at a 500-g load for 15-sec duration.Twenty measurements were made at the high-pore-fractionand surrounding regions. The error in the microhardnessmeasurement was estimated at 10percent from repeated trials.
5.0 Results and Discussion
The following sections show representative images from thecontact-scanned Si3N4 disks. Reflection coefficient, attenua-tion coefficient, phase velocity, and cross-correlation velocityimages obtained from contact scanning are designated as R( f ),α( f ), Vp( f ), and Vpulse images, respectively.
5.1 Ultrasonic Contact Scan Images and PropertiesVersus Frequency
Figures 10 to 13 show R( f ), α( f ), Vp( f ), and Vpulse imagesand mean values at 30 to 110 MHz in 10-MHz increments fordisk SN2 containing six distinct regions of high pore fraction.(Nominal center frequency was 50 MHz for the transducer

11
Figure 10.—Frequency-dependent reflection coefficient images and mean values at 30 to 110 MHz in increments of 10 MHz for disk SN2 containing six distinct regions of high pore fraction. (Nominal center frequency was 50 MHz for the transducer used to scan SN2.)
(c)
0.601
0.720(mean)
0.939
MHz50
(b)
0.603
0.685(mean)
0.920
MHz40
(a)
0.601
0.649(mean)
0.895
MHz30
(f)
0.670 2 mm
0.813(mean)
0.983
MHz80
(e)
0.652
0.791(mean)
0.981
MHz70
(d)
0.621
0.753(mean)
0.952
MHz60

12
Figure 10.—Concluded.
(h)
0.766
0.819(mean)
0.972
MHz100
(g)
0.711
0.829(mean)
0.973
MHz90
2 mm
(i)
0.675
0.782(mean)
0.967
MHz110
(j) Mean reflection coefficient versus frequency.
.84
.80
.76
.72
.68
.64
Mea
n re
flect
ion
coef
ficie
nt, R
(f)
30 40 50 60 70 80 90 100 110Frequency, f, MHz

13
(b)
0.052
0.274(mean)
0.052
2.881
0.548(mean)
2.525
MHz40
(a)
0.050
0.169(mean)
2.525
MHz (nepers/cm)
(nepers/cm)
(c) (nepers/cm)
30
Figure 11.—Frequency-dependent attenuation coefficient images and mean values at 30 to 110 MHz in increments of 10 MHz for disk SN2 containing six distinct regions of high pore fraction. (Nominal center frequency was 50 MHz for the transducer used to scan SN2.)
(e)
0.050
0.942(mean)
0.050
3.958
1.035(mean)
3.922
MHz70
MHz50 MHz80
(d)
0.053
0.799(mean)
3.818
MHz (nepers/cm)
(nepers/cm)
(f) (nepers/cm)
60
2 mm
2 mm

14
(h)
0.055
1.175(mean)
3.721
MHz100
(g)
0.051
1.157(mean)
4.018
MHz (nepers/cm)
(nepers/cm)
(nepers/cm)90 (i)
0.051
1.184(mean)
3.803
MHz110
2 mm
2 mm
Cha
nge
in m
ean
atte
nuat
ion
coef
ficie
nt,
Da
Si
N ,
nep
ers/
cm3
4
1.1
.7
.5
Change in frequency from 30 MHz, Df, MHz
.3
.1
.9
40 50 60 70 80 90 100 110Actual frequency, f, MHz
10 20 30 40 50 60 70 80
(k) Observed changes in mean aSi N versus changes in frequency from 30 MHz.3 4
Figure 11.—Concluded.

15
(b)
1.070
1.078(mean)
1.068
1.091
1.078(mean)
1.094
MHz40
(a)
1.068
1.079(mean)
1.099
MHz (cm/µsec)
(cm/µsec)
(c) (cm/µsec)
30
Figure 12.—Frequency-dependent phase velocity images and mean values at 30 to 110 MHz in increments of 10 MHz for disk SN2 containing six distinct regions of high pore fraction. (Nominal center frequency was 50 MHz for the transducer used to scan SN2).
(e)
1.067
1.077(mean)
1.065
1.087
1.076(mean)
1.088
MHz70
MHz50 MHz80
(d)
1.067
1.077(mean)
1.090
MHz (cm/µsec)
(cm/µsec)
(f) (cm/µsec)
60
2 mm
2 mm

16
used to scan SN2.) At most frequencies, α( f ), Vp( f ), and Vpulseimages clearly revealed all six regions of high pore fraction.Additionally, Vpulse and Vp( f ) images revealed pore fractionvariation between the disk central section and edge regions. Allimage types were more “focused” toward the middle of thefrequency band (50 to 80 MHz) and less focused at the fre-quency band extremes (≤50 MHz and ≥80 MHz). (The latterstatement is not applicable to Vpulse images, which are formedusing the whole pulse containing the broad band of frequencies.)
This result is consistent with the fact that as the frequencyapproaches (from the peak frequency) the 26-dB frequencies(50 percent bandwidth) of the front-surface, pulse-echo mag-nitude spectrum (~40 and 90 MHz), the signal-to-noise ratiobecomes low enough to make the results of questionablevalidity and is responsible for the erratic behavior of theultrasonic properties at the frequency extremes (e.g., thedecrease in mean RSi3N4
above 90 MHz). Between 50 and80 MHz, the spatial patterns of the images did not changesignificantly. The R( f ) images did not reveal the six distinctregions at any frequency. Mean values for R( f ) showed anapproximately linear increase with increasing frequency (from30 to 90 MHz) and ranged from 0.65 to 0.83 (fig. 10(j)). Meanvalues for α( f ) increased with increasing frequency andranged from about 0.2 to 1.2 nepers/cm (fig. 11(j)). Figure 11(k)shows changes in mean αSi3N4
(∆αSi3N4) versus changes in
frequency ∆f from 30 MHz as a means for comparison withfigure 4 and will be discussed in section 5.8. Mean values forVp( f ) decreased slightly (0.3 percent) with increasing fre-quency (fig. 12(j)) indicating this Si3N4 to be slightly dispersive.
5.2. Comparison of Contact Scan Results With ThoseFrom Other Techniques
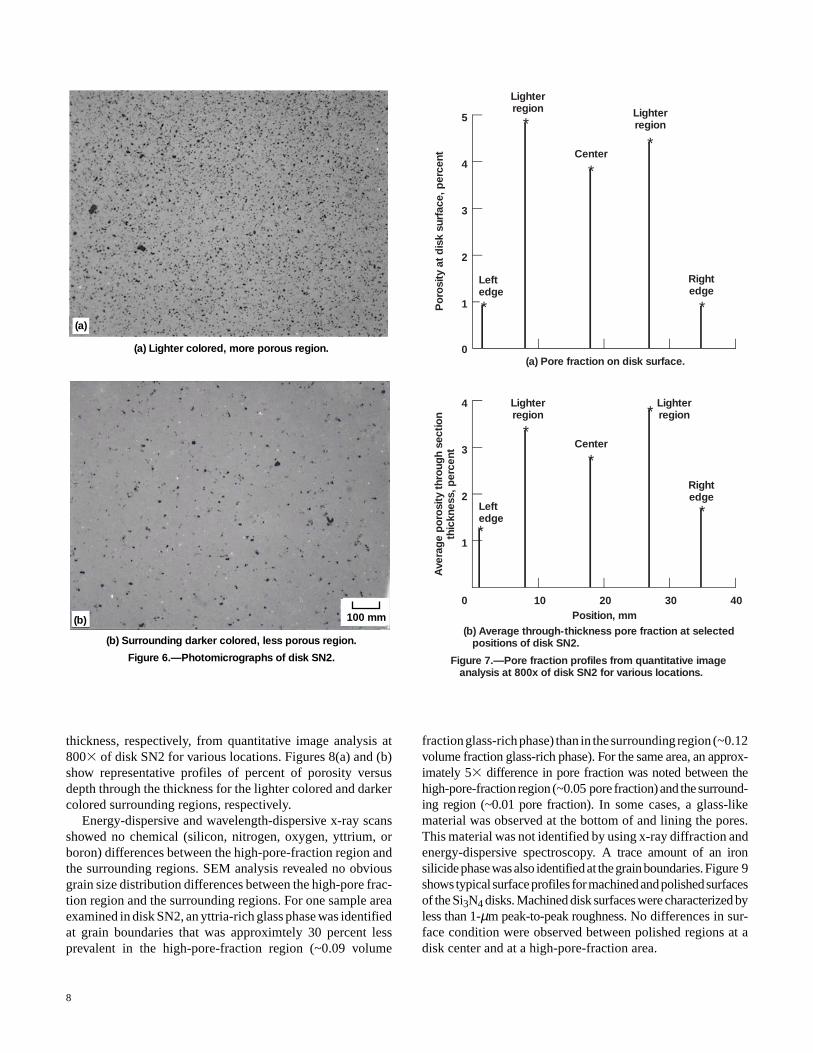
Figure 14 compares imaging results from ultrasonic C-scansand microfocus radiography of disk SN6 with α(f = 70 MHz),
Figure 12.—Concluded.
(j) Mean phase velocity versus frequency.
1.080
1.078
1.076
1.07430 40 50 60 70 80 90 100 110
Frequency, f, MHz
Mea
n p
hase
velo
city
, Vp(f
)cm
/µse
c
(h)
1.063
1.076(mean)
1.086
MHz100
(g)
1.063
1.076(mean)
1.087
MHz90
2 mm
(i)
1.061
1.076(mean)
1.088
MHz
(cm/µsec)
(cm/µsec) (cm/µsec)110
2 mm
1.062
1.096
1.078(mean)
50 MHz (cm/µsec)
2 mm
Figure 13.—Cross-correlation pulse velocity image for disk SN2 containing six distinct regions of high pore fraction. (Nominal center frequency was 50 MHz for the transducer used to scan SN2.)
17
(b)
(a)
(c)
(d)
(e)
(f)
1.047
1.065(mean)
1.055
1.098
1.077(mean)
1.083
MHz70
MHz70
0.052
1.037(mean)
4.540
MHz (nepers/cm)
(cm/µsec)
(cm/µsec)
70
2 mm
10 mm
10 mm
10 mm
3 mm
(a) a(f = 70 MHz) image. (d) Back-surface echo C-scan (10 MHz focused).
(b) Vp (f = 70 MHz).
(e) Surface reflection C-scan (35 MHz focused).
(c) Vpulse image; nominal center frequency, 50 MHz.
(f) Through-transmission C-scan (10 MHz focused).
(g) Through-transmission microfocus radiograph.
Figure 14.—Comparison of conventional imaging methods with ultrasonic contact scan results.

18
Vp(f = 70 MHz), and Vpulse images. First, consider the conven-tional NDE imaging methods. C-scan back-surface echoreflection images at 10 MHz (fig. 14(d)) revealed all sixdistinct regions as dark (low ultrasonic transmission) areas.C-scan through-transmission images at 10 MHz (fig. 14(f)) didnot reveal the regions. C-scan surface-wave images at 35 MHz(fig.14(e)) clearly revealed the three front-surface-connectedregions of high pore fraction as dark (low ultrasonic trans-mission) areas. Microfocus x-radiography (fig. 14(g)) clearlyshowed all six distinct regions. Additionally, dark rings appearedto surround and highlight the porous regions in the microfocusx-ray image. Neither C-scan nor microfocus x-ray imagesdiscriminated the more porous central section from the highlydense edge region.
Consider the images obtained from contact scans. The Vpulseimages (fig. 14(c)) quantified variation from edge to centerincluding the variation between the distinct regions of highpore fraction and the surrounding central region (~1-percentvelocity difference), the variation between the distinct regionsof high pore fraction and the dense edge region (~4-percentdifference), and the variation between the more porous centralsection and the dense edge region (~3-percent difference).(The percentage change was obtained by dividing the velocityvalues by the velocity expected for a fully dense Si3N4 sample(i.e., the theoretical velocity of 1.12 cm/µsec) (ref. 14)). Themagnitude and direction of these variations in the Vpulse imageare similar to those seen for volumetric pore fraction varia-tions in disk SN2 (fig. 7(b)). The Vp( f ) images quantifiedvariation over a broad band of frequencies in a similar mannerto that observed in the cross-correlation velocity images.However, in some instances, Vp( f ) images showed more“scatter” (fig. 14(b)) (note darker-colored dots randomlylocated), and the variation was not quite as obvious as it was inthe Vpulse images. The scatter could not be filtered withoutlosing essential image features. The magnitude of velocityvariation was usually similar in Vpulse and Vp( f ) images;however, minimum, maximum, and mean values varied slightlydepending on the frequency of the Vp( f ) images and wereslightly different from those observed for Vpulse images (e.g.,mean Vp(f = 70 MHz) for SN6 was 1.065 cm/µsec as comparedwith a mean Vpulse of 1.077 cm/µsec).
In the α( f ) images obtained over a broad band of frequen-cies, larger attenuation coefficients were observed at the edgesof the distinct regions of high pore fraction than in the sur-rounding regions (e.g., at 70 MHz for SN6 an attenuationcoefficient of ~4.5 nepers/cm was observed at the edges of thedistinct regions whereas the mean attenuation coefficient was1.04 nepers/cm). The central section appeared to have auniformly lower attenuation coefficient at 70 MHz than thesurrounding edge area (~0.1 neper/cm as compared with 0.4 to1.0 neper/cm).
The R( f ) images did not discriminate the high-pore-fractionregions from the surrounding regions in disk SN6.
5.3 Comparison of Si3N4 Disks
Figures 15 to 19 show α(f = 60 MHz and f = 80 MHz),Vp(f = 60 MHz and f = 80 MHz), and Vpulse images of the SN2,SN3, and SN5 disks. Disk SN2 contained six distinct regionsof high pore fraction, disk SN3 contained one such distinctregion, and disk SN5 contained no such regions; the α( f ),Vp( f ), and Vpulse images clearly represent the differences inthe disks. The more such distinct regions, the higher the mean
(b)
(a)
(c)
0.050
0.586(mean)
0.110
2.638
0.435(mean)
3.267
MHz60
MHz60
0.053
0.799(mean)
3.818
MHz (nepers/cm)
(nepers/cm)
(nepers/cm)
60
2 mm
(a) SN2.
(b) SN3.
(c) SN5.
Figure 15.—a (f = 60 MHz) images of SN2, SN3, and SN5.

19
(b)
(a)
(c)
0.050
0.800(mean)
0.050
3.551
0.433(mean)
4.569
MHz80
MHz80
0.050
1.035(mean)
3.958
MHz (nepers/cm)
(nepers/cm)
(nepers/cm)
80
2 mm
(a) SN2.
(b) SN3.
(c) SN5.
1.080
1.090(mean)
1.080
1.099
1.094(mean)
1.099
MHz60
MHz60
1.067
1.077(mean)
1.090
MHz (cm/µsec)
(cm/µsec)
(cm/µsec)
60
2 mm
(a) SN2.
(b) SN3.
(c) SN5.
Figure 16.—a (f = 80 MHz) images of SN2, SN3, and SN5. Figure 17.—Vp (f = 60 MHz) images of SN2, SN3, and SN5.

20
(b)
(a)
(c)
1.079
1.089(mean)
1.080
1.099
1.093(mean)
1.099
MHz80
MHz80
1.065
1.076(mean)
1.087
MHz (cm/µsec)
(cm/µsec)
(cm/µsec)
80
2 mm
(a) SN2.
(b) SN3.
(c) SN5.
1.058
1.080(mean)
1.075
1.099
1.089(mean)
1.100
1.078(mean)
1.096
MHz (cm/µsec)
(cm/µsec)
(cm/µsec)
60
1.078(mean)
1.096(cm/µsec)
2 mm
(b) SN3 (norminal center frequency, 125 MHz).
(c) SN5 (norminal center frequency, 125 MHz).
Figure 18.—Vp (f = 80 MHz) images of SN2, SN3, and SN5.Figure 19.—Vpulse images of SN2, SN3, and SN5.
1.062
(a) SN2 (norminal center frequency, 50 MHz).

21
5.4 Correlation of Ultrasonic Properties With EachOther and With Microstructure
Figures 20(a) to (c) show ultrasonic properties versus posi-tion for a section intercepting two of the high-pore-fractionregions in the SN2 disk. From first glance at α (f = 60 MHz),Vp(f = 60 MHz), and Vpulse images of SN2 (figs. 15(a), 17(a),and 19(a), respectively), it appears that variations in velocityand attenuation coefficient correspond with each other andwith the pore fraction profile shown in figure7(b). In reality,disk positions where changes in velocity with position dV/dP
Figure 20.—Ultrasonic velocity versus position for section inter- cepting two high-pore-fraction regions in SN2 disk.
(d) Reflection coefficient.
400 20
Position, mm
.74
.80
.72
.76
10 30
.78
Ref
lect
ion
coef
ficie
nt a
t 60
MH
z
1.0
2.5
0
1.5
2.0
Att
enua
tion
coef
ficie
nt a
t 60
MH
z,
nep
ers/
cm
d(v
elo
city
)/d
(po
sitio
n)
–.005
.010
–.010
0
.005
1.075
1.070
1.080
1.085
Pha
se v
elo
city
at
60 M
Hz,
cm
/µse
c
1.065
1.080
1.060
1.070
1.075
Pul
se v
elo
city
, cm
/µse
c
(c) Attenuation coefficient and velocity gradient.
(b) Phase velocity at 60 MHz.
(a) Pulse velocity.
.5
3.0
Attenuation coefficient
dV/dP
1.090
1.085
AAAAAAAAAAAAAAAAAAAAAAAA
AAAAAAAAAAAAAAAAAAAA
AAAAAA
AAAAAAAAAAAAAAAAA
AAAAAAAAAA
AAAAAA
Figure 21.—a (f) ± s error properties versus frequency for SN2.
(a) At sharp pore fraction boundary.
Frequency, f, MHz(b) Away from sharp boundary.
Att
enua
tion
coef
ficie
nt, a
(f) ±
s(f
), ne
per
s/cm
4
048
1
24 72
2
3
4824 72 96
Error bands
AA
0
1
2
3
96
attenuation coefficient, and the lower the mean phase andcross-correlation velocities. The Vpulse images consistentlywere the most revealing of disk nonuniformity and differencesbetween disks. The R( f ) images did not differentiate themicrostructual differences between the disks.

22
were most severe corresponded to areas of highest α( f )(fig. 20(c)), and velocity variations corresponded exactly withpore fraction variations (compare fig. 7(b) with fig. 20(a)).Note the points on the curves in figure 20(c) at the 6- and31-mm positions; the attenuation coefficient achieved maxi-mums where dV/dP was most negative (at X ~ 6 mm) andmost positive (at X ~ 31 mm). These results are consistentwith those from a previous study (ref. 16) of ultrasonic imag-ing of sintered α-SiC disks. In that study, it was found thatregions in α (f ) images showing high attenuation coeffi-cients generally overlapped boundaries seen in the corre-sponding Vpulse image (i.e., a high attenuation coefficient wasobserved where large spatial gradients in velocity and densityexisted). A plausible explanation for these results follows: Itis believed that refractive scattering of waves occurs at im-pedance-mismatched material boundaries (see the distinctionbetween the high-pore-fraction and surrounding regions infig. 8). This results in an apparent attenuation coefficientbeing measured as ultrasonic energy is redirected. The effecton the measured attenuation coefficient is difficult to predict,since it is difficult to know exactly how the ultrasound isredirected. Thus, such refractive scattering effects may leadto both high and low values for the measured attenuation
coefficient. In this study, high attenuation coefficients wereobserved at relatively sharp pore fraction boundaries.
It is also interesting to note that the dependence of α( f ) onfrequency was quite different at a relatively sharp pore fractionboundary than in a surrounding region in the SN2 disk (fig. 21).Therefore, the slope of α( f ) (dα( f )/df ) may also provideinformation on spatial differences in microstructure (refs. 34and 35).
The curves of pulse velocity and phase velocity are similarlyshaped, but the reflection coefficient variations (fig. 20(d)) donot correspond with variations in the other curves of ultrasonicproperty versus position.
5.5 Comparison of Ultrasonic Contact Scan Images forScans on Machined and Polished Disk Faces
Figures 22 to 26 show α(f = 60 MHz) and the percent errorin α(f = 60 MHz), Vp(f = 70 MHz), Vpulse, and R(f = 60 MHz)images for the experimental configuration where the ultra-sonic transducer was scanned first on the machined face andthen on the polished face (opposite surface) for disks SN6,SN3, SN4, and SN5. In most cases, no significant differencesin feature differentiation were noted between the same imagetypes for machined and polished face scans (note that each disk
(b)
(a)
0.080
0.874(mean)
4.357
MHz60
0.051
0.670(mean)
3.542
MHz (nepers/cm)
(nepers/cm)
60
2 mm
Figure 22.—a (f = 60 MHz) images for SN6 with transducer on machined and polished surfaces.
(b) Polished surface.
(a) Machined surface.
(b)
(a)
1
29(mean)
99
MHz60
1
33(mean)
99
MHz (percent)
(percent)
60
2 mm
Figure 23.—Percent error in a (f = 60 MHz) images for SN6 with transducer on machined and polished surfaces.
(b) Polished surface.
(a) Machined surface.

23
(b)
(a)
1.079
1.090(mean)
1.099MHz70
1.074
1.089(mean)
1.099MHz (cm/µsec)
(cm/µsec)
70
2 mm
Figure 24.—Vp (f = 70 MHz) images for SN3 with transducer on machined and polished surfaces.
(b) Polished surface.
(a) Machined surface.
(b)
(a)
1.075
1.085(mean)
1.098
1.075
1.084(mean)
1.099(cm/µsec)
(cm/µsec)
2 mm
Figure 25.—Vpulse images for SN4 with transducer on machined and polished surfaces. Nominal center frequency, 125 MHz.
(b) Polished surface.
(a) Machined surface.
(b)
(a)
0.813
0.921(mean)
0.970MHz60
0.813
0.932(mean)
0.989MHz60
2 mm
Figure 26.—R (f = 60 MHz) images for SN5 with transducer on machined and polished surfaces.
(b) Polished surface.
(a) Machined surface.
Figure 27.—Vpulse images of disk SN2.
(a)
1.070
1.087(mean)
1.111
1.062
1.078(mean)
1.096(cm/µsec)
(cm/µsec)
2 mm
(b) Dry coupled (nominal transducer center frequency, 10 MHz; transducer diameter, 0.25 in.).
(a) Wet coupled (nominal transducer center frequency, 50 MHz; transducer diameter, 0.125 in.).

24
was flipped over for the polished scan after scanning on themachined surface). Mean values of α(f = 60 MHz) for SN6 frommachined and polished face scans differed by about 25 percent,but this is within the mean experimental error (~30 percent) for theα(f = 60 MHz) image (fig. 23). The minimum, maximum, andmean values for Vp(f =70 MHz) images of SN3 were nearlyidentical for machined and polished face images. More scatterdots (discussed previously) were apparent in the machined faceimage than in the polished face image for Vp(f = 70 MHz), and itappears that slightly more detail was differentiated in the polishedface image. However, the latter two results were not alwaysobserved for machined versus polished Vp( f ) images and areprobably caused by small scan-to-scan and within-scan couplantvariations. Minimum, maximum, and mean values for Vpulseimages of SN4 were essentially identical for the machined andpolished face images. Mean and maximum values for R(f =60 MHz) images of SN5 were each very similar for machinedand polished face images. A low reflection coefficient stripwas apparent in the polished face image but not in the machinedface image. The latter result was not always observed formachined versus polished R( f ) images and probably resultsfrom couplant thickness variations (fig. 3(c)). The results ofthe machined versus polished face scans were surprisingconsidering the expected sensitivity of frequency-dependentproperties on surface condition and allow the reliable applica-tion of the contact scan method to materials with machined aswell as polished surfaces.
5.6 Dry- Versus Wet-coupled Vpulse Images
In figure 27, a wet-coupled Vpulse image of disk SN2 (obtainedat a nominal transducer center frequency of 50 MHz and atransducer diameter of 0.125 in. (0.3 cm)) is compared with a dry-coupled Vpulse image (obtained at a nominal transducer centerfrequency of 10 MHz and a transducer diameter of 0.25 in.(0.6 cm)). Both images clearly reveal and similarly quantify thesix distinct regions of high pore fraction. This result is importantfor materials that cannot be ultrasonically examined with wetcoupling. The high-pore-fraction regions are most clearly revealedin the wet-coupled image, as is consistent with the facts that thebeam diameter for the wet-coupled configuration was approxi-mately half that for the dry-coupled configuation and that the wet-coupled configuration had approximately an order of magnitudehigher signal-to-noise ratio than the dry-coupled configuration.The minimum, maximum, and mean values were uniformly about1 percent higher in the dry-coupled image than in the wet-coupledimage.
5.7 Longitudinal Versus Shear-Wave Vpulse Images andPoisson’s Ratio Maps
Figures 28(a) and (b) show ultrasonic longitudinal (nominaltransducer center frequency, 10 MHz) and shear-wave (nominaltransducer center frequency, 5 MHz) Vpulse images, respectively,of SN2 obtained from dry-coupled scans. (The relatively low
signal-to-noise ratio for the shear-wave, dry-coupledconfiguration resulted in data not being acquired at some scanpoints near the left edge of the disk during the shear-wavescan.) Both images clearly reveal and similarly quantify the sixdistinct regions of high pore fraction. Velocity variation wasabout 4 percent over the longitudinal-wave Vpulse image andabout 2 percent over the shear-wave Vpulse image.
(b) Vpulse image from dry-coupled, shear-wave scan (nominal transducer center frequency, 5 MHz).
(a)
0.599
0.606(mean)
No data taken in this region
No data taken in this region
0.614
1.070
1.087(mean)
1.111(cm/µsec)
(cm/µsec)
2 mm
Figure 28.—Vpulse and Poisson's ratio images of disk SN2.
0.261
0.273(mean)
0.288
3 mm
(c) "Apparent" Poisson's ratio images of same disk constructed from longitudinal and shear-wave velocity images.
(a) Vpulse image from dry-coupled, longitudinal wave scan (nominal transducer center frequency, 10 MHz).

25
Poisson’s ratio ν can be computed directly from longitudinaland shear-wave velocities according to (ref. 13)
ν =
VV
V V
LS
L S
22
2 22 19
2
2( )
where VL and VS are the longitudinal and shear-wave veloci-ties, respectively. Predictions of mechanical and thermalbehavior of components (by finite element analysis, e.g.)traditionally assume a constant value for Poisson’s ratio. Thisassumption can lead to reduced accuracy of the analysis if infact “apparent” Poisson’s ratio (ref. 14) varies within a compo-nent because of microstructural variation. The use of materialsin demanding high-performance applications where subtlewithin-sample mechanical property aberrations are intoler-able may require characterization of such aberrations (refs. 2and 3). Figure 28(c) shows the apparent Poisson’s ratio imageof the SN2 disk constructed from the longitudinal and shear-wave velocity images through the use of equation (7). ThePoisson’s ratio image indicates similar variations to thoseshown in the velocity images and quantifies variations inPoisson’s ratio across the disk. Apparent Poisson’s ratio variedacross the disk from ~0.26 to 0.29 (~10-percent variation) witha mean value of ~0.27. The relative error in the Poisson's ratioimage was #1 percent as the longitudinal and shear-waveVpulse images used to form the Poisson's ratio image werereproducible to 0.1 percent. The Poisson’s ratio image can inconcept be used in a NASTRAN finite element analysis(ref. 36) by dividing the disk into a finite element grid, usingdifferent material cards for finite elements having differentPoisson’s ratios, and inputting the appropriate value of appar-ent Poisson’s ratio on each material card.
Elastic properties such as Poisson’s ratio are most accuratelycalculated from phase velocities, since the elasticity of amaterial may depend on the loading rate (ref. 23). As previ-ously mentioned, velocity determined from cross-correlationis essentially a pulse velocity, as the entire wave train (contain-ing a broad band of frequencies) is considered in the calcula-tion. Pulse and phase velocity will be essentially equal over thefrequency bandwidth investigated if dispersion (velocity vary-ing with frequency) due to the material itself and samplegeometry are negligible. Since essentially no dispersion wasapparent for this Si3N4 material, the Poisson’s ratio valuesobtained from cross-correlation velocity measurements weredeemed to be sufficiently accurate and are close to valuesobtained in other studies (ref. 37).
5.8 Experimental Versus Expected Results forFrequency and Pore Fraction Dependence
Figure 29 shows the experimental relations for ultrasonicproperties versus frequency obtained for SN2 with the ultra-sonic transducer placed directly at the disk center (~0.03 pore
fraction averaged through the thickness), at the disk edge(~0.01 pore fraction averaged through the thickness), and inthe high-pore-fraction regions (~0.04 pore fraction averagedthrough the thickness) (fig. 7(b)). The following commentspertain to the frequency range of approximately 30 to 110 MHz.Below and above this frequency range, the low signal-to-noiseratio produced results of questionable validity as previouslyexplained (section 5.1).
Phase velocity VSi3N4 decreased with increasing pore frac-
tion at any frequency and decreased slightly with increasingfrequency (fig. 29(a)). These results agree well with thosepredicted (fig. 2(c)). Absolute magnitudes of velocity valuesand magnitudes of changes in velocity values with changingpore fraction correlated with predicted theoretical (fig. 2(a))and previously observed empirical (fig. 2(b)) results.
The reflection coefficient RSi3N4 had no predictable depen-
dence on pore fraction and increased with increasing frequency
AAAA
AAAAAA
AAAAAAAA
AAAA
Figure 29.—Experimental relations for ultrasonic properties versus frequency obtained for SN2 directly at disk center (~0.03 pore fraction averaged through thickness), disk edge (~0.01 pore fraction averaged through thickness), and high- pore-fraction regions (~0.04 pore fraction averaged through thickness).
Ref
lect
ion
coef
ficie
nt, R
Frequency, f, MHz(c) Attenuation coefficient.
Pha
se v
elo
city
, Vp, c
m/µ
sec
Att
enua
tion
coef
ficie
nt, a
, ne
per
s/cm
AAAAAAAAAAAAAAAAAAA
AAAAAAAAAAAAAAAAAA
AAAAAAAAAAAAAAAAAA
AAAAAAAAAAAAAAAAAA
(a) Phase velocity.
(b) Reflection coefficient.
1.10
30 12060 90
.6
.8
1.06
1.08
0
1
2
AAAADisk center
High-porosity regionDisk edge

26
for all pore fractions (fig. 29(b)). Regarding the latter result,experimental results agreed with those predicted. The RSi3N4was expected to slightly decrease with increasing pore fraction(fig. 3(a)); experimental results showing no pore fractiondependence for RSi3N4
were surprising, since the regions ofhigh pore fraction were readily apparent at disk surfaces(fig. 5). The behavior of RSi3N4
versus frequency appears toindicate a couplant thickness of ~0.5µm (fig. 3(c)). Compar-ing the reflection coefficient for Si3N4 calculated from veloci-ties and densities (RSi3N4
= 0.46) (ref. 13) with the largerfrequency-dependent RSi3N4
observed experimentally revealedthe necessity of using the experimentally observed reflectioncoefficient to determine accurate attenuation coefficients.
Attenuation coefficient αSi3N4 increased with increasing
frequency for all pore fractions (fig. 29(c)). The increases were
on the order of ≤1 neper/cm over the frequency range 30 to110 MHz. The αSi3N4
versus frequency behavior at distinctlydifferent pore fraction regions was not consistently different. Avariation was expected, since grain size distribution did notappear to vary between the high-pore-fraction and surround-ing regions. However, it is difficult to make conclusive state-ments regarding the effects of pore fraction changes on changesin αSi3N4
by using the methodology of this study. Apparentattenuation coefficient may have been measured and imagedbecause of scattering at relatively sharp material boundaries asdiscussed previously (the dependences of α( f ) on frequency,and the values for αSi3N4
were observed to be significantlydifferent between pore fraction boundaries and regions awayfrom such boundaries as shown in fig. 21). Further competingmaterial effects (such as second-phase variations) may have
Figure 30.—Thermal wave images of disk SN6.
1 mm1mm
(b) 0.10 sec.
(a) 0.05 sec.
(d) 0.20 sec.
(c) 0.15 sec.

27
also been present and affecting αSi3N4. Expected changes in
αSi3N4 due to scattering from pores (fig. 4(c)) were compared
with observed changes in mean αSi3N4 with changes in fre-
quency (fig. 11(k)). An average pore concentration no ofapproximately 108/cm3 was indicated by the observed magni-tude of change (≤1 nepers/cm from 30 to 110 MHz) (if grainscattering and other contributions to αSi3N4
were assumed to benegligible and pores were approximately 1-µm radius).
5.9 Correlation of Ultrasonic Contact Scan Results WithPhysical Properties
Hardness.—The average of 20 Vickers microhardness meas-urements in each region yielded similar apparent Vickershardness numbers (mean ± standard deviation) of 1126 ± 56for the high-pore-fraction region and 1103 ± 58 for thesurrounding less porous regions of disk SN3. Thus, Vickersmicrohardness measurements were not able to clearly dis-criminate the pore fraction variation.
Thermal behavior.—Thermal behavior variations corre-lated with pore fraction variations in disk SN6 as shown infour successive time frames separated by 0.05 sec in figure 30.The three front-surface-connected regions of high pore frac-tion, as well as the generally less dense central section of diskSN6, were highlighted by lighter gray scale (higher thermalenergy density). Variations were most prominent in frames 1and 2 and began to fade out later in time. The initial magni-tude of variation between highly porous and surroundingregions was on the order of 2 deg C. (None of the the sixdistinct regions of high pore fraction were differentiated inthermal diffusivity images when using a similar procedure.Average thermal diffusivity was 0.23±0.03 cm2/sec for diskSN6, which agreed well with those previously reported (0.22to 0.26 cm2/sec) for sintered Si3N4 (ref. 38).)
6.0 Further Discussion
The potential of the ultrasonic contact scan technique formaterials characterization was demonstrated in this study. Asingle transducer in combination with spectral analysis allowedmaterial characterization in terms of ultrasonic material prop-erties over a wide band of frequencies. This method results intime savings over scanning using discrete frequency tech-niques. The ultrasonic contact scan technique is applicable toflat machined materials in which access to only one side ispossible and is most useful in a materials development pro-gram for quantitative characterization of sample homogeneity.It is also envisioned that this method would be useful in aquality assurance laboratory for material coupon analysis. Thescan system hardware and software can be upgraded forimprovements or additions with the following envisioned:First, with the development of wheel probes and multielement
assemblies for scanning (ref. 39), and the ever-increasingpower of computers for data acquisition and analysis, scan andanalysis time can be significantly reduced in the future. Sec-ond, images of additional ultrasonic properties, such as groupvelocity, peak frequency of the material-modulated ultrasonicecho, and attenuation coefficient slope, can be constructed byusing the digitized and stored ultrasonic waveform data. Theseproperties and images can be used for further analysis andverification of microstructural condition.
7.0 Conclusions
An ultrasonic scan procedure using the pulse-echo contactconfiguration was employed to obtain maps of pore fractionvariations in polished and machined sintered silicon nitride samplesin terms of ultrasonic material properties. Ultrasonic velocity(pulse and phase), attenuation coefficient, and reflection coeffi-cient images were obtained simultaneously over a broad band offrequencies (e.g., 30 to 110 MHz) by using spectroscopic analy-sis. Wet and membrane (dry) coupling techniques and longitudi-nal and shear-wave energies were used. The essential features ofthis study were as follows:
1. Velocity and attenuation coefficient images representedaverage through-thickness microstructure for the sample scanned.Ultrasonic velocity (longitudinal and shear wave) images revealedand quantified the extent of pore fraction variation in the siliconnitride disks. The magnitude and direction of variations in cross-correlation velocity images were very similar to those seen forpore fraction variations. Velocity images were similar for wet andmembrane coupling. Attenuation coefficient images revealedpore fraction nonuniformity due to the scattering that occurred atboundaries between regions of high and low pore fraction. Thecontact scan procedure proved more precise and accurate (i.e.,more quantitative) than ultrasonic C-scans by characterizinginhomogeneity in terms of ultrasonic material properties.Spatial patterns of velocity and attenuation coefficient imagesfrom a contact scan were nearly identical at frequencies withinthe 50-percent bandwidth (50 to 80 MHz) but became unfo-cused at frequency extremes. Mean, minimum, and maximumvalues of reflection coefficient and attenuation coefficientsignificantly varied with frequency throughout the entire band-width, but values for phase velocity varied only slightly withfrequency.
2. Velocity and attenuation coefficient images were nearlyidentical for machined and polished disks, making the methodreadily applicable to flat machined materials.
3. Maps of “apparent” Poisson’s ratio constructed fromlongitudinal and shear-wave velocities quantified Poisson ra-tio variations across a silicon nitride disk. A direct applicationof engineering ultrasonics is shown, since the Poisson’s ratiomap with its grid of values can be input to a finite elementproblem where ideal properties were previously assumed.

28
4. Experimental velocity results agreed well with thosepredicted as a function of pore fraction and frequency.Experimental reflection coefficient results agreed well withthose predicted as a function of frequency for couplant thick-ness of approximately 0.5 µm but did not show the expecteddependence on pore fraction. Experimental results of attenua-tion coefficient changes were similar to those predicted dueto pore scattering as a function of change in frequency for apore concentration of 108/cm3.
5. Thermal wave images of a disk indicated transient thermalbehavior variations consistent with observed pore fraction andvelocity and attenuation coefficient variations.
Lewis Research CenterNational Aeronautics and Space AdministrationCleveland, Ohio, February 3, 1993

29
measurement. The error in R was low except at low values ofR and SNR.
The percent error in the attenuation coefficient α measure-ment was calculated from
%
exp exp
( )
.
ERRSNR
SNR
αασ
α α
α α
α σ
=
=
×( )[ ] + ( )[ ]
( )+
×
+ + ( )( )( )
100 1001
2
1
4 4
11
11 4 22
2
2 2
22 2 2
0 5
X
X R X
R
R
2
X
where σα is the error in the attenuation coefficient measure-ment, X is sample thickness, σX is the error in the thicknessmeasurement (3 3 10—4 cm in this investigation), R is thereflection coefficient, and SNR is the signal-to-noise ratio.Figure 33 shows the percent error associated with pulse-echoattenuation coefficient measurement. Error in α is low forintermediate values of R and low values of α. It increasesgreatly for R ≤ 0.1 and R ≥ 0.9 and as α increases.
AAAAAAAAAAAAAAAAAAAAA
AAAAAAAAAAAAAAAA
AAAAAA AA
AAAAA
A
AAAAAA
A
AAAAAAAAAAAAAAA
Figure 31.—Percent error associated with pulse-echo velocity measurements.
Per
cent
err
or
.10.08
.06.04
.020
.10.08
.06.04
.02
2018161412
108
6420
DXX Dt
t
AAAA
AA
A
AAAAAAAAAAAAAAAAAAAAAAAAAAAAAAAAAAAAAAAAAAAAAAAAAAAAAAAAAAAAAAAAAAAAAAAAAAAAAAAAAAAAAAAAAAAAAAAAAAAAAAAAAAAAAAAAAAAAAAAAAAAAAAAAAAAAAAAAAAAAAAAA
Appendix A
Errors Associated With Pulse-Echo Measurements
The percent error in the pulse-echo velocity V measurementwas calculated from (ref. 40)
% ( )
.
ERRVX
X=
+
100 202 2 0 5
∆ ∆ττ
where X and ∆X are thickness and error in thickness, respec-tively, and τ and ∆τ are time delay and error in time delay,respectively. Figure 31 shows the percent error associated withpulse-echo velocity measurements. (Error is also dependent onthe error in frequency-domain signal processing methods usedin the calculation of ultrasonic properties.)
The percent error in the reflection coefficient R measure-ment is calculated from
% ( )
.
ERRSNRR
R
R=
+( )( )( )
1001
21
2 0 5
where SNR is the signal-to-noise ratio of the first front-surfaceecho without the sample present on the buffer rod. It was meas-ured by comparing the peak amplitude of FS1(t) to the peakamplitude of the noise. The SNR was ~250 in this investigation(wet coupling configuration). Figure 32 shows the percenterror associated with pulse-echo reflection coefficient
Figure 32.—Percent error associated with pulse-echo reflection coefficient measurements.
Per
cent
err
or
1000800
600400
200.1
1.0.8
.6.4
.2
100
80
60
40
20
0
Reflection coefficient, R (f) Signal-to-noise ratio, SNR
.9.7
.5.3

30
4.5
3.5
2.5
1.5
.5
.1
.8.6
.4.2
100
80
60
40
20
Per
cent
err
or
0
Reflection coefficient, R (f) .9.7
.5.3
5.5
Attenuatio
n coefficient, a
(f),
nepers/cm
1.0
Figure 33.—Percent error associated with pulse-echo attenuation coefficient measurements. SNR = 250; X = 0.3 cm; sX = 3x10⁻⁴ cm.

31
Appendix B
Fabrication of Si3N4 Samples
Processing
The microstructure and properties of Si3N4-based materialsdepend on the processing methods. In this investigation, sevennear-theoretical-density β-Si3N4 disk-shaped samples (labeledSN1 to SN7) were manufactured from two batches of startingpowder according to the following procedures (ref. 41). Thestarting powder composition was 91.7 g Kemanord Si3N4 +(1.9 g SiO2 + 6.2 g Y2O3) densification additives. Two batchesof powder were milled in ethanol with Si3N4 media in sinteredreaction-bonded Si3N4 solid mills for 100 hr. The milledslurries were sieved through a 10-µm sieve and then combinedin a large plastic bottle. The powders were allowed to settle forabout one week. Then, excess ethanol was removed by care-fully pouring the fluid from the container. The bottle contain-ing the slurry was shaken and then small samples of the slurrywere placed in weighing dishes, weighed, dried, and thenweighed again in order to determine the solids loading (involume percent) of the slurry. A bottle containing slurry wasthen placed in a hot water bath in order to evaporate some of theexcess ethanol. A 15 vol % solids slurry was obtained. Thebottle containing the slurry was tumbled for 16 hr. Forty piecesof Si3N4 media were added to provide mixing, but no furtherparticle size reduction was expected. The pH of the slurry wasraised to 10 by the addition of ammonium hydroxide (NH4OH).
Slurry pressing was used to consolidate the samples. Disk-shaped samples were formed under 9-MPa pressure in a die.The slurry charge was compacted between filter-paper disks,which trapped the solids. Porous stainless steel disks wereused above the top filter paper and below the bottom filterpaper for uniform pressure application and expulsion of liquid.After careful drying to avoid cracking, the disks were sealed
with evacuated thin-wall plastic tubing. Cold isostatic pressingunder 414-MPa pressure was performed to increase greendensity.
The disks were placed in a tungsten cup with a loose-fittinglid and sintered at 2140 °C for 4 hr under 5-MPa nitrogenpressure. Disks 1 to 4 were sintered in one run, and disks 5 to7 were sintered in another run. Sintering was done in atungsten-mesh-element, all-refractory-metal, water-cooled,double-wall furnace. High-purity boron nitride setters sepa-rated the disks from each other and from the tungsten cup.
Machining and Polishing
Machining was accomplished in two steps. First, a roughmachining with coolant was performed in which the thicknessof the samples was reduced from approximately 0.5 cm to0.3 cm, and the top and bottom surfaces were made flat andparallel within ±25 µm by using a 20-µm diamond wheel.Then, the samples were machined by using the same sizediamond wheel so that top and bottom surfaces were made flatand parallel to ±2 µm. An average of less than 0.02 cm ofmaterial was removed from the samples in this step. Fivesamples then were lapped on one side to obtain a fine polish byusing successively 45-, 30-, 15-, 9-, 6-, and 3-µm diamondslurry. Each lapping took approximately 2 hr. The sampleswere cleaned with acetone after polishing. Figure 9 showstypical surface profiles for machined and polished surfaces ofthe Si3N4 disks. Machined disk surfaces were characterized byless than 1-µm peak-to-peak roughness. No difference insurface condition between polished regions at a disk center andat a high-pore-fraction area were observed.

32
Appendix C
Symbols
a pore radius; scatter radius
Bj(F) Fourier transformed Bi(t) where i = 1, 2
Bi(t) time-domain ultrasonic echo off sample back surfacewhere i = 1, 2
D grain size
%ERRi percent error in i where i = velocity, reflection coef-ficient, or attenuation coefficient
FSi(F) Fourier transformed FSi(t) where i = 1, 2
FSj(t) time-domain ultrasonic echo off sample front surfacewhere i = 1, 2
f frequency
k wavenumber
no number of scatterers per unit volume
P pore fraction; position
R reflection coefficient
R(f) frequency-dependent reflection coefficient
SNR signal-to-noise ratio
V velocity
VL longitudinal wave velocity
Vp(f) frequency-dependent phase velocity
Vpulse pulse velocity determined from cross-correlation method
VS shear-wave velocity
V0 velocity in fully dense material
X sample thickness
Z acoustic impedance
α attenuation coefficient
α( f ) frequency-dependent attenuation coefficient
γ scattering cross section
γN normalized scattering cross section
θ phase angle
λ wavelength
ν Poisson’s ratio
ρ density
σ error
τ time delay between two ultrasonic pulses
τo time delay between two ultrasonic pulses determinedfrom cross-correlation
Subscripts:
0 no pores
1, 2, 3 buffer rod, couplant, and sample, respectively

33
Physics, Vol. 19: Ultrasonics, P.D. Edmonds, eds., Academic Press,New York, 1981, pp. 67–135.
21. Hull, D.R.; Kautz, H.E.; and Vary, A.: Measurement of UltrasonicVelocity Using Phase-Slope and Cross-Correlation Methods. Mater.Eval., vol. 43, no. 11, 1985, pp. 1455–1460.
22. Kingery, W.D.; Bowen, H.K.; and Uhlman, D.R.: Introduction toCeramics. John Wiley & Sons, New York, 1976, p. 770.
23. Lynnworth, L.C.: Ultrasonic Measurements for Process Control:Theory, Techniques, Applications. Academic Press, New York, 1989,pp. 113–114.
24. Hsiao, C.P.; and Kline, R.A.: The Measurement of ViscoelasticModuli Using an Ultrasonic Spectroscopy Technique. 1984 IEEEUltrasonics Symposium; Proceedings, IEEE, New York, 1984,pp. 443–446.
25. Christensen, R.M.: Theory of Viscoelasticity, An Introduction. Aca-demic Press, New York, 1969.
26. Sayers, C.M.: Ultrasonic Velocity Dispersion in Porous Materials. J.Phys. D: Appl. Phys., vol. 14, 1981, pp. 413–420.
27. Birring, A.S.; and Hanley, J.J.: Effect of Cavities on UltrasonicAttenuation and Velocity. Nondestructive Characterization of Mate-rials II, J.F. Bussiere, et al., eds., Plenum Press, New York, 1987,pp. 673–681.
28. Kinsler, L.E., et al.: Fundamentals of Acoustics. John Wiley & Sons,New York, 1982, p. 128.
29. Truell, R.; Elbaum, C.; and Chick, B.B.: Ultrasonic Methods in SolidState Physics. Academic Press, New York, 1969, pp. 162–178.
30. Evans, A.G., et al.: Ultrasonic Attenuation in Ceramics. J. Appl.Phys., vol. 47, no. 5, 1978, pp. 2669–2679.
31. Sachse, W; and Pao, Y.H.: On the Determination of Phase and GroupVelocities of Dispersive Waves in Solids. J. Appl. Phys, vol. 49,no. 8, 1978, pp. 4320–4327.
32. Hull, D.R.; Leonhardt, T.A.; and Sanders, W.A.: Plasma Etching aCeramic Composite. NASA TM–105430, 1991.
33. Papadakis, E.P.: Ultrasonic Diffraction From Single Apertures With Appli-cation to Pulse Measurements and Crystal Physics. Physical Acoustics;Principles and Methods, Vol. XI, W.P. Mason, ed., Academic Press, NewYork, 1975, pp. 151–211.
34. Nair, S.M.; Hsu, D.K.; and Rose, J.H.: Porosity Estimation Using theFrequency Dependence of the Ultrasonic Attenuation. J. Nondestruct.Eval., vol. 8, no. 1, 1989, pp. 13–26.
35. Shen, P.; and Houghton, J.R.: Ultrasonic Attenuation Measurementand Its Application in Porosity Evaluation of Composite Materials.Presented at the American Society Nondestructive Testing 1992Spring Conference, Orlando, FL, Mar. 30–Apr. 3, 1992.
36. MSC/NASTRAN User’s Manuial, Ver. 64. MacNeal-SchwendlerCorporation, Los Angeles, CA, 1984, pp. 24–187.
37. Enginering Property Data on Selected Ceramics, Vol. I: Nitrides.Metals and Ceramics Information Center, Columbus, OH, 1976,pp. 5.3.3–5, 5.3.3–18.
38. Ziegler, G.: Thermo-mechanical Properties of Silicon Nitride andTheir Dependence on Microstructure. Mater. Sci. Forum, vol. 47,1989, pp. 162–203.
39. Teagle, P.R.: Nondestructive Evaluation of Composite AerospaceComponents. Composite Materials in Aircraft Structures, D.H.Middleton, ed., Wiley, New York, 1990, pp. 200–214.
40. Bevington, P.R.: Data Reduction and Error Analysis for the PhysicalSciences, Ch. 4. McGraw-Hill, New York, 1969.
41. Sanders, W.A.; Kiser, J.D.; and Freedman, M.R.: Slurry-PressingConsolidation of Silicon Nitride. NASA TM–101365, 1988.
References
1. Metals Handbook. Ninth ed., Vol. 17: Nondestructive Evaluation andQuality Control. ASM International, Metals Park, OH, 1989.
2. Vary, A.: NDE of HITEMP Composites—Status and Needs. HITEMPReview 1992, NASA CP–10104, Vol. III: Turbine Materials, 1992,pp. 75–1 to 75–14. (Permission to use this material was granted byHugh Gray on Feb. 10, 1993.)
3. McCauley, J.W.: Materials Testing in the 21st Century. Nondestruc-tive Testing of High-Performance Ceramics: Conference Proceed-ings, A. Vary and J. Snyder, eds., American Ceramic Society,Westerville, OH, 1987, pp. 1–18.
4. Baaklini, G.Y.; and Sanders, W.A.: Correlation of Processing andSintering Variables With the Strength and Radiography of SiliconNitride. Adv. Ceram. Mater., vol. 3, 1988, pp. 88–94.
5. Ellingson, W.A., et al.: Magnetic Resonance Imaging: A New Char-acterization Technique for Advanced Ceramics. Am. Ceram. Soc.Bull., vol. 68, June 1989, pp. 1180–1186.
6. Generazio, E.R.; Roth, D.J.; and Baaklini, G.Y.: Acoustic Imaging ofSubtle Porosity Variations in Ceramics. Mater. Eval., vol. 46, Sept.1988, pp. 1338–1343.
7. Cramer, E., et al.: The Application of Thermal Diffusivity Imaging toSiC-Fiber-Reinforced Silicon Nitride. Presented at the Conferenceon Quantitative Nondestructive Evaluation, University of Califor-nia, San Diego, LaJolla, CA. July 19–24, 1992.
8. Kunnerth, D.C.; Telschow, K.L.; and Walter, J.B.: Characterizationof Porosity Distributions in Advanced Ceramics: A Comparison ofUltrasonic Methods. Mater. Eval., vol. 47, 1989, pp. 571–575.
9. Roth, D.J., et al.: Spatial Variations in A.C. Susceptibility andMicrostructure for the YBa
2Cu
3O
7-x Superconductor and Their Cor-
relation With Room-Temperature Ultrasonic Measurements. J. Mater.Res., vol. 6, no. 10, 1991, pp. 2041–2053.
10. Stang, D.B.; Salem, J.A.; and Generazio, E.R.: Ultrasonic Imaging ofTextured Alumina. NASA TM–101478, 1989.
11. Shyne, J.C.; Grayelli, N.; and Kino, G.S.: Acoustic Properties asMicrostructure Dependent Materials Properties. NondestructuveEvaluation, O. Buck and S.M. Wolf, eds., Metallurgical Society ofAIME, Warrendale, PA, 1981, pp. 133–146.
12. Kino, G.S., et al.: Acoustic Measurements of Stress Fields andMicrostructure. J. Nondestruct. Eval., vol. 1, 1980, pp. 67–77.
13. Birks, A.S.; Green, R.E.; and McIntere, P.: Second ed., Vol. 7:Ultrasonic Testing. American Society for Nondestructive Testing,Columbus, OH, 1991, pp. 237, 389–830, 852.
14. Roth, D.J., et al.: Review and Statistical Analysis of the UltrasonicVelocity Method for Estimating the Porosity Fraction in Polycrys-talline Materials. NASA TM–102501, 1990.
15. Generazio, E.R.: The Role of the Reflection Coefficient in PrecisionMeasurement of Ultrasonic Attenuation. Mater. Eval., vol. 43, no. 8,1985, pp. 995–1004.
16. Generazio, E.R.; and Roth, D.J.: Ultrasonic Imaging of PorosityVariations Produced During Sintering. J. Am. Ceram. Soc., vol. 72,no. 7, 1989, pp. 1282–1285.
17. Richerson, D.W.; and Stephan, P.M.: Evolution of Applications ofSi
3N
4-Based Materials. Mater. Sci. Forum, vol. 47, 1989, pp. 282–307.
18. New Structural Materials Technologies: Opportunities for the Use ofAdvanced Ceramics and Composites—A Technical Memorandum.Report OTA–TM–E–32, U.S. Congress, Office of TechnologyAssessment, Washington, DC, 1986.
19. Bulijan, S.T.; and Baldoni, J.G.: Silicon Nitride-Based Composites.Mater. Sci. Forum, vol. 47, 1989, pp. 249–266.
20. Breazeale, M.A.; Cantrell, J.H.; and Heymann, J.S.: Ultrasonic WaveVelocity and Attenuation Measurements. Methods of Experimental

REPORT DOCUMENTATION PAGE
2. REPORT DATE
19. SECURITY CLASSIFICATION OF ABSTRACT
18. SECURITY CLASSIFICATION OF THIS PAGE
Public reporting burden for this collection of information is estimated to average 1 hour per response, including the time for reviewing instructions, searching existing data sources,gathering and maintaining the data needed, and completing and reviewing the collection of information. Send comments regarding this burden estimate or any other aspect of thiscollection of information, including suggestions for reducing this burden, to Washington Headquarters Services, Directorate for Information Operations and Reports, 1215 JeffersonDavis Highway, Suite 1204, Arlington, VA 22202-4302, and to the Office of Management and Budget, Paperwork Reduction Project (0704-0188), Washington, DC 20503.
NSN 7540-01-280-5500 Standard Form 298 (Rev. 2-89)Prescribed by ANSI Std. Z39-18298-102
Form Approved
OMB No. 0704-0188
12b. DISTRIBUTION CODE
10. SPONSORING/MONITORING AGENCY REPORT NUMBER
8. PERFORMING ORGANIZATION REPORT NUMBER
5. FUNDING NUMBERS
3. REPORT TYPE AND DATES COVERED
4. TITLE AND SUBTITLE
6. AUTHOR(S)
7. PERFORMING ORGANIZATION NAME(S) AND ADDRESS(ES)
9. SPONSORING/MONITORING AGENCY NAME(S) AND ADDRESS(ES)
11. SUPPLEMENTARY NOTES
12a. DISTRIBUTION/AVAILABILITY STATEMENT
13. ABSTRACT (Maximum 200 words)
14. SUBJECT TERMS
17. SECURITY CLASSIFICATION OF REPORT
16. PRICE CODE
15. NUMBER OF PAGES
20. LIMITATION OF ABSTRACT
Unclassified Unclassified
Technical Paper
Unclassified
National Aeronautics and Space AdministrationLewis Research CenterCleveland, Ohio 44135–3191
National Aeronautics and Space AdministrationWashington, D.C. 20546–0001
1. AGENCY USE ONLY (Leave blank)
August 1993
NASA TP–3377
E–7558
WU–506–43–11
Unclassified -UnlimitedSubject Category 38
A03
40
Quantitative Mapping of Pore Fraction Variations in Silicon Nitride Usingan Ultrasonic Contact Scan Technique
Don J. Roth, James D. Kiser, Suzanne M. Swickard, Steven A. Szatmary,and David P. Kerwin
Don J. Roth, James D. Kiser, and Suzanne M. Swickard, NASA Lewis Research Center. Steven Szatmary and DavidKerwin, Cleveland State University, Cleveland, Ohio 44115, and NASA Resident Research Associates at LewisResearch Center. Responsible person, Don J. Roth, (216) 433–6017.
Ultrasonics; Velocity; Attenuation; Silicon nitride; Spectroscopy; Microstructure;Pore fraction; Nondestructive testing
An ultrasonic scan procedure using the pulse-echo contact configuration was employed to obtain maps of pore frac-tion variations in sintered silicon nitride samples in terms of ultrasonic material properties. Ultrasonic velocity, at-tenuation coefficient, and reflection coefficient images were obtained simultaneously over a broad band of frequencies(e.g., 30 to 110 MHz) by using spectroscopic analysis. Liquid and membrane (dry) coupling techniques and longitudinaland shear-wave energies were used. The major results include the following: Ultrasonic velocity (longitudinal and shearwave) images revealed and correlated with the extent of average through-thickness pore fraction variations in thesilicon nitride disks. Attenuation coefficient images revealed pore fraction nonuniformity due to the scattering thatoccurred at boundaries between regions of high and low pore fraction. Velocity and attenuation coefficient imageswere each nearly identical for machined and polished disks, making the method readily applicable to machined ma-terials. Velocity images were similar for wet and membrane coupling. Maps of apparent Poisson’s ratio constructedfrom longitudinal and shear-wave velocities quantified Poisson’s ratio variations across a silicon nitride disk. Ther-mal wave images of a disk indicated transient thermal behavior variations that correlated with observed variationsin pore fraction and velocity and attenuation coefficients.