Quantitative investigations of FXN - CORE · Quantitative investigations of FXN ... My thanks to my...
151
Quantitative investigations of FXN transcription and epigenetic modifications, including histone acetylation and methylation, in FRDA human and mouse tissues. A thesis submitted for the degree of Master of Philosophy (M.Phil) by Daniah M. Trabzuni Division of Biosciences School of Health Sciences and Social Care Brunel University October 2008
Transcript of Quantitative investigations of FXN - CORE · Quantitative investigations of FXN ... My thanks to my...

Quantitative investigations of FXN transcription and epigenetic
modifications, including histone acetylation and methylation, in FRDA
human and mouse tissues.
A thesis submitted for the degree of Master of
Philosophy (M.Phil)
by
Daniah M. Trabzuni
Division of Biosciences
School of Health Sciences and Social Care
Brunel University
October 2008

Declaration This declaration is to certify that all of the work contained within this thesis is
the author’s own original work, except where otherwise specified within the text.
Daniah Trabzuni

Acknowledgments
All Praise is to Almighty Allah for His love, care, provision and answering my
prayers for giving me the strength, perseverance and patience to carry out this work
successfully. I thank Allah for the mercy which He has bestowed upon me
throughout my entire life and in particular while working on this thesis so I can reach
the best places and meet the best people.
My thanks to my principle supervisor Dr. Mark Pook for his supervision, and my
appreciation to my second supervisor Dr. Suling Li.
I am as ever, truly fortunate to have a loving family who always support me. My
parents, I am indebted and thankful for your constant and invaluable support,
encouragement and prayers for me. My siblings, Dina, Fadi and Sulafa: I am highly
thankful for your continuous support, encouragement and emotional help during
difficult times.
I am truly grateful to my best friend Faiqa Ahmad. My deep thanks and appreciation
to you for your continuous support at all levels: psychologically, emotionally and
professionally at all times. You have given me the strength, patience, guidance to
continue and produce this thesis.
I give my sincere appreciation and special thanks to my chairman Dr. Brian Meyer at
King Faisal Specialist Hospital and Research Centre, for being a true support over
the years and every time I needed him. Moreover, I am grateful to all my friends who
helped, and supported me with their valuable suggestions throughout this thesis.
Especially the long hours I have spent with them to reach this point and the help we
have given each other to improve our outcomes whenever it was possible. I greatly
appreciate your help; I just cannot find words to thank you all enough.
Finally, I would like to express my profound gratitude to King Faisal Specialist
Hospital and Research Centre and the Ministry of Higher Education, Kingdom of
Saudi Arabia for providing me with my scholarship.

Daniah Trabzuni Page 1
Abstract
Friedreich ataxia (FRDA) is an autosomal recessive neurodegenerative
disorder characterized by progressive gait and, limb ataxia, cardiomayopathy,
diabetes mellitus, optic atrophy and hearing loss. It is most often caused by
homozygous expanded (GAA)∙(TTC)n repeats within intron 1 of the FXN gene,
resulting in severely reduced levels of frataxin protein. The exact mechanisms of
how the expanded (GAA)∙(TTC)n repeats reduce FXN transcription are not fully
understood. However, many studies have suggested that the expanded repeat may
induce epigenetic modifications that cause the FXN transcription inhibition to occur.
In the past few years, epigenetic modifications have been given considerable
attention as an important mechanism that is contributing to the aetiology of FRDA.
This thesis investigated histone acetylation and methylation in three different regions
of the FXN gene: FXN promoter, upstream GAA and downstream GAA, using
chromatin immunoprecipitation (ChIP) and quantitative reverse transcriptase PCR
(qRT-PCR) of the human and transgenic mouse brain tissues. Furthermore, the
frataxin mRNA levels were investigated in autopsied brain tissues from an FRDA
patient and FXN transgenic mouse brain, heart and liver tissues. In addition, a
preliminary study that investigated the effect of a histone deacetylase inhibitor
(HDACi) on FXN transcription and histone modifications (acetylation) of transgenic
mouse brain, heart and liver tissues was conducted.
Results showed an overall significant decrease in the acetylation pattern of
H3K9ac and H4K16ac residues in all three regions within FXN gene. Moreover, a
significant increase in the di- and trimethylation pattern of the H3K9me2 and the
H3K9me3 residues was identified in all three regions of the FXN gene. The results
were comparable between the FRDA patient and transgenic mouse (YG8, YG22)
brain tissues. The FXN mRNA levels showed a significant decrease in all transgenic
mouse brain, heart and liver tissues, which is comparable with the FXN mRNA level
of the FRDA patient brain and heart tissues.

Daniah Trabzuni Page 2
Results for the preliminary HDACi study showed an approximate 20-30 %
increase in the FXN mRNA level in different transgenic mouse tissues after 3 days
intake at 150mg/kg dose. In addition, there was an increase in the acetylation pattern
of the H3K9ac and the H4K12ac in the HDACi treated transgenic mouse brain
tissues.
These studies will aid the understanding of FXN epigenetic modifications and
their contribution to FRDA disease; this is an exciting challenge leading to a new
effective FRDA therapeutic pathway.

Daniah Trabzuni Page 3
Table of contents
Declaration
Acknowledgments
Abstract....................................................................................................1
Table of Contents.....................................................................................3
List of figures...........................................................................................7
Abbreviations.........................................................................................11
1 Introduction 1.1 Ataxia............................................................................................15
1.1.1 Inherited progressive ataxia disorders.........................................15
1.2 Friedreich ataxia (FRDA)...........................................................16
1.2.1 The identification of FRDA.......................................................16
1.2.2 Clinical Features......................................................................16
1.2.3 Pathology...............................................................................18
1.2.4 Epidemiology and prevalence....................................................20
1.2.5 Genetic background.................................................................20
1.3 Epigenetics....................................................................................53
1.3.1 The definition of epigenetics..................................................... 53
1.3.2 Molar and Molecular epigenetics................................................55
1.3.3 Mechanisms of molecular epigenetic regulations..........................57
1.3.4 The relationship between the different mechanisms
of epigenetic regulations.....................................................................67

Daniah Trabzuni Page 4
1.3.5 Molecular epigenetic mechanisms in Friedreich ataxia ..................70
1.4 Therapeutic approaches..............................................................74
1.4.1 Antioxidant and iron chelation-based approaches..............................74
1.4.2 Gene based approach..........................................................................74
1.4.3 Molecules that increase frataxin mRNA or protein............................76
1.4.4 Gene therapy approach.......................................................................76
1.5 In vitro and in vivo modules........................................................77
1.5.1 In vitro models........................................................................77
1.5.2 In vivo models.........................................................................77
1.6 The aim of the study....................................................................80
2 Materials and Methods
2.1 Genotyping of mice......................................................................81
2.1.1 DNA Extraction......................................................................81
2.1.2 (GAA) PCR............................................................................81
2.1.3 (FXN) knockout PCR...............................................................83
2.2 RNA Extraction using TRIZOL®Reagent................................84
2.2.1 Tissue Homogenisation............................................................84
2.2.2 Phase separation......................................................................85
2.2.3 RNA precipitation and wash......................................................85
2.2.4 RNA Quality Check.................................................................86
2.3 cDNA Synthesis…………………………………..……………..86
2.3.1 cDNA Synthesis……………………………………….…….86
2.3.2 cDNA Quality Check……………………….….…………….87

Daniah Trabzuni Page 5
2.4 Chromatin immuno-precipitation assay (ChIP)…….....…..…89
2.4.1 Tissue Homogenisation……………….....……………...……89
2.4.2 DNA and Protein Cross-Linking………………………………..….89
2.4.3 DNA Shearing……………………………………….….….……….90
2.4.4 DNA immuno-precipitation…………………………..………….…90
2.4.5 DNA Phenol /Chloroform Extraction…………………………...….92
2.4.6 DNA Quality Check…………………………………………...……93
2.5 Relative Quantitative PCR…………........................…..…………….94 2.5.1 cDNA Quantification………………………………………………..94
2.5.2 ChIP genomic DNA Quantification……………………………...…95
3 Results
3.1 Genotyping of mice……………………………………………………..97
3.1.1 Screening for the (GAA)n∙(TTC)n repeats…………………...……..97
3.1.2 Screening for the Fxn knockout alleles ….......………….……….….97
3.2 FXN mRNA level in the human brain and transgenic mouse brain, heart and liver tissues…………………..……..………………99
3.2.1 RNA Extraction quality Check…………………………………….100
3.2.2 cDNA Synthesis quality Check……………………...…………….100
3.2.3 Relative Quantitative, qRT-PCR…………….................…………102
3.3 Histone modifications of FXN in human and transgenic mouse brain tissues…………………………………...……………….108
3.3.1 Chromatin immuno-precipitation assay (ChIP)………………..…..108
3.3.2 Relative Quantitative, qRT-PCR …………………..........…..……111
3.4 HDACi effect on mRNA level of FXN in transgenic mouse brain, heart and liver tissues..............................................................117

Daniah Trabzuni Page 6
3.5 HDACi effect on histone modifications of FXN in transgenic mouse brain tissues................................................................................121
4 Discussion.....................................................................................123
List of references................................................................................................127
Appendix 1............................................................................................................135

Daniah Trabzuni Page 7
List of figures
Figure 1.1: Overview of the main sites of neuronal loss and organ dysfunction in Friedreich ataxia……………………...…...…19
Figure 1.2: Dorsal root ganglion neurons of an embryonic rat
(100X).....................................................................................20 Figure 1.3: Ideogram of the human chromosome 9..................................21 Figure 1.4: FXN gene structure.................................................................22 Figure 1.5: Northern blot analysis of frataxin mRNA in poly (A) RNA
from total mouse embryos......................................................23 Figure 1.6: Frataxin expression at E16.5…………………………...……23 Figure 1.7: Frataxin expression in developing dorsal root ganglia…...…24 Figure 1.8: Structure of frataxin………..……………………....……….27 Figure 1.9: Suggested pathogenesis of FRDA……...……………..…….29 Figure 1.10: Diagram showing the Pandolfo hypothesis……………….…30 Figure 1.11: Iron binding………………………….……………...……….31 Figure 1.12: Diagram showing some of the ways that an amino-acid
mutation can disrupt a protein’s structure or function…...............................................................................32
Figure 1.13: Unusual DNA structures formed by all expandable
repeats……………………………………...………………..38 Figure 1.14: Model for the role of different biology processes in vivo…...39 Figure 1.15: Three hypotheses to explain early events in repeat
expansions………………………...…………………..……..41

Daniah Trabzuni Page 8
Figure 1.16: A model for replication blockage by (GAA)n•(TTC)n repeats leading to their expansion……………….…......……………42
Figure 1.17: Gap repair model for repeat expansions in non-dividing
cells…………………………………………………….....…44 Figure 1.18: Loss of stabilizing interruptions within expandable
repeats…………………………………………………..…...46 Figure 1.19: Recombination models for repeat expansions….…………...47 Figure 1.20: Cleavage of a stable DNA structure on the lagging-strand
template……………………...……………………………....48 Figure 1.21: Transcription-coupled RNA∙DNA hybrid formation in a
(GAA)n∙(TTC)n repeat…………………..………………….51 Figure 1.22: Schematic representation of the frataxin minigene…….....…52 Figure 1.23: The external environment interacts with the internal
environment to influence fetal development with both immediate and life-long consequences…..………………….56
Figure 1.24: Nucleosome structure…..……...…………………...………..57 Figure 1.25: Properties of euchromatic regions………………….…….…58 Figure 1.26: Properties of heterochromatic regions….…..……………….59 Figure 1.27: Methylation of cytosine……………………………...……...63 Figure 1.28: The interaction of DNA methylation, histone modification and
other factors such as small RNAs contribute to an overall regulation of the gene expression and allows cells to remember their identity…………...………………………………….....68
Figure 1.29: Interaction between RNA, histone modification and DNA methylation in heritable silencing………...…...…………….69
Figure1.30: Model for chromatin organization in the region conataining
residue 13 in normal and FRDA alleles…....……….……….71

Daniah Trabzuni Page 9
Figure 1.31: The current understanding as to why GAA repeats reduce frataxin message levels…………….………………….…….73
Figure 1.32: Two steps mating strategy……………………..……………78 Figure 3.1: GAA genotyping PCR product…………....…………...……98 Figure 3.2: Fxn knockout PCR………….……..………………………...99 Figure 3.3: RNA extraction…………………..……….………………..100 Figure 3.4: cDNA quality check PCR 1……………...…………….…..101 Figure 3.5: cDNA quality check PCR 2………………………………..101 Figure 3.6: qRT-PCR analysis of FXN mRNA in human brain tissue…103 Figure 3.7: qRT-PCR analysis of FXN mRNA in transgenic mouse brain
tissues……………………………………………...……….104 Figure 3.8: qRT-PCR analysis of FXN mRNA in transgenic mouse heart
tissues………..……….….…………………………………105 Figure 3.9: Quality check of the qPCR product 1………………….…..106 Figure 3.10: Quality check of the DNA qPCR product 2………………..107 Figure 3.11: Schematic representation of 2.2 kb at the 5'end of the FXN
gene……………………………...…...………………..…...109 Figure 3.12: DNA sonication……...……………..………….…..………110 Figure 3.13: ChIP DNA quality check PCR………...…………………...110 Figure 3.14: Histone acetylation analysis in human brain tissue……......112 Figure 3.15: Histone methylation analysis in human brain tissue…….....113 Figure 3.16: Histone acetylation analysis in transgenic mouse brain
tissue………………………………………………..……...114

Daniah Trabzuni Page 10
Figure 3.17: Histone methylation analysis in transgenic mouse brain tissue………………………………………………..……...115
Figure 3.18: Quality check of the DNA qPCR product 1………………..116 Figure 3.19: HDACi effect on FXN mRNA of YG8 brain tissues…..….118 Figure 3.20: HDACi effect on FXN mRNA of YG8 liver tissues……....119 Figure 3.21: HDACi effect on FXN mRNA of YG8 heart tissues...…….119 Figure 3.22: HDACi effect on FXN mRNA of YG8 brain tissues...…....120 Figure 3.23: Histone acetylation in YG8 mouse brain tissues…...……...122 Figure 3.24: Histone acetylation in YG8 mouse brain tissues……...…...122

Daniah Trabzuni Page 11
Abbreviations
α Alpha
AMV Avian Myeloblastosis Virus
ATP Adenosine triphosphate
AVED Ataxia with isolated vitamin E deficiency
BAC Bacterial artificial chromosome
β Beta
cDNA Complementary DNA
CHCl3 Chloroform
ChIP Chromatin immunoprecipitation
CNS Central nervous system
CpG Cytosine phosphate guanine
CTCF CCCTC-binding factor
DM1 Myotonic dystrophy
DNA Deoxyribonucleic Acid
DNMTs DNA methyltranferases
DRG Dorsal root ganglia
DSBs Double-strand breaks
dsRNA Double-stranded RNA
EDTA Ethylene diamine tetra acetic acid
EGFP Enhanced green fluorescent protein
ES Embryonic stem cells
EtBr Ethidium bromide
Fe2+ Ferrous iron
Fe3+ Ferric iron
FRDA Friedreich ataxia
Fxn Mouse frataxin
FXN Human frataxin
GAPDH Glyceraldehyde 3-phosphate dehydrogenase
H Heart

Daniah Trabzuni Page 12
H2O2 Hydrogen peroxide
H3 Histone 3
H3K14ac Histone 3 lysine 14 acetylated
H3K27 Histone 3 lysine 27
H3K27me2,3 Histone 3 lysine 27 di- or trimethylated
H3K4 Histone 3 lysine 4
H3k4me2,3 Histone 3 lysine 4 di- or trimethylated
H3K9ac Histone 3 lysine 9 acetylated
H3K9me3 Histone 3 lysine 9 trimethylated
H4 Histone 4
H4K12ac Histone 4 lysine 12 acetylated
H4K16ac Histone 4 lysine 16 acetylated
H4K20ac Histone 4 lysine 20 acetylated
H4K5ac Histone 4 lysine 5 acetylated
H4K8ac Histone 4 lysine 8 acetylated
HATs Histone acetyltransferases
HBA2 Hemoglobin, alpha 2
HDACs Histone deacetylases
HDACi Histone deacetylases inhibitor
H-DNA Helical DNA
HEPES N-2-hydroxyethylpiperazine-N'-2-ethanesulfonic Acid
HMSN Hereditary motor and sensory neuropathy
HP1 Heterochromatin protein 1
IAA Isoamyl-alcohol
ISC Iron-sulphur clusters
IscU2 Iron scaffold protein
ISPs ISC-containing proteins
KCl Potassium Chloride
KO knockout
ΔYFH1 Knockout yeast frataxin homolog gene
MeCP2 Methyl CpG binding protein 2
Mg+2 Magnesium

Daniah Trabzuni Page 13
MMR Mismatch repair
MPP Mitochondrial processing peptidase
MRI Magnetic resonance imaging
mRNA Mature ribonucleic Acid
MRS Magnetic resonance spectroscopy
MSH2 DNA mismatch repair protein Msh2
MSH3 DNA mismatch repair protein Msh3
MSH6 DNA mismatch repair protein Msh6
MZ Monozygotic twins
NaCl Sodium chloride
NaHCO3 Sodium Bicarbonate
NER Nucleotide excision repair
NP-40 Nonidet P-40
OD Optical density
OH∙ Hydroxyl radical
OIZ Okazaki initiation zone
P Pancreas
PBS Phosphate Buffered Saline
PcG Polycomb group
PCR Polymerase chain reaction
PEV Position effect variegation
pH Negative logarithm of the concentration (mol/L) of the
H3O+[H+] ion; scale is commonly used over a range 0 to 14
Pol II RNA Polymerase II enzyme
RNA Ribonucleic Acid
RNAi RNA interference
RPI ROCHE protease Inhibitor
RT Room temperature
SACO Serial analysis of chromatin occupancy
SAGE Serial analysis of gene expression
SC Spinal cord
SCAs Spinocerebellar ataxias

Daniah Trabzuni Page 14
SDS Sodium dodecyl sulphate
SDS 2.1 Sequence Detection System computer program
shRNA Short hairpin RNA
TBE Tris-Borate-EDTA Buffer
TNRs Trinucleotide repeats
Tris-HCl Tris-hydroxymethylaminomethane
TRIZOL The brand name of a solution used in RNA/DNA/protein
extraction from Invitrogen. The correct name of the method is
Guanidinium thiocyanate-phenol-chloroform extraction
TrxG Trithorax complexes
UK United Kingdom
WT wild-type
YAC Yeast artificial chromosome
° C degree centigrade
3D Three dimensions

Daniah Trabzuni Page 15
Chapter 1
Introduction
1.1 Ataxia
The word ataxia originates from the Greek language meaning "lack of order".
It is a neurological dysfunction of motor coordination that can affect muscle
movements (Taroni and DiDonato 2004). Ataxia may affect the fingers and hands,
the arms or legs, the body, speech or eye movements. It is a specific clinical
manifestation implying dysfunction of parts of the nervous system that coordinate
movement. This includes cerebella, sensory, and vestibular ataxia. Several possible
causes exist for these patterns of neurological dysfunction, such as hereditary ataxia.
Dystaxia refers to difficulty in controlling voluntary movements (Harding 1984).
1.1.1 Inherited progressive ataxia disorders
There are different types of progressive ataxias. The inherited ataxias are
characterized by problems of balance and coordination, hearing and vision as well as
swallowing, slurred speech, weakening of the heart, diabetes, scoliosis (Box et al.
2005). There are two groups of hereditary ataxias. Firstly, autosomal recessive
ataxias, such as Friedreich ataxia (FRDA) and ataxia with isolated vitamin E
deficiency (AVED) disorders. These are mainly categorized by inactivating
mutations leading to loss of cellular protein function, which will affect the energy
process and oxidative stress in living cells. Secondly, autosomal dominant
spinocerebellar ataxias (SCAs). These are categorized primarily by an expansion of
CAG-triplet repeats in the coding region of the potential gene; this will cause an
excess production of longer polyglutamine mutant protein, termed gain of function
effect (Taroni and DiDonato 2004; Thompson 2008).

Daniah Trabzuni Page 16
The most common inherited progressive, neurodegenerative ataxia disorder in
the United Kingdom is Friedreich ataxia (FRDA) (Harding 1981; Delatycki et al.
2000; Puccio and Koenig 2002; Gomez-Sebastian et al. 2007).
1.2 Friedreich ataxia (FRDA)
Friedreich ataxia is a slow progressive, demoralizing ataxia (De Biase et al.
2007b) which can lead to life in a wheelchair and early death as a result of
cardomiopathy. It is a rare autosomal recessive disease, affecting males and females
equally (Andermann et al. 1976; Campuzano et al. 1996; Delatycki et al. 2000;
Pandolfo 2003).
1.2.1 The identification of FRDA
The identification of FRDA began in the 1850s, when Nicholaus Friedreich, a
professor of medicine, noted his observations on ataxia on nine members of three
families (Friedreich 1876; Friedreich 1877; Chakravarty 2003). In 1863, the disease
was first described by Friedreich in his published papers as a ‘degenerative atrophy
of the posterior columns of the spinal cord’ causing progressive ataxia, sensory loss
and muscle weakness, frequently associated with scoliosis, foot deformity and heart
disease (Friedreich 1863a,b; Friedreich 1863c; Pandolfo 1998). By the end of the
nineteenth century a significant number of cases were diagnosed as having FRDA
and the disorder was first discussed at the Medical Society of London in 1880.
1.2.2 Clinical Features
In Professor Nicholaus Friedreich’s time, and later in the nineteenth century,
there was a debate on the different diagnostic criteria for FRDA. It was extremely
important to have a strict set of diagnostic criteria to make sure that all of the patients
diagnosed with FRDA were fully suitable for further FRDA research studies.

Daniah Trabzuni Page 17
A different set of diagnostic criteria for FRDA proposed by Geoffroy
(Geoffroy et al. 1976) and Harding (Harding 1981) are shown in Table 1.1. The
diagnostic criteria of Harding are more liberal, allowing the diagnosis of FRDA in
the early stages of the disease (Delatycki et al. 2000).
Previously, patients observed with the following symptoms were considered
to be affected with FRDA. In most cases, the onset is around puberty (Harding 1981;
Muller-Felber et al. 1993; Pandolfo 2003). Early and late onset also exist (De
Michele et al. 1994; De Michele et al. 1996; Pandolfo 2003).
Table 1.1: Different diagnostic criteria for FRDA proposed by Geoffroy (Geoffroy et al.
1976) and Harding (Harding 1981). The table is adapted from (Delatycki et al. 2000).
Criteria Geoffroy et al, 1976 Harding, 1981
Primary
(essential
for
diagnosis)
1-Onset before the end of puberty.
(never after the age of 20years)
2-Progressive ataxia of gait.
3-Dysarthria.
4-Loss of joint position or vibration
sense.
5-Absent tendon reflexes in the legs.
6-Muscle weakness.
1-Age of onset of symptoms before the age of
25 years
2-Progressive unremitting ataxia of limbs and
of gait.
3-Absence of knee and ankle jerks.
Secondary
1-Extensor plantar responses.
2-Pes cavus.
3-Scoliosis.
4-Cardiomyopathy.
1-Dysarthria.
2-Extensor plantar responses.
Additional
If secondary criteria are absent, the following
have to be present:
1-An affected sib fulfilling primary and
secondary criteria.
2-Median motor nerve conduction velocities
of greater than 40 m/s thus excluding cases of
type I hereditary motor and sensory
neuropathy (HMSN).

Daniah Trabzuni Page 18
The main neurological symptoms are: loss of tendon reflexes in the lower
limb, spasm in lower limb, distal amyotrophy, scoliosis, dysarthria, nystagmus, pes
cavus, loss of sensory nerve action, loss of the central and peripheral sensory,
progressive limb and gait ataxia, impaired ambulation after 15-20 years from the
initial onset.
Heart disease plays a vital role in disability and early death. The most
common symptoms of heart disease are shortness of breath in 40% of the patients
and palpitation in 11% of FRDA patients. 10-25% of FRDA patients are more
susceptible to develop diabetes mellitus. 30% of FRDA patients develop optic
atrophy and 20% suffer from hearing loss (Boyer et al. 1962; Harding 1981;
Scrimgeour et al. 1996; Cossee et al. 2000; Delatycki et al. 2000; Pandolfo 2003).
In recent years, technological advances in the medical field have raised the
standard of the clinical evaluation of several complicated diseases such as FRDA,
consequently improving the routine diagnostic procedure of the disorder. Molecular
genetic tests for FRDA are available as a primary step for the diagnosis, followed by
other clinical assessments such as, magnetic resonance imaging (MRI) to assess the
degeneration in the brainstem, spinal cord and cerebellum (Pandolfo 2003; Della
Nave et al. 2008a; Della Nave et al. 2008b). Magnetic resonance spectroscopy
(MRS) is also used in the clinical assessment to measure very low quantities of
metabolites in vivo in skeletal muscle and heart (Pandolfo 2003).
1.2.3 Pathology
FRDA affects the central nervous system (CNS), heart, muscles and pancreas
in the human body (Figure 1.1) (Brice 1998; Taroni and DiDonato 2004). The
remarkable and first pathological changes occur in the dorsal root ganglia (DRG)
(Figure 1.2) when the large sensory neurons degenerate. Following this, loss of
axons in the posterior columns, spinocerebellar and pyramidal tracts of the spinal
cord occur (Harding 1984; Cossee et al. 2000; Simon et al. 2004; De Biase et al.
2007b). In addition, atrophy of the Clarke’s column, and the dentate nucleus of the

Daniah Trabzuni Page 19
cerebellum takes place (Delatycki et al. 2000; Pandolfo 2003; Seznec et al. 2004).
The large myelinated sensory fibres in peripheral nerves also degenerate (Pandolfo
2003; De Biase et al. 2007b). In a recent study, Della Nave and colleagues showed
that there is a significant loss of the white matter and grey matter in FRDA patients,
and these structural changes relate to the interval and the severity of the disease
(Della Nave et al. 2008a).
FRDA patients commonly develop heart disease; the most common cardiac
defect is hypertrophy (Delatycki et al. 2000). Hypertrophy is more common in
young and early onset patients and is milder in adult or late-onset patients (Seznec et
al. 2004). Five percent of the patients are affected with hypertrophic
cardiomyopathy for 2-3 years before they show any neurological symptoms (Harding
1981). The main clinicopathological symptoms of FRDA patients are mitochondrial
dysfunction and iron deposits in specific myocardial cells (Pandolfo 1998).
The full explanation of organ specificity of pathology in FRDA is still
inconclusive, but it can be clarified by the alignment of different patterns of frataxin
expression in different tissues. In addition, different requirements for different
tissues and frataxin in dealing with the iron accumulation and oxidative stress in the
mitochondria (Delatycki et al. 2000).
Figure 1.1: Overview of the main sites of neuronal loss and organ dysfunction in Friedreich ataxia. Prominent frataxin expression in the large primary sensory neurons of dorsal root ganglia. Pathological features are shown for the brain, spinal cord (SC), heart (H) presenting as cardiac hypertrophy and pancreas (P) presenting as diabetes. Large dots indicate more severe neuronal loss. Adapted from (Taroni and DiDonato 2004).
DRG

Daniah Trabzuni Page 20
1.2.4 Epidemiology and prevalence
FRDA has a prevalence of 1 in 50,000 in the Caucasian population (Lopez-
Arlandis et al. 1995). In addition, FRDA is found in North Africa, the Middle East
and India, although the incidence of the disease in the Far East, sub-Saharan Africa
and Native America is very low (Pandolfo 2003).
According to a study conducted by Scrimgeour and colleagues in 1996, the
prevalence of FRDA in the Middle East, specifically in Saudi Arabia is higher due to
the high rate of consanguinity (Scrimgeour et al. 1996).
1.2.5 Genetic background
1.2.5.1 Inheritance pattern
Neurodegenerative FRDA is an autosomal recessive trinucleotide repeat
disease (Pelletier et al. 2003; Taroni and DiDonato 2004; Wells et al. 2005; Hebert
2007; Hebert and Whittom 2007), which is caused by a pathological trinucleotide
repeat expansion. Between 96-98 % of FRDA patients are homozygous for a non-
Mendelian mutation, which is a pathological (GAA)n∙ (TTC)n expansion, in the first
intron of the frataxin (FXN) gene (previously known as FRDA or X25). This
pathological expansion contributes to reduce the expression level of frataxin protein
Figure 1.2:
Dorsal root ganglion neurons of
an embryonic rat (100X) (Paves
2003).

Daniah Trabzuni Page 21
by inhibiting the transcription of its corresponding gene (Pelletier et al. 2003; Seznec
et al. 2004; Taroni and DiDonato 2004; Al-Mahdawi et al. 2006).
2 to 4% of patients are compound heterozygotes, having an expanded repeat
in the first allele and a point mutation (missense or splice site mutation) or a
premature stop codon (non-sense mutation) in the second allele. All missense
mutations are in the C terminus, which is encoded by exon 4 and 5a (Section 1.2.5.5
page 26). These types of mutations will affect protein function or its interactions
with other molecules, stability (Section 1.2.5.6 page 28) or expression. Homozygous
point mutations will cause a lethal phenotype (Bidichandani et al. 1997; Cossee et al.
2000; Taroni and DiDonato 2004; Correia et al. 2006; Gottesfeld 2007; Hebert
2007).
1.2.5.2 FXN Gene mapping
In 1988, the Friedreich ataxia gene was mapped to Chromosome 9, then localized in
the long arm 9q13-21.1 by fine mapping and subsequent linkage studies (Figure 1.3)
(Pandolfo 2003; Seznec et al. 2004; Correia et al. 2006).
Figure 1.3:
Ideogram of the human chromosome 9. Cytogenetic Location of frataxin
gene: 9q21.1 (Yellow arrow). Molecular Location: base pairs 70,840,163 to
70,878,771 from pter (Mysid 2007).

Daniah Trabzuni Page 22
1.2.5.3 FXN Gene structure
The FXN gene encodes for the frataxin mitochondrial protein which is
composed of 210 amino acids (Campuzano et al. 1996; Cossee et al. 2000; Taroni
and DiDonato 2004). The FXN gene consists of seven exons spread over 95
kilobases (kb) of genomic DNA. Six exons (1,2,3,4,5a,5b) are coding regions and
one exon (exon 6) is non-coding. The gene is transcribed in centromere telomere
direction, the most common transcript is from the first five exons (1-5a) and it is 103
kb in size (Pandolfo 1998; Pandolfo 2003; Gomez-Sebastian et al. 2007). By
alternate splicing, another transcript, which is less common, from exon1-5b can be
generated to give a theoretical 171 amino acid protein (Figure 1.4) (Pandolfo 1998;
Delatycki et al. 2000).
1.2.5.4 FXN gene expression
The FXN gene is expressed in all cells (Pandolfo 2003), but it also shows
tissue specific differences in expression and it is developmentally regulated. Tissues
having the highest level of frataxin expression during development are the atrophied
tissues in FRDA patients (Jiralerspong et al. 1997; Pandolfo 1998).
In the adult human, frataxin expression is very high in heart, with
intermediate level in the liver, skeletal muscle, and pancreas. The highest expression
in CNS tissues occurs in the spinal cord, there is less expression in the cerebellum
and is further reduced in the cerebral cortex (Pandolfo 2003).
Figure 1.4:
FXN gene structure including exons, intron and the promoter region. In
addition to the GAA repeat location.

Daniah Trabzuni Page 23
In mice, the developing brain is highly loaded with frataxin mRNA, while the
mRNA level is less in the adult mouse brain (Pandolfo 2003). The frataxin
developmental expression has been tested by using Northen blot analysis and RNA
in situ hybridization. In the neuroepithelium, a very faint expression was detected at
embryonic day (E) 10.5, weak but detectable expression at E12.5 in the developing
central nervous system (Jiralerspong et al. 1997; Koutnikova et al. 1997), while at
E14.5 and post-natal time higher and constant expression was detected (Figure 1.5).
At E14.5–E16.5 high frataxin expression was detected in the central nervous
system (CNS), mainly in the spinal cord, forebrain and DRG (Figure 1.6).
Figure 1.5: Northern blot analysis of frataxin
mRNA in poly (A) RNA from total
mouse embryos. A 1.1-kb transcript is
present in E14, but not in E10 embryos.
A control hybridization of the same
Northern blot with a β-actin probe is
shown on the right. The position of RNA
size markers is indicated on the left.
Adapted from (Jiralerspong et al. 1997).
Figure 1.6: Frataxin expression at E16.5. Strong
expression is observed in the spinal cord
(boxed area 1), in the forebrain (boxed
area 2), in the dorsal root ganglia (drg), in
the atria of the heart (boxed area 4), and
in epithelial tissues, such as the tooth
primordium of the lower incisor (boxed
area 3). Expression is also observed in the
midbrain and hindbrain (hbr) regions.
Adapted from (Jiralerspong et al. 1997).

Daniah Trabzuni Page 24
The highest level of frataxin expression was observed in spinal cord and large
neuronal cells of the dorsal root ganglia (Figure 1.7a) (Jiralerspong et al. 1997;
Koutnikova et al. 1997; Delatycki et al. 2000). A high level of frataxin was
observed in proliferating cells in the cortical plates, in the heart, in the axial skeleton
(Figure 1.7b), in thymus, in some epithelial (skin, teeth) and in fat brown tissues
(Figure 1.6) (Delatycki et al. 2000; Pandolfo 2003). The presence of frataxin
expression in the axial skeleton of the mouse embryo may be related to scoliosis,
which is seen in most FRDA patients as a main clinical feature (Jiralerspong et al.
1997). However, differences in the frataxin expression system between human and
mouse are considered likely.
Figure 1.7:
Frataxin expression in developing dorsal root ganglia.
Hybridization of a frataxin antisense riboprobe to sagittal sections
through the lower thoracic dorsal root ganglia of an E14.5 embryo. A,
Strong expression is detected in large round cells in the dorsal root
ganglia (drg) and in elements of the axial skeletons, including the
cartilage primordia of ribs and vertebral bodies (arrow). B, Frataxin
expression is strong in the cartilage primordia of vertebral bodies (vrt),
but is absent in intervertebral discs (ivd). Notice also expression in the
spinal cord (spc). Adapted from (Jiralerspong et al. 1997).
a b

Daniah Trabzuni Page 25
Generally, the frataxin mRNA level is higher in mitochondria-rich cells, such
as neurons and cardiomyocytes (Koutnikova et al. 1997; Pandolfo 2003). The
reduced level of mRNA causes the inhibition of the gene transcription process, and
not at the post-transcriptional RNA stage.
In addition, when the protein level was tested by western blot, the results
showed a high frataxin level present in human and mouse brain and cerebellum
(Pandolfo 2003). In FRDA patients the protein level was very low in cerebral cortex,
skeletal muscle, and lymphoblasts (Cossee et al. 2000; Delatycki et al. 2000).
However, the presence of the frataxin protein at a very low level is important to
allow the viability of the FRDA patients and the slowly progressive nature of the
human disease (Cossee et al. 2000).
Individuals who are heterozygous for the (GAA)n∙(TTC)n expansion have
around 50% of normal FXN mRNA and frataxin protein level (Herman et al. 2006).
FRDA patients express 5-35% of the normal level of frataxin, emphasizing the
relationship between the frataxin level, disease phenotype and the size of the
(GAA)n∙(TTC)n repeats (Pook et al. 2001; Coppola et al. 2006). Also an earlier
study demonstrated the inverse correlation between the length of the (GAA)n∙(TTC)n
repeats and the amount of RNA in vivo and in vitro (Delatycki et al. 2000; Sakamoto
et al. 2001).
Frataxin is an essential protein for survival, it is found in living organisms
starting from purple bacteria to human (Musco et al. 2000). This protein has an
important role during embryonic development. In FRDA patients, with lower levels
of frataxin than normal, only those cells that are dependent on frataxin at some stage
of their development are affected (Pandolfo 2001). While the complete absence of
frataxin causes early stage embryo cell death. Cossee and colleagues observed this
during the experimental stage of generation of a mouse model for the disease. The
group stated that the homozygous frataxin knock-out mice die at E7.5 (Cossee et al.
2000; Pandolfo 2001). The lethality problem was solved when Dr. Mark Pook and
his group, succeeded in generating a rescued transgenic mouse with the normal
human FXN gene (Pook et al. 2001). More details about this mouse and other FRDA
mice models are covered in the “Animal Model” section (1.4).

Daniah Trabzuni Page 26
1.2.5.5 Frataxin structure
In recent years, many researchers have dedicated their time and effort to build
up the knowledge about frataxin protein structure based on biochemical experiments.
This knowledge will lead to a clearer understanding of the protein, function and,
more importantly, the role of frataxin deficiency in causing the clinical symptoms of
the disease, eventually hoping to develop an effective therapy for Friedreich ataxia.
Human frataxin is a nuclear encoded mitochondrial protein (Delatycki et al.
2000) expressed in the cytoplasm. Before its entry to the mitochondria it is
processed by an enzyme known as mitochondrial processing peptidase (MPP).
Firstly, MPP cleaves the protein to intermediate form of, ~17kDa, which contains
(56-210 amino acids). Secondly, the intermediate form has self-cleavage function
that results in the mature frataxin protein (75 to 81-210 amino acids), ~14kDa in size
that approximately equals 130 amino acids of protein. The latter is found in the
mitochondria matrix (Branda et al. 1999; Dhe-Paganon et al. 2000; Musco et al.
2000; Babady et al. 2007).
The mature frataxin sequence contains: N-terminal and C-terminal
sequences. The N-terminal region is an unstructured and non-conserved region that
contains the mitochondrial import sequence. This region does not affect the folding
stability of the C-terminal. The C-terminal domain is the conserved region that can
independently fold in to a compact α-β sandwich and has no grooves or cavities.
The α-β sandwich composed of an N-terminal α helix, middle β sheet that
contains seven β strands and a C-terminal α helix. The axis of the two helices are
parallel to each other and to the β sheet (Figure 1.8) (Gordon et al. 1999; Dhe-
Paganon et al. 2000; Musco et al. 2000; Pandolfo 2001).
Hydrophobic amino acids are gathered (hydrophobic core) at the edge of β
sheet and on the side of two helices contributing to form a stable folded protein by
creating a significant charge dipole. The 12-amino acids residues form an anionic
surface on the protein. Frataxin is a monomeric protein in solution (Dhe-Paganon et
al. 2000; Musco et al. 2000).

Daniah Trabzuni Page 27
Although it had been confirmed by many research studies that frataxin is
involved in iron metabolism in the mitochondria, because of the iron accumulation in
the mitochondria in case of frataxin deficiency in cells (Babady et al. 2007; Bencze
et al. 2007; Hebert 2007), the monomer structure of frataxin does not have any cavity
or pocket to hold the iron molecule. In addition, the presence of high affinity iron-
binding sites in the frataxin structure has not been proved experimentally.
Therefore, the presence of the conserved negatively charged side on the
protein surface can be a possible site for positively charged iron to bind (Musco et al.
2000; Pandolfo 2001).
Figure 1.8:
Structure of frataxin. Ribbon diagrams showing the fold of frataxin,
a compact α β sandwich, with helices colored turquoise and β strands
in green. Strands β1–β5 form a flat antiparallel β sheet that interacts
with the two helices, α1 and α2. The two helices are nearly parallel to
each other and to the plane of the large β sheet. A second, smaller β
sheet is formed by the C terminus of β5 and strands β6 and β7.
Adapted from (Dhe-Paganon et al. 2000).

Daniah Trabzuni Page 28
1.2.5.6 Frataxin function
Research to date has not provided a clear understanding of frataxin function.
However, numerous studies have reported and hypothesized that frataxin is a vital
mitochondrial protein (Pandolfo 1998; Delatycki et al. 2000; Miranda et al. 2002;
Simon et al. 2004; Al-Mahdawi et al. 2006; Hebert 2007) playing an important role
in: mitochondrial iron homeostasis (Foury and Cazzalini 1997), iron storage (Gakh et
al. 2006), iron transport, anti-oxidant activity (Karthikeyan et al. 2003), and
biosynthesis of heme and iron sulphur (Fe-S) clusters (ISCs) (Huynen et al. 2001;
Lesuisse et al. 2003; Pandolfo 2006; Babady et al. 2007). It had been reported that
frataxin’s function cannot be perceived by its amino acid sequence (Pandolfo 1998)
Twenty years ago, iron deposits in myocardial cells from FRDA patients and
iron accumulation in the dentate nucleus in the CNS had been reported (Lamarche et
al. 1980; Waldvogel et al. 1999; Pandolfo 2003). Another observation confirmed a
reasonable increase in iron concentration in the mitochondria from FRDA fibroblast
cells (Delatycki et al. 1999; Pandolfo 2001). Oxidative stress was also observed in
FRDA patients by measuring the increased concentration of lipid peroxidation,
dihydroxybenzoic acid, and malondialdehyde in the plasma and 8-hydroxy-2-
deoxyguanosine level in the urine. FRDA fibroblasts showed higher sensitivity to
low doses of hydrogen peroxide (H2O2) than normal cells. It induced cell shrinking,
nuclear condensation, and cell death (Delatycki et al. 2000; Simon et al. 2004;
Pandolfo 2006).
It is well known that the primary information about frataxin function was
obtained from the knockout yeast frataxin homolog gene (ΔYFH1) model. This
model was developed, in 1997, to study genes involved in cellular iron metabolism
(Foury and Cazzalini 1997; Koutnikova et al. 1997; Delatycki et al. 2000; Seznec et
al. 2004). ΔYFH1 as the model helped researchers to prove the occurrence of
mitochondrial dysfunction in vivo in FRDA patients (Rotig et al. 1997; Pandolfo
2003). Relative to that, there is much evidence suggesting that FRDA is a result of
mitochondrial iron accumulation causing cell death by the production of free radicals
which are toxic to the cell (Figure 1.9). This is called the Fenton reaction:

Daniah Trabzuni Page 29
Fe2+ + H2O2 Fe3+ + OH‾ + OH∙
This reaction produces a hydroxyl radical OH∙ that will become toxic by
reacting with many intracellular component such as, protein, DNA, carbohydrate,
and membrane lipids (Delatycki et al. 2000; Puccio and Koenig 2002).
In 2003, Pandolfo proposed a similar pathogenic pathway (Figure 1.10).
When less frataxin is available in the mitochondria, it directly affects the
iron-sulphur clusters (ISC) synthesis, which causes the inhibition of iron export and,
Figure 1.9:
Suggested pathogenesis of FRDA.
A, The normal situation in the mitochondrion is shown with iron influx
and efflux maintaining low mitochondrial iron (Fe) and free radical (OH)
levels. Frataxin is likely to be acting directly at the level of iron efflux.
B, Reduced frataxin results in inhibition of the efflux of mitochondrial
iron. This leads to reduced cytosolic iron, which results in induction of
iron uptake systems and this in turn results in further iron uptake into
mitochondria. Explanation modified from (Delatycki et al. 2000).

Daniah Trabzuni Page 30
Figure 1.10: Diagram showing the Pandolfo hypothesis about the cellular affect
of frataxin efficiency in causing the mitochondrial dysfunction.
as a result, iron accumulation. Accumulated iron generates free radicals that cause
extra damage to ISCs and decrease the enzyme activities of ISC-containing proteins
(ISPs) such as aconitase. As a consequence, the activities of the respiratory
complexes and Krebs cycle enzymes are decreased. This is followed by a further
increase in the free radical production (Pandolfo 2003; Pandolfo 2006) that
ultimately leads to impaired oxidative phosphorylation (Kulkarni and Wilson 2008).
The way that frataxin deficiency controls iron homeostasis and ISC synthesis
is still debatable. Some studies showed that frataxin directly influences the iron
efflux. Other studies revealed indirect ways, as frataxin can either function as a
carrier of antioxidant, a chaperone or an adapter of protein import processing (Rotig
et al. 1997; Musco et al. 2000). It is well known that frataxin function is involved in
a multi-step cycle process in the mitochondria. Some studies have indicated that
frataxin may act indirectly as a tumour suppressor gene (Hebert and Whittom 2007).
In 2000, Dhe-Paganon and colleagues performed a crystal structure study; the
study reveals that frataxin monomer has a novel folding profile, and it is binding
non-specifically to the iron. In addition, results show that one iron atom binds to a

Daniah Trabzuni Page 31
frataxin molecule at His -177. His-177 is a non conserved and a solvent exposed
side chain, for these reasons, the iron binds to it loosely (Figure 1.11). In conclusion,
frataxin binds to iron to utilize the acidic patch on its surface (Dhe-Paganon et al.
2000). Another study showed that the binding capacity for a subunit of frataxin is
ten iron atoms (Taroni and DiDonato 2004), while Nair and colleagues claimed that a
frataxin molecule can bind to six or seven iron atoms (Nair et al. 2004).
Recent research experiments confirmed the binding of the frataxin to the
mitochondrial iron scaffold protein IscU2 to deliver the iron to the IscU2, and this is
an initial step in ISC clusters synthesis. Equally, frataxin binds to ferrochelatase, an
enzyme needed to process last step in the heme synthesis. These results were only
observed in the presence of the iron atom (Napoli et al. 2006; Babady et al. 2007;
Bencze et al. 2007).
Recently, microarray analysis of FRDA cells revealed a decrease in the
expression of many genes involved in sulphur amino acid and ISC pathways. While
another group of genes that related to apoptosis were up-regulated (Seznec et al.
2004; Taroni and DiDonato 2004; Babady et al. 2007).
It is important to mention that the frataxin level is altered by the (GAA)n∙
(TTC)n repeat expansion, while the frataxin function is directly affected by the
Figure 1.11:
Iron binding. Adjacent
frataxin molecules are colored
green and yellow. Iron, depicted
as a red sphere, is coordinated
to His-177. Distances in Å
(dotted lines) are between the
nucleus of iron and its closest
neighbours. Adapted from
(Dhe-Paganon et al. 2000).

Daniah Trabzuni Page 32
heterozygous point mutations. Point mutations affect the fold stability, by reducing
the thermodynamic stability and refolding ability of the protein molecule. As a result
there is less functional frataxin in the mitochondria and more degradation of the
mature frataxin (Figure 1.12) (Musco et al. 2000; Correia et al. 2006). An alteration
of the surface charge and eventually protein polarity has also been suggested (Dhe-
Paganon et al. 2000).
Figure 1.12:
Diagram showing some of the ways that an amino-acid mutation can
disrupt a protein’s structure or function. The protein chains are
depicted as curvy green tubes with the location of the mutation indicated
by a red beacon. 1, A mutation that introduces a stop codon into the
protein-coding region results in a truncation of the sequence, which might
prevent it from folding or cause it to lose one or more of its functional
domains. 2, A mutation to a residue in the protein’s core, or one that
disrupts either a region of secondary structure or a disulphide bond, can
also prevent the protein folding, possibly leading to aggregation. 3, One
of the protein’s catalytic residues is altered, disrupting its function. 4-7,
Mutations that disrupt the protein’s interactions with other molecules:
metal binding (4), binding to ligand (5), disruption of dimerization (6),
and binding to, or specific recognition of, DNA (7). Adapted from
(Laskowski and Thornton 2008).

Daniah Trabzuni Page 33
In summary, to improve a rational therapy for FRDA patients it is necessary
to focus on specific research on a cellular level, which will help to fully understand
human frataxin structure and function in the mitochondria.
1.2.5.7 The Pathogenic (GAA)n∙(TTC)n repeats
The polymorphic (GAA)n∙(TTC)n trinucleotide repeats occur within an Alu
sequence in the first intron (1.4 kb after exon 1) of the FXN gene. These
trinucleotide repeats are present in normal individual alleles, but if these repeats go
above certain threshold they will become pathogenic. Normal alleles have
(GAA)n∙(TTC)n repeats ranging from 6 up to 36 repeats, while FRDA alleles have
expanded repeats ranging from approximately 66 to more than 1700 repeats. The
longer the repeat is, the more severe the disease (Delatycki et al. 2000; Pandolfo
2003; Taroni and DiDonato 2004; Al-Mahdawi et al. 2006; Herman et al. 2006;
Gottesfeld 2007). Alleles that have repeats larger than those in normal alleles and
smaller than those in FRDA alleles (larger than 36-and less than 66), are called
premutation alleles or borderline alleles. Premutation alleles, present in around 1 %
of chromosomes, tend to have a large expansion in one generation, but in most cases
they are not pathogenic because the second allele inherited from the other parent is
expected to be normal (Friedreich 1876; Delatycki et al. 1998).
The triplet (GAA)n∙(TTC)n repeats in normal alleles can be categorized into
two classes of alleles. First, short normal alleles, which comprise about 80-85% of
chromosomes in Caucasians, and contain (GAA)n∙(TTC)n repeats ranging from 6 to
12 repeats. Second, large normal alleles, about 15% of chromosomes in Caucasians,
and contain uninterrupted (GAA)n∙(TTC)n repeats ranging from 12 to 36 repeats.
The mechanism of the sudden expansion of the repeats from small normal alleles to
large normal alleles is ambiguous, but it is been strongly suggested that the expanded
FRDA alleles are raised from large normal alleles. Large normal alleles had been
observed to hyper-expand to hundreds repeats in one generation. Few large normal
alleles, which are interrupted by hexanulceotide repeat (GAGGAA), are stable from
generation to generation (Delatycki et al. 2000; Pandolfo 2003). From a population

Daniah Trabzuni Page 34
genetics view it has been noticed that in Japan and China there is no (GAA)n∙(TTC)n
repeat expansion, no large normal alleles, and consequently no FRDA disorder
(Pandolfo 1998).
Recently, it has been found that (GAA)n∙(TTC)n repeat is correlated with a
transcriptionally silent chromatin and DNA replication, also it is contributing to
mediate position effect variegation (PEV) (Saveliev et al. 2003; Baralle et al. 2008).
1.2.5.8 The (GAA)n∙(TTC)n repeat expansion and instability
The expansion and the instability of the repeat have a significant role in the
progression process of the disease. (GAA)n∙(TTC)n repeat is an unstable mutation
when it is transmitted from parent to child. When the repeat is transmitted
paternally, it tends to contract by ~ 20 to 30% (Pollard et al. 2008). FRDA male
carriers have smaller (GAA)n∙(TTC)n repeats in spermatazoa than (GAA)n∙(TTC)n
repeats in lymphocytes. In the case of maternal transmission, the (GAA)n∙(TTC)n
repeat is equally as likely to contract or expand. The size of the contraction is bigger
when it is transmitted to a homozygote than when it is transmitted to a carrier. In
addition, the sperm of a premutation carrier has been shown to contain a smaller
(GAA)n∙(TTC)n repeats than that within his leucocytes, and his son’s smaller allele
contains even less (Delatycki et al. 2000; Sharma et al. 2002; Pandolfo 2003).
From previous findings, it was concluded that when the expansion occurs it
leads to instability (Pianese et al. 1997; Pandolfo 2001). The instability of the
(GAA)n∙(TTC)n repeats is meiotic and mitotic, and it is pre or postzygotic. The
mitotic instability of the expanded (GAA)n∙(TTC)n repeats causes somatic
mosaicism for expansion sizes noted in the fibroblasts, leukocytes, and brain of
FRDA patients. This somatic mosaicism is the possible reason for the variability in
the phenotype between different individuals with the same diagnosis (Delatycki et al.
2000; Sharma et al. 2002; Pandolfo 2003; De Biase et al. 2007a; De Biase et al.
2007b; Mirkin 2007; Pollard et al. 2008).

Daniah Trabzuni Page 35
Sharma and colleagues have conducted a further study on a significant
number of FRDA patients investigating the (GAA)n∙(TTC)n triplet repeat instability
in vivo. They have shown a high level of somatic instability in the FRDA peripheral
leukocytes, with a threshold length for somatic instability ranging from 26 to 44
uninterrupted (GAA)n∙(TTC)n repeats in vivo. A proportional relationship between
the somatic instability and the (GAA)n∙(TTC)n repeat length has been demonstrated;
the longer the allele is, the more variable it is. Two other remarkable findings were
that large expanded (GAA)n∙(TTC)n alleles, which contain more than 500 repeats,
have a high affinity to contract largely, whereas shorter alleles, which contain less
than 500 repeats, illustrated the affinity to expand. The large expanded alleles rarely
can regress to the normal or premutation size range, as observed in peripheral blood
cells and sperm. However, these results were not seen when the study was continued
to investigate the somatic instability in lymphoblastoid cell lines (Baldi et al. 1999;
Sharma et al. 2002; De Biase et al. 2007a; Pollard et al. 2008).
In the dorsal root ganglia, the most affected tissue; there is a high tendency
for a large expansion. However, all other human tissues show a contraction bias (De
Biase et al. 2007a; Pollard et al. 2008). In addition, a recent study indicates that the
somatic instability is age-dependent and tissue specific in cerebellum and DRG in
transgenic mouse (Clark et al. 2007). DRG shows a very high tendency to expand
and a low tendency to contract. The progressive accumulation of (GAA)n∙(TTC)n
expansions together with a low frequency of a large contraction, especially in DRG
of FRDA patients, is due to the somatic instability (De Biase et al. 2007a).
Furthermore, somatic instability mostly takes place after early embryonic
development and progresses throughout life (De Biase et al. 2007b). As a result,
progressive somatic instability is contributing to the pathogenesis and progression of
the disorder.
Studies have shown that several cis-elements and trans-acting DNA
metabolic proteins, including the orientation and the position of the repeats in
relation to the replication origins, cooperate in influencing the instability of the
(GAA)n∙(TTC)n repeats (Baldi et al. 1999; Krasilnikova and Mirkin 2004; Napierala
et al. 2005; Pearson et al. 2005; Mirkin 2007; Pollard et al. 2008). An example of a

Daniah Trabzuni Page 36
cis-element that may affect the instability is DNA methylation. DNA methylation
can alter DNA structure, protein binding, differentiation, and cellular activity
(Pearson et al. 2005).
Further substantial investigations on the instability mechanisms have been
conducted by different laboratories and many evidences confirm the involvement of
the non B-DNA structures and triplexes in the genetic instability behaviour and DNA
repair-recombination function. The results revealed that the conformation of the non
B-DNA structures in vivo, which are localized in the repeat tracts and in the flanking
sequence, is responsible for the genetic instability behaviour. In addition, these
structures enhance the slippage of the DNA complementary strands. Furthermore,
slipped DNA and unusual DNA structures act as targeted substrates to be recognized
by repair proteins such as MSH2 and enzymes (more details are covered in section
1.2.5.9) (Wells et al. 2005; Wells 2008). Further specific studies, for better
understanding of these phenomena, are essential to precedent to a better treatment
approach.
1.2.5.9 (GAA)n∙(TTC)n repeat expansion molecular mechanism and DNA
replication, repair, and recombination
During the last few years, evidence has indicated that the (GAA)n∙(TTC)n
repeat expansion is mediated by DNA replication, followed by the contribution of
several enzymes involved in DNA repair, double-strand breaks (DSBs) and the
influence of recombination processes. In addition, it had been recognized that simple
repeating sequences have the tendency to adapt triplexes, slipped structures and other
unusual conformations (non-B DNA), which are involved in the expansion
mechanism (Wells et al. 2005). Mismatch repair (MMR), nucleotide excision repair
(NER), DNA binding repair and DNA polymerases are considered factors that are
involved in the expansion mechanism (Sinden et al. 2002).
During transcription and replication processes, the DNA duplex unwinds,
thus the chance for the single strand DNA (which contains the repeat sequence) to

Daniah Trabzuni Page 37
fold back in an alternative way and form different non-B DNA structures is high. As
a result expansion takes place because of the stability of the misaligned intermediates
(Wells et al. 2005).
Extensive studies have proposed molecular models of how expansions arise,
for example, Kunkel proposed the first model in 1993. This model was based on
DNA strand slippage during replication (Kunkel 1993). The denaturation and
renaturation processes of expanded repeat, which contains double stranded DNA
fragments, promote the ‘Slipped-stranded’ DNA formation. Slipped DNA has a
different stability and different degree of flexibility. In some studies, it had been
shown that the binding of a slipped DNA structure to certain repair proteins such as
MSH2 and other recombination repair proteins can lead to DSBs. Later, the concept
of an unusual DNA structure formation, from all expandable repeats, was recognized
(Figure 1.13, A-E) (Baldi et al. 1999; Wells et al. 2005; Mirkin 2007).
(GAA)n∙(TTC)n repeats have the ability to form both inter- and intra-
molecular triplexes. The homopurine-homopyrimidine repeat can form an
intramolecular triplex called H-DNA under the influence of negative super-coiling,
the presence of Mg+2 and neutral pH. Furthermore, another structure that can be
formed with longer forms of this repeat which is called sticky DNA form (Figure
1.13, D) (Gacy et al. 1998; Sinden et al. 2002; Mirkin 2007; Wells 2008).
The sticky DNA structure was discovered in 1999. It is a self-associated
complex that is formed by the combination of two long (GAA)n∙(TTC)n repeats in
the R∙R∙Y triplex construction . The pyrimidine strands in the two R∙R∙Y triplex
constructions are exchanging with each other to form an extremely stable unusual
structure. The formation of the sticky DNA structure required the same conditions
that influence the triplexes structure formation. Sticky DNA structure of the
(GAA)n∙(TTC)n repeats is involved in inhibiting DNA replication, transcription and
regulating gene expression and DNA metabolism (Sakamoto et al. 2001; Wells et al.
2005; Baralle et al. 2008).
In addition, It has been suggested that the formation of unusual DNA
structures in vitro can cause DNA polymerisation blockage. This blockage assists

Daniah Trabzuni Page 38
misalignment between newly synthesized and template DNA strands, which leads the
repeat to expand (Pelletier et al. 2003; Mirkin 2007). Furthermore, mutations that
affect DNA repair increase the probability of the repeat expansion.
Figure 1.13:
Unusual DNA structures formed by all expandable repeats.
The structure-prone strand of the repetitive run is shown in red, its
complementary strand in green, and flanking DNA in beige. Different
expandable repeats have the ability to form unusual DNA structures. A,
(CNG)n repeats (in red) form an imperfect hairpin structure. B, (CGG)n
repeats form a quadruplexlike structure. C, (CTG)n•(CAG)n repeat form
a slipped-stranded structure (in red) and the complementary (in green).
D, (GAA)n•(TTC)n repeats form H-DNA and sticky DNA structures
where the homopurine strand formed triplex structure. Black asterisks
indicate Reverse Hoogsteen pairing. E, (ATTCT)n•(AGAAT)n repeats
form a DNA-unwinding element (Mirkin 2007).

Daniah Trabzuni Page 39
Negative super-coiling density is an important factor in the expansion
mechanism; the higher the level of the negative super-coil density, the more stable
the non-B DNA structure is, and the greater the probability of the expansion to occur.
A significant study demonstrated the role of the negative super-coiling density on the
instability of triplet repeats in vivo. An increase in the negative super-coiling density
stimulates the triplet repeats instability by accelerating the formation of stable non-B
DNA structures (Napierala et al. 2005; Wells 2008).
For a relatively short single strand of (GAA∙TTC)9-23 repeats, the formation
of intramolecular triplex structure takes place and its instability increases with the
increase of the super-coiling density. Moreover the (GAA∙TTC)42 repeats can form a
very stable bi-triplex structure (Sinden et al. 2002; Potaman et al. 2004; Napierala et
al. 2005; Wells et al. 2005).
Investigating the mechanisms of the trinucleotide repeat expansion led to the
recognition of DNA replication, recombination and repair processes contribution in
the repeat instability mechanism (Napierala et al. 2005). Figure 1.14 shows a model
of how all these processes can contribute to influence the instability and finally
causing the disease (Figure 1.14).
Figure 1.14:
Model for the role of different biology processes in vivo
and how it affects the instability of the expanded repeats.

Daniah Trabzuni Page 40
1.2.5.9.1 DNA replication
Many studies suggest that the repeat expansion arises during the DNA
replication process for two main reasons. Firstly, there is a rapid accumulation of
repetitive DNA because of substantial amount of DNA synthesis. Secondly, the fork
replication progression part of the lagging strand template tends to be single
stranded, and this facilitates the formation of DNA unusual secondary structures
(Mirkin 2007). These secondary structures cause DNA polymerase to halt causing
the collapse of replication fork to occur; and finally the involvement of DNA repair
and recombination processes to help restart the replication process (Wells et al.
2005). Following what has been mentioned previously, the super-coiling dependent
non-B DNA structure formation can stop the replication fork progression; which can
lead to nicks or double strand break formation and slippage events. In addition, the
unusual structures that exist on the leading or lagging strand during DNA replication,
can be avoided by DNA polymerases causing repeat instability (Napierala et al.
2005; Pearson et al. 2005; Gakh et al. 2006).
To demonstrate the effect of triplet repeat on replication fork progression a
direct study was carried out in vivo, in a eukaryotic system (Pelletier et al. 2003). In
2004, an experimental study demonstrated that the expanded (GAA)n∙(TTC)n
repeats attenuate the replication fork progression in vivo, considering the length, the
distance from the origin of replication and the orientation of the (GAA)n∙(TTC)n
repeats. The effect of the (GAA)n∙(TTC)n repeats is orientation dependent when the
homopurine strand of the repeats is in the lagging strand template for the replication
process. Furthermore, it had been proven that the replication blockage does not
depend on the transcription status in vitro. In addition, it had been assumed that the
(GAA)n∙(TTC)n expansion, which arises after replication stalling, is positioning in
the leading and lagging strands template (Krasilnikova and Mirkin 2004; Mirkin
2007; Pollard et al. 2008).
Three hypotheses have been introduced by Mirkin and others to link the
repeat expansion steps with the orientation and the position of this repeat through the
replication process (Mirkin 2007). The first hypothesis, “ori switch” it suggests that
the inactivation of the replication origin on one side of the repeat is associated with

Daniah Trabzuni Page 41
Figure 1.15: Three hypotheses to explain early events in repeat expansions.
The structure-prone strand of the repetitive run is shown in red, its
complementary strand in green, and flanking DNA in beige. a, In the ori-switch
model, the replication origin (shown in orange) in the repetitive region is
reversed to be on the other side. That will cause the inactivation of the
replication origin on one side and the recognition of the repetitive run as the
lagging-strand template. b, In the ori shift model, changing the position of the
repetitive run within the OIZ (shown as blue brackets) is leading to change its
location in respect to the replication origin because of a mobile element
insertion (blue rectangle) . This will help to evoke the repeat expansion process.
c, The fork-shift model arises when an epigenetic event within the repeat (blue
oval) occurs. This event will cause in changing the repeat position in the OIZ
region and result in the repeat expansion. (Mirkin 2007).
the activation of a cryptic origin on the other side; thus triggering the repeat
expansion by placing the structure prone strand of the repetitive run as the lagging
strand (Figure 1.15a). The second “ori shift” hypothesis assumes that the repeat
expansion depends on the position of the repeat within the Okazaki initiation zone
(OIZ), which is always single stranded, so changing the distance between the repeat
and the replication origin could enhance the expansion to occur (Figure 1.15b). The
third hypothesis, is the “fork shift” model; this hypothesis presumes that changing
the mode of the replication fork, by epigenetic event in the region of the repeat, could
change the position of the repeat within the OIZ; as a result expansion takes place
(Figure 1.15c) (Mirkin 2007).
Daniah Trabzuni Page 42
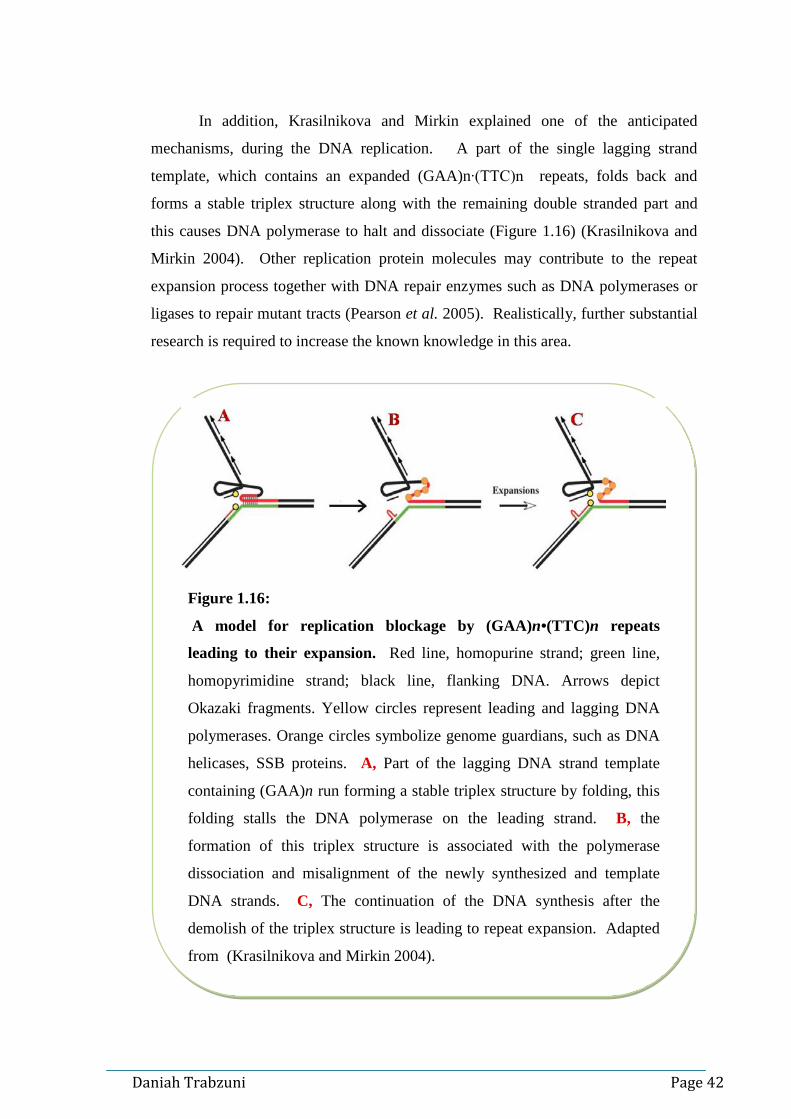
In addition, Krasilnikova and Mirkin explained one of the anticipated
mechanisms, during the DNA replication. A part of the single lagging strand
template, which contains an expanded (GAA)n∙(TTC)n repeats, folds back and
forms a stable triplex structure along with the remaining double stranded part and
this causes DNA polymerase to halt and dissociate (Figure 1.16) (Krasilnikova and
Mirkin 2004). Other replication protein molecules may contribute to the repeat
expansion process together with DNA repair enzymes such as DNA polymerases or
ligases to repair mutant tracts (Pearson et al. 2005). Realistically, further substantial
research is required to increase the known knowledge in this area.
Figure 1.16:
A model for replication blockage by (GAA)n•(TTC)n repeats
leading to their expansion. Red line, homopurine strand; green line,
homopyrimidine strand; black line, flanking DNA. Arrows depict
Okazaki fragments. Yellow circles represent leading and lagging DNA
polymerases. Orange circles symbolize genome guardians, such as DNA
helicases, SSB proteins. A, Part of the lagging DNA strand template
containing (GAA)n run forming a stable triplex structure by folding, this
folding stalls the DNA polymerase on the leading strand. B, the
formation of this triplex structure is associated with the polymerase
dissociation and misalignment of the newly synthesized and template
DNA strands. C, The continuation of the DNA synthesis after the
demolish of the triplex structure is leading to repeat expansion. Adapted
from (Krasilnikova and Mirkin 2004).

Daniah Trabzuni Page 43
1.2.5.9.2 DNA repair
Although the genetic link between the defect in DNA repair pathways and
neurological diseases has been established, many substantial studies have been
conducted to give a conclusive proof of the DNA repair contribution in the repeat
expansion mechanisms (Wells et al. 2005; Kulkarni and Wilson 2008).
The DNA repair pathways are meant to be a protective process for the
genomic material against different types of mutations and any irregularity in these
pathways causes the propagation of genomic instability. In non-replicating
differentiated cells such as neurons, the loss of genomic integrity leads to cell death
followed by tissue degeneration. Moreover, in these non-dividing cells the
replication-dependent recombination repair process is not plausible; consequently
cells utilize DSBs, MMR and NER as a viable repair mechanisms to maintain the
genomic integrity in the cell (Kulkarni and Wilson 2008). Subsequently, if there are
any repetitive DNA intermediates left unrepaired after the replication fork passes on;
the expansion of these intermediates takes place (Mirkin 2007).
Some experiments have showed that in aging non-dividing cells, such as
human and mouse brain and skeletal muscle cells, the repeat expansion takes place
during DNA repair process of DNA nicks or gaps which is created by oxygen
radicals (Figure 1.17, page 44) (Mirkin 2007).
Repair of (DSBs), which are induced by replication pause, has a contribution
to the repeat instability through gene conversion and single strand annealing (Pearson
et al. 2005).
The effect of the DSB repair on the (GAA)n∙(TTC)n repeat somatic
instability considering its location to the repeat tracts has been investigated by a
recent study in mammalian cells (Pollard et al. 2008). Pollard and colleagues
revealed that when the DSB repair is within (in the center or off-center) the
(GAA)n∙(TTC)n repeat tract, the frequency of the instability (deletion of nearly half
of the repeat tract) increases significantly. Whereas, when the DSB repair is
immediately outside the repeat tract the frequency of the instability is not affected.

Daniah Trabzuni Page 44
From these results, it was concluded that the DSB repair process is dependent
on the physical properties of the repeat tract.
Figure 1.17:
Gap repair model for repeat expansions in non-dividing cells.
The structure-prone strand of the repetitive run is shown in red, its
complementary strand in green, and flanking DNA in beige.
a, In the repetitive run a small gap is generated by an oxidizing radicals.
b, Hairpin structure is formed at a repetitive flap and impaired the
binding of the flap endonuclease-1 (FEN1) molecule during DNA-
repair process. c, The repetitive hairpin is stabilized by the binding of
MSH2-MSH3 molecule, which resulting in preventing flap removal. d,
The formation of a stable slipped stranded DNA intermediate is
occurred by the time of repair process is completed. e, The slipped
stranded DNA intermediate is converted into an expansion by a fault in
the repair pathway. Adapted from (Mirkin 2007).

Daniah Trabzuni Page 45
The Mismatch repair (MMR) role in normal cells is to remove mismatches
and small insertion or deletions that arise during replication or recombination. The
role of MMR in repeat instability was firstly identified and widely studied using
transgenic mouse models for Huntington’s disease and Myotonic dystrophy. The
possible hypothesis was that MSH2 and MSH6 have the affinity to bind to the
hairpin structures and this binding causes the sequester repair proteins stabilize these
structure instead of repairing them (Kovtun and McMurray 2001; Mirkin 2007).
Other experiments demonstrate mixed effects of mismatch repair on
instability. MMR repair takes place and MMR proteins, including MutSα [MSH2
and MSH6] and MutSβ [MSH2-MSH3] heterodimer, bind to looped-out secondary
structure when these DNA unusual structures formed and result in the mismatching
of bases within the structure or in the flanking region (Genschel et al. 1998; Wells et
al. 2005; Kulkarni and Wilson 2008). The hypothesis was that mismatch repair has a
key role in instabilities mainly through MSH2 or other downstream proteins (Wells
et al. 2005).
However, some studies showed there is no increase in the instability with
human cell lines with mutations in MMR proteins at Myotonic dystrophy (DM1) and
Fragile-X (FRAXA) loci, furthermore none of the MMR proteins have a conclusive
link to the neurodegenerative disease to date (Kramer et al. 1996; Kulkarni and
Wilson 2008).
Nucleotide excision repair (NER) is a repair process specific for DNA
helical alterations. In some cells, the recognition for the helical alterations includes
the recognition and the removing of DNA loops which are part of the secondary or
non B-DNA structures. This causes a DNA gap which requires repair process and
consequently the repeat instability takes place (Parniewski et al. 1999; Wells et al.
2005). Previously, some studies had been conducted on bacterial models to clarify
the NER role in the repeat instability. The results indicate that NER either preventing
or enhancing large contraction for (CTG)n∙(CAG)n repeat sequence. In conclusion,
NER contribution to repeat instability is dependent on the repeat tract and the
transcription replication direction (Pearson et al. 2005; Wells et al. 2005).
Furthermore, extra significant work is required to clarify this area; specially with
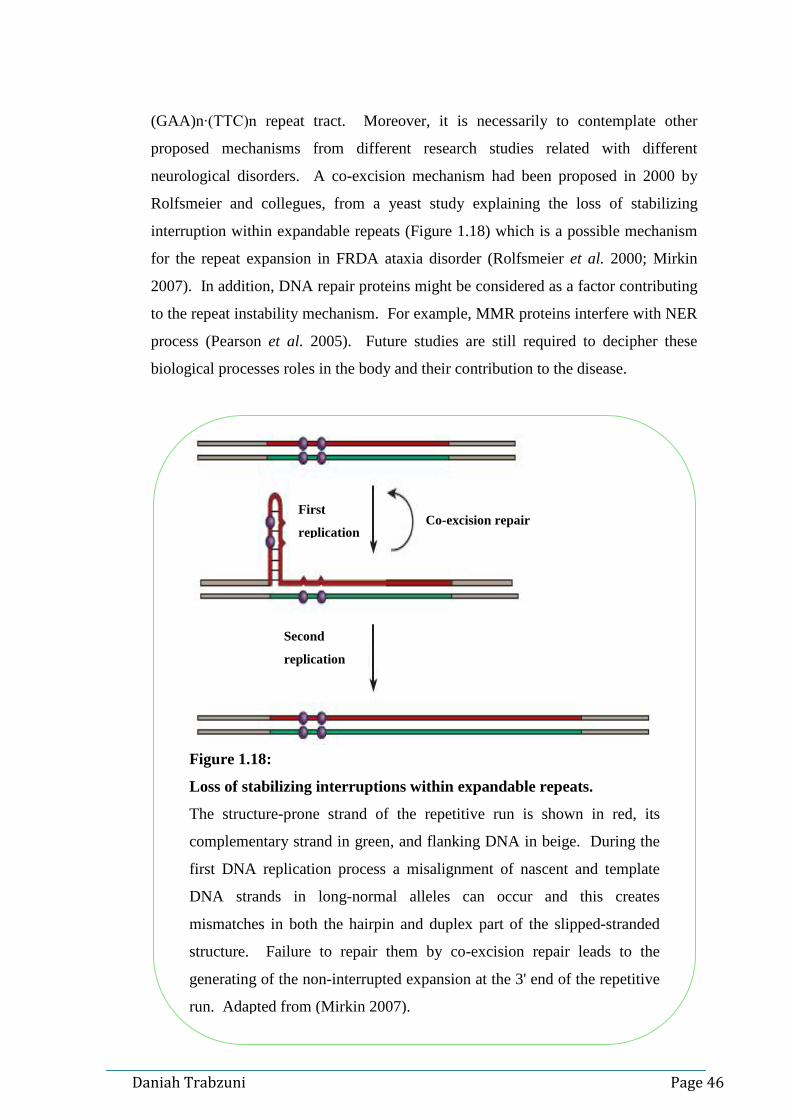
Daniah Trabzuni Page 46
(GAA)n∙(TTC)n repeat tract. Moreover, it is necessarily to contemplate other
proposed mechanisms from different research studies related with different
neurological disorders. A co-excision mechanism had been proposed in 2000 by
Rolfsmeier and collegues, from a yeast study explaining the loss of stabilizing
interruption within expandable repeats (Figure 1.18) which is a possible mechanism
for the repeat expansion in FRDA ataxia disorder (Rolfsmeier et al. 2000; Mirkin
2007). In addition, DNA repair proteins might be considered as a factor contributing
to the repeat instability mechanism. For example, MMR proteins interfere with NER
process (Pearson et al. 2005). Future studies are still required to decipher these
biological processes roles in the body and their contribution to the disease.
Figure 1.18:
Loss of stabilizing interruptions within expandable repeats.
The structure-prone strand of the repetitive run is shown in red, its
complementary strand in green, and flanking DNA in beige. During the
first DNA replication process a misalignment of nascent and template
DNA strands in long-normal alleles can occur and this creates
mismatches in both the hairpin and duplex part of the slipped-stranded
structure. Failure to repair them by co-excision repair leads to the
generating of the non-interrupted expansion at the 3' end of the repetitive
run. Adapted from (Mirkin 2007).
First
replication
Second
replication
Co-excision repair

Daniah Trabzuni Page 47
1.2.5.9.3 DNA recombination
DNA recombination also has a limited contribution to the repeat expansion
mechanism. One of the possible models, which was explained by Mirkin, suggests
that as a result of DNA synthesis-dependent strand annealing; a mitotic, unequal
crossing over (intrachromosomal strand annealing) occur between the repetitive
tracts on homologous chromosomes causing expansion or contraction (Figure 1.19)
(Warren 1997; Pearson et al. 2005; Mirkin 2007).
In addition, it been assumed that the stimulation of the recombination is
dependent on the repeat orientation within the replicon. Thus, after the pausing of
the replication fork, the single stranded DNA fragment is generated. This strand has
the ability to infest the sister chromatid then the expansion takes place (Figure 1.20)
(Mirkin 2007). A positive correlation between increasing the length of the
(GAA)n∙(TTC)n repeat tracts and decreasing the frequency of the intramolecular
recombination was discovered (Wells 2008).
Figure 1.19:
Recombination models for repeat expansions. Homologous
chromosomes are shown in beige and blue and repetitive DNA strands
are shown in red and green. Reciprocal appearance of expanded and
contracted repeats is the result of an unequal crossing-over in
homologous chromosomes. Adapted from (Mirkin 2007).
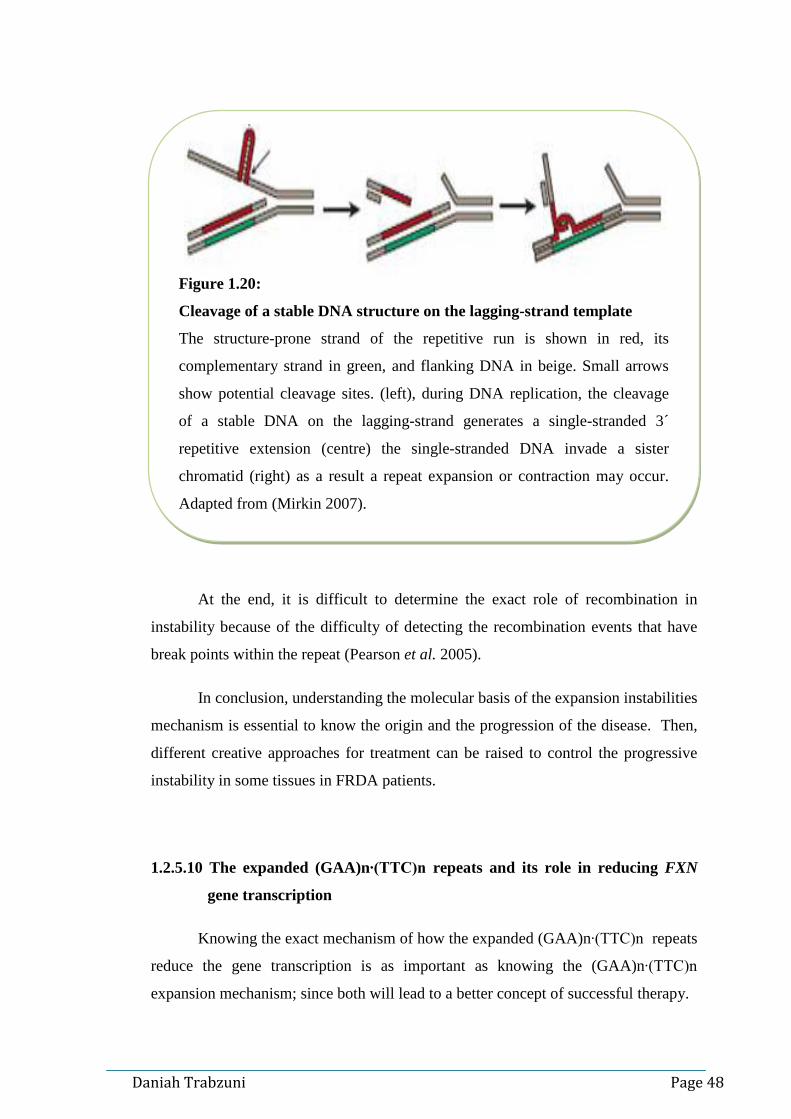
Daniah Trabzuni Page 48
Figure 1.20:
Cleavage of a stable DNA structure on the lagging-strand template
The structure-prone strand of the repetitive run is shown in red, its
complementary strand in green, and flanking DNA in beige. Small arrows
show potential cleavage sites. (left), during DNA replication, the cleavage
of a stable DNA on the lagging-strand generates a single-stranded 3´
repetitive extension (centre) the single-stranded DNA invade a sister
chromatid (right) as a result a repeat expansion or contraction may occur.
Adapted from (Mirkin 2007).
At the end, it is difficult to determine the exact role of recombination in
instability because of the difficulty of detecting the recombination events that have
break points within the repeat (Pearson et al. 2005).
In conclusion, understanding the molecular basis of the expansion instabilities
mechanism is essential to know the origin and the progression of the disease. Then,
different creative approaches for treatment can be raised to control the progressive
instability in some tissues in FRDA patients.
1.2.5.10 The expanded (GAA)n∙(TTC)n repeats and its role in reducing FXN
gene transcription
Knowing the exact mechanism of how the expanded (GAA)n∙(TTC)n repeats
reduce the gene transcription is as important as knowing the (GAA)n∙(TTC)n
expansion mechanism; since both will lead to a better concept of successful therapy.

Daniah Trabzuni Page 49
It is well known, that the transcription process starts with the binding of
pre-initiation complex at the gene promoter, then RNA synthesis begins followed by
the elongation stage. The transcription is usually regulated at the stage of the RNA
polymerase (Pol II) recruitment to the promoter region, which is essential for gene
activation (Muse et al. 2007; Tamkun 2007; Zeitlinger et al. 2007). Relating to this
fact, many suggested mechanisms had been proposed to explain the way the
expanded (GAA)n∙(TTC)n repeats modify gene transcription process.
In 1998, the inhibitory effect of the expanded (GAA)n∙(TTC)n repeats was
investigated in vivo and the results showed a very low level of mature mRNA with
no accumulation of the primary transcript in the plasmids with long (GAA)n∙(TTC)n
repeats (Ohshima et al. 1998; Baralle et al. 2008; Wells 2008). In addition, a lot of
evidences prove that the expanded (GAA)n∙(TTC)n repeats have an inherited ability
to form a non B-DNA structures such as triplex, hairpin, parallel DNA and a triple-
helical (H-DNA) or sticky DNA (see previous section 1.2.5.9 and Figures 1.13,
1.14). A specific and persistent inhibitory d(TTC)n∙r(GAA)n hybrid and a
heterochromatin mediated gene silencing effect had been reported. Such
intermediates have been shown to interfere with the gene transcription in vivo and in
vitro and contribute to the aetiology of FRDA (Sakamoto et al. 2001; Al-Mahdawi et
al. 2004; Krasilnikova and Mirkin 2004; Hebert and Whittom 2007; Baralle et al.
2008; Wells 2008).
It has been demonstrated that the sticky DNA structure has an essential
function, in vivo, by interacting with proteins or interfering in metabolic pathways.
Sticky DNA has an inhibitory effect, in vivo and in vitro, on the transcription process
of the FXN gene, by inhibiting the synthesis of RNA. Sakamoto and colleagues have
explained the way the sticky DNA is involved in the RNA polymerase sequestration
step. They suggested that RNA polymerase is paused within sticky DNA structure
during RNA synthesis and less free RNA polymerases are available for further
transcription. Another suggestion was that the sticky DNA structure has the ability
to bind to an inactive RNA polymerase without transcription (Sakamoto et al. 2001;
Baralle et al. 2008; Wells 2008).

Daniah Trabzuni Page 50
Two mechanisms have been proposed to explain the role of the triplex
structure in affecting transcription. First, the triplex structure may physically block
the transcription elongation process. Second, the triplex structure may interfere with
the binding of transcription factors (trans-acting factors) that control the transcription
(Giovannangeli et al. 1996; Kovacs et al. 1996; Sakamoto et al. 2001; Saveliev et al.
2003). Wells and his colleagues have demonstrated that an expanded
(GAA)n∙(TTC)n repeats can form a DNA:RNA triplex that reduces transcription
(Ohshima et al. 1996).
Another well-explained (in vitro) experiment, which was conducted by
Grabczyk and Usdin, showed how the RNA polymerase molecule is trapped in an
R∙R∙Y triplex when it enters in an expanded (GAA)n∙(TTC)n repeats area and
produce negative super-coiling and that leads to form an intramolecular triplex
structure. As a result RNA polymerase stalls (Grabczyk and Usdin 2000; Hebert and
Whittom 2007). It is important to mention that RNA polymerase II stalling has a key
regulatory role for gene transcription in the development stage (Muse et al. 2007;
Zeitlinger et al. 2007)
In 2007, Grabczyk and colleagues proposed another model, with the same
principle, explaining the transcription coupled RNA∙DNA hybrid formation in an
expanded (GAA)n∙(TTC)n repeat area. The template DNA strand d(TTC)n forms a
stable RNA∙DNA hybrid with a moderate length, then the DNA triplex is dislodged,
in the presence of the transcription complex, to give longer RNA∙DNA hybrid. The
formation of the stable RNA∙DNA hybrid and DNA triplex creates a pause site at the
expanded (GAA)n∙(TTC)n repeat area (Figure 1.21, page 51) (Grabczyk et al. 2007;
Wells 2008).
At this stage, it is important to note that triplexes or sticky DNA have no
obligatory role in the aetiology of FRDA, thus further investigations are required to
clarify the direct relation between these unusual DNA structures and the transcription
inhibition effect (Wells 2008).

Daniah Trabzuni Page 51
Figure 1.21:
Transcription-coupled RNA∙DNA hybrid formation in a
(GAA)n∙(TTC)n repeat. Model for transient transcription dependent
triplex formation leading to an RNA polymerase pause and RNA∙DNA
hybrid formation. The purine (GAA or R) strand of the repeat is red, the
pyrimidine (TTC or Y) strand is yellow, and the flanking DNA is gray.
A, A standing wave of negative super-coiling follows RNA polymerase.
At the transcription bubble, the non-template (GAA) strand is available
to fold back in an R∙R∙Y interaction; the template strand is covered by
RNA polymerase. B, Rotation of the helix (curved arrow) as it winds in
the third strand relaxes the negative super-coils caused by transcription
and leaves a length of the template single-stranded. C, RNAP is
impeded at the distal template-triplex junction and the nascent transcript
(green) can anneal to the single-stranded stretch of template. D, The
RNA∙DNA hybrid displaces the much less stable triplex structure.
Adapted from (Grabczyk et al. 2007).

Daniah Trabzuni Page 52
However, a recent study using a hybrid minigene system explained the
composite affect of the transcribed (GAA)n repeat, that can form an intronic sticky
RNA structure, affecting the normal intronic pre-mRNA processing. This sticky
RNA sequence can act as an exonic splicing enhancer (Baralle et al. 2008).
In this study, the results showed that in the mammalian reporter gene,
(GAA∙TTC)100 and (GAA∙TTC)217 repeats affect neither the polymerase ІІ
transcriptional elongation step, nor pre-mRNA transcription abundance.
Nevertheless, this pathogenic repeat results in a complex defect in pre-mRNA
process by inhibiting the splicing efficiency. Furthermore, the insertion of the GAA
repeat at different locations (upstream and downstream) from the reporter exons has
different effects on the splice site selection. These repeats have the ability to bind to
different trans-acting splicing factors, as a result enhancing the accumulation of an
up-stream pre-mRNA splicing intermediates and stop the pre-mRNA from turning
over to a mature form (mRNA), thus the degradation of the RNA molecules and
lower level of mRNA. Furthermore, the number of the repeat affects the severity of
the splicing pattern, consistent with variable phenotypic expression of the disease.
The affect of the GAA repeat depend on position and context manner.
Insertion of the (GAA)n∙(TTC) repeat in the first intron of a frataxin minigene
model has also been conducted. The results revealed that the repeat did not block the
transcription but it affected the splicing efficiency of the first frataxin intron. In
addition, the repeat presence in its original context is not affecting the quality of the
final transcript (Figure 1.22) (Baralle et al. 2008).
Figure 1.22:
Schematic representation of the frataxin minigene. It contains the GAA or TTC (n = 100) repeats and showing the un-spliced
(U, D, and D1) and spliced (S) amplification products. Modified from
(Baralle et al. 2008).

Daniah Trabzuni Page 53
In addition to the DNA structure, DNA recombination, and DNA repair;
epigenetic modifications may contribute to affect FXN gene transcription and
contribute to the pathogenesis of FRDA (Pollard et al. 2008).
1.3 Epigenetics
In the last decade, because researchers have given considerable attention to
the field of epigenetics, the amount of information about epigenetics and its
implication in the aetiology of some human diseases has increased dramatically. The
main contribution to this knowledge has come from the development of molecular
genetics approaches, for instance the use of the chromatin immunoprecipitation
(ChIP) technique with genome-wide scan and mapping techniques, high-throughput
DNA microarray and sequencing, serial analysis of gene expression (SAGE), and
serial analysis of chromatin occupancy (SACO) (Bock and Lengauer 2008; Schones
and Zhao 2008).
1.3.1 The definition of epigenitics
Epigenetic regulations have been implicated in normal development and
human illness. They are vital regulations for the normal functioning of genomes, for
example, segregation of chromosomes in mitosis and regulation of gene activity. If
any misregulation takes place, then epigenetic regulations will be highly relevant to
various complex non-Mendelian disorders (Jaenisch and Bird 2003; Feinberg 2007).
In the 1940s, Conrad Waddington proposed the first theoretical concept about
the term “epigenetics”. That is ‘the interaction of genes with their environment, and
how genotypes give rise to phenotypes during development’ (Waddington 1942;
Murrell et al. 2005; Bird 2007; Crews 2008). Later, in the 1970s the modern era of
epigenetics, Robin Holliday used modern genetic methods to present a molecular
model for inheritability of the gene activation and inactivation during development
by DNA methylation and demethylation (Holliday and Pugh 1975; Holliday 1987;
Crews 2008).

Daniah Trabzuni Page 54
Epigenetic modifications are involved in aging and long term memory
process such as, DNA methylation (Bird 2007; Santos-Reboucas and Pimentel 2007;
Crews 2008). The increase of the epigenetic modifications with age have helped to
explain the late age of onset in some complex diseases (Stuffrein-Roberts et al.
2008).
Then Arthur Riggs and colleagues defined epigenetics as ‘the study of all
meiotically and mitotically heritable changes in gene expression that are not coded in
the DNA sequence itself’ (Egger et al. 2004; Bird 2007; Bock and Lengauer 2008).
Since then epigenetics is used in molecular and developmental genetics studies of
gene function that is not attribute to the change in DNA sequence, so nowadays
epigenetics refers to ‘the transmission of genetics information, other than that stored
in the DNA sequence, from a cell to its daughter cells, and from an organism to its
offspring’ (Laskowski and Thornton 2008).
Epigenetic modifications are heritable, reversible, gradual and dynamic
process that contribute to modify gene expression in the cell (Egger et al. 2004;
Santos-Reboucas and Pimentel 2007; Crews 2008; Schones and Zhao 2008). In
more detail, in certain developmental stages or in some diseases; some cells undergo
a major reprogramming step. This step involves the removal or the modulation of
their epigenetic markers. Otherwise, in normal cases, these epigenetic markers are
fixed after cell differentiation or existence in the cell cycle (Bock and Lengauer
2008; Nafee et al. 2008; Ptak and Petronis 2008). Therefore, for each cell, there is a
unique gene expression profile, which will determine its identity; this profile will be
remembered and passed on to a daughter cell. This is known as “Epigenetic
inheritance” (Nafee et al. 2008; Schones and Zhao 2008).
Epigenetic inheritance occur between generations of cells, which is mitotic
inheritance, and between generations of species, which is meiotic inheritance.
Mitotic inheritance is involved in cellular differentiation. That is to say, the
differentiated cells of the gremline reprogram epigenetic information in a parent-
specific way, before it is passed on to the daughter cells as sperm or egg.

Daniah Trabzuni Page 55
While the meiotic inheritance is considered the result of the incomplete
reprogramming in the early embryo stage that produces an epigenetic information
from the parent to the offspring; that is to say across the germline generations (Bock
and Lengauer 2008; Ptak and Petronis 2008).
The advanced approaches have been used by international collaborations to
identify epigenetic changes on a genome-wide scale, here the term “Epigenomics”.
The epigenome covers two different areas: chromatin structure and DNA
methylation. Therefore, the epigenome can vary from cell to cell, can change over
time, and depends on the tissue type and developmental stage. Thus complex
organisms, such as humans have a multiple epigenomes (Murrell et al. 2005;
D'Alessio and Szyf 2006; Schones and Zhao 2008; Stuffrein-Roberts et al. 2008).
1.3.2 Molar and Molecular epigenetics
In both animal and human inheritance systems, epigenetic modifications take
place at two different levels: the physiological and morphological level, which is
molar epigenetics, and at the normal patterns of gene expression, which is
molecular epigenetics. These changes cause functional differences in brain and
behaviour; thus, different genotypes arise. As a result, individual response to their
environment is changing and the modifications will be on a higher level of biological
organization. Figure 1.23 shows the interaction between different epigenetic factors
at different levels (Figure 1.23) (Holliday 2006; Crews 2008; Stuffrein-Roberts et al.
2008).
Molar epigenetics is the study of how the environment stimuli affect the
genome of the individual during its development followed by the observations of the
individual’s interaction with its physical environment after birth (Gottlieb 2007;
Crews 2008). Numerous environmental factors can stimulate epigenetic
modifications. For example, nutrition, maternal behaviour, internal factors
(hormones) and some drug treatments can influence gene expression by altering
DNA methylation status.

Daniah Trabzuni Page 56
Figure 1.23:
The external environment interacts with the internal
environment to influence fetal development with both
immediate and life-long consequences. Such environmentally-
induced changes can occur at all levels of biological organization,
from the molecular to the organism’s behaviour, and tend to be
amplified in their consequences as they ascend through these
levels. Ultimately, these influences may be epigenetic in nature,
inducing heritable alterations in gene expression without changing
the DNA. Adapted from (Crews 2008).
A previous experiment explains the case of monozygotic twins (MZ) that
showing a significant difference in the phenotypic outcomes, which comes from
different level of genes expressions of the diseases causing genes due to the
differences in epigenetic modifications, Although they are genetically identical
(Fraga et al. 2005; Ptak and Petronis 2008; Stuffrein-Roberts et al. 2008).
Molecular epigenetics is the study of heritable gene regulations during
embryogenesis without involving the changes occur in DNA sequence (Crews 2008;
Keverne and Curley 2008).
In this research, our investigation concern only about the molecular
epigenetic modifications and their involvements in the FRDA pathology, so any
epigenetic modifications will be discussed later are referred to the epigenetic
modifications at the molecular level.

Daniah Trabzuni Page 57
Figure 1.24:
Nucleosome structure. Each nucleosome consists of two
copies each of H2A, H2B, H3 and H4 (core histones) forming an
octamer around which the DNA is wrapped. The amino-terminal
tails of core histones are exposed on the outside of the
nucleosomes. Adapted from (Stuffrein-Roberts et al. 2008).
1.3.3 Mechanisms of molecular epigenetic regulations
In recent years, the availability of the advanced databases for genome-wide
DNA and RNA sequences, protein (3D) structures, DNA methylation patterns, ChIP-
sequence techniques and others, has helped to bring new insights of the epigenetic
modification mechanisms that are associated with some human complex diseases;
thus, a new era of research has arisen. Studies that consider chromatin structures and
nucleosome arrangement including the DNA molecule and its way of interaction
with histone proteins have a great impact in elucidating the epigenetic mechanisms in
affecting the transcriptional process in the cell. However, more sophisticated studies
are still needed in the next few years for a new expanded direction in the therapeutic
and pharmacological fields.
In eukaryotic cells, DNA is packaged in the form of chromatin. Chromatin is
composed from DNA, octamers of core histone proteins (H2A, H2B, H3, and H4)
and non-histone proteins, which facilitate the DNA packing to form a higher order
structure ‘nucleosome’. Each histone has a flexible domain, which remains outside
the nucleosome called histone tails (Figure1.24). These tails can encode epigenetic
information and store different distinct epigenetic information patterns, which are
called histone code (More details about histone code definition are covered in section
1.3.3.1, page 60) (Laskowski and Thornton 2008; Nafee et al. 2008; Ptak and
Petronis 2008; Stuffrein-Roberts et al. 2008).

Daniah Trabzuni Page 58
Figure 1.25: Properties of euchromatic regions.
1- Less condensed.
2- At chromosome arm.
3- Gene rich.
4- Contains unique sequence.
5- Replicated throughtout S phase.
6- Recombination during meiosis.
Modified from (Grewal and Elgin 2007).
There are two forms of chromatin: euchromatin, which is loose and accessible
for the transcription factors to be recruited at the promoter regions, then transcription
process is initiated (Figure 1.25). It has been reported that the enhancers are more
competitive in binding to the silencing factors than the promoters are, and that they
maintain the euchromatin structure. The heterochromatin form, which is more
condensed, compact, stable (maintained through mitosis and meiosis) and
inaccessible for the transcription factors to bind and function; as a result the
inhibition of the transcription process takes place (Figure 1.26) (Grewal and Elgin
2007; Stuffrein-Roberts et al. 2008). The relationship between the heterochromatin
formation and gene silencing has been derived from the loss of gene expression
correlated with condensed packaging in position effect variegation (PEV). PEV
occurs when a gene, which is normally euchromatic, is abnormally close to
heterochromatin that is characterized by the presence of H3K9me3 and histone tails
hypoacetylation, during rearrangement; resulting in variegating phenotype indicated
that the gene has been silenced in a proportion of the cells in which it is normally
active (Saveliev et al. 2003; Gottesfeld 2007).

Daniah Trabzuni Page 59
Figure 1.26: Properties of heterochromatic regions.
1- Highly condensed.
2- At centromeres and telomeres.
3- Gene poor.
4- Contains repetitious.
5- Replicated in late S phase.
6- No meiotic recombination.
Modified from (Grewal and Elgin 2007).
In contrast, a genomic DNA microarrays study showed that compact
chromatin fibres contain some active genes in addition to the heterochromatin
(D'Alessio and Szyf 2006).
Epigenetic mechanisms can have two different affects on the gene
transcription process: activation (open chromatin; euchromatin) and that occurs when
the histone acetylation signal such as, H3k9ac and H3K14ac is high. Inactivation
(condense chromatin; heterochromatin) occurs when the signal of the histone
hypermethylation signal is high for example, H3K9me3 (Bock and Lengauer 2008).
Histone modifications, DNA methylation, RNA-associated silencing, binding
of non-histone proteins (such as, polycomb and trithorax group complexes) and
action of methylation dependent sensitive insulators are the suggested mechanisms
that initiate the heritable epigenetic silence (Egger et al. 2004; Bock and Lengauer
2008).

Daniah Trabzuni Page 60
1.3.3.1 Chromatin remodelling through histone modifications
Chromatin remodelling plays an important role in regulating gene expression
by controlling the recruitment of transcriptional and regulatory factors to the
underlying DNA (Nafee et al. 2008; Ptak and Petronis 2008; Stuffrein-Roberts et al.
2008).
Over the past view years, post-translational histone modifications have been
studied substantially. In embryonic stem cells (ES) there are some regions termed
‘bivalent domains’. These domains contain both of these histone modifications,
which are essential in ES cell differentiation and development by providing the
potential for transcriptional activation or inhibition (Berger 2007; Spivakov and
Fisher 2007; Schones and Zhao 2008).
These modifications, which occur at various amino acid molecules on the
histones N-terminal tail domains, include histone acetylation (lysine),
phosphorylation (serine and threonine), methylation (lysine and arginine),
ubiquitination (lysine), sumoylation and ADP-ribosylation. These chemical
modifications can alter the structure of the chromatin fibre, its degree of
condensation, and then the interaction and the accessibility of the transcriptional
proteins to the DNA within (Egger et al. 2004; Santos-Reboucas and Pimentel 2007;
Bock and Lengauer 2008; Nafee et al. 2008; Ptak and Petronis 2008).
Three models have been presented to explain the post-translational histone
modifications (Schones and Zhao 2008). First, histone code which is defined as
‘multiple histone modifications occurring in the same region to generate a unique
chromatin structure, which is compatible with specific level of gene expression’.
These modifications function combinatorially to regulate downstream functions
(Egger et al. 2004; Santos-Reboucas and Pimentel 2007; Nafee et al. 2008; Schones
and Zhao 2008). In addition, the histone code functions as epigenetic signals from
the DNA to the cellular machinery including, gene regulation, DNA repair, and
chromosome condensation (Stuffrein-Roberts et al. 2008). Second, in more general
aspect histone modifications can serve as signalling pathway to accelerate binding
of enzymes for their function on the chromatin. This model is providing specificity,

Daniah Trabzuni Page 61
redundancy and combination through feedback loop. Third, certain histone
modifications such as, acetylating and phosphorylation initiate charge
neutralization of the chromatin. For example, acetylation of histones neutralize
positive charge on DNA and phosphorylation adds negative charge, and this leads to
a general decondensation of the chromatin fibre (Schones and Zhao 2008).
Predominantly, the acetylation of the histone tail, such as H3K9, is related to
an uncondensed chromatin structure and active transcriptionally regions, whereas
hypoacetylation is related to inactive euchromatic or heterochromatic regions. The
balance between these two processes is controlled by an opposite activity of histone
deacetylases (HDACs) and histone acetyltransferases (HATs) enzymes (Egger et al.
2004; Santos-Reboucas and Pimentel 2007). HAT enzyme acetylates the lysine
residues on the N-terminal tail of the histone and neutralizes the positive charge of
the protein, causing the formation of an open chromatin structure (euchromatin) that
is accessible to the transcription regulatory factors. Whereas, HDAC enzyme
deacetylates the lysine residues, causes a chromatin condensation (heterochromatin)
and inaccessible DNA for the transcription machinery (Ptak and Petronis 2008).
Histone phosphorylation, is the addition of the negatively charged phosphate
group to the histone tails, and the neutralization of the basic charge, which leads to
reduce the histone affinity to the DNA. It is seen in cell cycle progression during
mitosis and meiosis. For example, the phosphorylation of serine 10 in histone H3
was related with gene activation in mammalian cells. In addition, the
phosphorylation of the H2A, which occur after the activation of DNA-damage
signalling step, will allow the chromatin to open and facilitate the DNA repair
process (Santos-Reboucas and Pimentel 2007; Nafee et al. 2008).
Histone methylation is a mark for both active and inactive regions of the
chromatin, and different degrees of methylation are related with different levels of
gene silencing. Histone methylation of lysine residues can be monomeric, dimeric or
trimeric. These variations give rise to multiple combinations of different
modifications ‘histone code’. In addition, it was shown that histone methylation is
reversible by histone demethylases as an oxidative process. For instance, the
trimethylation of the lysine residue 9 on the N terminus of histone 3 (H3-K9) is a

Daniah Trabzuni Page 62
DNA silent mark and associated with constitutive heterochromatin. This
modification is spreading throughout certain heterochromatic regions such as
telomeres and centromeres, while mono and dimethylation of the same position is
associated with facultative heterochromatin. On the other hand, the methylation of
the lysine residue 4 on the N terminus of histone 3 (H3-K4) is an active mark at the
promoter regions of active genes. The suggested explanation for this variety is the
specific binding of the heterochromatin protein 1 (HP1), which mediates H3K9
methylation specifically but not H3K4 (Egger et al. 2004; Santos-Reboucas and
Pimentel 2007; Nafee et al. 2008; Schones and Zhao 2008).
Recent studies, which were performed on human and mouse, indicate that the
histone methylation of H3 lysine 9 H3K9, H3K27, H3K4 and H4K20 are implicated
in heterochromatin formation and transcription inhibition. The monomethylations
signals of H3K4, H3K27, H3K9, and H4K20 found to be significantly high in the
enhancers and transcribed regions, and correlated positively with the transcriptional
activation, while the trimethylation of H3K27me3, H3K9me3 and H3K4me3 signals
are inversely correlated with active promoters. In addition, the localized distribution
patterns of these histones were observed; H3K4me3 and H3K27me3 are spreading
over large regions, while H3K9me3 and H4K20me3 are present near the boundaries
of large heterochromatin domains (Heintzman et al. 2007; Santos-Reboucas and
Pimentel 2007; Schones and Zhao 2008).
1.3.3.2 DNA methylation
In recent years, strong evidence has proven that DNA methylation is one of
the major epigenetic modifications, which contributes to regulate many biological
processes in the cell such as, chromatin structure, genomic imprinting, X
chromosome inactivation, gene transcription and embryonic development. In normal
cells, it is vital for the mammalian development and for normal organism functioning
for the adult to have established and maintained DNA methylation patterns.
Moreover, the loss of the normal DNA methylation patterns in somatic cells leads to
the loss of growth control (Robertson 2005; Schones and Zhao 2008). Repetitive

Daniah Trabzuni Page 63
Figure 1.27:
Methylation of cytosine. DNA methylation involves
the addition of a methyl group to the 5-carbon position
of cytosine residues. Adapted from (Stuffrein-Roberts et
al. 2008).
genomic regions are considered as preferable areas for the methylation process to
occur. Around 3% of the cytosines in human DNA are methylated (Robertson 2005;
Nafee et al. 2008).
DNA methylation is the only epigenetic change that affects the DNA directly;
it is the replacement of the hydrogen atom of the cytosine base by a methyl group
(Figure 1.27), which is established by the functional DNA methyltranferases
(DNMTs) enzymes (Ptak and Petronis 2008; Schones and Zhao 2008; Stuffrein-
Roberts et al. 2008)
DNA methyltranferases enzymes are responsible for establishing and
maintaining DNA methylation. In addition, its contribution to the chromatin
remodelling processes by establishing the binding site of HP1 through methylating
H3K9. Dnmt1 is responsible for maintaining the previous heritable methylated
pattern of CpG of hemi-methylated DNA. It requires chromatin deacetylation before
it can methylate DNA molecule, while the de novo Dnmt3a and Dnmt3b
methyltransferases, which are highly expressed in embryonic cells, are responsible
for starting DNA methylation during early embryonic development and establishing

Daniah Trabzuni Page 64
the methylation pattern at previously unmethylated CpG sites (Saveliev et al. 2003;
Robertson 2005; Santos-Reboucas and Pimentel 2007; Ptak and Petronis 2008).
The methylated CpG expanded islands, which are hundred bases in size, are
located in the promoter regions of 40% of mammalian genes and have the ability to
generate a heritable transcriptional silencing (Egger et al. 2004; Nafee et al. 2008).
Methyl-CpG binding proteins (MBPs) are involved in reading the
methylation patterns and control the suppression process of the methylated islands,
by recruiting chromatin remodelling factors, such as HDACs, as gene expression
regulators. Moreover, the right dosage of methylCpG binding protein 2 (MeCP2) in
the CNS is vital for neuronal function. For example, a slight over-expression of
MeCP2 in neurons cause a severe symptom of motor dysfunction and seizures
(Robertson 2005; Santos-Reboucas and Pimentel 2007).
The methylation of the C5 position of cytosine residues within dinucleotides
(CpG) has a fundamental importance as an epigenetic silencing mechanism by
stimulating the formation of the heterochromatin structure which affects transcription
factors binding. The level of the DNA methylation is related with the level of the
gene silencing. The methylation pattern of a gene can be detected by sodium
bisulphite sequencing or high performance liquid chromatography methodologies
(Bock and Lengauer 2008; Nafee et al. 2008; Ptak and Petronis 2008).
DNA methylation pattern is a balance of methylation and demethylation
reactions (D'Alessio and Szyf 2006). Aberrant DNA methylation patterns in cells
have been considered as a major element contributing to a wide range of human
complex disorders such as, trinucleotide repeat (TNRs) diseases. Many studies of
repeat instability disorders demonstrate that only some of the TNRs have a higher
susceptibility to be targeted for methylation process then the silencing mechanism.
However, other studies showed that TNRs are targeted for silencing mechanism
regardless what their sequence is. For example, in FRDA the expanded
(GAA)n∙(TTC)n repeats adapt a heterochromatin structure. Therefore, TNRs might
be targeted for silencing at the chromatin level and then other factors may or may not
stimulate the DNA methylation process (Robertson 2005; Ptak and Petronis 2008).

Daniah Trabzuni Page 65
Interestingly, a recent study demonstrates that DNA methylation patterns can
be mediated by the CCCTC-binding factor (CTCF) in addition to its primarily role,
which is read the DNA methylation marks and ensures the allele specific gene
expression. CTCF is an 11-zinc factor protein that is ubiquitously expressed and it
acts as a regulator of imprinted gene expression. This protein can protect certain
regions from DNA methylation and has a boundary element function by blocking the
spread of heterochromatin (Robertson 2005). Furthermore, DNA methylation
patterns can also be mediated by H3K27 methyltransferase enzyme by the direct
physical interaction with the DNA methylatransferase in human cell line (Schones
and Zhao 2008).
1.3.3.3 RNA-associated silencing
Many studies showed that RNA is involved closely in regulating the gene
expression process in FRDA and other human complex disorders; thus, many recent
research areas are considering expanding the knowledge and the understanding of
this mechanism is important.
RNA, which can lead to the heritable transcriptional silencing due to the
formation of heterochromatin, is present in three forms: non-coding RNAs, antisense
transcript RNAs and RNA interference (RNAi), (Hebert and Whittom 2007).
The non-coding RNAs, regulate the binding of the HP1 protein to the
chromatin and it involve in initiating X inactivation by DNA methylation and
chromatin condensation. Furthermore, the involvement of the antisense transcript
RNAs in different silencing mechanisms has been observed. A previous study
showed that the antisense transcript has effect on the DNA methylation and silencing
the intact HBA2 α-globin gene in a α-thalassaemia case (Egger et al. 2004; Santos-
Reboucas and Pimentel 2007; Schones and Zhao 2008).
Whereas, RNAi is a highly conserved silencing machinery that regulates gene
expression by the homology dependent degradation of the target mRNAs by using
small double-stranded RNA (dsRNA) molecules as triggers, as a result the inhibition

Daniah Trabzuni Page 66
of mRNA transcription (Robertson 2005; Kim and Rossi 2008). In trinucleotide
reapeat diseases with the repeat instability, the large repeats are targeted for
methylation and the formation of hairpin RNA, which might be cleaved to a short
hairpin RNA (shRNA) and recruit the RNAi silencing mechanism. To date there are
few clinical trials using RNAi as a treatment strategy for wide range of diseases,
including neurodegenerative diseases (Santos-Reboucas and Pimentel 2007; Kim and
Rossi 2008).
1.3.3.4 Non-histone proteins
Non-histone proteins have an influence on the chromatin remodelling. ATP-
dependent chromatin remodelling complexes can directly move or displace
nucleosomes along the DNA, allowing the access of the transcription factors to bind
within the chromatin and activating the transcription (Bird 2007; Bock and Lengauer
2008).
Furthermore, Heterochromatin protein (HP1), Polycomb group (PcG) and
Trithorax complexes (TrxG) are chromatin modifier proteins, which are part of a
cellular memory system responsible for controlling chromatin accessibility and
maintaining transcription in the first stages of embryonic life and throughout
development. PcG function as a stable repressor, while TrxG promote maintenance
of gene activity. They can bind to the DNA or to specifically modified histone tails
and catalyze other histone modification or DNA methylation, as a result causing a
gene silencing. For instance, polycomb protein catalyzes repressive histone
methylation and recruit DNA methylation while it is interacting with DNA
methyltransferases (Santos-Reboucas and Pimentel 2007; Bock and Lengauer 2008;
Laskowski and Thornton 2008).
In summary, histone modifications as a cellular mechanism are getting a
significant attention in the genetic field, thus there are many ongoing studies using
the advanced technologies to accumulate the knowledge about this area of research.
In addition, according to the significant importance of the DNA methylation

Daniah Trabzuni Page 67
mechanism more knowledge is still needed to fully describe its role in the disease
aetiology. Finally, additional studies are needed to fully understand the fundamental
role of RNA molecule and the non-histone protien in silencing FXN expression in
FRDA and other diseases. All will lead to a new and wide applicable treatment
approach in the future.
1.3.4 The relationship between the different mechanisms of
epigenetic regulations
DNA methylation, histone modificationas, RNAs and DNA binding proteins
are not independent elements. They function together to organize chromatin structure
and they influence each other during dynamic regulations of cellulaer differentiation
or pathological conditions (Figure 1.28) (Schones and Zhao 2008).
An epigenetic study suggested that RNA could be the trigger for DNA and
histone methylation modifications, resulting in stable and a heritable silencing.
However, the exact sequence of DNA methylation, histone modifications and RNA
in the concept of which initiates the recruitment of different epigenetic modifiers is
currently unknown (Figure 1.29) (Egger et al. 2004).
The correlation between DNA methylation and chromatin remodelling had
been established long time ago. A hypermethylated DNA profile is correlated with
hypoacetylated, inactive chromatin. Whereas, a hypomethylated DNA profile is
correlated with active acetylated chromatin. In addition, DNA methylation is related
to the gene transcription directly or indirectly through chromatin remodelling. As a
conclusion a recent study suggests that the relation between these two epigenetic
mechanisms is a bidirectional relationship (D'Alessio and Szyf 2006).
In conclusion, having a comprehensive knowledge about the connection
between different epigenetic mechanisms is vital to establish a valid research toward
a more specific treatment for epigenetic complex diseases such as, trinucleotide
repeat disorders.

Daniah Trabzuni Page 68
Figure 1.28: The interaction of DNA methylation, histone modification and other
factors such as small RNAs contribute to an overall regulation of the
gene expression and allows cells to remember their identity.
Heterochromatic regions are marked with H3K9me2 and H3K9me3, which
serve as a platform for HP1 binding. Small RNAs have been implicated in
the maintenance of heterochromatin. DNA methylation is persistent
throughout genomes, and is missing only in regions such as CpG islands,
promoters and possibly enhancers. The H3K27me3 modification is present
in broad domains that encompass inactive genes. Histone modifications
including H3K4me3, H3K4me2, H3K4me1 as well as histone acetylation
and histone variant H2A.Z mark the transcription start site regions of active
genes. The monomethylations of H3K4, H3K9, H3K27, H4K20 and H2BK5
mark actively transcribed regions, peaking near the 5′ end of genes. The
trimethylation of H3K36 also marks actively transcribed regions, but peaks
near the 3′ end of genes. Modified from (Schones and Zhao 2008).

Daniah Trabzuni Page 69
Figure 1.29:
Interaction between RNA, histone modification and DNA
methylation in heritable silencing. Histone deacetylation and
other modifications, particularly the methylation of lysine 9
within histone H3 (H3-K9) residues located in the histone tails,
cause chromatin condensation and block transcriptional
initiation. Histone modification can also attract DNA
methyltransferases to initiate cytosine methylation, which in
turn can reinforce histone modification patterns conducive to
silencing. Experiments in yeast and plants have clearly shown
the involvement of RNA interference in the establishment of
heterochromatic states and silencing. RNA triggering of
heritable quiescence might therefore also be involved in higher
organisms. Adapted from (Egger et al. 2004).

Daniah Trabzuni Page 70
1.3.5 Molecular epigenetic mechanisms in Friedreich ataxia (FRDA)
FRDA is one of the most thoroughly studied hereditary neurological disorders
and it now has well-defined genetic and biochemical pathways. As a result, this
disorder is a full resource model to study the epigenetic mechanisms that are
involved in the progression of the disease in more depth (Wells 2008).
DNA methylation and histone modification are the main mechanisms, which
have been studied and related to FRDA. Therefore, only these two mechanisms will
be discussed in this section.
1.3.5.1 DNA methylation and its contribution to FXN gene transcription
Considering that DNA methylation is an important epigenetic mechanism, an
epigenetic study showed that the DNA methylation pattern of specific CpG sites
upstream of the GAA repeat in intron 1 was more extensive by 50% in FRDA patient
lymphoblastiod cell lines than it was in the control cell lines. Three CpG residues
(termed 3, 6, and 13) were always methylated in FRDA cells by 75 to 100% of
alleles; whereas, they were methylation free in the control cells. One of these
residues (residue 13) was located within the E-box in intron 1, which might be the
binding site for certain transcription factors that contribute to gene’s promoter
activity. Consequently the methylation of these residues in intron 1 might affect
transcription factors binding and lead to a reduction in frataxin expression
(Gottesfeld 2007; Greene et al. 2007; Hebert and Whittom 2007; Al-Mahdawi et al.
2008; Wells 2008). This study also suggested that the increased methylation of
residue 13 may be a secondary effect of a compact chromatin structure that blocks
binding factors (Figure 1.30) (Greene et al. 2007).
Another recent experiment using bisulfite sequence analysis had investigated
the DNA methylation pattern in three occurrences in FXN gene: FXN promoter,
upstream GAA and downstream GAA. Results have demonstrated an altered DNA
methylation pattern in FRDA brain and heart tissues, moving from hypomethylation

Daniah Trabzuni Page 71
in the downstream GAA toward hypermethylation in the upstream GAA region (Al-
Mahdawi et al. 2008).
Up to date many substantial studies are continuing in order to have a better
understanding about DNA methylation mechanism and its contribution to FRDA
disorder.
Figure1.30:
Model for chromatin organization in the region conataining
residue 13 in normal and FRDA alleles. Adapted from (Greene et
al. 2007).

Daniah Trabzuni Page 72
1.3.5.2 Chromatin remodelling (histone modifications) and its contribution to
FXN gene transcription
Heterochromatin-mediated silencing mechanisms regulate the level of gene
silencing; hence the clinical severity in the triplet repeat diseases (Saveliev et al.
2003). The expanded (GAA)n∙(TTC) repeats correlates with heterochromatin
formation at the promoter regions of the gene; thus mediating gene silencing. In
addition, heterochromatin structure has been observed in the surrounding regions of
the expanded repeats in cells from FRDA patients (Saveliev et al. 2003; Wells 2008).
A well structured experiment, which was conducted by Festenstein and
colleages, revealed that (GAA)n∙(TTC) repeats induced positive effect varigation
(PEV) in euchromatic and heterochromatic regions, resulting in gene silencing by
stimulating the overexpression of HP1 to methylate H3K9 (Saveliev et al. 2003;
Hebert and Whittom 2007).
Another previous study showed a high level of H3K9me2 in FRDA cells with
more repressive chromatin structure and low level of FXN mRNA level (10 to 30 %).
A significant hypoacetylation of H3K9, H3K14, H4K5, H4K8, H4K12 and H4K16
in FRDA cells upstream and downstream of the (GAA)n∙(TTC) repeats were
observed. No significant changes in histone acetylation of the promoter region were
found between FRDA and control cells (Gottesfeld 2007; Hebert and Whittom 2007;
Wells 2008).
The transcriptional inhibition seen on FXN is consistent with a high level of
trimethylation of H3K9 and low level of methylation of H3K4 at the surrounding
regions of the expanded (GAA)n∙(TTC) repeats (Herman et al. 2006).
It has also been experimentally approved that the presence of the
hypoacetylated histones at the expanded (GAA)n∙(TTC) repeats can facilitate the
accessibility to the chromatin remodelling protein molecules that leads to the
heterochromatin formation and stimulates the GAA∙GAA∙TTC triplex formation
(Wells 2008).

Daniah Trabzuni Page 73
In summary, understanding the mechanisms of how the expanded
(GAA)n∙(TTC) repeats inhibit FXN gene expression either through forming unusual
DNA or heterochromatin structures still to be investigated in more specific aspects
(Figur 1.31). This will support the researchers in the genetic field with a vital
knowledge to further proceed with the therapeutic field research toward the right
direction to help FRDA patients to have a better-adjusted life.
Figure 1.31:
The current understanding as to why GAA repeats reduce
frataxin message levels. GAA repeats can form non B-form
DNA structures and RNA∙DNA hybrids (1) that impede
transcription (2). By a mechanism yet to be determined (3), it
is thought that GAA repeats trigger heterochromatin formation
(5). One possible signal for heterochromatin formation could
be alternative DNA structures induced by GAA repeats (4).
Adapted from (Hebert and Whittom 2007).

Daniah Trabzuni Page 74
1.4 Therapeutic approaches
Friedreich ataxia is considered as a single gene disorder and that makes it a
good candidate for experimental therapeutic research (Wells 2008). Any therapy that
can result in increased frataxin expression would be considered as useful.
1.4.1 Antioxidant and iron chelation-based approaches
Antioxidant drugs were developed to reduce the load of free radicals, protect
the mitochondria from oxidative damage and slow the progress of the disease
(Delatycki et al. 2000). This type of drugs may benefit FRDA patients by treating
later symptoms rather than directly increase frataxin expression (Gottesfeld 2007).
Iron chelator, chelating iron from extracellular fluid and cytosol but not from the
mitochondria (Pandolfo 2008).
1.4.2 Gene based approach
1.4.2.1 DNA interacting binding compounds
Small molecules designed to recognize a predetermined DNA sequence such
as, polyamides. They have the specific ability to permeate cells and localize in the
nucleus and downregulate target genes in the cell. Such molecules may inhibit the
protein-DNA interaction such as, HP1 thereby resulting in having an open chromatin
structure. They could also target the expanded (GAA)n∙(TTC) n tract directly and
disrupt or reverse the sticky DNA formation and increase the FXN transcription in
FRDA cells. Polyamides do not bind to single strand or duplex regions of RNA so
no effect on RNA processing or translation of frataxin mRNA (Gottesfeld 2007;
Hebert and Whittom 2007; Wells 2008).

Daniah Trabzuni Page 75
1.4.2.2 Epigenetic drugs
Histone deacetylase inhibitors (HDACi) have a positive and a negative
effect on gene transcription on epigenetic level. Various HDACis target various
HDAC enzymes and regulate the level of acetylation of histone and non-histone
chromosomal protein (Herman et al. 2006). It has been suggested that HDACi has
effect on pre-mRNA splicing rather than effect the transcription (Baralle et al. 2008).
Many studies showed the effect of HDACi on FXN activity as treatment and
its ability to reverse heterochromatin structure to an active form and restore the
normal function of the gene (Gottesfeld 2007). Herman and colleagues used
different classes of HDACi and showed a significant increase in frataxin level and
partial reverse of the silencing with an increase in the acetylation of H3K14, H4K5,
H4K12 in the FRDA lymphocytes (Herman et al. 2006; Hebert and Whittom 2007).
Another recent study indicates an increase in the acetylation of H3K14,
H4K5, H4K8 and H4K16 of the homozygous knock-out (KIKI) mice brain,
cerebellum and heart tissues; thus restoring the normal level of frataxin expression
after HDACi treatment for three consecutive days (Rai et al. 2008).
DNA demethylating agents, there are many DNA methylation inhibitors one
of these agents is 5-aza-2'-deoxycytidine which is a powerful inhibitor of DNA
methylation, it induces gene expression and differentiation in cultural cells in S-
phase only (Egger et al. 2004). It targets replicating DNA in place of cytosine and
traps DNA methyltransferases (Santos-Reboucas and Pimentel 2007). This
compound had been used for fragile-X disorder and it showed an increase in the
frataxin protein in fragile-X lymphoblasts in low doses because it has a cytotoxic
effect (Chiurazzi et al. 1998; Hebert 2008). For therapy that is more effective the
combination between HDACi and DNA demethylating agents were used. This
suggestion was used as treatment for fragile-X lymphoblast. The experiment
demonstrated that the level of transcription was increased and it has been suggested
to be used for FRDA (Chiurazzi et al. 1999; Hebert 2008).
Daniah Trabzuni Page 76
1.4.3 Molecules that increase frataxin mRNA or protien
There are several molecules have been reported to increase the frataxin
expression such as, sodium butyrate, hemin, cisplatin and recombinant human
erythropoietin (rhuEPO). rhuEPO shows an increase in the frataxin expression in
FRDA cells by increasing the translation, without any effect on mRNA expression
(Sturm et al. 2005; Babady et al. 2007). The molecular basic of this observation still
not clear but there are clinical trials currently in progress (Gottesfeld 2007).
1.4.4 Gene therapy approach
Viral gene based approach, is a valid theoretic approach but it has its own
technological limitations to apply it clinically. Adeno-associated viral and vector
expressing frataxin cDNA shown a decrease in the sensitivity to the oxidative stress
in FRDA primary fibroblast. Another promising approach for nervous system gene
therapy (TOOL) was reported, herpes simplex virus type 1 (HSV-1) amplicon vector
can express either the entire FXN genomic locus or frataxin cDNA and it can
successfully restore the normal phenotype (Gomez-Sebastian et al. 2007; Lim et al.
2007; Hebert 2008).

Daniah Trabzuni Page 77
1.5 In vitro and in vivo models
To facilitate having a comprehensive understanding of the frataxin deficiency
and its contribution to FRDA disease pathology and progression there is a need for in
vitro (cell lines) and in vivo (mouse) models as tools for several talented groups have
given the intention to evolve these models as reliable resources for FRDA
researchers.
1.5.1 In vitro models
Recently, the Hebert group investigated a stable HeLa cell lines. These cell
lines hold part of the first intorn of FXN, which contains (GAA∙TTC)15 or
(GAA∙TTC)148 repeats, fused to the coding sequence for the enhanced green
fluorescent protein (EGFP) gene. Results demonstrated reduced levels of GFP
expression in the (GAA∙TTC)148 cell line compared with the (GAA∙TTC)15 cell line
(Grant et al. 2006). In addition, a collection of established lymphoblast and
fibroblast cell lines obtained from FRDA patients, their parents and siblings with
different repeat numbers is available. These cell lines are considered a useful
resources to study FXN gene in its native chromosomal context (Gottesfeld 2007).
1.5.2 In vivo models
In order to study the FRDA disorder at all levels, mouse models are
considered the most appropriate approach for the in vivo experiments. The
homologous mouse gene (Frda) has 73% similarity to the human frataxin and it
shows a very high identity in exons 3 to 5 and less conservation in first two exons
(Cossee et al. 2000).
In 2000, Cossee and colleagues generated the first mouse model, the ‘Fxn
knockout mouse’, by homologous recombination to delete exon 4 (98bp), leading to
a framshift of the exon 5 coding sequence and resulting in severe truncation in

Daniah Trabzuni Page 78
Figure 1.32:
Two steps mating strategy. In the first step, Y47 transgenic mouse
(Y47+/ Frda+/+) was crossed with heterozygous knockout mouse
(Frda+/-). In the second step, the offspring (Y47+/ Frda+/-) was either
crossed with (Frda+/-) or intercrossed. Then the human transgenic
mouse on null background was generated (Y47+/ Frda+/-).
Explanation adapted from (Pook et al. 2001).
frataxin. The homozygous mouse (-/-) for the deleted Frdadel4 alleles showed an
early embryonic lethality as early as E6.5 and morphological abnormalities, which
indicates that frataxin is a vital protein for embryonic development. However, the
heterozygous mouse (+/-) for the deleted Frdadel4 was morphologically normal, viable
and has a normal life span (Cossee et al. 2000).
To solve the embryonic lethality of the homozygous Frda knockout mouse
Pook and colleagues have generated a human transgenic mouse, which contains the
whole FRDA locus in a 370 kb human yeast artificial chromosome (YAC), to rescue
the knockout mouse. Results indicated that human frataxin showed an expression at
a comparable level to the endogenous mouse gene, a successful functional
replacement for it, a right posttranslational modification, and the right localization in
the mitochondria. In addition, the FXN human transgenic mouse (Y47) contains
(GAA∙TTC)9 repeats and two copies of the gene, thus manifests a normal phenotype.
Furthermore, to generate the transgenic rescued mice (Y47+/ Frda-/-), a two step
strategy was used. The strategy is well explained in Figure 1.32 (Figure 1.32) (Pook
et al. 2001).

Daniah Trabzuni Page 79
A valid step ahead after generating the human wild-type FXN transgenic
rescued mouse was to generate a mouse model with an expanded (GAA)n∙(TTC)n
repeat into the YAC clones. In 2004, Pook and his group generated 2 lines of the
human FXN transgenic mice models, YG8 and YG22, containing (GAA∙TTC)190+90
and (GAA∙TTC)190 repeat expansions. Then these mice were cross bred with the
heterozygous knockout mouse (Frda+/-) and the offspring showed a reduced level of
frataxin mRNA and protein expression. In addition, these mice manifest the
neurodegenerative and cardiac pathological phenotype. In this model, it had been
proven that YG22 have a single copy of the FRDA gene, while YG8 have two copies
of the gene. This model has showed a (GAA)n∙(TTC)n repeat age related somatic
instability and repeat instability in the cerebellum. Therefore, this model is
considered an excellent model to further investigate epigenetic modifications and
potential therapeutic approaches (Al-Mahdawi et al. 2004; Al-Mahdawi et al. 2006;
Babady et al. 2007). Within this thesis, FXN expression levels, histone modification
and epigenetic changes were investigated within the brain, heart and liver tissues
from this mouse model.
Other mouse models were generated by different research groups, For
instance, Miranda and colleges generated the knock-in mouse in order to have a
mouse model with a reduced frataxin level. This mouse model was generated by the
insertion of (GAA∙TTC)230 repeats within the mouse frataxin gene. The homozygous
knock-in mouse (KIKI) is showing a reduced level of frataxin by 64-75% only from
the normal level and it is not associated with any obvious pathological phenotype.
Then these mice were crossed with the frataxin knockout mice to produce a knock-
in/knockout model (KIKO) with more reduced level of frataxin expression, by 25%
decrease (Miranda et al. 2002; Baralle et al. 2008).
Furthermore, another mouse model, which was developed by Sarsero and
colleagues using a 180kb modified bacterial artificial chromosome (BAC),
containing an in frame fusion of the human FXN gene and EGFP reporter system.
Although, these mice show a low level of frataxin, they do not develop any
phenotype. This model does not contain (GAA)n∙(TTC)n repeats (Sarsero et al.
2005; Babady et al. 2007; Gottesfeld 2007).

Daniah Trabzuni Page 80
Up to date, there is no mouse model that effectively parallels the progressive
human neurological disease; therefore research is ongoing to develop further FRDA
mouse models. Using a different approach, a new conditional knockout mouse
model was generated by the complete deletion for the mouse frataxin in specific
tissues such as, heart, skeletal muscle and neurons. This model demonstrates the
accumulation of damaged mitochondria, degenerative mechanism in the DRG and
the involvement of the frataxin in iron metabolism in the mitochondria. This model
is a very useful tool to study the mechanism of late-onset and slowly progressive
neurodegenration of the disease (Simon et al. 2004; Coppola et al. 2006; Babady et
al. 2007). The availability of thses mice models is a great help and support toward a
deep undertsatinding of the FRDA disorder at all levels.
1.6 Aim of the study
Friedreich ataxia (FRDA) is an autosomal recessive neurodegrantive disorder.
It is most often caused by homozygous expanded (GAA)n∙(TTC) repeats within
intron 1 of the FXN gene, as a consequence severely reduced level of frataxin
protein. Many studies have suggested that the expanded repeat may has the ability to
induce epigenetic modifications that cause the FXN transcription inhibition to occur.
In the past few years, epigenetic modifications have given a considerable
attention as an important mechanism that is contributing to the aetiology of FRDA
disorder. Therefore, the aim of this project is to investigate the effect of the
epigenetic changes such as, histone modifications including histone acetylation and
methylation of H3 and H4 in three different regions: the FXN promoter, upstream
GAA and downstream GAA within the FXN gene on the FXN mRNA transcription
level. In addition, investigate the effect of HDACi, which is an epigenetic promising
treatment, on the FXN mRNA transcription level and histone acetylation in YG8 and
YG22 transgenic mice brain, heart and liver tissues.

Daniah Trabzuni Page 81
Chapter 2
Material and Methods
2.1 Genotyping of mice
2.1.1 DNA extraction
Genomic DNA was extracted from mouse-tails as described by Wang and
Storm, 2006 (Wang and Storm 2006). Tails 5 mm in length were collected in 1.5 ml
tubes (Eppendorf). Each tail sample was digested in 400 μl of digestion buffer (100
mM Tris-HCl pH= 8.0 [Tris-hydroxymethylaminomethane], 5 mM EDTA [ethylene
diamine titra acetic acid], 200 mM NaCl [sodium cholride], and 0.2% SDS [sodium
dodecyl sulfate], [Sigma,UK]) + 10 μl of 50 mg/ml proteinase K (BDH), then
incubated in a 55 °C waterbath overnight. The incubated sample was then vortexed
(Whirlimixer) for 15 seconds (s) and centrifuged (Eppendorf Micro Centrifuge
Model 5415 R) at 13,000 rpm (16110 g) for 5 minutes (min) at room temperature
(RT). The supernatant was collected into a clean, labelled tube; 1 ml of absolute
ethanol (Hayman,UK) was added, mixed and placed at -80 °C for 10-15 min. The
tube was centrifuged at 13,000 rpm for 30 min at 4 °C and the supernatant was
discarded. The pellet was washed with 1 ml of 70% (v/v) ethanol and centrifuged at
13,000 rpm for 20 min at 4 °C; the ethanol was discarded. The pellet was left to air-
dry for 10-15 min and then suspended in 50-100 μl T.E. (10 mM Tris, 1mM EDTA,
pH= 8.0) buffer and stored at 4 °C.
2.1.2 (GAA) PCR
A polymerase chain reaction (PCR) was performed on mouse genomic DNA
samples to detect the genotype (Campuzano et al. 1996). The following primers
were used:

Daniah Trabzuni Page 82
GAA-F: 5'-GGGATTGGTTGCCAGTGCTTAAAAGTTAG-3' (Sigma GENOSYS)
GAA-R: 5'-GATCTAAGGACCATCATGGCCACACTTGCC-3' (Sigma GENOSYS) For each sample, the following reaction was set up in a 0.2 ml tube:
Controls were included every time the PCR was performed and are described below:
1- Positive control 2- Negative control 3- Blank (water) control
The amplification conditions were as follows:
Reagents Concentration Quantity in μl
Kapa Master mix (KapaBiosystem,UK)
2X 12.5
GAA-F primer 50 mM 0.25 GAA-R primer 50mM 0.25
dH2O - 11 Sub-total - 24
DNA - 1 Total - 25
Steps Temperature Duration Cycles
Denaturation 94 °C 2 mins 1
Denaturation 94 °C
60 °C
68 °C
10 s
30 s
45 s
10 Annealing
Elongation
Denaturation 94 °C
60 °C
68 °C
10 s
30 s
1 min
20
With 20 s increments Annealing
Elongation
Extension 68 °C 10 mins 1

Daniah Trabzuni Page 83
Amplification was performed using a PTC-225 Peltier Thermal Cycler (MJ
Research). After amplification, 5-10 μl of PCR product was loaded on a 1 % (w/v)
agarose mini-gel (1 g agarose [Invitrogen, UK] in 100ml 1X TBE [89 mM tris-
borate, 2 mM EDTA] buffer) (Sigma, UK), stained with 1.3μl of 10mg/ml ethidium
bromide (EtBr) with 5 μl of 1 kb plus DNA ladder [Invitrogen, UK] at 80 volts for
30-45 min in a Flowgen mini-gel electrophoresis tank. The photograph of the gel
was taken and evaluated using an Alphaimage 2200, INNOTECH system.
2.1.3 (FXN) knockout PCR
This PCR was performed (Cossee et al. 2000) to identify the wild-type or
knockout Fxn alleles. The following primers were used:
WJ5: 5'-CTGTTTACCATGGCTGAGATCTC-3'
WN39: 5'-CCAAGGATATAACAGACACCATT-3'
WC76: 5'-CGCCTCCCCTACCCGGTAGAATTC-3'
For each sample, the following reaction was set up:
Controls were included every time this PCR was performed. They are as follows:
1- Wild-type control 2- Heterozygous control
3- Rescue control 4- Blank (water) control
Reagents Concentration Quantity in μl
Kapa Master mix 2X 12.5 WJ5 primer 50 mM 0.5 WN39 primer 50mM 0.5 WC76 primer 50mM 0.1
dH2O - 10.4 Sub-total - 24
DNA - 1 Total - 25

Daniah Trabzuni Page 84
The amplification conditions were as follows:
After amplification, 10μl of PCR product was loaded on a 2% (w/v) agarose
mini-gel (2g agarose in 100ml 1X TBE buffer) stained with 1.3 μl of 10 mg/ml
(EtBr) along with 5μl of the 1kb plus DNA ladder at 80 volts for 30-45 minutes in a
Flowgen mini-gel electrophoresis tank. The photograph of the gel was taken and
evaluated using Alphaimages2200, INNOTECH system.
2.2 RNA extraction using TRIZOL®Reagent
RNA was isolated from brain, heart and liver mouse tissues that were
between 50 -100 mg in weight (Chomczynski and Sacchi 1987). The various tissues
were collected and weighed in 1.5 ml RNAse-free eppendorf tubes. All steps were
performed on dry ice until the TRIZOL®Reagent (Invitrogen) was added. Dr.Al-
Mahdawi (Brunel University, UK) had previously prepared the RNA and cDNA
samples from the first group of mouse tissues (Heart, Brain, and Liver) and the
human (heart and brain) tissues.
2.2.1 Tissue homogenisation
A) For brain and liver tissue
A small piece of tissue was cut and weighed in a 1.5 ml tube. 250 μl of
TRIZOL was added to the tissue and homogenised with an RNAse-free plastic
Steps Temperature Duration Cycles
Denaturation 94 °C
54 °C
72 °C
20 s
20 s
20 s
30 Annealing
Elongation
Extension 72 °C 6 mins 1

Daniah Trabzuni Page 85
pastille. In this step, the solution was homogenised until no big pieces remained. A
further 250 μl of TRIZOL was added and the tissue was again homogenised with the
pastille. Finally, 500 μl of TRIZOL was added and again the solution was
homogenised.
B) For heart tissue
Frozen tissue was ground into a powder consistency with a pestle and mortar,
TRIZOL was added, or TRIZOL was added to the tissue in a bijou tube and
homogenised with an electric homogeniser.
2.2.2 Phase separation
The homogenised tissue sample was incubated in a 30 °C water bath for 5
min. After incubation, it was mixed gently and firmly by inversion 4-5 times. 200 μl
of chloroform (CHCl3) (Sigma,UK) was added, the tube was mixed vigorously by
hand for 15 s. The tube was incubated in a 30 °C water bath for 15 min. The sample
was centrifuged at 13,000 rpm for 15 min at 4 °C. 5 μl of the upper aqueous phase
was transferred to a fresh-labelled tube to run in a 1% agarose mini-gel along with 1
kb plus DNA ladder at 80 volts for 25-30 min. The photograph of the gel was taken
and evaluated.
2.2.3 RNA precipitation and wash
The aqueous phase (upper layer, with approximately 60 % of TRIZOL
volume added) was transferred to a fresh-labelled 1.5 ml tube. It should be noted
that it is very important not to disturb the bottom phase. RNA was precipitated by
adding and mixing 500 µl of isopropyl alcohol to the aqueous phase, followed by
incubation at 30 ºC in a water bath for 10 min. The sample was then centrifuged at
13,000 rpm for 10 min at 4 °C, where a small white pellet can be observed after
stage. The isopropyl alcohol was discarded and 1 ml of 75% (v/v) ethanol was added

Daniah Trabzuni Page 86
to wash the RNA pellet. The sample was vortexed and centrifuged at 13,000 rpm for
5 min at 4 °C, and the supernatant was discarded. The pellet was left to air-dry for
10-15 min and then suspended in 50-100 μl of pre-heated elution buffer to 60°C.
Finally, the sample was incubated in a 60 °C hot block for 10 min. 5μl of RNA
sample was used to check the quality of the extracted RNA. After incubation, the
RNA sample can be used immediately for cDNA synthesis or stored at -80 °C for
future use. The tube containing the bottom phase was stored at - 20° C for DNA
extraction in the future.
2.2.4 RNA quality check
The quality of each RNA sample was checked by running 5 μl on a 1 %
agarose mini-gel along with 1 kb plus DNA ladder at 80 volts for 25-30 min. The
photograph of the gel was taken and evaluated.
In addition, the optical density (OD) of each RNA sample was measured at a
wavelength of 260 nm. The concentration of each sample was calculated, together
with the ratio of absorbance at 260nm/280nm.
2.3 cDNA synthesis
RNA was synthesised into cDNA using the Cloned AMV First-Strand cDNA
Synthesis Kit, (Invitrogen).
2.3.1 cDNA synthesis The first mix was prepared for each sample in a 1.5 ml tube on ice as follows:
Reagents Concentration Quantity in μl
Oligo (dT20) primers 50 pmoles 1 dNTPs 10 mM 2
DEPC-treated water - 7.5 RNA - 1.5 Total - 12

Daniah Trabzuni Page 87
The sample was incubated in a 65 °C water bath for 5 min, and placed
directly on ice. The second mix was prepared on ice for each sample in order to be
added to the previous mix in a 1.5ml tube on ice as follows:
8 μl of the second mix was added to each tube placed on ice ouse and the
sample was incubated in a 50 °C water bath for 60 min. The reaction was stopped by
transferring the tube to a 85 °C hot block for 5 min. The sample was then used
immediately for PCR or stored at -20 °C for future use.
2.3.2 cDNA quality check
Further PCR amplification was carried out in order to check the quality of the
newly-synthesised cDNA sample, using different sets of primers depending on the
expression profile to be tested and the sample type used. The following sets of
primers were used:
FxnRT-m-F 5'-CAGAGGAAACGCTGGACTCT-3'
FxnRT-m-R 5'-AGCCAGATTTGCTTGTTTGGC-3'
Gapdh-m-F 5'-ACCCAGAAGACTGTGGATGG-3'
Gapdh-m-R 5'-GGATGCAGGGATGATGTTCT -3'
Reagents Concentration Quantity in μl
cDNA synthesis buffer 5X 4 DTT 0.1 M 1
RNaseOUT 40 U/ μl 1 DEPC-treated water - 1
Cloned AMV RT 15 units/ μl 1
Total 8
Master mix 1 +12 Final Volume 20
Mouse
Human

Daniah Trabzuni Page 88
Gapdh-h-F 5'- GAAGGTGAAGGTCGGAGT -3'
Gapdh-h-R 5'- GAAGATGGTGATGGGATTTC-3'
FRTIb-F 5'- TTGAAGACCTYGCAGACAAG -3'
RRTII-R 5'- CCAAACAAGCAAATCTGGCT -3'
For each sample the PCR reaction mix was prepared in a 1.5 ml tube on ice as
follows:
Controls were included every time this PCR was performed. They are as follows:
1- Human Placenta cDNA 2- Blank (water) control
The amplification conditions were as follows:
10μl of PCR product was resolved on a 2% (w/v) agarose gel, which was
photographed and evaluated. The cDNA sample was stored at -20°C to be used for
quantitative Real-Time PCR.
Reagents Concentration Quantity in μl
Kapa Master Mix 2X 12.5 FW primer 5 mM 1 RV primer 5 mM 1
dH2O 9.5 DNA - 1 Total - 25
Steps Temperature Duration Cycles
Denaturation 94 °C 1 min 1
Denaturation 94 °C
60 °C
72 °C
20 s
20 s
30 s
35 Annealing
Elongation
Extension 72 °C 10 mins 1
Human
Mouse and Human
Y= C or T

Daniah Trabzuni Page 89
2.4 Chromatin immuno-precipitation assay (ChIP)
Histone modifications at three regions of FXN gene were detected by
chromatin immune-precipitation assay (ChIP) (Al-Mahdawi et al. 2008). Human
and mouse brain tissues were included and were between 30-40 mg in weight. They
were collected and weighed in a 1.5 ml Eppendorf tube. All steps were performed on
dry ice until the 1X PBS (phosphate buffered saline, Sigma,UK) was added. Dr.Al-
Mahdawi (Brunel University, UK) had previously prepared the first set of Brain
ChIP samples (mouse and human) with different antibodies.
2.4.1 Tissue homogenisation
A) For brain
A small piece of tissue was cut and weighed in a 1.5 ml tube. 250 μl of 1X
PBS was added to the tissue and homogenised with a plastic pastille. In this step, the
solution should be homogenised until there are no large pieces remaining in the
solution.
2.4.2 DNA and protein cross-linking
A further 722.9 μl of 1X PBS and 27.1 μl of 35% formaldehyde (Sigma,UK)
were added to the sample , which was then left at RT on a shaker (Grant Boekel
BFR25) for 20 min. The cross-linking reaction was stopped by adding 62.5 μl of
glycine (Sigma,UK) and the tube was mixed again on the shaker at RT for 5 min.
The sample was then centrifuged at 5000 rpm for 2 min at RT, and the supernatant
was subsequently discarded. A small white pellet can be observed at this stage. The
pellet was washed twice with 500 μl of 1X cold PBS and then centrifuged at 5000
rpm for 2 minat RT. The PBS was discarded each time.

Daniah Trabzuni Page 90
The pellet was resuspended in 250 μl of cell lysis buffer (10 mM HEPES [N-
2-hydroxyethylpiperazine-N'-2-ethanesulfonic Acid], 85 mM KCl [potassium
chloride], and 0.5 % NP-40 [Nonidet P-40], [Sigma,UK]) and 10 μl of 25X ROCHE
protease Inhibitor (RPI) and then the tube was incubated on ice for 10 min. The tube
was centrifuged at 5000 rpm for 5 min at 4° C and the supernatant was discarded.
The pellet was resuspended 100 μl of nuclei lysis buffer (1 % SDS, 10 mM EDTA,
and 50 mM Tris [Sigma,UK]) + 5 μl of 25 X ROCHE protease Inhibitor (RPI) and
the tube was incubated on ice for 10 minutes. As an optional step in this method, the
sample can be homogenised again at this stage.
5 μl of the sample was transferred to a fresh 1.5 ml tube labelled as “before
sonication”, and kept on ice to be evaluated on a 1 % agarose gel in order to check
the DNA sample before the sonication step.
2.4.3 DNA shearing
The DNA sample was sheared by sonication (Soniprep 150, MSE) three
times for 12 s, each time at 18 amplitude. After each sonication, the sample was kept
on ice for 1-2 min to cool. The sample was centrifuged at 13,000 rpm for 10 min at
4° C. The supernatant was collected in to a fresh labelled 1.5ml tube to be used in
the DNA immuno-precipitaion step. 5 μl of the sample was transferred to a fresh 1.5
ml tube labelled as “after sonication” and kept on ice to be evaluated on a 1%
agarose gel, this is to check the DNA sample after the sonication step. The two
samples, before and after sonication, were run on a 1% agarose gel, which was
photographed and evaluated.
2.4.4 DNA immuno-precipitation
DNA was immuno-precipitated with anti-acetylated histone H3 and H4
antibodies: H3K9ac, H3K14ac, H4K5ac, H4K8ac, H4K12ac, H4K16ac, and
H3K9me2 (Upstate, cell signalling solution, UK) and H3K9me3 (Diegenode).

Daniah Trabzuni Page 91
Protein-A-agarose beads (Upstate, cell signalling solution, UK) were used and
prepared for this step. 40 μl of the bead suspension was washed twice with 1 ml of
1X PBS in a fresh 1.5ml tube, and then centrifuged at 5000 rpm for 2 min at RT.
The PBS was discarded each time. The supernatant from Section 2.4.3 was added to
the beads and mixed gently by tapping without creating any bubbles. The tube was
incubated on the shaker for two hours at 4 °C and then centrifuged at 5000 rpm for 5
min at 4 °C.
The supernatant was transferred to a fresh labelled 1.5 ml tube; 10 μl of this
supernatant was transferred to a new 1.5 ml tube labelled as “INPUT” and stored
immediately at – 80 °C. 1.5 ml of dilution buffer (1 % triton, 150 mM NaCl [soduim
chloride], 2 mM EDTA, and 20 mM Tris) + 60 μl of 25X of RPI was added to the
supernatant, and mixed. The mixture was divided into three 1.5 ml tubes, each
containing approximately 550 μl. One of the tubes was labelled as “minus antibody”
containing only the mixture, and the other two tubes contained the mixture and 5 μl
of each studied antibody. Tubes were incubated on the shaker overnight at 4 °C.
The following day, each incubated mixture was transferred to a fresh 1.5 ml
tube containing 60 μl of protein-A-agarose beads, washed twice with 1X PBS and
mixed. The tube was incubated on the shaker for two hours at 4°C. After
incubation, the tube was centrifuged at 6000 rpm for 30 seconds at RT. The beads
were washed with 1 ml of low salt buffer (1 % Triton, 0.1 % SDS, 150 mM NaCl, 2
mM EDTA, and 20 mM Tris), the tube was mixed on the shaker for 5 min at RT and
then centrifuged at 6000 rpm for 30 s at 4 °C. The buffer was discarded each time.
This process was repeated three times.
Finally, the beads were washed once with 1 ml of high salt buffer (1 %
Triton, 0.1 % SDS, 500 mM NaCl, 2 mM EDTA, and 20 mM Tris). The tube was
mixed on the shaker for 5 min at RT and centrifuged at 6000 rpm for 30 s at 4 °C,
and the buffer was discarded. 150 μl of elution buffer (1 % SDS, and 100 mM
NaHCO3) was added to each tube and mixed by tapping. The tube was incubated in
a 65 °C water bath for 10 min. The tube was centrifuged at 6000 rpm for 30 s at RT.
The supernatant was collected into a fresh labelled 1.5 ml tube. A further 150 μl of
the elution buffer was added and the tube was incubated in a 65 °C water bath for 10

Daniah Trabzuni Page 92
min. The supernatant was collected and combined with the first supernatant. The
total volume was 300 μl.
300 μl of the elution buffer was added to the INPUT sample after thawing.
30 μl of the sample was transferred to a fresh 1.5 ml tube labelled as “Western Blot”
and stored at -80 °C for future use.
1.2 μl of 50 mg/ml proteinase K was added to each sample. The sample was
incubated in a 37 °C water bath for 30 min and the tube was transferred to a 65 °C
water bath overnight (16 hours). This step was to reverse the DNA protein cross
linking.
2.4.5 DNA Phenol /Chloroform extraction
Genomic DNA was extracted (Sambrook et al. 1989) by adding 270 μl of
equilibrated phenol (Sigma) to each sample. The sample was mixed on the shaker
for 5 min at RT, and centrifuged at 13,000 rpm for 5 min at RT. The upper aqueous
phase was collected into a fresh 1.5 ml tube containing 300 μl of CHCl3 / IAA
(chloroform/ isoamyl-alcohol). The tube was vortexed briefly and centrifuged at
13,000rpm for 5 min at RT. The aqueous phase was collected into a fresh 1.5 ml
tube containing (4 μl of 20 μg/ μl glycogen + 30μl of 2 M sodium acetate + and 600
μl absolute ethanol) and the sample was incubated at -80°C for 10 min. The tube
was centrifuged at 13,000 rpm for 30 min at 4 °C and the supernatant was discarded.
The pellet was washed with 500 μl of 70% (v/v) ethanol and centrifuged as described
previously; and the ethanol was discarded. The pellet was left to air-dry for 10-15
min and then suspended in 50 μl elution buffer (10 mM Tris, Qiagen), 100 μl for the
INPUT, and stored at 4 °C or -20 °C to be used for the quantitative Real-Time PCR.

Daniah Trabzuni Page 93
2.4.6 DNA quality check
Further PCR amplification was carried out to in order check the quality of the
DNA sample, using 4 different sets of primers depending on the sample type used.
The following sets of primers were used:
FXN promoter PCR
FXN proF 5'-CCCCACATACCCAACTGCTG-3'
FXN proR 5'-GCCCGCCGCTTCTAAAATTC-3'
GAA upstream PCR
FXN upF 5'-GAAACCCAAAGAATGGCTGTG-3'
FXN upR 5'-TTCCCTCCTCGTGAAACACC-3'
GAA downstream PCR
FXN downF 5'-CTGGAAAAATAGGCAAGTGTGG-3'
FXN downR 5'-CAGGGGTGGAAGCCCAATAC-3'
GAPDH (Human) PCR
GAPDH F 5'-CACCGTCAAGGCTGAGAACG-3'
GAPDH R 5'-ATACCCAAGGGAGCCACACC-3'
GAPDH (Mouse) PCR
GapdhM-F 5'-TGACAAGAGGGCGAGCG-3'
GapdhM-R 5'-GGAAGCCGAAGTCAGGAAC-3'
For each sample the PCR reaction mix was made as follows:
Controls were included every time this PCR was performed. They are as follows:
Reagents Concentration Quantity in μl
Kapa Master Mix 2X 12.5 FW primer 5 mM 1 RV primer 5 mM 1
dH2O 9.5 DNA - 1 Total - 25

Daniah Trabzuni Page 94
1- Genomic human placenta DNA 2- Blank (water) control
The amplification conditions were as follows:
10μl of PCR product was resolved on a 2% (w/v) agarose gel, which was
photographed and evaluated. The ChIP DNA sample was evaluated and stored at
-20 °C to be used for the quantitative Real-Time PCR.
2.5 Relative quantitative Real-time qPCR
Quantification was performed by using an ABI Prism® 7900 HT real-time
PCR instrument (Applied Biosystems).
2.5.1 cDNA quantification
The cDNA sample from step 2.3.1 was quantified using real-time PCR in
triplicate. Primers were used in this experiment were the same sets of primers were
used in Section 2.3.2.
For each DNA sample, two PCR reaction master mixes were prepared (Fxn-
RT + Gapdh) or (FRTIb + Gapdh) depending on the sample type used. Reaction
mixes were prepared as follows:
Steps Temperature Duration Cycles
Denaturation 94 °C 1 min 1
Denaturation 94 °C
60 °C
72 °C
20 s
20 s
20 s
35 Annealing
Elongation
Extension 72 °C 10 mins 1

Daniah Trabzuni Page 95
Controls were included every time this PCR was performed. They are as follows:
1- Human placenta cDNA 2- Blank (water) control
The q-PCR amplification conditions were as follows:
After amplification, 10 μl of PCR product was resolved on a 2 % (w/v)
agarose gel, which was photographed and evaluated.
2.5.2 ChIP genomic DNA quantification
The DNA sample from Section 2.4.5 was quantified using real-time PCR in
triplicate. Primers that were used in this experiment are the same that were described
in Section 2.4.6. For each DNA sample, four PCR reaction master mixes were
prepared; FXN promoter; GAA upstream; GAA downstream; and GAPDH (Human
Reagents Quantity in μl Quantity in μl Concentration
SYBR® Green Reagent Applied Biosystems
12.5 12.5 2X
FW primer 0.5 1 5 mM RV primer 0.5 1 5 mM
dH2O 10.5 9.5 cDNA 1 1 - Total 25 25 -
Fxn-RT mix Gapdh and FRTIb mixes

Daniah Trabzuni Page 96
or Mouse) depending on the sample type used. Reaction mixes were prepared as
follows:
Controls were included every time this PCR was performed. They are as
follows:
1- Genomic Human Placenta DNA 2- Blank (water) control
The q-PCR amplification conditions were as follows:
10μl of PCR product was resolved on a 2 % (w/v) agarose gel, which was
photographed and evaluated. All Results were analysed using the ABI PRISM®
7900HT Sequence Detection System (SDS 2.1) software.
Reagents Concentration Quantity in μl
SYBR® Green Reagent Applied Biosystems
2X 12.5
FW primer 5 mM 1
RV primer 5 mM 1
dH2O 9.5
ChIP DNA - 1 Total - 25

Daniah Trabzuni Page 97
Chapter 3
Results
3.1 Genotyping of mice
The DNA samples from the transgenic rescued mice were PCR genotyped for
the introduced (GAA∙TTC)190 and (GAA∙TTC)190+90 repeats and for the wild-type or
Fxn knockout alleles. In order, to proceed with the project we had to make sure that
we have the tissue sample, such as, brain, heart and liver from the transgenic mouse
that contains the complete human FXN gene with the (GAA)n∙(TTC)n on a null
background (knockout), therefore, this is an essential confirmation step to be
processed.
3.1.1 Screening for the (GAA)n∙(TTC)n repeats
By using the GAA primers, we expected a PCR product size around 460bp, in
addition to the (GAA)n∙(TTC)n repeat size. The size of the introduced expanded
(GAA)n∙(TTC)n repeat varies because of the genomic instability; as a result,
different PCR products that range from approximately 800 bp to 1.6 kb were
amplified. Selected samples from both transgenic mice lines YG8 and YG22 were
screened for the repeat (Figure 3.1) to be used in this project.
3.1.2 Screening for the Fxn knockout alleles PCR
The DNA samples were screened for the Fxn mouse alleles. In this PCR we
used three primers; the WJ5 and WN39 primers were used to amplify the normal
allele and give a 520bp PCR product, whereas, the WJ5 and WC76 primers were
used by the mutant allele to amplify and give a 245bp PCR product (KO). Different
genotyping results including wild-type, homozygous and heterozygous knockout

Daniah Trabzuni Page 98
Figure 3.1: GAA genotyping PCR product. Selected PCR products represent the positive and the negative amplifications for GAA repeat. Lanes 1-3, positive YG8 samples. Lanes 4, 5, 7-9, 11, 12, positive YG22 samples. Lanes 6 and 10, negative YG8 samples. Lane 13, a negative control for the GAA repeat. Lane 14, a positive control. Lane 15, a negative water control and Lane 16, 1 kb plus ladder.
were observed. The ratio between the three primers has to be adjusted to get an
equal product from each allele and balanced intensity for each band. In figure 3.2
lanes 2, 5 and 6 represent this problem, the WT band is very weak compare with the
KO band (Figure 3.2).

Daniah Trabzuni Page 99
Figure 3.2: Fxn knockout PCR. Selected PCR products represent the amplification of the WT and the KO alleles. It is showing two bands: the wild type band 520bp and the KO band 245bp. Lanes 2, 5, 6, heterozygous knockout samples Lanes 3 and 4, wild-type samples. Lane 7, a wild-type control. Lane 8, a KO heterozygous control. Lane 9, a KO homozygous control. Lane 10, a negative water control. Lanes 1 and 11, the 1 kb plus ladder.
3.2 FXN mRNA level in the human brain and transgenic
mice brain, heart and liver tissues
The mRNA level in FRDA patients and in the transgenic mice was
investigated previouslyby semi-quantitative RT-PCR. Studies have indicated a
decreased level of frataxin mRNA and frataxin protein in most of the tissues in
human and mouse (Al-Mahdawi et al. 2006; Gottesfeld 2007).
For a further more accurate investigation, we performed two quantitative RT-
PCR experiments to detect the frataxin mRNA levels in human and mouse in
different tissues. First, the detection of frataxin mRNA level in the brain tissue of a
FRDA patient in comparison with a normal control. Second, the detection of the
frataxin mRNA level in the brain and heart of three transgenic mice lines (Y47, YG8,
YG22). RNA samples were extracted from the tissues, followed by the cDNA
synthesis. This was followed by the quantification of the frataxin mRNA from the

Daniah Trabzuni Page 100
cDNA was performed using real-time qPCR with a designed set of primers that are
specific for the human FXN gene, human GAPDH and mouse GAPDH for the
normalization.
3.2.1 RNA extraction quality check
A quality check step is an important procedure, ensuring us that there is a
sufficient quantity and good quality of the RNA to further proceed with the
experiment. Extra care is required in the RNA extraction protocol, especially with
respect to DNAse contamination, which may result in a certain degree of RNA
degradation, as seen in all lanes in the picture (Figure 3.3). The OD260 of the RNA
samples was measured to check the purity of the RNA sample in addition to the
quantity.
3.2.2 cDNA synthesis quality check
The cDNA was synthesized and the quality of the DNA was checked by
performing a PCR reaction using any set of the cDNA primers that are listed on page
87-88, Chapter 2). For examples, see Figures 3.4 and 3.5.
Figure 3.3: RNA extraction. Selected mouse brain RNA samples from HDACi study showing the two main expected RNA bands 28S and 18S. Lanes 1-4, placebo YG8 mice. Lanes 5-8, HDACi treated YG8 mice. Lane 9,

Daniah Trabzuni Page 101
Figure 3.4: cDNA quality check PCR 1. Selected PCR products represent cDNA mouse brain samples using cDNA mouse FXN primers. Lanes 1-8, YG8 cDNA samples giving the right band size. Lane 9, a positive control (human placenta cDNA). Lane 10, a negative water control and lane 11, 1 kb plus ladder.
Figure 3.5: cDNA quality check PCR 2. Selected PCR products represent cDNA mouse brain samples using cDNA mouse GAPDH primers. Lanes 1-8, YG8 cDNA samples giving the right band size. Lane 9, a positive control (human placenta cDNS). Lane 10, a negative water control and lane 11, 1 kb plus ladder.

Daniah Trabzuni Page 102
3.2.3 Relative quantitative, Real-time qRT-PCR
Reverse transcriptase quantitative PCR (qRT-PCR) has been the key
technology for analyzing the gene expression because of its quick, high throughput,
easiness and lower cost. The real-time PCR technique allows quantification of PCR
products in real-time during each PCR cycle, so the quantitative measurement is
accumulating during the reaction and then, a fluorescent detector molecule such as,
SYBR green will carry out the measurement of the product. SYBR green is an
intercalating dye; it binds to the product and emits a strong fluorescence. It is
inexpensive, easy to use and can be used for any reaction (VanGuilder et al. 2008).
The determination of the frataxin mRNA in the human and transgenic mouse tissues
was conducted using this technique.
3.2.3.1 FXN mRNA level in the human brain and heart tissues
The FXN transcription level in the brain tissue of a FRDA patient with
(GAA∙TTC) 750/650 repeats showed a dramatic decrease, it showed a mean value of
9% compared with a normal control, which was normalized to a 100 % (Figure 3.6).
The decreased level of the frataxin mRNA was expected especially in the brain, as it
is considered to be the primary affected organ in the body.
This result is in consensus with previous studies that indicated a reduced level
of fratxin mRNA in different tissues in FRDA patients. It has been suggested that
many factors are involved in reducing the frataxin transcription such as, DNA
methylation patterns that located at upstream, downstream and at the promoter region
around the (GAA)n∙(TTC)n repeat. In addition, the histone modifications increase
the trimethylation of H3K9 and decrease the acetylation of other histones in FXN
gene (Greene et al. 2007; Al-Mahdawi et al. 2008).
The experiment for the human heart samples failed to produce a reliable mean
values three consecutive times. Further adjustment and troubleshooting were
required to proceed with the these samples were performed using the brain samples.
However, we did not proceed further because of the time factor, in addition of the

Daniah Trabzuni Page 103
Figure 3.6: qRT-PCR analysis of FXN mRNA in human brain tissue. mRNA was isolated from brain samples of a FRDA patient and unaffected individual. The samples were normalized to the human GAPDH as an endogenous control gene. The mean values of the affected were normalized to the normal control values (100 %). Each sample was analyzed and amplified in biological triplicate. The error bars represent S.E.Ms.
concerns regarding about the transgenic mice; thus, these experiments should be
considered in the future work.
3.2.3.2 FXN mRNA level in the transgenic mice brain and heart tissues
The same experiment was conducted on the transgenic mice Y47, YG8 and
YG22 to compare the frataxin mRNA profile in mouse within these three model lines
and with the human profile. The frataxin mRNA level was investigated in the brain
and heart tissues from each line. The results showed that the frataxin mRNA level in
YG8 and YG22 lines is decreased by approximately 65 to 68 % compare with the
Y47, which contains the normal repeat size. In addition, this pattern is similar to the
human pattern in the previous section (Figure 3.7).

Daniah Trabzuni Page 104
Figure 3.7: qRT-PCR analysis of FXN mRNA in transgenic mouse brain tissues. Showing the values mRNA level which was isolated from six brain samples from each of Y47(GAA∙TTC)9, YG8 (GAA∙TTC)190+90 and YG22 (GAA∙TTC)190 repeat expansions. The samples were normalized to the mouse GAPDH as an endogenous control gene. The mean values of the affected were normalized to the normal control values (100 %). Each sample was analyzed and amplified in biological triplicate. The error bars represent S.E.Ms.
In conclusion, this experiment confirms that the expanded (GAA)n∙(TTC)n
repeats have a primary role in inhibiting frataxin transcription and it shows the effect
of varying sizes of the repeat that can differentiate fratxin mRNA level. In addition,
it confirms that these mice models are a reliable and useful model for FRDA research
because of it similarity to the human system.
Similar interpretation was made with the mouse heart samples, the frataxin
mRNA level in YG8 and YG22 was reduced by approximately 20 to 24 % compared
with Y47 (Figure 3.8). The decreased range in the heart tissues is less than the
decreased range in the brain tissues and that may explain that the cardiac symptoms,
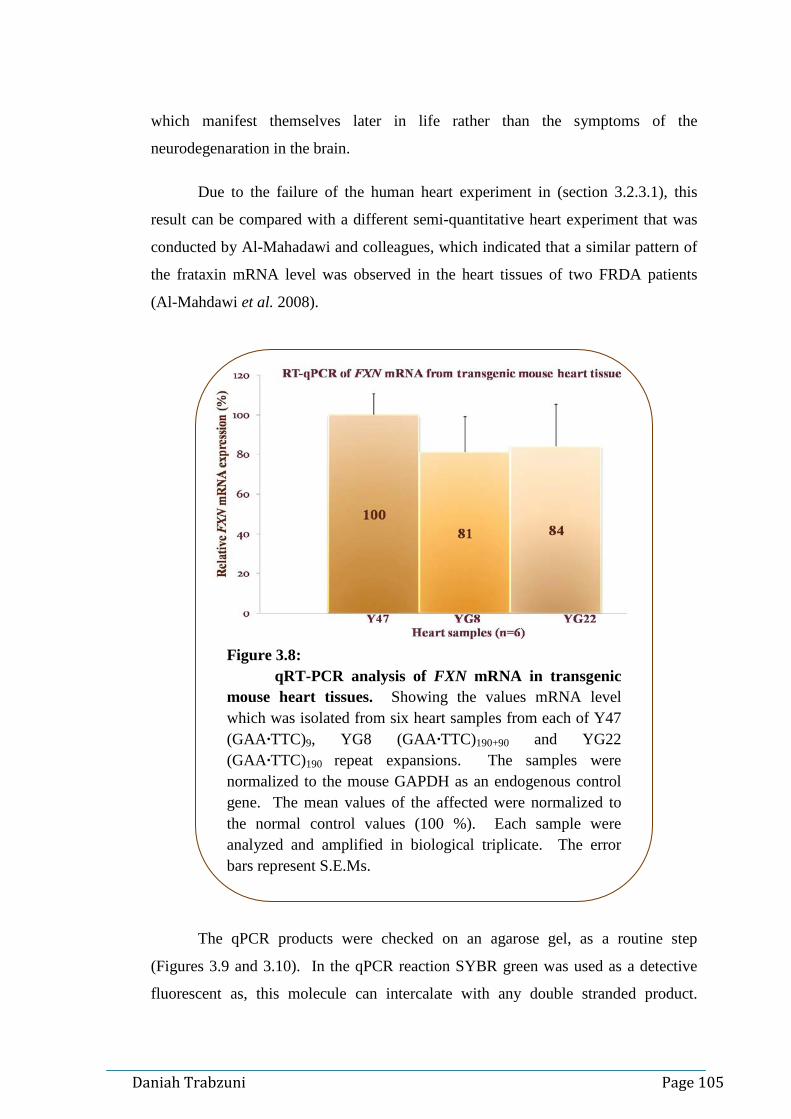
Daniah Trabzuni Page 105
Figure 3.8: qRT-PCR analysis of FXN mRNA in transgenic mouse heart tissues. Showing the values mRNA level which was isolated from six heart samples from each of Y47 (GAA∙TTC)9, YG8 (GAA∙TTC)190+90 and YG22 (GAA∙TTC)190 repeat expansions. The samples were normalized to the mouse GAPDH as an endogenous control gene. The mean values of the affected were normalized to the normal control values (100 %). Each sample were analyzed and amplified in biological triplicate. The error bars represent S.E.Ms.
which manifest themselves later in life rather than the symptoms of the
neurodegenaration in the brain.
Due to the failure of the human heart experiment in (section 3.2.3.1), this
result can be compared with a different semi-quantitative heart experiment that was
conducted by Al-Mahadawi and colleagues, which indicated that a similar pattern of
the frataxin mRNA level was observed in the heart tissues of two FRDA patients
(Al-Mahdawi et al. 2008).
The qPCR products were checked on an agarose gel, as a routine step
(Figures 3.9 and 3.10). In the qPCR reaction SYBR green was used as a detective
fluorescent as, this molecule can intercalate with any double stranded product.

Daniah Trabzuni Page 106
Therefore, any presence of the non-specific products or primer dimers in the reaction
can interferes with the products and gives a false positive result. Therefore, this
routine step is essential in order to have the right evaluation for the quality of the
qPCR, which includes, primer design, choosing the right annealing temperature, and
the right concentration of the PCR mix contents.
Figure 3.9: Quality check of the qPCR product 1. Selected PCR products amplified from mouse brain samples using cDNA human RT-FXN primers. Lanes 1-12, YG8 cDNA samples giving the right band size. Lane 13, 1 kb plus ladder.

Daniah Trabzuni Page 107
Figure 3.10: Quality check of the DNA qPCR product 2. Selected PCR products amplified from mouse heart samples using cDNA mouse GAPDH primers. Lanes 1-8, YG22 cDNA samples giving the right band size. Lane 10, 1 kb plus ladder.

Daniah Trabzuni Page 108
3.3 Histone modifications of FXN in human and
transgenic mouse brain tissues
Previous studies demonstrated that the heterochromatin formation and the
histone modifications potentially regulate FXN transcription. Heterochromatin
structure can block the access of necessary transcription factors and alter the
modifications of the histone tails. In many studies it has been confirmed that very
high trimethylation of H3K9 and hypoacetylation of H3K14, H4k5, H4K8 is a
hallmark of the heterochromatin and gene silencing in FRDA (Gottesfeld 2007;
Greene et al. 2007; Rai et al. 2008).
3.3.1 Chromatin immuno-precipitation assay (ChIP)
To investigate the histone modifications pattern in our mice model and
compare the differences within the three different lines Y47, YG8, YG22 and with
the human pattern, the chromatin immuno-precipitation assay (ChIP) was used.
ChIP assay is quantitative, straightforward and is relatively standard. It is widely
applied for measuring the association of proteins with specific genomic region to
predict modified peptide, for instance, acetylation, methylation and phosphorylation.
In this experiment, the formaldehyde is used to cross-link between the protein
(histone) and DNA, and then the DNA is fragmented by sonication to give an
average DNA length between 300 to 600 bp. Finally, samples are
immunoprecipitated with a specific selected antibody (Struhl 2007). After preparing
the ChIP sample, it is ready for the real-time qPCR.
The primer sets were used in this experiment, cover three main regions:
promoter, upstream and downstream the (GAA)n∙(TTC)n repeat in the FXN gene.
Therefore, the primer sets ‘genomic DNA ChIP primers’ were named as: FXN pro,
FXN up, and FXN down (Figure 3.11) (Al-Mahdawi et al. 2008). In addition to the
GAPDH primer sets for human and mouse to be used for the internal normalization
control. For each sample, the three regions were investigated. The antibodies were
anti- H3 and H4 acetylated and methylated (details in page 90, Chapter 2).
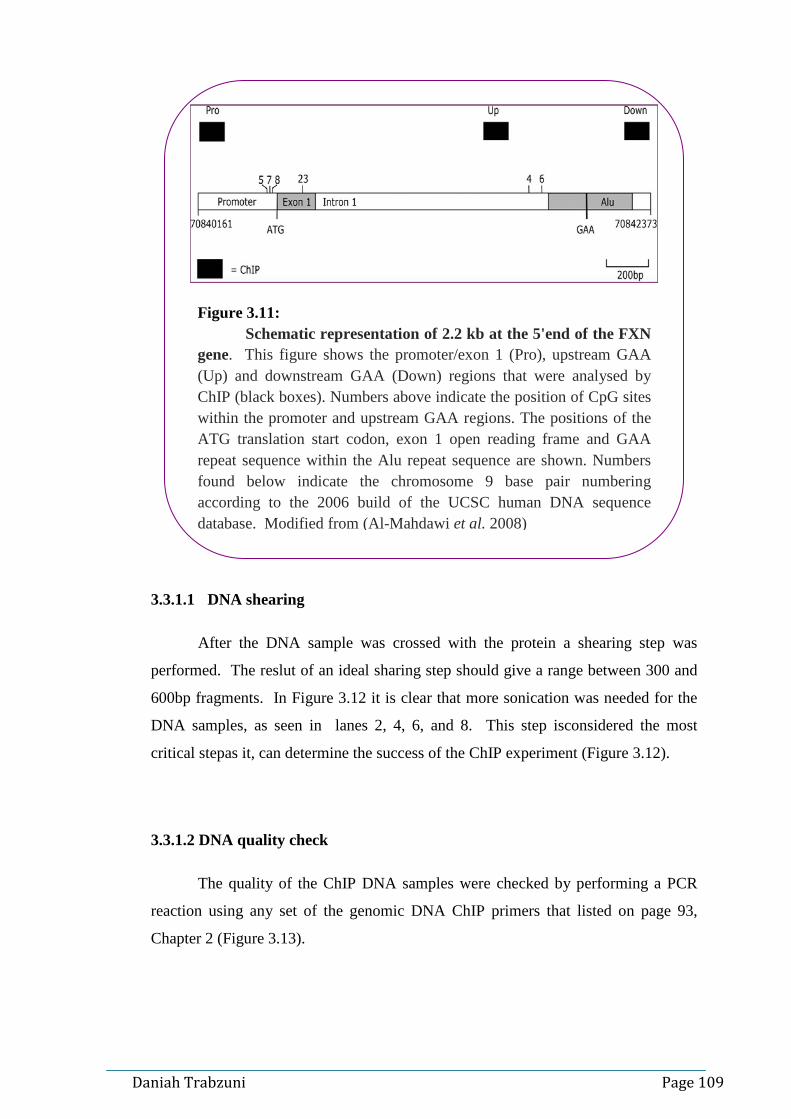
Daniah Trabzuni Page 109
3.3.1.1 DNA shearing
After the DNA sample was crossed with the protein a shearing step was
performed. The reslut of an ideal sharing step should give a range between 300 and
600bp fragments. In Figure 3.12 it is clear that more sonication was needed for the
DNA samples, as seen in lanes 2, 4, 6, and 8. This step isconsidered the most
critical stepas it, can determine the success of the ChIP experiment (Figure 3.12).
3.3.1.2 DNA quality check
The quality of the ChIP DNA samples were checked by performing a PCR
reaction using any set of the genomic DNA ChIP primers that listed on page 93,
Chapter 2 (Figure 3.13).
Figure 3.11: Schematic representation of 2.2 kb at the 5'end of the FXN gene. This figure shows the promoter/exon 1 (Pro), upstream GAA (Up) and downstream GAA (Down) regions that were analysed by ChIP (black boxes). Numbers above indicate the position of CpG sites within the promoter and upstream GAA regions. The positions of the ATG translation start codon, exon 1 open reading frame and GAA repeat sequence within the Alu repeat sequence are shown. Numbers found below indicate the chromosome 9 base pair numbering according to the 2006 build of the UCSC human DNA sequence database. Modified from (Al-Mahdawi et al. 2008)

Daniah Trabzuni Page 110
Figure 3.12: DNA sonication. Selected DNA samples after the sonication. Lanes 2, 4, 6, and 8, represent sonicated DNA samples. Lanes 3, 5, 7, and 9, represent the same DNA samples before sonication. Lane 1, 1 kb plus ladder.
Figure 3.13: ChIP DNA quality check PCR. Selected PCR products represent ChIP DNA human brain samples using DNA ChIP FXN promoter primers. Lane 2, Input DNA. Lane 3, DNA samples which was precipitated with H3K9 antibody. Lane 4, with H4K12 antibody. Lane 5, negative control (no antibody was added). Lane 6, a positive control (genomic human placenta). Lane 7, a water negative control and lane 1, 1 kb plus ladder.

Daniah Trabzuni Page 111
3.3.2 Relative quantitative, Real-time qPCR
Previous investigations reinforced the connection between the presence of the
histone modifications and the formation of the heterochromatin structure, as a result
gene silencing. These observation were reported in FRDA cell lines (Herman et al.
2006; Gottesfeld 2007; Rai et al. 2008).
In this experiment, the same theory was applied to investigate the connection
between the histone modifications and the gene silencing in the human and
transgenic mice with different GAA repeats using real-time qPCR and covering all
three regions (Promoter, upstream, and downstream) of the repeat. In addition, it
was possible to compare the FRDA mouse histone modification profile with the
human histone profile.
3.3.2.1 Histone modifications in human brain tissues
Histone modifications, such as acetylation and methylation, were investigated
in a brain sample of FRDA patient with (GAA∙TTC) 750/650 repeats in comparison
with a normal control using ChIP assay technology. The results showed interesting
patterns, such as that the histone acetylation pattern was highest in the promoter and
upstream region compared with the downstream region (Figure 3.14). Moreover,
H3K9ac residue shows a dramatic decrease by 32, 65, and 84 % in the FXN
promoter, upstream, and downstream, respectively. In addition, H4K16ac residue
has shown to be decreased by 20, 29, and 61 % in the three regions respectively. The
remaining four residues, H3K14ac, H4K5ac, H4K8ac, and H4K12ac all showed a
slight increase in the FXN promoter and upstream region, whereas, they all showed a
decrease between 40 to 90 % in the downstream area. In summary, there was a
general decrease in the histone acetylation profile, specifically in downstream region
(Figure 3.14). With regard to the methylation pattern, results indicated a dramatic
increase in the H3K9me2 and H3K9me3 in all three regions in FXN gene in an
FRDA patient. The increase in the di- and trimethylation of H3K9 is around 2 to 3
fold of the normal control (Figure 3.15). For example, the H3K9me3 in the

Daniah Trabzuni Page 112
downstream region increased from 50 % in normal control to around 145 % in
FRDA sample, while H3K9me2 increased from 200 % to 400 %. The methylation
increase of residue H3K9me3 is more significant than the methylation of the
H3K9me2 residue.
Many factors were taken into consideration when these results were
interpreted. First, although each sample was investigated in biological triplicate, the
results described are obtained only from one brain sample; thus, this experiment
should be done with a larger number of samples in the future. Secondly, analysing
results for the real-time qPCR have to be handled carefully to avoid being misled by
Figure 3.14: Histone acetylation analysis in human brain tissue. ChIP DNA qPCR product represent acetylayion profile in three regions: FXN promoter (Pro), upstream GAA (Up) and downstream GAA (Down). All samples were normalized to the human GAPDH, then adjusted to the Upstream of normal control (100 %). Results show an overall decrease in H3ac and H4ac pattern of FRDA brain tissue, particularly in the downstream GAA region. Each sample was analysed in biological triplicate, bars represent S.E.Ms.

Daniah Trabzuni Page 113
the false positive results. Thirdly, choosing the specific primers and the right
endogenous control gene for the normalization could potentially affect the results.
Finally, as with any other advanced techniques, the full attention is required in the
experiment plan and with the calculations in the normalization of the anti-body
precipitated DNA sample to the input DNA sample to obtain reliable results.
3.3.2.2 Histone modifications in transgenic mouse brain tissues
The same experiment were applied to the brain tissues from the transgenic
mice Y47, YG8, YG22 by using the same techniques ChIP assay followed by real-
time qPCR. Acetylation and methylation were investigated in the three regions in
Figure 3.15: Histone methylation analysis in human brain tissue. ChIP DNA qPCR product represent methylation profile in three regions: FXN promoter (Pro), upstream GAA (Up) and downstream GAA (Down). All samples were normalized to the human GAPDH, and then adjusted to the Upstream of normal control (100 %). Results indicate a dramatic increase in the H3K9me2 and H3K9me3 pattern in all three regions in a FRDA patient. Each sample was analysed in biological triplicate, bars represent S.E.Ms.

Daniah Trabzuni Page 114
FXN tansgene Pro, Up, and Down. The results demonstrate that the acetylation of
the H3K9ac residue decreased by around 15 % in the promoter and upstream regions,
while it decreased more in the downstream region by around 25 to 30 % in both YG8
and YG22 in compare with Y47 (Figure 3.16). Moreover, the acetylation of H4K8ac
in YG8 decreased slightly in all three regions, whereas it showed around 50%
increase in YG22. In addition, H4K12ac behaved the same way H4K8ac did.
However, the acetylation pattern for H3K14ac was inconsistent at all levels and
H4K5ac showed a slight decreased by around 10 to 12 %. The last residue is
H4K16ac which showed an increased by around 37, 62, 57 % in the FXN Pro, Up,
and Down of YG8, respectively. Nevertheless, in YG22 H4K16ac showed a very
high level of increase by around 70 % in the downstream region, and no observed
increase in the other two regions (Figure 3.16).
Figure 3.16: Histone acetylation analysis in transgenic mouse brain tissue. ChIP DNA qPCR product represent acetylayion profile in three regions: FXN promoter (Pro), upstream GAA (Up) and downstream GAA (Down). All samples were normalized to the mouse GAPDH, and then adjusted to the Upstream of Y47 (100 %). Results show a consistent decrease in H3K9ac pattern especially in downstream region and an overall increase in H4ac pattern in both YG8 and YG22 compared with Y47. Each sample was analysed in biological triplicate, bars represent S.E.Ms.

Daniah Trabzuni Page 115
The histone methylation pattern in the transgenic mouse was also investigated
in all three regions of FXN transgene. Both H3K9me2 and H3K9me3 showed a
noticeable increase in the three regions of YG8 and YG22 (Figure 3.17). For
example, the methylation of the H3K9me2 increased more significantly by 2 to 3
fold in the downstream region that it did the other two regions. Furthermore,
H3K9me3 increased even more significantly by 3 to 5 fold than H3K9me2 did in all
regions and more noticeable in YG8 than in YG22 (Figure 3.17).
Figure 3.17: Histone methylation analysis in transgenic mouse brain tissue. ChIP DNA qPCR product represent methylation profile in three regions: FXN promoter (Pro), upstream GAA (Up) and downstream GAA (Down). All samples were normalized to the mouse GAPDH, and then adjusted to the Upstream of Y47 (100 %). Results indicate a consistent increase in H3K9me2 and H3K9me3 pattern in both YG8 and YG22 compared with Y47. Each sample was analysed in biological triplicate, bars represent S.E.Ms.

Daniah Trabzuni Page 116
In summary, although there are some specific differences between the human
and the transgenic mice systems, there is an overall similarity between the human
and the transgenic mice in the methylation and acetylation patterns of H3K9 residue.
This observation confirms the potential of using the transgenic mice Y47, YG8, and
YG22 for further studies in histone modification in studies of FRDA.
As a routine step, the qPCR products were checked and evaluated on agarose
gel (Figure 3.18).
The results presented in sections from 1.3 to 3.3 have recently published (Al-
Mahdawi et al. 2008) (see Appendix 1).
Figure 3.18: Quality check of the DNA qPCR product 1. Selected PCR products amplified from mouse brain samples using DNA ChIP mouse GAPDH primers. Lanes 1-11, YG8 qPCR products giving the right band size. Lane 12, a negative water control. Lane 13, 1 kb plus ladder.

Daniah Trabzuni Page 117
3.4 An HDACi effect on FXN MRNA levels of in
transgenic mouse brain, heart and liver tissues
Many previous studies have shown that HDACis can be effective in restoring
FXN levels in FRDA cell lines and animal models. Many HDACis are currently
under research investigations to be used as effective treatment in the future. HDACis
have shown the ability to cross the blood-brain barriers and this is considered to be
an essential characteristic as a treatment (Gottesfeld 2007; Rai et al. 2008).
For a further investigation of the role of HDACis in restoring FXN levels, we
conducted a preliminary study to investigate the effect of one particular HDACi on
the FXN mRNA transcription in our mice model. This HDACi is a benzamide
compound, which is under licence to Repligen Corporation (Waltham, MA, USA),
and it will only be referred to in this thesis as “HDACi”. Real-time qRT-PCR was
used to detect the FXN mRNA level in brain, heart, and liver tissues of transgenic
YG8 mice treated with three 150mg/kg doses of HDACi , given subcutaneously and
orally (in water) once a day for three consecutive days. Other members of the Pook
Ataxia research group did all of the animal work and tissue collection.
Different tissues were collected 24 hours after the last dose and then the
mRNA was extracted using TRIZOL reagent followed by cDNA synthesis to have
the cDNA samples ready for the quantification by real-time qRT-PCR reaction. The
real-time qRT-PCR results demonstrate the HDACi effect in increasing the FXN
transcription in different tissues of the YG8 transgenic mouse. In the brain tissues, 6
samples were collected for each placebo and HDACi treated group. The FXN
mRNA indicated an increase of approximate 20 % in the treated group (Figure 3.19).
Similar observations were reported in the heart and the liver tissues. In the liver
tissues the FXN mRNA level increased by 18 % (Figure 3.20), while, in the heart
tissues the increase was around 33 % only (Figure 3.21). These results concur with
the previous studies that HDACi has a direct effect in activating the FXN
transcription in vivo and in vitro. However the differences between the HDACi
treated and placebo results were not statistically significant.

Daniah Trabzuni Page 118
When the brain tissues were been collected after only four hours from the last
dose the result was surprisingly different. The results showed a 49 % decrease in the
FXN mRNA level in HDACi treated group (Figure 3.22), but again this was not
statistically significant.
Figure 3.19:
HDACi effect on FXN mRNA of YG8 brain tissues. Each sample was analysed in biological duplicate. Bars represent S.E.Ms.

Daniah Trabzuni Page 119
Figure 3.21: HDACi effect on FXN mRNA of YG8 heart tissues. Each sample was analysed in biological duplicate, bars represent S.E.Ms.
Figure 3.20: HDACi effect on FXN mRNA of YG8 liver tissues. Each sample was analysed in biological duplicate, bars represent S.E.Ms.
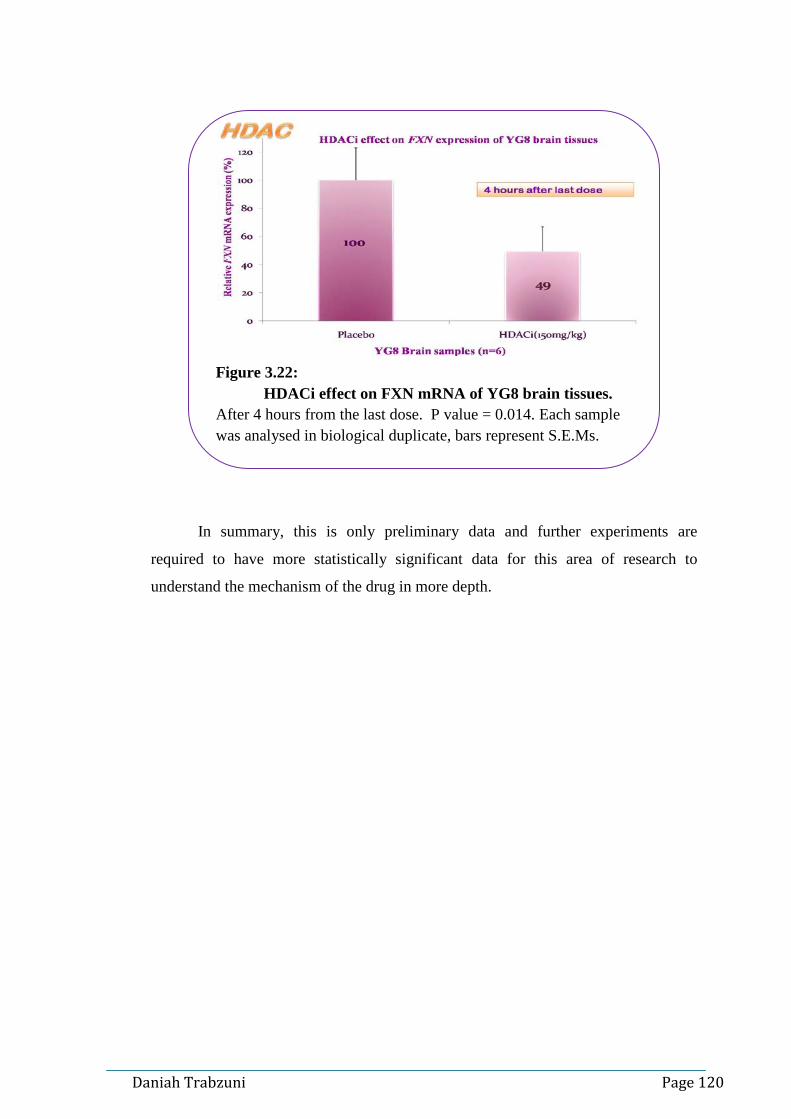
Daniah Trabzuni Page 120
In summary, this is only preliminary data and further experiments are
required to have more statistically significant data for this area of research to
understand the mechanism of the drug in more depth.
Figure 3.22: HDACi effect on FXN mRNA of YG8 brain tissues. After 4 hours from the last dose. P value = 0.014. Each sample was analysed in biological duplicate, bars represent S.E.Ms.

Daniah Trabzuni Page 121
3.5 The HDACi effect on histone modifications of FXN in
transgenic mouse brain tissues
Chromatin structural changes and histone de-acetylation is involved in many
neurological disorders, therefore, using HDACi as a treatment to reverse the
heterochromatin region to an active form and restore the transcriptional activity is a
recommended approach.
An earlier study using FRDA lymphoblastoid cells showed the affect of
HDACis on the state of FXN transcription by modifying the histone acetylation
profile. It suggested that HDACis will inhibit HDAC enzymes and that will lead to
the increase levels of FXN histine acetylation leading to increase FXN transcription
(Herman et al. 2006; Gottesfeld 2007).
We investigated the acetylation profile of H3K9ac and H4K12ac in the YG8
transgenic mouse brain tissues for two groups: placebo and HDACi treated for three
days at 150mg/kg dose. Some samples were collected at 24 hours after the last dose
and the other were collected at 4 hours after the last dose. Samples were processed
for ChIP assay followed by the real-time qPCR to obtain our results; DNA samples
were precipitated using H3K9ac and H4K12ac anti-bodies.
The results for this experiment are still in their infancy, so this experiment
will be continued in the future. However, the preliminary results indicated that the
HDACi increased the acetylation pattern of the H3K9ac and the H4K12ac in the
FXN promoter and upstream the GAA repeat, while, in the downstream region there
was no noticeable change in the acetylation profile for both residues (Figure 3.23).
The same pattern was observed with the 4 hours brain samples (Figure 3.24), but for
this group there is only the preliminary acetylation results for H3K9ac. Overall,
these results suggest limited efficiency of the HDACi used in this thesis as a
treatment for FRDA disorder. Further HDACis will be explored in the future.
In conclusion, there are still many questions to be answered in this area of
research and other areas that can interact to support us with valuable information to
move forward toward eliminating the symptoms of neurodegenerative disorders.

Daniah Trabzuni Page 122
Figure 3.23: Histone acetylation in YG8 mouse brain tissues. Represent the acetylation of H3K9ac and H4K12ac after 24 hours from last dose. Each sample was analysed only once in triplicate reactions, bars represent S.E.Ms.
Figure 3.24: Histone acetylation in YG8 mouse brain tissues. Represent the acetylation of H3K9ac after 4 hours from last dose. Each sample was analysed only once in triplicate reactions, bars represent S.E.Ms.

Daniah Trabzuni Page 123
Chapter 4
Discussion
Epigenetic modifications and FXN mRNA transcription profile in FRDA human
tissues and YG8 and YG22 transgenic mouse tissues
Epigenetic modifications including histone acetylation and methylation in
both FRDA human and transgenic mouse brain tissues were demonstrated using
ChIP assay analysis and real-time qPCR. The results are aligned with previous
studies that showed a decrease in the acetylation pattern of H3K9ac, H3K14ac and
H4K16ac in the upstream GAA region in FRDA human cell lines (Herman et al.
2006; Greene et al. 2007; Rai et al. 2008). Our results verify these changes in three
regions of the FXN gene: FXN promoter, upstream GAA and more clearly, in the
downstream GAA region of FRDA human and transgenic mice brain tissues. In
addition, the results confirmed the increase in the di- and trimethylation patterns of
the H3K9me2 and the H3K9me3 residues in the all three regions of the FXN gene,
which had been reported previously. Moreover, the FXN mRNA transcription profile
was investigated and indicated a reduced level of the transcription process in the
brain, heart and liver tissues of the YG8 and YG22 transgenic mice and in a FRDA
human brain tissue. The reduced level of the FXN mRNA transcription had been
referred previously to the presence of the (GAA)n∙(TTC)n repeat, as a consequence
heterochromatin formation occur leading to the gene silencing.
These results cover the integration of the chromatin modifications and the
transcription and expression profile. However, they represent only two sides of a 3-
dimension (3D) triangle. In order to have a better understanding of the mechanisms
by which the expanded (GAA)n∙(TTC)n repeats cause the heterochromatin
formation, leading to FXN gene silencing, the integration of the third factor is
required. DNA methylation forms the third side of the triangle, contributing to
FRDA disease mechanisms and its contribution is well explained in a recent study on
FRDA human and YG8 and YG22 transgenic mice brain and heart tissues (Al-
Mahdawi et al. 2008). Results showed an overall shift in the DNA methylation

Daniah Trabzuni Page 124
profile, hypomethylation in the downstream the repeat and hypermethylation in the
upstream GAA tracts. As a result, DNA methylation is corresponding and
correlating with the other changes: chromatin modifications and the expression
profile. However, further studies are required to more accurelty identify the
relationship between these three factors. Moreover, having a clearer understanding
of the integration mechanisms between chromatin structure, DNA methylation and
expression profiles will lead to a comprehensive understanding of FRDA disease
progression and will lead to the identification of new therapeutic approaches.
HDACi effect on epigenetic modifications and FXN mRNA transcription profile in
YG8, YG22 transgenic mice tissues
Our preliminary results that demonstrate that the effect of one particular
HDACi, which is one of the promising therapeutic approaches, on FXN mRNA
transcriptional levels and histone modifications (acetylation) in YG8 transgenic
mouse brain, heart and liver tissues are harmonized with the results from a previous
study. The results for this study, which was conducted using KIKI mouse brain,
cerebellum and heart tissues, indicated an increase in the FXN mRNA level and in
the histone acetylation patterns for 24 hours after last injection with a similar HDACi
(Rai et al. 2008). Our results showed an increase in the FXN mRNA level in
different tissues such as, brain, heart and liver of the YG8 transgenic mice after 24
hours from the last HDACi treatment. Furthermore, an increase in the histone
acetylation of H3K9ac and H4K12ac mainly in the FXN promoter, upstream GAA of
the YG8 mice brain tissues was observed. The only exception is the decrease of the
FXN mRNA transcription level after 4 hours of the last HDACi dose was injected.
Here the importance of further investigation of the drug mechanism in vivo in more
detail becomes an essential step forward in the near future.
In summary, although there are promising results described within this thesis
and within other studies that HDACis have the ability to correct the frataxin
deficiency and restore it to its normal level, the level of the specificity of the HDACi
or any other epigenetic drug must be increased. In our study, it was important to

Daniah Trabzuni Page 125
have this point in our consideration because we used the GAPDH gene as an
endogenous reference gene and effecting the expression of this gene will affect our
results. In a recent high-density microarray analysis study the results showed that
other gene expression levels had been effected with HDACi drug treatment (Rai et
al. 2008). Therefore, it would be a good idea in future to repeat all of the
quantitative PCR experiminets using a different housekeeping gene as the
endogenouse referenc. Furtheremore, the design of the epigenetic drug molecules to
target a specific gene and to know the exact mechanism by which this drug interacts
with the transcriptional factors and causes the change will require more substantial
studies in the future.
Further recommendations
Due to the time limitation for this project it was not possible to investigate for
all histone modifications in a larger sample number. In future, it is important to
obtain statistically significant results by analysing these modifications on a larger
sample number and analysing each sample as a biological triplicate. In addition, it
would be intresting to expand the investigation of the acetylation and methylation
modifications of different residues such as, H3K4me1, H3K4me2, H3K9me1 and
H3K9me2 of the FXN locus in our transgenic mice model. A recent study showed
that increase the methylation of H3K4me1,2 and decrease the methylation of
H3K9me1,2 is related with the gene activation in human colon cancer cells (Huang
et al. 2007). What this research group need to obtain for a cancer therapy will be the
opposite of what we need for FRDA therapy, so considering these histone
modifications and expanding the knowledge about them may be a useful tool leading
to another line of efficient therapy for FRDA.
In addition, experiments for the quantitation of the FXN mRNA
transcriptional level and histone modifications (acetylation) patterns in the FRDA
transgenic mouse brain are worth continuing. This will provide important
information about the mechanism and the activity of the epigenetic drugs in vivo,
especially considering the unexpected effect that we saw of the HDACi drug after 4

Daniah Trabzuni Page 126
hours from the last dose. Moreover, it is sensible to design different experiments
with different doses of the HDACi for different time ranges to check for the drug
activity and toxicity. Other such creative studies are currently underway to produce
more efficient therapies for FRDA.

Daniah Trabzuni Page 127
References
Al-Mahdawi, S., Pinto, R.M., Ismail, O., Varshney, D., Lymperi, S., Sandi, C.,
Trabzuni, D. and Pook, M. (2008). "The Friedreich ataxia GAA repeat expansion mutation induces comparable epigenetic changes in human and transgenic mouse brain and heart tissues." Hum Mol Genet 17(5): 735-46.
Al-Mahdawi, S., Pinto, R.M., Ruddle, P., Carroll, C., Webster, Z. and Pook, M. (2004). "GAA repeat instability in Friedreich ataxia YAC transgenic mice." Genomics 84(2): 301-10.
Al-Mahdawi, S., Pinto, R.M., Varshney, D., Lawrence, L., Lowrie, M.B., Hughes, S., Webster, Z., et al. (2006). "GAA repeat expansion mutation mouse models of Friedreich ataxia exhibit oxidative stress leading to progressive neuronal and cardiac pathology." Genomics 88(5): 580-90.
Andermann, E., Remillard, G.M., Goyer, C., Blitzer, L., Andermann, F. and Barbeau, A. (1976). "Genetic and family studies in Friedreich's ataxia." Can J Neurol Sci 3(4): 287-301.
Babady, N.E., Carelle, N., Wells, R.D., Rouault, T.A., Hirano, M., Lynch, D.R., Delatycki, M.B., et al. (2007). "Advancements in the pathophysiology of Friedreich's Ataxia and new prospects for treatments." Mol Genet Metab 92(1-2): 23-35.
Baldi, P., Brunak, S., Chauvin, Y. and Pedersen, A.G. (1999). "Structural basis for triplet repeat disorders: a computational analysis." Bioinformatics 15(11): 918-29.
Baralle, M., Pastor, T., Bussani, E. and Pagani, F. (2008). "Influence of Friedreich ataxia GAA noncoding repeat expansions on pre-mRNA processing." Am J Hum Genet 83(1): 77-88.
Bencze, K.Z., Yoon, T., Millan-Pacheco, C., Bradley, P.B., Pastor, N., Cowan, J.A. and Stemmler, T.L. (2007). "Human frataxin: iron and ferrochelatase binding surface." Chem Commun (Camb)(18): 1798-800.
Berger, S.L. (2007). "The complex language of chromatin regulation during transcription." Nature 447(7143): 407-12.
Bidichandani, S.I., Ashizawa, T. and Patel, P.I. (1997). "Atypical Friedreich ataxia caused by compound heterozygosity for a novel missense mutation and the GAA triplet-repeat expansion." Am J Hum Genet 60(5): 1251-6.
Bird, A. (2007). "Perceptions of epigenetics." Nature 447(7143): 396-8. Bock, C. and Lengauer, T. (2008). "Computational epigenetics." Bioinformatics
24(1): 1-10. Box, H., Bonney, H. and Greenfield, J. (2005). "The patient's journey: the
progressive ataxias." Bmj 331(7523): 1007-9. Boyer, S.t., Chisholm, A.W. and Va, M. (1962). "Cardiac aspects of Friedreich's
ataxia." Circulation 25: 493-505. Branda, S.S., Cavadini, P., Adamec, J., Kalousek, F., Taroni, F. and Isaya, G. (1999).
"Yeast and human frataxin are processed to mature form in two sequential steps by the mitochondrial processing peptidase." J Biol Chem 274(32): 22763-9.

Daniah Trabzuni Page 128
Brice, A. (1998). "Unstable mutations and neurodegenerative disorders." J Neurol 245(8): 505-10.
Campuzano, V., Montermini, L., Molto, M.D., Pianese, L., Cossee, M., Cavalcanti, F., Monros, E., et al. (1996). "Friedreich's ataxia: autosomal recessive disease caused by an intronic GAA triplet repeat expansion." Science 271(5254): 1423-7.
Chakravarty, A. (2003). "Friedreich's ataxia--yesterday, today and tomorrow." Neurol India 51(2): 176-82.
Chiurazzi, P., Pomponi, M.G., Pietrobono, R., Bakker, C.E., Neri, G. and Oostra, B.A. (1999). "Synergistic effect of histone hyperacetylation and DNA demethylation in the reactivation of the FMR1 gene." Hum Mol Genet 8(12): 2317-23.
Chiurazzi, P., Pomponi, M.G., Willemsen, R., Oostra, B.A. and Neri, G. (1998). "In vitro reactivation of the FMR1 gene involved in fragile X syndrome." Hum Mol Genet 7(1): 109-13.
Chomczynski, P. and Sacchi, N. (1987). "Single-step method of RNA isolation by acid guanidinium thiocyanate-phenol-chloroform extraction." Anal Biochem 162(1): 156-9.
Clark, R.M., De Biase, I., Malykhina, A.P., Al-Mahdawi, S., Pook, M. and Bidichandani, S.I. (2007). "The GAA triplet-repeat is unstable in the context of the human FXN locus and displays age-dependent expansions in cerebellum and DRG in a transgenic mouse model." Hum Genet 120(5): 633-40.
Coppola, G., Choi, S.H., Santos, M.M., Miranda, C.J., Tentler, D., Wexler, E.M., Pandolfo, M. and Geschwind, D.H. (2006). "Gene expression profiling in frataxin deficient mice: microarray evidence for significant expression changes without detectable neurodegeneration." Neurobiol Dis 22(2): 302-11.
Correia, A.R., Adinolfi, S., Pastore, A. and Gomes, C.M. (2006). "Conformational stability of human frataxin and effect of Friedreich's ataxia-related mutations on protein folding." Biochem J 398(3): 605-11.
Cossee, M., Puccio, H., Gansmuller, A., Koutnikova, H., Dierich, A., LeMeur, M., Fischbeck, K., Dolle, P. and Koenig, M. (2000). "Inactivation of the Friedreich ataxia mouse gene leads to early embryonic lethality without iron accumulation." Hum Mol Genet 9(8): 1219-26.
Crews, D. (2008). "Epigenetics and its implications for behavioral neuroendocrinology." Front Neuroendocrinol 29(3): 344-57.
D'Alessio, A.C. and Szyf, M. (2006). "Epigenetic tete-a-tete: the bilateral relationship between chromatin modifications and DNA methylation." Biochem Cell Biol 84(4): 463-76.
De Biase, I., Rasmussen, A., Endres, D., Al-Mahdawi, S., Monticelli, A., Cocozza, S., Pook, M. and Bidichandani, S.I. (2007a). "Progressive GAA expansions in dorsal root ganglia of Friedreich's ataxia patients." Ann Neurol 61(1): 55-60.
De Biase, I., Rasmussen, A., Monticelli, A., Al-Mahdawi, S., Pook, M., Cocozza, S. and Bidichandani, S.I. (2007b). "Somatic instability of the expanded GAA triplet-repeat sequence in Friedreich ataxia progresses throughout life." Genomics 90(1): 1-5.
Daniah Trabzuni Page 129
De Michele, G., Di Maio, L., Filla, A., Majello, M., Cocozza, S., Cavalcanti, F., Mirante, E. and Campanella, G. (1996). "Childhood onset of Friedreich ataxia: a clinical and genetic study of 36 cases." Neuropediatrics 27(1): 3-7.
De Michele, G., Filla, A., Cavalcanti, F., Di Maio, L., Pianese, L., Castaldo, I., Calabrese, O., et al. (1994). "Late onset Friedreich's disease: clinical features and mapping of mutation to the FRDA locus." J Neurol Neurosurg Psychiatry 57(8): 977-9.
Delatycki, M.B., Camakaris, J., Brooks, H., Evans-Whipp, T., Thorburn, D.R., Williamson, R. and Forrest, S.M. (1999). "Direct evidence that mitochondrial iron accumulation occurs in Friedreich ataxia." Ann Neurol 45(5): 673-5.
Delatycki, M.B., Paris, D., Gardner, R.J., Forshaw, K., Nicholson, G.A., Nassif, N., Williamson, R. and Forrest, S.M. (1998). "Sperm DNA analysis in a Friedreich ataxia premutation carrier suggests both meiotic and mitotic expansion in the FRDA gene." J Med Genet 35(9): 713-6.
Delatycki, M.B., Williamson, R. and Forrest, S.M. (2000). "Friedreich ataxia: an overview." J Med Genet 37(1): 1-8.
Della Nave, R., Ginestroni, A., Giannelli, M., Tessa, C., Salvatore, E., Salvi, F., Dotti, M.T., et al. (2008a). "Brain structural damage in Friedreich's ataxia." J Neurol Neurosurg Psychiatry 79(1): 82-5.
Della Nave, R., Ginestroni, A., Tessa, C., Salvatore, E., Bartolomei, I., Salvi, F., Dotti, M.T., et al. (2008b). "Brain white matter tracts degeneration in Friedreich ataxia. An in vivo MRI study using tract-based spatial statistics and voxel-based morphometry." Neuroimage 40(1): 19-25.
Dhe-Paganon, S., Shigeta, R., Chi, Y.I., Ristow, M. and Shoelson, S.E. (2000). "Crystal structure of human frataxin." J Biol Chem 275(40): 30753-6.
Egger, G., Liang, G., Aparicio, A. and Jones, P.A. (2004). "Epigenetics in human disease and prospects for epigenetic therapy." Nature 429(6990): 457-63.
Feinberg, A.P. (2007). "Phenotypic plasticity and the epigenetics of human disease." Nature 447(7143): 433-40.
Foury, F. and Cazzalini, O. (1997). "Deletion of the yeast homologue of the human gene associated with Friedreich's ataxia elicits iron accumulation in mitochondria." FEBS Lett 411(2-3): 373-7.
Fraga, M.F., Ballestar, E., Paz, M.F., Ropero, S., Setien, F., Ballestar, M.L., Heine-Suner, D., et al. (2005). "Epigenetic differences arise during the lifetime of monozygotic twins." Proc Natl Acad Sci U S A 102(30): 10604-9.
Friedreich, N. (1863a,b). "Uber degenerative Atrophie der spinalen Hinterstrange." Virchow’s Arch Pathol Anat 26: 391-419, 433-59.
Friedreich, N. (1863c). "Uber degenerative Atrophie der spinalen Hinterstrange." Virchow’s Arch Pathol Anat 27: 1-26.
Friedreich, N. (1876). "Uber ataxie mit besonderer berucksichtigung der hereditaren formen." Virchow’s Arch Pathol Anat 68: 145-245.
Friedreich, N. (1877). "Uber ataxie mit besonderer berucksichtigung der hereditaren formen." Virchow’s Arch Pathol Anat 70: 140-52.
Gacy, A.M., Goellner, G.M., Spiro, C., Chen, X., Gupta, G., Bradbury, E.M., Dyer, R.B., et al. (1998). "GAA instability in Friedreich's Ataxia shares a common, DNA-directed and intraallelic mechanism with other trinucleotide diseases." Mol Cell 1(4): 583-93.

Daniah Trabzuni Page 130
Gakh, O., Park, S., Liu, G., Macomber, L., Imlay, J.A., Ferreira, G.C. and Isaya, G. (2006). "Mitochondrial iron detoxification is a primary function of frataxin that limits oxidative damage and preserves cell longevity." Hum Mol Genet 15(3): 467-79.
Genschel, J., Littman, S.J., Drummond, J.T. and Modrich, P. (1998). "Isolation of MutSbeta from human cells and comparison of the mismatch repair specificities of MutSbeta and MutSalpha." J Biol Chem 273(31): 19895-901.
Geoffroy, G., Barbeau, A., Breton, G., Lemieux, B., Aube, M., Leger, C. and Bouchard, J.P. (1976). "Clinical description and roentgenologic evaluation of patients with Friedreich's ataxia." Can J Neurol Sci 3(4): 279-86.
Giovannangeli, C., Perrouault, L., Escude, C., Gryaznov, S. and Helene, C. (1996). "Efficient inhibition of transcription elongation in vitro by oligonucleotide phosphoramidates targeted to proviral HIV DNA." J Mol Biol 261(3): 386-98.
Gomez-Sebastian, S., Gimenez-Cassina, A., Diaz-Nido, J., Lim, F. and Wade-Martins, R. (2007). "Infectious delivery and expression of a 135 kb human FRDA genomic DNA locus complements Friedreich's ataxia deficiency in human cells." Mol Ther 15(2): 248-54.
Gordon, D.M., Shi, Q., Dancis, A. and Pain, D. (1999). "Maturation of frataxin within mammalian and yeast mitochondria: one-step processing by matrix processing peptidase." Hum Mol Genet 8(12): 2255-62.
Gottesfeld, J.M. (2007). "Small molecules affecting transcription in Friedreich ataxia." Pharmacol Ther 116(2): 236-48.
Gottlieb, G. (2007). "Probabilistic epigenesis." Dev Sci 10(1): 1-11. Grabczyk, E., Mancuso, M. and Sammarco, M.C. (2007). "A persistent RNA.DNA
hybrid formed by transcription of the Friedreich ataxia triplet repeat in live bacteria, and by T7 RNAP in vitro." Nucleic Acids Res 35(16): 5351-9.
Grabczyk, E. and Usdin, K. (2000). "The GAA*TTC triplet repeat expanded in Friedreich's ataxia impedes transcription elongation by T7 RNA polymerase in a length and supercoil dependent manner." Nucleic Acids Res 28(14): 2815-22.
Grant, L., Sun, J., Xu, H., Subramony, S.H., Chaires, J.B. and Hebert, M.D. (2006). "Rational selection of small molecules that increase transcription through the GAA repeats found in Friedreich's ataxia." FEBS Lett 580(22): 5399-405.
Greene, E., Mahishi, L., Entezam, A., Kumari, D. and Usdin, K. (2007). "Repeat-induced epigenetic changes in intron 1 of the frataxin gene and its consequences in Friedreich ataxia." Nucleic Acids Res 35(10): 3383-90.
Grewal, S.I. and Elgin, S.C. (2007). "Transcription and RNA interference in the formation of heterochromatin." Nature 447(7143): 399-406.
Harding, A. (1984). "The Hereditary Ataxias and Related Disorders " Edinburgh: Churchill Livingstone,: 174-90.
Harding, A.E. (1981). "Friedreich's ataxia: a clinical and genetic study of 90 families with an analysis of early diagnostic criteria and intrafamilial clustering of clinical features." Brain 104(3): 589-620.
Hebert, M.D. (2007). "Targeting the gene in Friedreich ataxia." Biochimie. Hebert, M.D. (2008). "Targeting the gene in Friedreich ataxia." Biochimie 90(8):
1131-9.

Daniah Trabzuni Page 131
Hebert, M.D. and Whittom, A.A. (2007). "Gene-based approaches toward Friedreich ataxia therapeutics." Cell Mol Life Sci 64(23): 3034-43.
Heintzman, N.D., Stuart, R.K., Hon, G., Fu, Y., Ching, C.W., Hawkins, R.D., Barrera, L.O., et al. (2007). "Distinct and predictive chromatin signatures of transcriptional promoters and enhancers in the human genome." Nat Genet 39(3): 311-8.
Herman, D., Jenssen, K., Burnett, R., Soragni, E., Perlman, S.L. and Gottesfeld, J.M. (2006). "Histone deacetylase inhibitors reverse gene silencing in Friedreich's ataxia." Nat Chem Biol 2(10): 551-8.
Holliday, R. (1987). "The inheritance of epigenetic defects." Science 238(4824): 163-70.
Holliday, R. (2006). "Epigenetics: a historical overview." Epigenetics 1(2): 76-80. Holliday, R. and Pugh, J.E. (1975). "DNA modification mechanisms and gene
activity during development." Science 187(4173): 226-32. Huang, Y., Greene, E., Murray Stewart, T., Goodwin, A.C., Baylin, S.B., Woster,
P.M. and Casero, R.A., Jr. (2007). "Inhibition of lysine-specific demethylase 1 by polyamine analogues results in reexpression of aberrantly silenced genes." Proc Natl Acad Sci U S A 104(19): 8023-8.
Huynen, M.A., Snel, B., Bork, P. and Gibson, T.J. (2001). "The phylogenetic distribution of frataxin indicates a role in iron-sulfur cluster protein assembly." Hum Mol Genet 10(21): 2463-8.
Jaenisch, R. and Bird, A. (2003). "Epigenetic regulation of gene expression: how the genome integrates intrinsic and environmental signals." Nat Genet 33 Suppl: 245-54.
Jiralerspong, S., Liu, Y., Montermini, L., Stifani, S. and Pandolfo, M. (1997). "Frataxin shows developmentally regulated tissue-specific expression in the mouse embryo." Neurobiol Dis 4(2): 103-13.
Karthikeyan, G., Santos, J.H., Graziewicz, M.A., Copeland, W.C., Isaya, G., Van Houten, B. and Resnick, M.A. (2003). "Reduction in frataxin causes progressive accumulation of mitochondrial damage." Hum Mol Genet 12(24): 3331-42.
Keverne, E.B. and Curley, J.P. (2008). "Epigenetics, brain evolution and behaviour." Front Neuroendocrinol 29(3): 398-412.
Kim, D. and Rossi, J. (2008). "RNAi mechanisms and applications." Biotechniques 44(5): 613-6.
Koutnikova, H., Campuzano, V., Foury, F., Dolle, P., Cazzalini, O. and Koenig, M. (1997). "Studies of human, mouse and yeast homologues indicate a mitochondrial function for frataxin." Nat Genet 16(4): 345-51.
Kovacs, A., Kandala, J.C., Weber, K.T. and Guntaka, R.V. (1996). "Triple helix-forming oligonucleotide corresponding to the polypyrimidine sequence in the rat alpha 1(I) collagen promoter specifically inhibits factor binding and transcription." J Biol Chem 271(3): 1805-12.
Kovtun, I.V. and McMurray, C.T. (2001). "Trinucleotide expansion in haploid germ cells by gap repair." Nat Genet 27(4): 407-11.
Kramer, P.R., Pearson, C.E. and Sinden, R.R. (1996). "Stability of triplet repeats of myotonic dystrophy and fragile X loci in human mutator mismatch repair cell lines." Hum Genet 98(2): 151-7.

Daniah Trabzuni Page 132
Krasilnikova, M.M. and Mirkin, S.M. (2004). "Replication stalling at Friedreich's ataxia (GAA)n repeats in vivo." Mol Cell Biol 24(6): 2286-95.
Kulkarni, A. and Wilson, D.M., 3rd (2008). "The involvement of DNA-damage and -repair defects in neurological dysfunction." Am J Hum Genet 82(3): 539-66.
Kunkel, T.A. (1993). "Nucleotide repeats. Slippery DNA and diseases." Nature 365(6443): 207-8.
Lamarche, J.B., Cote, M. and Lemieux, B. (1980). "The cardiomyopathy of Friedreich's ataxia morphological observations in 3 cases." Can J Neurol Sci 7(4): 389-96.
Laskowski, R.A. and Thornton, J.M. (2008). "Understanding the molecular machinery of genetics through 3D structures." Nat Rev Genet 9(2): 141-51.
Lesuisse, E., Santos, R., Matzanke, B.F., Knight, S.A., Camadro, J.M. and Dancis, A. (2003). "Iron use for haeme synthesis is under control of the yeast frataxin homologue (Yfh1)." Hum Mol Genet 12(8): 879-89.
Lim, F., Palomo, G.M., Mauritz, C., Gimenez-Cassina, A., Illana, B., Wandosell, F. and Diaz-Nido, J. (2007). "Functional recovery in a Friedreich's ataxia mouse model by frataxin gene transfer using an HSV-1 amplicon vector." Mol Ther 15(6): 1072-8.
Lopez-Arlandis, J.M., Vilchez, J.J., Palau, F. and Sevilla, T. (1995). "Friedreich's ataxia: an epidemiological study in Valencia, Spain, based on consanguinity analysis." Neuroepidemiology 14(1): 14-9.
Miranda, C.J., Santos, M.M., Ohshima, K., Smith, J., Li, L., Bunting, M., Cossee, M., et al. (2002). "Frataxin knockin mouse." FEBS Lett 512(1-3): 291-7.
Mirkin, S.M. (2007). "Expandable DNA repeats and human disease." Nature 447(7147): 932-40.
Muller-Felber, W., Rossmanith, T., Spes, C., Chamberlain, S., Pongratz, D. and Deufel, T. (1993). "The clinical spectrum of Friedreich's ataxia in German families showing linkage to the FRDA locus on chromosome 9." Clin Investig 71(2): 109-14.
Murrell, A., Rakyan, V.K. and Beck, S. (2005). "From genome to epigenome." Hum Mol Genet 14 Spec No 1: R3-R10.
Musco, G., Stier, G., Kolmerer, B., Adinolfi, S., Martin, S., Frenkiel, T., Gibson, T. and Pastore, A. (2000). "Towards a structural understanding of Friedreich's ataxia: the solution structure of frataxin." Structure 8(7): 695-707.
Muse, G.W., Gilchrist, D.A., Nechaev, S., Shah, R., Parker, J.S., Grissom, S.F., Zeitlinger, J. and Adelman, K. (2007). "RNA polymerase is poised for activation across the genome." Nat Genet 39(12): 1507-11.
Mysid. (2007). "Ideogram of the human chromosome 9." Retrieved May 9, 2008, from [http://ghr.nlm.nih.gov/chromosome=9], National Library of Medicine.
Nafee, T.M., Farrell, W.E., Carroll, W.D., Fryer, A.A. and Ismail, K.M. (2008). "Epigenetic control of fetal gene expression." Bjog 115(2): 158-68.
Nair, M., Adinolfi, S., Pastore, C., Kelly, G., Temussi, P. and Pastore, A. (2004). "Solution structure of the bacterial frataxin ortholog, CyaY: mapping the iron binding sites." Structure 12(11): 2037-48.
Napierala, M., Bacolla, A. and Wells, R.D. (2005). "Increased negative superhelical density in vivo enhances the genetic instability of triplet repeat sequences." J Biol Chem 280(45): 37366-76.

Daniah Trabzuni Page 133
Napoli, E., Taroni, F. and Cortopassi, G.A. (2006). "Frataxin, iron-sulfur clusters, heme, ROS, and aging." Antioxid Redox Signal 8(3-4): 506-16.
Ohshima, K., Kang, S., Larson, J.E. and Wells, R.D. (1996). "Cloning, characterization, and properties of seven triplet repeat DNA sequences." J Biol Chem 271(28): 16773-83.
Ohshima, K., Montermini, L., Wells, R.D. and Pandolfo, M. (1998). "Inhibitory effects of expanded GAA.TTC triplet repeats from intron I of the Friedreich ataxia gene on transcription and replication in vivo." J Biol Chem 273(23): 14588-95.
Pandolfo, M. (1998). "Molecular genetics and pathogenesis of Friedreich ataxia." Neuromuscul Disord 8(6): 409-15.
Pandolfo, M. (2001). "Molecular basis of Friedreich ataxia." Mov Disord 16(5): 815-21.
Pandolfo, M. (2003). "Friedreich ataxia." Semin Pediatr Neurol 10(3): 163-72. Pandolfo, M. (2006). "Iron and Friedreich ataxia." J Neural Transm Suppl(70): 143-
6. Pandolfo, M. (2008). "Drug Insight: antioxidant therapy in inherited ataxias." Nat
Clin Pract Neurol 4(2): 86-96. Parniewski, P., Bacolla, A., Jaworski, A. and Wells, R.D. (1999). "Nucleotide
excision repair affects the stability of long transcribed (CTG*CAG) tracts in an orientation-dependent manner in Escherichia coli." Nucleic Acids Res 27(2): 616-23.
Paves, H. (2003). "Dorsal root ganglion neurons of an embryonic rat (100x)." Retrieved March 25, 2008, from Laboratory of Molecular Genetics, National Institute of Chemical Physics and Biophysics in Tallinn, Estonia [http://www.nikonsmallworld.com/gallery.php?grouping=year&year=2003&imageid=68].
Pearson, C.E., Nichol Edamura, K. and Cleary, J.D. (2005). "Repeat instability: mechanisms of dynamic mutations." Nat Rev Genet 6(10): 729-42.
Pelletier, R., Krasilnikova, M.M., Samadashwily, G.M., Lahue, R. and Mirkin, S.M. (2003). "Replication and expansion of trinucleotide repeats in yeast." Mol Cell Biol 23(4): 1349-57.
Pianese, L., Cavalcanti, F., De Michele, G., Filla, A., Campanella, G., Calabrese, O., Castaldo, I., Monticelli, A. and Cocozza, S. (1997). "The effect of parental gender on the GAA dynamic mutation in the FRDA gene." Am J Hum Genet 60(2): 460-3.
Pollard, L.M., Bourn, R.L. and Bidichandani, S.I. (2008). "Repair of DNA double-strand breaks within the (GAA*TTC)n sequence results in frequent deletion of the triplet-repeat sequence." Nucleic Acids Res 36(2): 489-500.
Pook, M.A., Al-Mahdawi, S., Carroll, C.J., Cossee, M., Puccio, H., Lawrence, L., Clark, P., et al. (2001). "Rescue of the Friedreich's ataxia knockout mouse by human YAC transgenesis." Neurogenetics 3(4): 185-93.
Potaman, V.N., Oussatcheva, E.A., Lyubchenko, Y.L., Shlyakhtenko, L.S., Bidichandani, S.I., Ashizawa, T. and Sinden, R.R. (2004). "Length-dependent structure formation in Friedreich ataxia (GAA)n*(TTC)n repeats at neutral pH." Nucleic Acids Res 32(3): 1224-31.
Ptak, C. and Petronis, A. (2008). "Epigenetics and complex disease: from etiology to new therapeutics." Annu Rev Pharmacol Toxicol 48: 257-76.

Daniah Trabzuni Page 134
Puccio, H. and Koenig, M. (2002). "Friedreich ataxia: a paradigm for mitochondrial diseases." Curr Opin Genet Dev 12(3): 272-7.
Rai, M., Soragni, E., Jenssen, K., Burnett, R., Herman, D., Coppola, G., Geschwind, D.H., Gottesfeld, J.M. and Pandolfo, M. (2008). "HDAC inhibitors correct frataxin deficiency in a Friedreich ataxia mouse model." PLoS ONE 3(4): e1958.
Robertson, K.D. (2005). "DNA methylation and human disease." Nat Rev Genet 6(8): 597-610.
Rolfsmeier, M.L., Dixon, M.J. and Lahue, R.S. (2000). "Mismatch repair blocks expansions of interrupted trinucleotide repeats in yeast." Mol Cell 6(6): 1501-7.
Rotig, A., de Lonlay, P., Chretien, D., Foury, F., Koenig, M., Sidi, D., Munnich, A. and Rustin, P. (1997). "Aconitase and mitochondrial iron-sulphur protein deficiency in Friedreich ataxia." Nat Genet 17(2): 215-7.
Sakamoto, N., Ohshima, K., Montermini, L., Pandolfo, M. and Wells, R.D. (2001). "Sticky DNA, a self-associated complex formed at long GAA*TTC repeats in intron 1 of the frataxin gene, inhibits transcription." J Biol Chem 276(29): 27171-7.
Sambrook, J., Fritsch, E.F. and Maniatis, T. (1989). Molecular Cloning: a laboratory manual. 2nd edition. New York, Cold Spring Harbor Laboratory, Cold Spring Harbor Laboratory Press.1659 p. ISBN 0-87969-309-6.
Santos-Reboucas, C.B. and Pimentel, M.M. (2007). "Implication of abnormal epigenetic patterns for human diseases." Eur J Hum Genet 15(1): 10-7.
Sarsero, J.P., Holloway, T.P., Li, L., McLenachan, S., Fowler, K.J., Bertoncello, I., Voullaire, L., Gazeas, S. and Ioannou, P.A. (2005). "Evaluation of an FRDA-EGFP genomic reporter assay in transgenic mice." Mamm Genome 16(4): 228-41.
Saveliev, A., Everett, C., Sharpe, T., Webster, Z. and Festenstein, R. (2003). "DNA triplet repeats mediate heterochromatin-protein-1-sensitive variegated gene silencing." Nature 422(6934): 909-13.
Schones, D.E. and Zhao, K. (2008). "Genome-wide approaches to studying chromatin modifications." Nat Rev Genet 9(3): 179-91.
Scrimgeour, E.M., Krishna, A.G., Gasim, A., Zawawi, T.H., Johnston, W.J., Barron, L. and Brock, D.J. (1996). "Friedreich's ataxia, with retained lower limb tendon reflexes, in a Saudi Arabian family." Clin Neurol Neurosurg 98(1): 8-11.
Seznec, H., Wilson, R.B. and Puccio, H. (2004). "2003 International Friedreich's Ataxia Research Conference, 14-16 February 2003, Bethesda, MD, USA." Neuromuscul Disord 14(1): 70-82.
Sharma, R., Bhatti, S., Gomez, M., Clark, R.M., Murray, C., Ashizawa, T. and Bidichandani, S.I. (2002). "The GAA triplet-repeat sequence in Friedreich ataxia shows a high level of somatic instability in vivo, with a significant predilection for large contractions." Hum Mol Genet 11(18): 2175-87.
Simon, D., Seznec, H., Gansmuller, A., Carelle, N., Weber, P., Metzger, D., Rustin, P., Koenig, M. and Puccio, H. (2004). "Friedreich ataxia mouse models with progressive cerebellar and sensory ataxia reveal autophagic neurodegeneration in dorsal root ganglia." J Neurosci 24(8): 1987-95.

Daniah Trabzuni Page 135
Sinden, R.R., Potaman, V.N., Oussatcheva, E.A., Pearson, C.E., Lyubchenko, Y.L. and Shlyakhtenko, L.S. (2002). "Triplet repeat DNA structures and human genetic disease: dynamic mutations from dynamic DNA." J Biosci 27(1 Suppl 1): 53-65.
Spivakov, M. and Fisher, A.G. (2007). "Epigenetic signatures of stem-cell identity." Nat Rev Genet 8(4): 263-71.
Struhl, K. (2007). "Interpreting Chromatin Immunoprecipitation Experiments." In Evaluating Techniques in Biochemical Research, D. Zuk, ed: 29-33.
Stuffrein-Roberts, S., Joyce, P.R. and Kennedy, M.A. (2008). "Role of epigenetics in mental disorders." Aust N Z J Psychiatry 42(2): 97-107.
Sturm, B., Stupphann, D., Kaun, C., Boesch, S., Schranzhofer, M., Wojta, J., Goldenberg, H. and Scheiber-Mojdehkar, B. (2005). "Recombinant human erythropoietin: effects on frataxin expression in vitro." Eur J Clin Invest 35(11): 711-7.
Tamkun, J.W. (2007). "Stalled polymerases and transcriptional regulation." Nat Genet 39(12): 1421-2.
Taroni, F. and DiDonato, S. (2004). "Pathways to motor incoordination: the inherited ataxias." Nat Rev Neurosci 5(8): 641-55.
Thompson, L.M. (2008). "Neurodegeneration: a question of balance." Nature 452(7188): 707-8.
VanGuilder, H.D., Vrana, K.E. and Freeman, W.M. (2008). "Twenty-five years of quantitative PCR for gene expression analysis." Biotechniques 44(5): 619-26.
Waddington, C.H. (1942). "Canalization of development and the inheritance of acquired characters." Nature 150: 563–565.
Waldvogel, D., van Gelderen, P. and Hallett, M. (1999). "Increased iron in the dentate nucleus of patients with Friedrich's ataxia." Ann Neurol 46(1): 123-5.
Wang, Z. and Storm, D.R. (2006). "Extraction of DNA from mouse tails." Biotechniques 41(4): 410, 412.
Warren, S.T. (1997). "Polyalanine expansion in synpolydactyly might result from unequal crossing-over of HOXD13." Science 275(5298): 408-9.
Wells, R.D. (2008). "DNA triplexes and Friedreich ataxia." Faseb J 22(6): 1625-34. Wells, R.D., Dere, R., Hebert, M.L., Napierala, M. and Son, L.S. (2005). "Advances
in mechanisms of genetic instability related to hereditary neurological diseases." Nucleic Acids Res 33(12): 3785-98.
Zeitlinger, J., Stark, A., Kellis, M., Hong, J.W., Nechaev, S., Adelman, K., Levine, M. and Young, R.A. (2007). "RNA polymerase stalling at developmental control genes in the Drosophila melanogaster embryo." Nat Genet 39(12): 1512-6.

Daniah Trabzuni Page 136
Appendix 1

The Friedreich ataxia GAA repeat expansionmutation induces comparable epigeneticchanges in human and transgenicmouse brain and heart tissues
Sahar Al-Mahdawi, Ricardo Mouro Pinto, Ozama Ismail, Dhaval Varshney, Stefania Lymperi,
Chiranjeevi Sandi, Daniah Trabzuni and Mark Pook�
Hereditary Ataxia Group, Centre for Cell & Chromosome Biology and Brunel Institute of Cancer Genetics &
Pharmacogenomics, Division of Biosciences, School of Health Sciences & Social Care, Brunel University,
Uxbridge UB8 3PH, UK
Received September 20, 2007; Revised November 17, 2007; Accepted November 25, 2007
Friedreich ataxia (FRDA) is caused by a homozygous GAA repeat expansion mutation within intron 1 of theFXN gene, leading to reduced expression of frataxin protein. Evidence suggests that the mutation may induceepigenetic changes and heterochromatin formation, thereby impeding gene transcription. In particular,studies using FRDA patient blood and lymphoblastoid cell lines have detected increased DNA methylationof specific CpG sites upstream of the GAA repeat and histone modifications in regions flanking the GAArepeat. In this report we show that such epigenetic changes are also present in FRDA patient brain, cerebel-lum and heart tissues, the primary affected systems of the disorder. Bisulfite sequence analysis of the FXNflanking GAA regions reveals a shift in the FRDA DNA methylation profile, with upstream CpG sites becomingconsistently hypermethylated and downstream CpG sites becoming consistently hypomethylated. We alsoidentify differential DNA methylation at three specific CpG sites within the FXN promoter and one CpG sitewithin exon 1. Furthermore, we show by chromatin immunoprecipitation analysis that there is overalldecreased histone H3K9 acetylation together with increased H3K9 methylation of FRDA brain tissue.Further studies of brain, cerebellum and heart tissues from our GAA repeat expansion-containing FRDAYAC transgenic mice reveal comparable epigenetic changes to those detected in FRDA patient tissue. Wehave thus developed a mouse model that will be a valuable resource for future therapeutic studies targetingepigenetic modifications of the FXN gene to increase frataxin expression.
INTRODUCTION
FRDA is an autosomal recessive neurodegenerative disorderthat is predominantly caused by a homozygous GAA repeatexpansion mutation within intron 1 of the FXN gene (1).Normal individuals have 5–30 GAA repeat sequences,whereas affected individuals have from approximately 70 tomore than 1000 GAA triplets (2). The GAA repeat showssomatic instability, with progressive expansion throughoutlife, particularly in the cerebellum and dorsal root ganglia(DRG) (3–5). The effect of the GAA expansion mutation is
to reduce the expression of frataxin (6), a mitochondrialprotein that acts as an iron chaperone in iron–sulphurcluster and heme biosynthesis (7–9). Frataxin insufficiencyleads to oxidative stress, mitochondrial iron accumulationand resultant cell death, with the primary site of pathologybeing in the large sensory neurons of the DRG and thedentate nucleus of the cerebellum (10). The outcome isprogressive spinocerebellar neurodegeneration, causing symp-toms of ataxia, dysarthria, muscle weakness and sensory loss,together with cardiomyopathy and diabetes. At present there isno effective treatment for FRDA, and affected individuals
�To whom correspondence should be addressed. Tel: þ44 1895267243; Fax: þ44 1895274348; Email: [email protected]
# The Author 2007. Published by Oxford University Press. All rights reserved.For Permissions, please email: [email protected]
Human Molecular Genetics, 2008, Vol. 17, No. 5 735–746doi:10.1093/hmg/ddm346Advance Access published on November 27, 2007

generally die in early adulthood from the associated heartdisease.
Preclinical and clinical trials using antioxidants and ironchelators have demonstrated some limited success in alleviat-ing FRDA heart pathology (11–16). However, a more effec-tive overall therapeutic strategy may be to target theimmediate effects of the GAA repeat expansion mutationto restore normal levels of frataxin expression. The exactmechanism by which the GAA repeat expansion leads todecreased frataxin expression is unknown, but severalmodels have been put forward. First, it has been suggestedthat the GAA repeat expansion may adopt abnormal DNAor DNA/RNA hybrid structures that interfere with FXNgene transcription (17–20). Secondly, there is evidence thatGAA repeat expansions produce a heterochromatin-mediatedgene silencing effect (21). Epigenetic mechanisms, such asDNA methylation and the associated deacetylation andmethylation of histones are known to affect gene expressionby chromatin remodelling (22), and these epigeneticchanges are likely to underpin any GAA repeat-inducedheterochromatin-mediated gene silencing effects. In supportof this hypothesis, research has recently shown increasedDNA methylation of three specific CpG sites immediatelyupstream of the expanded GAA repeat sequence in FRDApatient lymphoblastoid cell lines and primary lymphocytes,and one of the three CpG sites was identified as an importantenhancer of frataxin expression (23). Other studies haveidentified specific histone modifications that are associatedwith gene silencing within the GAA repeat expansion-flanking regions of the FXN intron 1 sequence in FRDA lym-phoblastoid cell lines and primary lymphocytes (23,24).These changes include deacetylation of histone H3 and H4lysine residues and increased di- and trimethylation ofH3K9. Based on the hypothesis that the acetylation state ofthe core histones is responsible for gene silencing, novelhistone deacetylase (HDAC) inhibitor compounds havebeen developed and have been shown to increase FXN tran-scription in FRDA lymphoblastoid cells and primary lympho-cytes (24).
These previous epigenetic studies have provided valuableinsights into the possible mechanism of GAA-induced tran-scription inhibition, but they do not address the issue ofwhether such epigenetic changes are actually present in themost clinically relevant FRDA tissues. Therefore, wedecided to investigate epigenetic profiles of the FXN gene inFRDA patient autopsy brain, cerebellum and heart tissue. Bybisulfite sequencing and ChIP analysis we now reportchanges in DNA methylation and histone modifications thatare consistent with inhibition of FXN transcription. With aview to future epigenetic-based FRDA therapies, we alsoinvestigated the FXN epigenetic profiles within brain, cerebel-lum and heart tissue from our Y47, YG8 and YG22 FRDAYAC transgenic mouse models (25–27). We find that theGAA repeat expansion-containing FRDA mouse models(YG8 and YG22) exhibit comparable epigenetic changes tothose detected in FRDA patient tissue. Therefore, theseare excellent FRDA mouse models in which to investigatethe therapeutic effects of epigenetically acting compounds,such as novel HDAC inhibitors or DNA methylation inhibi-tors.
RESULTS
FXN gene DNA methylation profiles are distinctly alteredin human FRDA brain and heart tissues
A previous investigation of the FXN gene in FRDA patientlymphoblastoid cell lines and blood samples has detectedhypermethylation at three specific CpG sites immediatelyupstream of the expanded GAA repeat sequence. One of thethree CpG sites was further identified as an important enhancerelement for frataxin expression (23). This same study alsoreported a lack of any DNA methylation in the promoterregion of either FRDA or unaffected cells.
However, cultured cells are known to often develop non-physiological DNA methylation profiles. Furthermore,FRDA is a systemic disorder that is known to have differen-tially affected tissues and cell types. Therefore, we chose toinvestigate the DNA methylation status in two of theprimary affected tissues in FRDA, namely brain and heart.We obtained brain and heart autopsy tissues from twoFRDA patients (GAA repeat sizes of 750/650 and 700/700)and two unaffected individuals, and we first determined theFXN transcription levels of the samples by quantitative RT–PCR. The FRDA brain and heart samples showed meanvalues of 23 and 65% FXN expression, respectively, comparedwith the unaffected samples (Fig. 1). We then analysed theDNA methylation status of the samples by performing bisulfitesequence analysis of three regions of the FXN gene: (i) a475 bp sequence that encompasses part of the FXN promoter,exon 1 and start of intron 1, containing 59 CpG sites; (ii) a286 bp sequence upstream of the GAA repeat, containing8 CpG sites and (iii) a 275 bp sequence downstream of theGAA repeat, containing 12 CpG sites (Fig. 2). A comparisonof the bisulfite sequences from the FRDA patient andcontrol brain and heart tissues reveals a certain degree ofDNA methylation in all eight of the upstream GAA CpGsites (Fig. 3C and D) and all 12 of the downstream GAACpG sites (Fig. 3E and F). However, the data show a
Figure 1. Quantitative RT–PCR analysis of FXN mRNA isolated from brainand heart autopsy samples of two FRDA patients (750/650 and 700/700 GAArepeats) and two unaffected individuals. The mean values of FRDA patienttissue data are normalized to the mean FXN mRNA level of the unaffectedindividuals taken as 100%. Two individual cDNA samples were analysedfor each tissue and each reaction was carried out in triplicate. Bars representSEMs.
736 Human Molecular Genetics, 2008, Vol. 17, No. 5

Figure 2. Schematic representation of 2.2 kb at the 50 end of the FXN gene, indicating the promoter/exon 1 (Pro), upstream GAA (Up) and downstream GAA(Down) regions that were analysed by ChIP (black boxes) and bisulfite sequencing (hatched boxes). Numbers above indicate the position of CpG sites within thepromoter and upstream GAA regions. The positions of the ATG translation start codon, exon 1 open reading frame and GAA repeat sequence within the Alurepeat sequence are shown. Numbers below indicate the chromosome 9 base pair numbering according to the 2006 build of the UCSC human DNA sequencedatabase.
Figure 3. DNA methylation analysis of the FXN promoter (A and B), upstream GAA (C and D) and downstream GAA (E and F) regions of human brain andheart tissues. In each case for the FXN promoter and upstream GAA regions the mean percentage (þSEM) of methylated CpG sites is shown as determined fromthe analysis of two FRDA patients and two unaffected individuals, with 7–12 independent cloned DNA sequences analysed for each. For the downstream regionthe percentage of methylated CpG sites has been determined from one FRDA patient and one unaffected individual (12 independent cloned DNA sequencesanalysed for each). Only eleven CpG sites are represented for the promoter region (A and B), as sites 11–22 and 24–59 did not show any methylation ineither FRDA or unaffected samples in brain or heart. FRDA brain tissues and both FRDA and unaffected heart tissues did not show any DNA methylationat CpG site 23.
Human Molecular Genetics, 2008, Vol. 17, No. 5 737

consistent shift in the DNA methylation pattern around theGAA repeat in both tissue types. The FRDA upstream GAACpG sites are comparatively hypermethylated, whereas theFRDA downstream GAA CpG sites are comparatively hypo-methylated (Fig. 3C–F). The greatest increases in DNAmethylation within the upstream GAA region are seen atCpG sites 4, 5 and 6, the latter of which corresponds to thepreviously described E-box enhancer element (23). Weobserved 100% methylation at CpG site 6 in FRDA braintissues (FXN mRNA level of 23%, Fig. 1) compared with amean value of 90% methylation in heart tissue (FXN mRNAlevel of 65%, Fig. 1). Thus, the upstream GAA DNA methyl-ation changes in both FRDA brain and heart are consistentwith their proposed roles in inhibition of FXN transcription.However, the finding of decreased DNA methylation in thedownstream GAA region (Fig. 3E and F) is somewhat unex-pected, since all of the 12 CpG sites fall within an Alurepeat sequence and such sequences are usually repressed byheavy DNA methylation.
Another particularly interesting finding was the identifi-cation of differential DNA methylation at three specific CpGsites within the FXN promoter (sites 5, 7 and 8) and oneCpG site within exon 1 (site 23) (Fig. 3A and B). All of theother 55 CpG sites in the total of 59 CpG sites analysedshow complete lack of DNA methylation, as to be expectedfor a CpG island that is situated at the start of a gene. CpGsites 5, 7 and 8 show incomplete methylation in the unaffectedheart, but complete methylation in the FRDA heart (Fig. 3B).Therefore, these CpG sites may be involved in reducinginitiation of FXN gene transcription in FRDA heart.However, the DNA methylation pattern is different in brain
tissue. Here we identified mean values of 10–35% DNAmethylation at the four CpG sites in the unaffected tissues,but very little overall change of DNA methylation in FRDAtissues, or even loss of methylation at CpG sites 5 and 23(Fig. 3A). Furthermore, the fact that we have identifiedsome degree of DNA methylation at all in this region contrastswith the previous report that DNA methylation is absent in theFXN promoter region of both FRDA and unaffected lympho-blastoid cells (23). Therefore, we have shown that the influ-ence of DNA methylation on FXN gene expression is likelyto be complex, with some similarities (CpG site usage) butalso some distinct differences (degree of CpG methylation)identified between different somatic tissues.
FXN gene histone modifications are altered in humanFRDA brain tissue
Previous studies of the promoter, upstream GAA and down-stream GAA regions of the FXN gene have identified specifichistone modifications that are associated with gene silencingwithin the GAA repeat expansion-flanking regions of the FXNintron 1 sequence in FRDA lymphoblastoid cell lines andprimary lymphocytes (23,24). We have now investigated acetyl-ated histone H3 and H4 and methylated histone H3K9 modifi-cations by ChIP analysis of the FXN promoter, upstream GAAand downstream GAA regions (Fig. 2) in autopsy brain tissuesfrom two FRDA patients and two unaffected individuals. Ourresults show overall decreased histone H3 and H4 acetylationof FRDA brain tissue, particularly in the downstream GAAregion (Fig.4). All of the six acetylated histone residuesthat we have examined show a GAA-induced gradient of
Figure 4. Analysis of histone modifications in human brain tissue. ChIP quantitative PCR results for the FXN promoter/exon1 (Pro), upstream GAA (Up) anddownstream GAA (Down) amplified regions are represented as the relative amount of immunoprecipitated DNA compared with input DNA, having taken neg-ligible 2Ab control values into account. FXN values were normalized with human GAPDH and all values have been adjusted so that all of the Upstream GAAmean values from the unaffected individuals are 100%. In each case two individual ChIP samples from two FRDA patients and two unaffected controls wereanalysed in triplicate. The means and SEMs of these values are shown.
738 Human Molecular Genetics, 2008, Vol. 17, No. 5
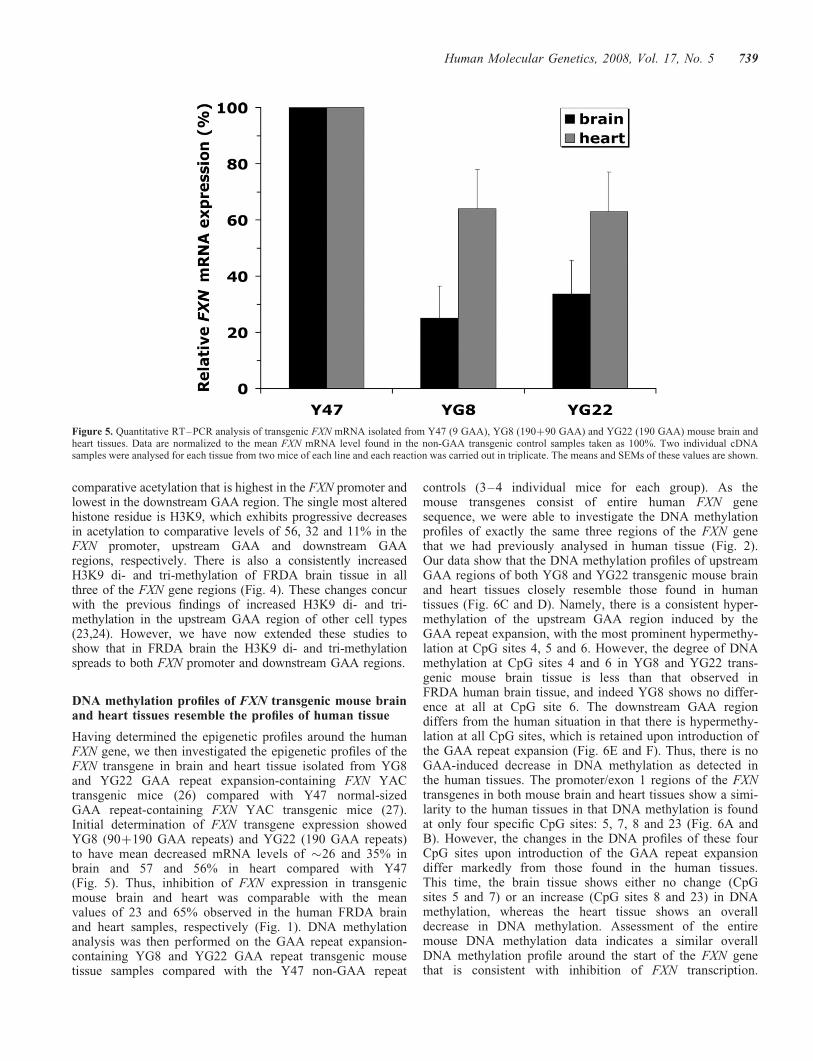
comparative acetylation that is highest in the FXN promoter andlowest in the downstream GAA region. The single most alteredhistone residue is H3K9, which exhibits progressive decreasesin acetylation to comparative levels of 56, 32 and 11% in theFXN promoter, upstream GAA and downstream GAAregions, respectively. There is also a consistently increasedH3K9 di- and tri-methylation of FRDA brain tissue in allthree of the FXN gene regions (Fig. 4). These changes concurwith the previous findings of increased H3K9 di- and tri-methylation in the upstream GAA region of other cell types(23,24). However, we have now extended these studies toshow that in FRDA brain the H3K9 di- and tri-methylationspreads to both FXN promoter and downstream GAA regions.
DNA methylation profiles of FXN transgenic mouse brainand heart tissues resemble the profiles of human tissue
Having determined the epigenetic profiles around the humanFXN gene, we then investigated the epigenetic profiles of theFXN transgene in brain and heart tissue isolated from YG8and YG22 GAA repeat expansion-containing FXN YACtransgenic mice (26) compared with Y47 normal-sizedGAA repeat-containing FXN YAC transgenic mice (27).Initial determination of FXN transgene expression showedYG8 (90þ190 GAA repeats) and YG22 (190 GAA repeats)to have mean decreased mRNA levels of �26 and 35% inbrain and 57 and 56% in heart compared with Y47(Fig. 5). Thus, inhibition of FXN expression in transgenicmouse brain and heart was comparable with the meanvalues of 23 and 65% observed in the human FRDA brainand heart samples, respectively (Fig. 1). DNA methylationanalysis was then performed on the GAA repeat expansion-containing YG8 and YG22 GAA repeat transgenic mousetissue samples compared with the Y47 non-GAA repeat
controls (3–4 individual mice for each group). As themouse transgenes consist of entire human FXN genesequence, we were able to investigate the DNA methylationprofiles of exactly the same three regions of the FXN genethat we had previously analysed in human tissue (Fig. 2).Our data show that the DNA methylation profiles of upstreamGAA regions of both YG8 and YG22 transgenic mouse brainand heart tissues closely resemble those found in humantissues (Fig. 6C and D). Namely, there is a consistent hyper-methylation of the upstream GAA region induced by theGAA repeat expansion, with the most prominent hypermethy-lation at CpG sites 4, 5 and 6. However, the degree of DNAmethylation at CpG sites 4 and 6 in YG8 and YG22 trans-genic mouse brain tissue is less than that observed inFRDA human brain tissue, and indeed YG8 shows no differ-ence at all at CpG site 6. The downstream GAA regiondiffers from the human situation in that there is hypermethy-lation at all CpG sites, which is retained upon introduction ofthe GAA repeat expansion (Fig. 6E and F). Thus, there is noGAA-induced decrease in DNA methylation as detected inthe human tissues. The promoter/exon 1 regions of the FXNtransgenes in both mouse brain and heart tissues show a simi-larity to the human tissues in that DNA methylation is foundat only four specific CpG sites: 5, 7, 8 and 23 (Fig. 6A andB). However, the changes in the DNA profiles of these fourCpG sites upon introduction of the GAA repeat expansiondiffer markedly from those found in the human tissues.This time, the brain tissue shows either no change (CpGsites 5 and 7) or an increase (CpG sites 8 and 23) in DNAmethylation, whereas the heart tissue shows an overalldecrease in DNA methylation. Assessment of the entiremouse DNA methylation data indicates a similar overallDNA methylation profile around the start of the FXN genethat is consistent with inhibition of FXN transcription.
Figure 5. Quantitative RT–PCR analysis of transgenic FXN mRNA isolated from Y47 (9 GAA), YG8 (190þ90 GAA) and YG22 (190 GAA) mouse brain andheart tissues. Data are normalized to the mean FXN mRNA level found in the non-GAA transgenic control samples taken as 100%. Two individual cDNAsamples were analysed for each tissue from two mice of each line and each reaction was carried out in triplicate. The means and SEMs of these values are shown.
Human Molecular Genetics, 2008, Vol. 17, No. 5 739

However, there are also some specific differences, which mayresult from epigenetic-control or transcriptional-control vari-ations between the human and the mouse that will requirefurther investigation.
DNA methylation profiles of the upstream GAA regionin FXN human and transgenic mouse cerebellartissues are comparable and more severely alteredthan in other brain tissue
To investigate potential variation within distinct regions of thebrain we further analysed the DNA methylation profiles within
the upstream GAA region of cerebellar tissue from one FRDApatient compared with an unaffected control and two individ-ual mice from each of the YG8 and YG22 lines compared withthe Y47 control line. We chose to investigate the cerebellumbecause this structure is known to be involved in FRDA path-ology (10) and we ourselves have observed increased GAArepeat instability primarily within the cerebellum of bothhuman FRDA patient and FRDA transgenic mouse tissues(3,5,25). The results (shown in Fig. 7) reveal similar DNAmethylation changes to those observed in both human andmouse brain tissues. However, the degree of hypermethylationchange in the GAA repeat expansion-containing human and
Figure 6. DNA methylation analysis of the FXN promoter (A and B), upstream GAA (C and D) and downstream GAA (E and F) regions of Y47 (blackcolumns), YG8 (light grey columns) and YG22 (dark grey columns) transgenic mouse brain and heart tissues. In each case for the FXN promoter and upstreamGAA regions, the mean percentage value (þSEM) of methylated CpG sites is shown as determined from the analysis of 7–12 independent cloned DNAsequences from each of 3–4 mice per group. For the downstream region the percentages of methylated CpG sites have been determined from one Y47,YG8 and YG22 mouse (12 independent cloned DNA sequences analysed for each). Only eleven CpG sites are represented for the promoter region, as sites11–22 and 24–59 did not show any methylation in either FRDA or unaffected samples in brain or heart. Y47 brain tissues did not show any DNA methylationat CpG site 23, while YG22 heart tissues did not show any DNA methylation at any CpG site within the promoter region.
740 Human Molecular Genetics, 2008, Vol. 17, No. 5

mouse cerebellar tissue is more severe, particularly at CpGsites 4, 5 and 6, compared with that seen in the brain tissuesas a whole (Fig. 7A compared with Fig. 3C, and Fig. 7B com-pared with Fig. 6C). We have previously shown that frataxinexpression in cerebellar tissue is reduced at both mRNA andprotein levels compared with brain and brain stem tissue inour FXN transgenic mice (26). Therefore, the DNA hyper-methylation patterns that we have now observed concur withthe hypothesis that the upstream GAA region (CpG sites 4–6 in particular) is somehow involved in down-regulation offrataxin transcription.
Histone modifications of FXN transgenic mouse braintissue are comparable with histone modificationsof human tissue
Acetylated histone H3 and H4 and di- and tri-methylatedhistone H3K9 modifications were detected by ChIP analysisof the three regions of the FXN transgene (Fig. 2) in braintissue isolated from both YG8 and YG22 GAA repeatexpansion-containing FXN YAC transgenic mice (26) andY47 normal-sized GAA repeat-containing FXN YAC trans-genic mice (27). Our results show overall GAA repeat-induceddecreases in histone H3K9 acetylation and increases in H3K9methylation for both YG8 and YG22 transgenic mice (Fig. 8),as we previously identified in human FRDA tissue (Fig. 4).However, the level of deacetylation in the transgenic mousetissue was not as great as that seen in the human tissue, poss-ibly as a consequence of the smaller transgenic GAA repeatexpansion sizes (190þ90 for YG8 mice and 190 for YG22mice, compared with 750/650 and 700/700 for FRDApatients). Also, H4K16 acetylation is actually increased inall three FXN transgene regions of YG8 mouse tissue com-pared with Y47. Furthermore, H4K8 acetylation and H4K12acetylation are increased in all three FXN transgene regionsof YG22 mouse tissue compared with Y47, which is somewhatdifferent to the finding in human tissues. The greatest consist-ent histone residue changes that we found between thenon-GAA (Y47) and both of the GAA (YG8 and YG22) trans-genic brain tissue samples were decreases in acetylated H3K9
and increases in di- and tri-methylated H3K9. The H4K12residue also showed a significant degree of deacetylation,but only in the YG8 transgenic tissue. All of these majorhistone residue changes in mouse brain tissue reflect theGAA repeat-induced histone residue changes that we detectedin human tissue. Furthermore, as with the human samples, wesimilarly identified a GAA repeat-induced gradient ofdecreased H3K9 acetylation in both YG8 and YG22 trans-genic mouse tissues, with the highest comparative levels ofacetylation in the FXN promoter and the lowest comparativelevels in the downstream GAA region. The increases inH3K9 di- and tri-methylation were consistent throughout allof the three FXN gene regions in both YG8 and YG22 trans-genic mice, once again agreeing with our findings in humanFRDA tissue.
DISCUSSION
For the consideration of future FRDA therapy, it is first essen-tial to understand the mechanism of GAA-induced inhibitionof FXN gene transcription. Previous studies of FRDA haveimplicated epigenetic changes, including the detection ofincreased DNA methylation of specific CpG sites upstreamof the GAA repeat and histone modifications in regions flank-ing the GAA repeat that are both consistent with transcriptioninhibition (23,24). However, no DNA or histone methylationchanges have previously been identified in the FXN promoteror downstream GAA regions, and clinically relevant FRDAbrain and heart tissues have not previously been investigated.Different trinucleotide repeat expansion mutations have beenshown to induce cis-acting epigenetic changes in severalother human disorders (28,29). Thus, DNA methylation ofthe CGG repeat upstream of the FMR1 gene has been ident-ified as a main epigenetic switch in Fragile X syndrome,with histone acetylation playing an ancillary role (30).Decreased Sp1 interaction associated with DNA hypermethy-lation upstream of the CTG repeat in the DMPK gene has alsobeen reported for congenital myotonic dystrophy type 1 (29).Furthermore, both CTG and GAA repeat expansions have
Figure 7. DNA methylation analysis of the upstream GAA regions of human (A) and transgenic mouse (B) cerebellar tissue. (A) In each case the mean percen-tage (þ SEM) of methylated CpG sites is shown as determined from the analysis of two FRDA patients (black columns) and two unaffected individuals (greycolumns) with 10 independent cloned DNA sequences analysed for each. (B) Y47 (11 GAA) (black columns), YG8 (190þ90 GAA) (light grey columns) andYG22 (190 GAA) (dark grey columns) transgenic mouse brain and heart tissues. In each case the mean percentage value (þSEM) of methylated CpG sites isshown as determined from the analysis of 7–12 independent cloned DNA sequences from each of two mice per group.
Human Molecular Genetics, 2008, Vol. 17, No. 5 741

been shown to induce similar heterochromatin formation byposition effect variegation studies of transgenic mice (21).However, it is still uncertain if different trinucleotide repeatsequences produce similar overall epigenetic effects or not.
Our investigations of the FXN gene in both FRDA humanand transgenic mouse brain, cerebellum and heart tissueshave now confirmed the presence of previously describedDNA methylation changes (23) in the upstream GAA regionof these clinically important tissues. Furthermore, our datahave revealed an overall shift in the DNA methylationprofile, moving from hypomethylation in the downstreamGAA region towards hypermethylation in the upstream GAAregion. This shift in DNA methylation profile could beexplained by the known position of the GAA repeat withinan Alu sequence, since Alu sequences have been shown toact as methylation centres leading to bi-directional spread ofDNA methylation (31). Thus, the hypermethylation detectedin the FRDA upstream GAA region may be due to the GAArepeat mutation enhancing the effect of a putative methylationcentre at the 50 end of the Alu sequence. At the same time, theaddition of the GAA repeat sequence would put extra distancebetween the methylation centre at the 50 end of the Alusequence and the downstream GAA region. This mayimpede the spread of methylation to the downstream regionwhen the distance is large enough (e.g. 2.25 kb for 750human GAA repeats), but not when the distance is smaller(e.g. 600 bp for 190 transgenic mouse GAA repeats).
We have additionally identified differential DNA methyl-ation at four specific CpG sites within the FXN promoter andexon 1 regions that have not previously been reported. Thethree CpG sites within the promoter region (sites 5, 7 and 8)
are immediately upstream of the ATG translation start site, atnucleotide positions 227, 218 and 211, respectively. CpGsites 5 and 7 are also contained within Sp1 transcriptionfactor binding sites (32). Interestingly, the region between264 and the start of translation has previously been suggestedto contain sequences important for positive regulation of fra-taxin production, although no candidate sequences were ident-ified (33). Therefore, the three differentially methylated CpGsites that we have now uncovered in the FXN promoter, andin particular the two Sp1 recognition sites, are likely to rep-resent these important regulatory sequences.
In comparison with other instances of trinucleotiderepeat-induced DNA methylation changes that inhibit tran-scription (28,29), one would have predicted general hyper-methylation to be associated with the FRDA GAA repeatexpansion mutation. However, we actually identified threeoccurrences in human tissues (promoter and downstreamGAA regions in brain, and downstream GAA region in heart)and one occurrence in mouse tissues (promoter region inheart) where there was in fact GAA repeat expansion-induceddecrease in DNA methylation. This suggests the possible occur-rence of demethylation and resultant active FXN geneexpression, at least for some cells within the tissue. DNAdemethylation has previously been shown to occur both pas-sively due to DNA replication upon cell division (34) andactively in a process that may involve RNA (35), althoughthe DNA demethylating activity has yet to be identified. DNAdemethylation has also previously been associated with pro-cesses of DNA damage and repair. The formation of8-OH-dG by oxidative DNA damage has been shown toaffect the activity of human DNA methyltransferase and
Figure 8. Analysis of histone modifications in transgenic mouse brain tissues. ChIP quantitative PCR results for the transgenic FXN promoter/exon1 (Pro),upstream GAA (Up) and downstream GAA (Down) amplified regions are represented as the relative amount of immunoprecipitated DNA compared withinput DNA, having taken negligible 2Ab control values into account. FXN values were normalized with mouse GAPDH and all values have been adjustedso that all of the upstream GAA values from the non-GAA transgenic mouse tissues (Y47) are 100%. In each case two individual ChIP samples were analysedin triplicate from each of two mice per group. The means and SEMs of these values are shown.
742 Human Molecular Genetics, 2008, Vol. 17, No. 5

inhibit CpG methylation (36), and DNA demethylation has alsobeen shown to occur as a result of homologous recombinationrepair of DNA damaged by double-strand breaks (37).However, DNA demethylation has not previously been con-sidered for FRDA. A close inspection of our data reveals thatpotential DNA demethylation in the FXN promoter regionoccurs when the degree of DNA hypermethylation change inthe upstream GAA region is greatest. Therefore, we nowpropose that the shutdown of transcription due to major epige-netic changes at the upstream GAA region may result inattempts to upregulate FXN transcription by Sp1 binding andsubsequent DNA demethylation in the promoter region. Insupport of this proposal, Sp1 binding is known to occur inde-pendent of CpG methylation status (32), but at the same timehas been shown to inhibit CpG methylation (38). Furthermore,DNA demethylation has previously been shown to occur whenthere are few methylated CpG sites within a CpG island, but notwhen all of the CpG sites are methylated (39), which is exactlythe situation that we find for the FXN promoter region.However, the GAA repeat expansion-induced decreases inDNA methylation at the FXN promoter are not consistentthroughout all human and mouse brain and heart tissues,suggesting the involvement of other factors. Such factors mayinclude differential susceptibility of the brain and hearttissues to DNA damage and/or GAA repeat instability.Indeed, FRDA is a disorder that is known to involve both oxi-dative DNA damage (40) and somatic instability of GAArepeats (3–5). Therefore, cells that are initially methylated atthe FXN promoter region may lose this methylation as part ofthe GAA repeat instability process, wherein demethylation sub-sequent to DNA damage repair (37) may be selected for due tobeneficial effect of FXN expression and hence cell viability.The GAA repeat expansion-induced decreases in DNA methyl-ation that we have observed in the downstream GAA region ofhuman tissues, but not transgenic mouse tissues, are more likelydue to differently sized GAA repeats within the Alu sequence,as we have previously discussed. However, potential DNAdemethylation in this downstream GAA region could alsoindirectly lead to an increase in FXN transcription due to theremoval of inhibitory effects on RNA polymerase II elongation.
Our investigations of histone modifications within FXNgene in both FRDA human and transgenic mouse braintissues have now confirmed the changes previously reportedfor H3K9 deacetylation in the FXN promoter, upstreamGAA and downstream GAA regions and H3K9 methylationin the upstream GAA region (23,24). Furthermore, we haveextended the H3K9 methylation analysis to include the FXNpromoter and downstream GAA regions that to our knowledgehave not previously been reported for any FRDA tissue. Ourfindings from both human and transgenic mouse tissues indi-cate significant H3K9 deacetylation, which becomes moresevere upon progression from the FXN promoter, throughthe upstream GAA region to the downstream GAA region.This correlates well with the results for both di- and tri-methylation of H3K9, which show a generally similar gradientof progressive increase from the FXN promoter, through theupstream GAA region, to the downstream GAA region. Theonly exception is the very high level of di-methylated H3K9in the upstream GAA region of human FRDA brain tissue,which is higher than that in the downstream GAA region.
All of the H3K9 changes correlate well with the DNAmethylation changes in both human and transgenic mousebrain tissues. Thus, the patterns of progressively increasingH3K9 deacetylation and increasing H3K9 di- and tri-methylation in transgenic mouse brain correspond exactly tothe pattern of increasing DNA methylation. Similarly, the pat-terns of progressively increasing H3K9 deacetylation andincreasing H3K9 tri-methylation in human FRDA brain witha peak of H3K9 di-methylation in the upstream GAA regionequate very well to the corresponding DNA methylation pro-files. Therefore, our combined data thus far indicate majorroles for DNA methylation, histone H3K9 deacetylation andhistone H3K9 methylation in the inhibition of FXN transcrip-tion in brain and heart tissues, with a less prominent role fordeacetylation of other histone residues. The more severe epi-genetic changes within the FXN intron 1 region comparedwith the promoter region support a hypothesis of transcriptioninhibition due to interference with elongation rather thaninitiation. Further work will be required to determine theexact relationships between DNA methylation, histone acety-lation and methylation, heterochromatin formation and tran-scription inhibition. However, our results are consistent withthe generally described pathway for gene inactivationwherein initial histone H3K9 deacetylation leads to H3K9methylation, recruitment of HP1, histone deacetylases, DNAmethyltransferases and eventual long-term shut down of tran-scription by DNA methylation (41). However, this situation isnot likely to be universal for all trinucleotide repeat disorders,as highlighted by research on the FMR1 gene which has shownboth histone deacetylation and H3K9 methylation in theabsence of DNA methylation without interfering in activegene transcription (42).
For now, the exact mechanism by which the GAA repeatmutation inhibits frataxin expression remains elusive.However, accumulating evidence, including the findings ofthis report, now highlights the importance of epigeneticchanges that lead to heterochromatin formation. The epige-netic changes that we and others have now identified inFRDA do not in any way negate the importance of any abnor-mal DNA or DNA/RNA hybrid structures in the inhibition offrataxin expression, but rather suggest the involvement ofseveral combined mechanisms. Indeed the existence of abnor-mal DNA structures may help to explain why the GAA repeatmutation induces epigenetic changes in the first place. Thus,there are reports that non-B DNA structures such as hairpinsmay induce DNA methylation (43,44), and GAA repeatshave been shown to form hairpins (45). Alternatively, smalldouble-stranded RNA (dsRNA) has also been shown toinduce transcriptional gene silencing through a mechanismthat involves DNA methylation (46,47). However, dsRNAhas failed to induce DNA methylation in a study of mouseoocytes (48) and dsRNA targeted to the HD gene does notinduce DNA methylation at the target huntingtin genomiclocus in human cells (49). Thus, further studies are stillrequired to identify any possible involvement of non-B DNAstructures (such as GAA hairpins or triplex structures),DNA/RNA hybrids or dsRNA in the establishment of epige-netic changes and heterochromatin formation in FRDA.
In light of the epigenetic changes that we and others haveidentified in FRDA tissues and cells, several novel epigenetic-
Human Molecular Genetics, 2008, Vol. 17, No. 5 743

based therapeutic approaches can now be considered forFRDA. First, HDAC inhibitors can be used, and indeed thesehave already shown considerable promise by increasing acety-lation of histones and thereby increasing FXN transcription inFRDA cells (24). Secondly, pharmacological approachescould be taken to decrease H3K9 methylation, as have recentlybeen described for the combined use of mithramycin and cysta-mine in Huntington disease mice (50). Thirdly, therapies todecrease DNA methylation should now be considered forFRDA, as have previously been tried for other trinucleotiderepeat disorders. In particular, 5-azadeoxycytidine (5-azadC)has been shown to remove DNA methylation of the CCGrepeat expansion, increase H3 and H4 acetylation, decreaseH3K9 methylation, increase H3K4 methylation and reactivatethe FMR1 gene (30,51). Combined HDAC inhibitor and5-azadC treatment has also been shown to synergisticallyincrease FMR1 gene activity (52). Finally, short dsRNA mol-ecules complementary to promoter sequences have recentlybeen shown to induce gene activation (53,54), and suchapproaches may also prove effective in increasing FXN tran-scription. Our identification of a transgenic FRDA mousemodel that shows comparable epigenetic changes to thoseseen in FRDA patients will now provide a valuable resourcein the study of all such epigenetic-based FRDA therapies.
MATERIALS AND METHODS
Tissues
Human brain, cerebellum and heart tissue samples wereobtained from autopsies of two FRDA patients (750/650 and700/700 GAA repeats) and two non-FRDA individuals, inaccordance with UK Human Tissue Authority ethical guide-lines. Mouse brain and heart tissues were dissected from ourpreviously reported FXN YAC transgenic mouse models: Y47(two copies of nine GAA repeats); YG8 (2 copies of 90 and190 GAA repeats) and YG22 (1 copy of 190 GAA repeats)(25,27).
mRNA expression analysis
Total RNA was isolated from frozen tissues by homogenizationwith Trizol (Invitrogen) and cDNA was then prepared by usingAMV Reverse transcriptase (Invitrogen) with oligo-dT primers.Levels of human or mouse transgenic FXN mRNA expressionwere assessed by quantitative RT–PCR using an ABI7400sequencer and SYBRw Green (Applied Biosystems) with thefollowing primers: FxnRTF 50-CAGAGGAAACGCTGGACTCT-30 and FxnRTR 50-AGCCAGATTTGCTTGTTTGGC-30
(24). Human GAPDH or mouse Gapdh RT–PCR primerswere used as control standards: human: GapdhhF 50-GAAGGTGAAGGTCGGAGT-30 and GapdhhR 50-GAAGATGGTGATGGGATTTC-30 mouse GapdhmF 50-ACCCAGAAGACTGTGGATGG-30 and GapdhmR 50-GGATGCAGGGATGATGTTCT-30.
Bisulfite sequencing
Genomic DNA was isolated from frozen tissue by standardphenol/chloroform extraction and ethanol precipitation. Two
micrograms of genomic DNA was digested with EcoRI priorto bisulfite treatment using the CpGenome kit (Calbiochem).Nested PCR was carried out on bisulfite-treated DNA toamplify three regions of the FXN gene using the followingprimers: Pro 1st primer pair: SL1F1 50-TAGTTTTTAAGTTTTTTTTGTTTAG-30 and SL1R1 50-CAAAACAAAATATCCCCTTTTC-30; Pro 2nd primer pair: SL1F2 50-GTTTTTTTATAGAAGAGTGTTTG-30 and SL1R2 50-CAAAAACCAATATAAATACAACC-30; Up 1st primer pair: F1G 50-GAGGGATTTGTTTGGGTAAAG-30 and R1G 50-ATACTAAATTTCACCATATTAACC-30; Up 2nd primer pair: F2G 50-GATTTGTTTGGGTAAAGGTTAG-30 and R2G 50-CTCCCAAAATACTAAAATTATAAAC-30; Down 1st primer pair:NH1F 50-AAGAAGAAGAAGAAAATAAAGAAAAG-30 andSLGR2 50-TCCTAAAAAAAATCTAAAAACCATC-30;Down 2nd primer pair: NH2F 50-AGAAGAAGAAAATAAAGAAAAGTTAG-30 and SLGR1 50-AAAACCATCATAACCACACTTAC-30. PCR products were then resolved onagarose gels, purified with Geneclean (BIO101) and clonedinto pCR4.0 (Invitrogen) prior to DNA sequencing. Aminimum of seven clones were sequenced for each tissuesample.
ChIP analysis
Histone modifications at the three FXN gene regions weredetected by ChIP analysis of FRDA human and mousetissues. This procedure involved initial cross-linking of DNAand protein by formaldehyde treatment of homogenizedfrozen tissue samples. DNA was then sheared by sonication,followed by immunoprecipitation with commercially availableanti-histone and anti-acetylated histone H3 and H4 antibodies:H3K9ac, H3K14ac, H4K5ac, H4K8ac, H4K12ac, H4K16acand H3K9me2 (Upstate), and H3K9me3 (Diagenode). Foreach experiment, normal rabbit serum (SIGMA) was used asa minus antibody immunoprecipitation control. After reversalof cross-linking, quantitative RT–PCR amplification of theresultant co-immunoprecipitated DNA was carried out withSYBRw Green in an ABI7400 sequencer (Applied Biosys-tems) using three sets of FXN primers (Pro, Up and Down)and human GAPDH control for the human samples as pre-viously described (24). For the analysis of transgenic mousesamples, the same three sets of FXN primers were usedtogether with the following mouse Gapdh control primers:GapdhMF, 50-TGACAAGAGGGCGAGCG-30 and GapdhMR,50-GGAAGCCGAAGTCAGGAAC-30. Each tissue samplewas subjected to two independent ChIP procedures, followedby triplicate quantitative PCR analysis.
Conflict of Interest statement. None declared.
FUNDING
This research has been supported by the Friedreich’s AtaxiaResearch Alliance (FARA), the National Ataxia Foundation(NAF), Ataxia UK, GoFAR and the King Faisal SpecialistHospital and Research Center, KSA.
744 Human Molecular Genetics, 2008, Vol. 17, No. 5

REFERENCES
1. Campuzano, V., Montermini, L., Molto, M.D., Pianese, L., Cossee, M.,Cavalcanti, F., Monros, E., Rodius, F., Duclos, F., Monticelli, A. et al.
(1996) Friedreich’s ataxia: autosomal recessive disease caused by anintronic GAA triplet repeat expansion. Science, 271, 1423–1427.
2. Pandolfo, M. (2002) The molecular basis of Friedreich ataxia. Adv. Exp.
Med. Biol., 516, 99–118.
3. Clark, R.M., De Biase, I., Malykhina, A.P., Al-Mahdawi, S., Pook, M. andBidichandani, S.I. (2006) The GAA triplet-repeat is unstable in thecontext of the human FXN locus and displays age-dependent expansionsin cerebellum and DRG in a transgenic mouse model. Hum. Genet, 120,633–640.
4. De Biase, I., Rasmussen, A., Endres, D., Al-Mahdawi, S., Monticelli, A.,Cocozza, S., Pook, M. and Bidichandani, S.I. (2007) Progressive GAAexpansions in dorsal root ganglia of Friedreich’s ataxia patients. Ann.
Neurol., 61, 55–60.5. De Biase, I., Rasmussen, A., Monticelli, A., Al-Mahdawi, S., Pook, M.,
Cocozza, S. and Bidichandani, S.I. (2007) Somatic instability of theexpanded GAA triplet-repeat sequence in Friedreich ataxia progressesthroughout life. Genomics, 90, 1–5.
6. Campuzano, V., Montermini, L., Lutz, Y., Cova, L., Hindelang, C.,Jiralerspong, S., Trottier, Y., Kish, S.J., Faucheux, B., Trouillas, P. et al.
(1997) Frataxin is reduced in Friedreich ataxia patients and is associatedwith mitochondrial membranes. Hum. Mol. Genet., 6, 1771–1780.
7. Bulteau, A.L., O’Neill, H.A., Kennedy, M.C., Ikeda-Saito, M., Isaya, G.and Szweda, L.I. (2004) Frataxin acts as an iron chaperone protein tomodulate mitochondrial aconitase activity. Science, 305, 242–245.
8. Gerber, J., Muhlenhoff, U. and Lill, R. (2003) An interaction betweenfrataxin and Isu1/Nfs1 that is crucial for Fe/S cluster synthesis on Isu1.EMBO Rep., 4, 906–911.
9. Yoon, T. and Cowan, J.A. (2004) Frataxin-mediated iron delivery toferrochelatase in the final step of heme biosynthesis. J. Biol. Chem., 279,25943–25946.
10. Koeppen, A.H., Michael, S.C., Knutson, M.D., Haile, D.J., Qian, J., Levi, S.,Santambrogio, P., Garrick, M.D. and Lamarche, J.B. (2007) The dentatenucleus in Friedreich’s ataxia: the role of iron-responsive proteins. Acta.
Neuropathol., 114, 163–173.11. Hart, P.E., Lodi, R., Rajagopalan, B., Bradley, J.L., Crilley, J.G., Turner,
C., Blamire, A.M., Manners, D., Styles, P., Schapira, A.H. et al. (2005)Antioxidant treatment of patients with Friedreich ataxia: four-yearfollow-up. Arch. Neurol., 62, 621–626.
12. Mariotti, C., Solari, A., Torta, D., Marano, L., Fiorentini, C. and DiDonato, S. (2003) Idebenone treatment in Friedreich patients:one-year-long randomized placebo-controlled trial. Neurology, 60, 1676–1679.
13. Richardson, D.R., Mouralian, C., Ponka, P. and Becker, E. (2001)Development of potential iron chelators for the treatment of Friedreich’sataxia: ligands that mobilize mitochondrial iron. Biochim. Biophys. Acta.,1536, 133–140.
14. Rustin, P., Rotig, A., Munnich, A. and Sidi, D. (2002) Heart hypertrophyand function are improved by idebenone in Friedreich’s ataxia. Free
Radic. Res, 36, 467–469.15. Schols, L., Vorgerd, M., Schillings, M., Skipka, G. and Zange, J. (2001)
Idebenone in patients with Friedreich ataxia. Neurosci. Lett, 306, 169–172.
16. Seznec, H., Simon, D., Monassier, L., Criqui-Filipe, P., Gansmuller, A.,Rustin, P., Koenig, M. and Puccio, H. (2004) Idebenone delays the onsetof cardiac functional alteration without correction of Fe-S enzymes deficitin a mouse model for Friedreich ataxia. Hum. Mol. Genet, 13, 1017–1024.
17. Bidichandani, S.I., Ashizawa, T. and Patel, P.I. (1998) The GAAtriplet-repeat expansion in Friedreich ataxia interferes with transcriptionand may be associated with an unusual DNA structure. Am. J. Hum.
Genet, 62, 111–121.18. Grabczyk, E., Mancuso, M. and Sammarco, M.C. (2007) A persistent
RNA.DNA hybrid formed by transcription of the Friedreich ataxia tripletrepeat in live bacteria, and by T7 RNAP in vitro. Nucleic Acids Res., 35,5351–5359.
19. Grabczyk, E. and Usdin, K. (2000) The GAA�TTC triplet repeat expandedin Friedreich’s ataxia impedes transcription elongation by T7 RNApolymerase in a length and supercoil dependent manner. Nucleic Acids
Res., 28, 2815–2822.
20. Sakamoto, N., Ohshima, K., Montermini, L., Pandolfo, M. and Wells,R.D. (2001) Sticky DNA, a self-associated complex formed at longGAA�TTC repeats in intron 1 of the frataxin gene, inhibits transcription.J. Biol. Chem, 276, 27171–27177.
21. Saveliev, A., Everett, C., Sharpe, T., Webster, Z. and Festenstein, R.(2003) DNA triplet repeats mediate heterochromatin-protein-1-sensitivevariegated gene silencing. Nature, 422, 909–913.
22. Egger, G., Liang, G., Aparicio, A. and Jones, P.A. (2004) Epigenetics inhuman disease and prospects for epigenetic therapy. Nature, 429, 457–463.
23. Greene, E., Mahishi, L., Entezam, A., Kumari, D. and Usdin, K. (2007)Repeat-induced epigenetic changes in intron 1 of the frataxin gene and itsconsequences in Friedreich ataxia. Nucleic Acids Res., 35, 3383–3390.
24. Herman, D., Jenssen, K., Burnett, R., Soragni, E., Perlman, S.L. andGottesfeld, J.M. (2006) Histone deacetylase inhibitors reverse genesilencing in Friedreich’s ataxia. Nat. Chem. Biol., 2, 551–558.
25. Al-Mahdawi, S., Pinto, R.M., Ruddle, P., Carroll, C., Webster, Z. andPook, M. (2004) GAA repeat instability in Friedreich ataxia YACtransgenic mice. Genomics, 84, 301–310.
26. Al-Mahdawi, S., Pinto, R.M., Varshney, D., Lawrence, L., Lowrie, M.B.,Hughes, S., Webster, Z., Blake, J., Cooper, J.M., King, R. et al. (2006)GAA repeat expansion mutation mouse models of Friedreich ataxiaexhibit oxidative stress leading to progressive neuronal and cardiacpathology. Genomics, 88, 580–590.
27. Pook, M.A., Al-Mahdawi, S., Carroll, C.J., Cossee, M., Puccio, H.,Lawrence, L., Clark, P., Lowrie, M.B., Bradley, J.L., Cooper, J.M. et al.
(2001) Rescue of the Friedreich’s ataxia knockout mouse by human YACtransgenesis. Neurogenetics, 3, 185–193.
28. Greene, E., Handa, V., Kumari, D. and Usdin, K. (2003) Transcriptiondefects induced by repeat expansion: fragile X syndrome, FRAXE mentalretardation, progressive myoclonus epilepsy type 1, and Friedreich ataxia.Cytogenet. Genome Res., 100, 65–76.
29. Steinbach, P., Glaser, D., Vogel, W., Wolf, M. and Schwemmle, S. (1998)The DMPK gene of severely affected myotonic dystrophy patients ishypermethylated proximal to the largely expanded CTG repeat.Am. J. Hum. Genet, 62, 278–285.
30. Tabolacci, E., Pietrobono, R., Moscato, U., Oostra, B.A., Chiurazzi, P.and Neri, G. (2005) Differential epigenetic modifications in the FMR1gene of the fragile X syndrome after reactivating pharmacologicaltreatments. Eur. J. Hum. Genet, 13, 641–648.
31. Graff, J.R., Herman, J.G., Myohanen, S., Baylin, S.B. and Vertino, P.M.(1997) Mapping patterns of CpG island methylation in normal andneoplastic cells implicates both upstream and downstream regions in de
novo methylation. J. Biol. Chem, 272, 22322–22329.
32. Clark, S.J., Harrison, J. and Molloy, P.L. (1997) Sp1 binding is inhibitedby (m)Cp(m)CpG methylation. Gene, 195, 67–71.
33. Greene, E., Entezam, A., Kumari, D. and Usdin, K. (2005) Ancientrepeated DNA elements and the regulation of the human frataxinpromoter. Genomics, 85, 221–230.
34. Matsuo, K., Silke, J., Georgiev, O., Marti, P., Giovannini, N. and Rungger,D. (1998) An embryonic demethylation mechanism involving binding oftranscription factors to replicating DNA. EMBO J., 17, 1446–1453.
35. Weiss, A., Keshet, I., Razin, A. and Cedar, H. (1996) DNA demethylationin vitro: involvement of RNA. Cell, 86, 709–718.
36. Turk, P.W., Laayoun, A., Smith, S.S. and Weitzman, S.A. (1995) DNAadduct 8-hydroxyl-20-deoxyguanosine (8-hydroxyguanine) affectsfunction of human DNA methyltransferase. Carcinogenesis, 16, 1253–1255.
37. Cuozzo, C., Porcellini, A., Angrisano, T., Morano, A., Lee, B., Pardo,A.D., Messina, S., Iuliano, R., Fusco, A., Santillo, M.R. et al. (2007) DNAdamage, homology-directed repair, and DNA methylation. PLoS Genet.,3, e110. First published on 22 May 2007, 10.1371/pgen.0030110.
38. Macleod, D., Charlton, J., Mullins, J. and Bird, A.P. (1994) Sp1 sites inthe mouse aprt gene promoter are required to prevent methylation of theCpG island. Genes. Dev, 8, 2282–2292.
39. Choi, Y.C. and Chae, C.B. (1993) Demethylation of somatic andtestis-specific histone H2A and H2B genes in F9 embryonal carcinomacells. Mol. Cell. Biol., 13, 5538–5548.
40. Schulz, J.B., Dehmer, T., Schols, L., Mende, H., Hardt, C., Vorgerd, M.,Burk, K., Matson, W., Dichgans, J., Beal, M.F. et al. (2000) Oxidativestress in patients with Friedreich ataxia. Neurology, 55, 1719–1721.
Human Molecular Genetics, 2008, Vol. 17, No. 5 745
41. D’Alessio, A.C. and Szyf, M. (2006) Epigenetic tete-a-tete: the bilateralrelationship between chromatin modifications and DNA methylation.Biochem. Cell Biol., 84, 463–476.
42. Pietrobono, R., Tabolacci, E., Zalfa, F., Zito, I., Terracciano, A., Moscato,U., Bagni, C., Oostra, B., Chiurazzi, P. and Neri, G. (2005) Moleculardissection of the events leading to inactivation of the FMR1 gene. Hum.Mol. Genet, 14, 267–277.
43. Chen, X., Mariappan, S.V., Catasti, P., Ratliff, R., Moyzis, R.K., Laayoun,A., Smith, S.S., Bradbury, E.M. and Gupta, G. (1995) Hairpins are formedby the single DNA strands of the fragile X triplet repeats: structure andbiological implications. Proc. Natl Acad. Sci. USA, 92, 5199–5203.
44. Laayoun, A. and Smith, S.S. (1995) Methylation of slipped duplexes,snapbacks and cruciforms by human DNA(cytosine-5)methyltransferase.Nucleic Acids Res., 23, 1584–1589.
45. Heidenfelder, B.L., Makhov, A.M. and Topal, M.D. (2003) Hairpinformation in Friedreich’s ataxia triplet repeat expansion. J. Biol. Chem.,278, 2425–2431.
46. Kawasaki, H. and Taira, K. (2004) Induction of DNA methylation and genesilencing by short interfering RNAs in human cells. Nature, 431, 211–217.
47. Morris, K.V., Chan, S.W., Jacobsen, S.E. and Looney, D.J. (2004) Smallinterfering RNA-induced transcriptional gene silencing in human cells.Science, 305, 1289–1292.
48. Svoboda, P., Stein, P., Filipowicz, W. and Schultz, R.M. (2004) Lackof homologous sequence-specific DNA methylation in response to
stable dsRNA expression in mouse oocytes. Nucleic Acids Res., 32,3601–3606.
49. Park, C.W., Chen, Z., Kren, B.T. and Steer, C.J. (2004) Double-strandedsiRNA targeted to the huntingtin gene does not induce DNA methylation.Biochem. Biophys. Res. Commun., 323, 275–280.
50. Ryu, H., Lee, J., Hagerty, S.W., Soh, B.Y., McAlpin, S.E., Cormier, K.A.,Smith, K.M. and Ferrante, R.J. (2006) ESET/SETDB1 gene expressionand histone H3 (K9) trimethylation in Huntington’s disease. Proc. NatlAcad. Sci. USA, 103, 19176–19181.
51. Pietrobono, R., Pomponi, M.G., Tabolacci, E., Oostra, B., Chiurazzi, P.and Neri, G. (2002) Quantitative analysis of DNA demethylation andtranscriptional reactivation of the FMR1 gene in fragile X cells treatedwith 5-azadeoxycytidine. Nucleic Acids Res., 30, 3278–3285.
52. Chiurazzi, P., Pomponi, M.G., Pietrobono, R., Bakker, C.E., Neri, G. andOostra, B.A. (1999) Synergistic effect of histone hyperacetylation andDNA demethylation in the reactivation of the FMR1 gene. Hum. Mol.Genet, 8, 2317–2323.
53. Janowski, B.A., Younger, S.T., Hardy, D.B., Ram, R., Huffman, K.E. andCorey, D.R. (2007) Activating gene expression in mammalian cells withpromoter-targeted duplex RNAs. Nat. Chem. Biol., 3, 166–173.
54. Li, L.C., Okino, S.T., Zhao, H., Pookot, D., Place, R.F., Urakami, S.,Enokida, H. and Dahiya, R. (2006) Small dsRNAs inducetranscriptional activation in human cells. Proc. Natl Acad. Sci. USA,103, 17337–17342.
746 Human Molecular Genetics, 2008, Vol. 17, No. 5