Quantitative impact evaluation of the SHOUHARDO II Project ... II... · Quantitative impact...
69
Quantitative impact evaluation of the SHOUHARDO II Project in Bangladesh May 2015 TANGO, International Inc. 406 S. 4 th Avenue Tucson, Arizona 85701 USA www.tangointernational.com
Transcript of Quantitative impact evaluation of the SHOUHARDO II Project ... II... · Quantitative impact...

1
Quantitative impact evaluation of the SHOUHARDO II Project in Bangladesh
May 2015
TANGO, International Inc. 406 S. 4th Avenue
Tucson, Arizona 85701 USA www.tangointernational.com

2
Table of Contents
Acknowledgements ....................................................................................................................................... 1
Acronyms ...................................................................................................................................................... 2
List of Tables ................................................................................................................................................. 3
List of Figures ................................................................................................................................................ 4
Executive summary ....................................................................................................................................... 5
1. Introduction ............................................................................................................................................. 8
2. The SHOUHARDO II project: Beneficiary selection process and interventions ....................................... 9
2.1 Beneficiary selection process ........................................................................................................... 10
2.1.1 Identification of project geographical areas ................................................................................ 10
2.1.2 Household selection ..................................................................................................................... 10
2.2 Project interventions ........................................................................................................................ 12
2.3 Participation in project interventions .............................................................................................. 15
3. Conceptual framework and measurement of stunting and its determinants ....................................... 16
3.1 UNICEF conceptual framework ......................................................................................................... 16
3.2 Measures of stunting and its determinants ..................................................................................... 17
3.2.1 Stunting ..................................................................................................................................... 18
3.2.2 Determinants of stunting ........................................................................................................... 18
4. Data ........................................................................................................................................................ 19
5. Impact evaluation methodologies ......................................................................................................... 20
5.1 Descriptive methods ......................................................................................................................... 21
5.2 Instrumental variables regression analysis ...................................................................................... 22
5.3 Propensity score matching ............................................................................................................... 25
6. Results: Descriptive evidence of project impacts ................................................................................. 28
6.1 Trends in stunting among project households compared to nationally ..................................... 28
6.2 Shift in the age trajectory of stunting among project households .................................................. 30
6.3 Difference-in-difference analysis ..................................................................................................... 31
7. Results: Instrumental Variables evidence of project impacts ............................................................. 33
8. Results: Propensity Score Matching evidence on the impact of specific interventions ....................... 38
8.1 Mother and child health and nutrition interventions ...................................................................... 38
8.2 Women’s empowerment interventions ........................................................................................... 42

3
8.3 Livelihoods promotion interventions ............................................................................................... 44
8.4 Water and sanitation interventions ................................................................................................ 46
9. Summary and conclusions...................................................................................................................... 47
Appendix 1. Determinants of stunting employed as dependent variables: Variable descriptions .......... 51
Appendix 2. Household, village and district-level characteristics used for Propensity Score Matching
analysis: Variable descriptions ................................................................................................................... 53
Appendix 3. Instruments employed for Instrumental Variables tests and 2SLS regressions .................... 55
Appendix 4. Probit propensity score models for participation in SHOUHARDO II project intervention ... 56
References .................................................................................................................................................. 64

1
Acknowledgements
I would like to extend my gratitude to the CARE Bangladesh staff who made this impact evaluation study possible and provided timely information regarding the SHOUHARDO II project under difficult working conditions. I would especially like to thank Monzu Morshed, Deputy Chief of Party of SHOUHARDO II, AKM Abdul Wadud, Monitoring and Evaluation Coordinator, and Khan Tawhid Parvez, Senior Technical Manager for Health, Hygiene and Nutrition. The survey team from Mitra and Associates that collected the data employed here, in addition to Lloyd Banwart and Towfique Aziz of TANGO, International are gratefully acknowledged for their hard work in the field. Tom Bower provided excellent research assistance in support of the data analysis and report write-up. Finally, the individuals and families who gave freely of their time to be interviewed during the data collection are thanked in hope that the findings of this study will enable future programs to contribute to further improvements in food security and children’s nutritional status throughout Bangladesh. Lisa C. Smith, Ph.D. (Principal author) Senior Economist
TANGO, International

2
Acronyms
2SLS Two-stage Least Squares
ATT Average treatment effect on the treated
CHD Comprehensive Homestead Development
CHV Community health volunteer
COG Core Occupational Group(s)
DHS Demographic and Health Survey
ECCD Early Child Care for Development
EKATA Empowerment, Knowledge, and Transformative Action
HAZ Height-for-age Z-score
IGA Income Generating Activities
IV Instrumental Variable(s)
MCHN/PEP Maternal and Child Health and Nutrition/PEP
MT Metric ton
NGO Non-governmental organization(s)
OLS Ordinary Least Squares
PEP Poor and Extreme Poor
PCA Principal Components Analysis
PM2A Preventing Malnutrition in Children Under Two
PPS Probability proportionate to size
PSM Propensity Score Matching
RCT Randomized Controlled Trial
SHOUHARDO Strengthening Household Ability to Respond to Development Opportunities
WHZ Weight-for-height Z-score

3
List of Tables Table 1:Design of the randomized controlled trial to evaluate the relative effectiveness of the
MCHN/PEP versus the PM2A approach ......................................................................................... 12
Table 2: Participation in SHOUHARDO II project interventions, by region ................................................. 15
Table 3: Planned versus actual treatment status, by type of intervention ................................................ 24
Table 4: Change in the prevalence of stunting between the SHOUHARDO II ............................................ 28
Table 5: Age trajectory of stunting among 0-5 year olds: Comparison of SHOUHARDO II participant
children with Bangladeshi children ................................................................................................. 31
Table 6: Difference-in-difference analysis: Changes in child undernutrition and its determinants from
baseline to endline for eligible versus non-eligible households ..................................................... 32
Table 7: Instrumental variables estimates of the impact of participation in the SHOUHARDO II project on
children's height-for-age z-scores .................................................................................................. 34
Table 8: Instrumental variables estimates of the impact of participation in the SHOUHARDO II project on
household food security .................................................................................................................. 36
Table 9: Instrumental variables/OLS estimates of the impact of participation in the SHOUHARDO II
project on determinants of children’s nutritional status ................................................................ 37
Table 10: Propensity Score Matching estimates of the average treatment effect on the treated: Full
participation in Mother and Child Health and Nutrition interventions .......................................... 40
Table 11: Propensity Score Matching estimates of the average treatment effect on the treated (ATT):
Mother’s participation in women’s empowerment interventions ................................................. 43
Table 12: Propensity Score Matching estimates of the average treatment effect on the treated (ATT):
Participation in livelihood promotion interventions ......................................................................... 45
Table 13: Propensity Score Matching estimates of the average treatment effect on the treated:
Participation in water and sanitation interventions........................................................................ 46
Table 14: Summary of findings from single difference, difference-in-difference, instrumental variables,
and propensity score matching analyses ........................................................................................ 48
Table 15: Instrumental variables used for endogeneity testing and 2SLS estimates of the impact of
participation in the SHOUHARDO II project .................................................................................... 55
Table 16 Probit propensity score model estimation for full participation in SHOUHARDO II MCHN
interventions ..................................................................................................................................... 56
Table 17 Probit propensity score model estimation for full participation in SHOUHARDO II women’s
empowerment interventions .......................................................................................................... 58
Table 18: Probit propensity score model estimation for participation in livelihoods promotion
interventions ..................................................................................................................................... 60
Table 19: Probit propensity score model estimation for participation in water and sanitation
interventions ................................................................................................................................... 62
4
List of Figures
Figure 1: Map of SHOUHARDO II program area.......................................................................................... 11
Figure 2: UNICEF conceptual framework for the causes of maternal and child undernutrition ................ 16
Figure 3: Change in the prevalence of stunting between the SHOUHARDO II baseline and endline surveys
.................................................................................................................................................................... 28
Figure 4: Change in stunting prevalence among children under five: SHOUHARDO I and II .................... 29
Figure 5: Age trajectory of stunting among 0-59 month olds in project area at baseline ......................... 30
Figure 6: Instrumental variables estimates of the impact of participation in the SHOUHARDO II project on
children's height-for-age z-scores (HAZ) ...................................................................................... 35
Figure 7: Common support: Propensity scores of participant and non-participant households for full
participation in MCHN interventions ............................................................................................. 41

5
Executive summary The “Strengthening Household Ability to Respond to Development Opportunities II” (SHOUHARDO II) project was implemented by CARE Bangladesh from June 2010 through September 2015 in 1,573 villages located in the poorest and most marginalized districts in the country. The overall goal of SHOUHARDO II was to reduce households’ vulnerability to food insecurity. However, a key project outcome indicator was the prevalence of stunting—or chronic, long-term undernutrition—among preschool children. It employed an integrated approach to reducing food insecurity and child undernutrition, combining nutrition-specific interventions with those that address underlying causes, such as poverty, economic and gender inequality, and poor sanitation. The objective of this impact evaluation was to determine whether the observed reductions in the prevalence of stunting that took place over the project’s implementation period, from 61.7 to 48.8 percent for children under five, were caused specifically by the project’s interventions. It further aimed to understand how the reductions were brought about by examining whether the project had an impact on a set of underlying and immediate determinants of stunting, as defined in the UNICEF Conceptual Framework for the Causes of Maternal and Child Undernutrition. It also did so by examining which of the project’s interventions had an impact, focusing on four sets of interventions: maternal and child health and nutrition (MCHN), women’s empowerment, livelihoods promotion, and water and sanitation. The evaluation employed a variety of methods, including temporal comparisons of changes in indicators for project households compared to Bangladeshi households nation-wide, difference-in-difference (DID) analysis, Instrumental Variables (IV) testing and regression, and Propensity Score Matching (PSM). The results from these analyses were triangulated to draw conclusions regarding the project’s overall impact and how it was brought about. The data employed are from cross-sectional, population-based surveys of project villages conducted near the project’s inception (December 2010) and near its end (December 2014). Given the nature of the data employed, this impact evaluation was not able to evaluate the influence of the project’s activities designed to empower the poor and assist households and communities in preparing for, responding to and mitigating the impacts of disasters and climate change. Overall, the evidence presented in the report indicates that the SHOUHARDO II project was very successful in reducing child stunting. While it is not possible to pinpoint the exact amount of stunting reduction caused with accuracy, it seems likely that a large portion, if not all, of the 12.9 percentage–point reduction in the prevalence of stunting among under-fives observed between the baseline and endline surveys can be attributable to the project. Combined, the following findings support this conclusion:
The average annual decline in the stunting prevalence among eligible project households (3.2 percentage points per year) was far higher than that of rural Bangladeshi households in recent years (0.6 percentage points);
The normal large increase in stunting prevalence seen for children as they age from the 6-18 to the 48-60 month age group was not found for the group of children whose households participated in SHOUHARDO II interventions;
The DID analysis comparing the changes over time for eligible project households compared to non-eligible project households indicates that the stunting prevalence fell more for eligible households;

6
IV estimates of the impact of participation in the project confirm that it had a substantial, positive impact on children’s height-for-age z-scores;
The DID, IV and PSM analyses all indicate that the project’s interventions led to improvements in a broad array of determinants of stunting, improvements which are necessary for reducing stunting.
The findings regarding project impacts on the determinants of stunting reveal that the stunting reductions were brought about by improvements in all three underlying determinants—household food security, the quality of caring practices for mothers and children, and household health environments—and, additionally, in mother’s and children’s food consumption. With respect to household food security, the project’s interventions increased the amount of food households have access to, increased household dietary diversity (an indicator of the dietary quality), and reduced household hunger. With respect to caring practices for mothers during pregnancy, all methods point to project impacts on antenatal care, including whether that care is received in a medical facility. They suggest that the project led to women consuming more food and getting more day-time rest during their pregnancies. Finally, because of the project more women are receiving Vitamin A supplementation within six weeks of their delivery and iron/folic acid supplementation during pregnancy. For caring practices for children, project interventions led to greater knowledge among mothers of the appropriate times for hand washing and an increase in the practice of safely disposing of children’s feces. It also increased Vitamin supplementation for children, including vitamin A and multivitamin supplementation. No clear evidence was found of an impact on child immunization. Some of the improvement in household health environments seen between the baseline and endline
surveys among eligible households, including improvement in access to safe water and access to
sanitary toilet facilities, can likely be attributed to the project. Note, however, that the results from the
different analyses are incongruent on this important determinant of child stunting.
Finally, with regard to food consumption, the results suggest that dietary diversity was enhanced for households as a whole and for mothers and children living in them. They confirm that the large increase in the percent of children 6-23 months who have a minimum acceptable diet, from 10 to 46 percent, was at least partially caused by the project’s interventions. Taking into account the results for all analyses, the evidence on the impact of the project is ambiguous for diarrhea incidence among children under five, the only indicator of children’s health measured as part of the project surveys. While the evidence of an impact on mother’s nutritional status is not straightforward, it appears likely that the project’s interventions did lead to some improvement in mothers’ Body Mass Index, which is an important step towards preventing low birth weight. The PSM results give insight into the question of which of the four sets of intervention examined brought about the reductions in stunting and improvements in its determinants. While none of the interventions were found to improve children’s nutritional status (which is likely due to the weakness of the PSM method in controlling for the targeting of undernourished children that took place), they were each found to have contributed in some way. In sum:

7
The MCHN interventions had a broad influence, improving household, mother’s and children’s dietary diversity; a wide variety of the caring practices for mothers during pregnancy; a wide variety of the caring practices for children; and access to sanitary toilet facilities.
The women’s empowerment interventions also facilitated improvements in many important determinants of stunting, including household and mother’s dietary diversity, household hunger, antenatal care during pregnancy, taking more food during pregnancy, post-delivery Vitamin A supplementation of mothers, and indicators of the knowledge and use of hygiene practices.
The livelihoods promotion activities increased household, mother and children’s dietary diversity, reduced household hunger, and improved mothers’ nutritional status.
The project’s water and sanitation interventions are found to have increased access to sanitary toilet facilities.
In conclusion, this report finds that the SHOUHARDO II project was successful in reducing child stunting. Two factors that contributed to its success were: 1) it addressed a broad range of underlying and immediate causes of chronic undernutrition; and 2) it brought to bear not only nutrition-specific MCHN interventions to address the problem, but also interventions designed to empower women, to promote households’ livelihoods, and to improve households’ health environments.
8
1. Introduction The “Strengthening Household Ability to Respond to Development Opportunities II” (SHOUHARDO II) project, funded by the United States Agency for International Development and the Government of Bangladesh, was implemented by CARE Bangladesh from June 2010 through September 2015. Carried out in 1,573 villages located within eleven of the poorest and most marginalized districts in Bangladesh, it is one of the largest non-emergency food security development programs in the world. The project follows on the experience of its predecessor, the SHOUHARDO I program implemented from 2005-2009, which piloted an integrated approach to reducing child undernutrition, combining nutrition-specific interventions with those that address key underlying determinants of stunting using a rights-based, livelihoods programming approach. Some of these underlying determinants are poverty and food insecurity, economic and gender inequality, poor sanitation and vulnerability to natural disasters. As shown by Smith et al. (2013), SHOUHARDO I was exceptionally successful in applying this approach to reducing child undernutrition. While the overall goal of SHOUHARDO II was to reduce households’ vulnerability to food insecurity, a key project outcome indicator was the prevalence of stunting—or chronic, long-term undernutrition—among preschool children. In addition to child mortality, stunting is associated with poor school and work performance and an increased likelihood of overweight, chronic disease and mental health issues among adults. Such personally damaging effects for young children and their families, along with its intergenerational transmission, have severe consequences for entire communities and countries, dampening their wider development (Smith and Haddad 2015)—and certainly compromising long-term food security.
As documented in this report, the prevalence of stunting among children under five dropped from 61.7 at the time of the project’s inception to 48.8 four years later, a total reduction of 12.9 percentage points. This reduction of 3.2 percentage points per year is impressive when compared to the annual decline for rural Bangladeshi households as a group, which was 0.6 of a percentage point between 2007 and 2013.1 The reduction for children under two was equally impressive.
The current momentum within developing countries and internationally to address the problem of child undernutrition has never been higher. The rise of the Scaling Up Nutrition (SUN) movement starting in 2010, and the publication of the Lancet Maternal and Child Nutrition Series in 2008 have both served to raise awareness of its extent and consequences. The development community is increasingly recognizing that slower-than-expected progress towards reaching the Millennium Development Goals (MDGs) by 2015—including those for poverty, secondary education, child mortality and maternal health—is due, in large part, to lack of investment in children’s nutrition (World Bank 2013). Nutrition has consequently been greatly elevated on the development agenda, and global commitment to reducing undernutrition is stronger than ever (Gillespie and Haddad et. al. 2013). In turn, answers to the question of how to accelerate reductions in undernutrition in the coming decades are in great demand.
To address this increased demand, a wide evidence base is building regarding the roles of nutrition-specific interventions, such as micronutrient supplementation and nutrition education, as well as those promoting more fundamental, underlying and basic determinants of nutritional status such as safe water access, sanitation, women’s education and empowerment, food security, national income growth and governance (Bhutta et al. 2013; Ruel et. al. 2013; Haddad 2012; Ruel and Alderman 2013; Smith and
1 See Section 6 below.

9
Haddad 2015). The experience of the SHOUHARDO II project in reducing child stunting in Bangladesh—a country with one of the highest prevalences in the world, at 41 percent of all children under five (Niport et. al. 2013)—provides a unique opportunity to gain insight into how integrated, participatory development projects implemented at the local level can contribute to accelerating reductions in child undernutrition. The objective of this impact evaluation is to determine whether the observed reductions in stunting that took place over the SHOUHARDO II project’s implementation period were caused specifically by the project’s interventions. It further aims to understand how the reductions were brought about by examining whether the project had an impact on a set of determinants of stunting—including household food security, caring practices for mothers and children, household health environments, mother’s nutritional status, and children’s health. The reason the study includes analysis of the determinants of stunting in addition to stunting itself is because they give insight into the pathways through which stunting was influenced by the project and, being necessary conditions for children’s nutritional health, alternative evidence regarding the impact of the project on stunting. The evaluation looks at the impacts of the following subsets of the project’s interventions that were implemented at the household level: 1) maternal and child health and nutrition; 2) women’s empowerment; 3) livelihoods promotion; and 4) water and sanitation.
The evaluation employs a variety of methods, including temporal comparisons of changes in indicators among project households compared to Bangladeshi households nation-wide, difference-in-difference analysis, Instrumental Variables (IV) testing and regression, and Propensity Score Matching (PSM). The results from these analyses are triangulated to draw conclusions regarding the project’s overall impact and how it was brought about. The data employed are from cross-sectional, population-based surveys of project villages conducted near the project’s inception (December 2010) and near its end (December 2014). The next section of the report describes the beneficiary selection process and project interventions. Section 3 lays out the conceptual framework and outcome indicators employed as dependent variables. Section 4 describes the data collection process and Section 5 the impact evaluation methods used. Sections 6, 7 and 8 present the main empirical results. Finally, Section 9 provides a summary of the results and conclusions.
2. The SHOUHARDO II project: Beneficiary selection process and
interventions The SHOUHARDO II project was implemented within the context of CARE Bangladesh’s long-term program goals, which are to eradicate poverty and promote social justice through improving social equity, livelihood security and governance in the areas in which it works. The project partnered with a variety of institutions including 16 local NGOs who are responsible for 90 percent of overall implementation coverage, and technical partners such as the International Union for the Conservation of Nature, WorldFish, the International Rice Research Institute. It was implemented with the active participation of 13 ministries within the Government of Bangladesh. The project was funded at US$130,000,000, including 287,420 MT worth of commodities for both direct distribution and monetization. This section first describes the project’s beneficiary selection process and interventions

10
in detail. It then provides data on the percent of households in project villages participating in each intervention.
2.1 Beneficiary selection process
2.1.1 Identification of project geographical areas National databases were used to identify the remote areas most vulnerable to shocks and food insecurity within Bangladesh. The following criteria for area selection were used:
Degree of food insecurity and child undernutrition
Susceptibility of the area to natural disasters and shocks
Remoteness, illiteracy and poverty rates
Avoiding duplication and overlap with other projects
Figure 1 locates the resulting four SHOUHARDO II project areas—Coast, Haor, Mid Char and North Char—within Bangladesh. The northcentral Chars are riverine islands surrounded by water most of the year. They are prone to dramatic erosion and floods, which results in crop loss, isolation, and poor access to markets and services. Also highly flood-prone and with similar food insecurity issues to the Chars is the northeastern Haor area, characterized by vast expanses of depressed wetlands with scattered, elevated mounds that become largely inhabitable islands during the wet season. The delta-like Coast region is in the deep southeast of the country where food security is threatened by regular storm surges and slow-onset disasters such as water-logging and land salinization, and the impacts of climate change. Within these four regions, 11 of the most marginalized and poor districts were chosen, followed by 30 Upazilas and 171 unions within them. Project villages were selected through Focus Group Discussions with local and national government representatives and NGOs.
2.1.2 Household selection Household beneficiary selection was guided by both socio-economic targeting and
randomization required by a research project incorporated into the project’s design. Socio-economic targeting: selection of PEP households
Following the SHOUHARDO I project’s approach, household targeting within each village began with the use of Participatory Rural Appraisal tools to identify the poorest households. The tools included social and resource mapping and a “well-being analysis”. Community members representing the broad range of interest groups and classes grouped households into five economic categories: extreme poor, poor, lower middle, middle, and rich. The classification criteria used included land ownership, housing condition, income level, income sources, occupation and food insecurity. Following, the “Poor and Extreme Poor” (PEP) households were selected as the project’s key targeted beneficiaries.

11
Figure 1: Map of SHOUHARDO II program area

12
Targeting associated with the RCT of the PM2A programming approach Embedded within the SHOUHARDO II project design was a Randomized Controlled Trial (RCT) implemented in order to evaluate the relative effectiveness of two approaches to targeting Maternal and Child Health and Nutrition interventions. These are: the Maternal and Child Health and Nutrition/PEP (MCHN/PEP) approach, established with SHOUHARDO I, and the Preventing Malnutrition in Children Under Two (PM2A) approach (FANTA-2, 2010). As summarized in Table 1, the MCHN/PEP approach includes only PEP households as participants in MCHN activities, including educational activities, child growth monitoring and food ration receipts (described below). By contrast, the PM2A approach includes as participants all eligible2 women and children in project villages regardless of socio-economic status. Table 1:Design of the randomized controlled trial to evaluate the relative effectiveness of the MCHN/PEP versus the PM2A approach
RCT intervention arm 1:
MCHN/PEP RCT intervention arm 2:
PM2A
PEP Eligible to participate in MCHN and all other project interventions
Eligible to participate in MCHN and all other project interventions
Non- PEP
Not eligible to participate in any project interventions.
Eligible to participate in MCHN interventions only
SHOUHARDO II project villages were randomly selected (using a computer program) into the MCHN/PEP and PM2A intervention arms, with roughly 17 percent of villages chosen to follow the PM2A approach in order to facilitate the RCT research design (see map in Figure 1). The addition of the RCT to the project design means that some non-PEP households are included as project beneficiaries.
2.2 Project interventions
This section focusses on the SHOUHARDO II project’s interventions that were implemented at the household level. Many project interventions were implemented at the community level and thus could not be directly evaluated using the household level data employed for this study. These include empowerment of the poor through the establishment of Village Development Committees, efforts to increase the accountability of local elected bodies and government service providers to the PEP, and the project’s disaster preparation, response and mitigation and climate change adaptation activities.
Maternal and child health and nutrition (MCHN) The SHOUHARDO II package of MCHN interventions was expected to most directly address the problem of chronic undernutrition in the project area. In line with global best practices of targeting the first 1,000 days of life, including the time in-utero and ending with the child’s second birthday, to achieve sustained impact on nutritional status, the package prioritizes children under age 2 and pregnant and
2 The eligibility criteria are based on children’s ages and the pregnancy status of women (see Section 2.2.).
13
lactating women. During this time the child has increased nutritional needs to support rapid growth and development, is more susceptible to infections, and is completely dependent on others for nutrition, care and social interactions. Growth faltering typically begins during pregnancy and continues to about 24 months of age. The loss in linear growth is not recovered, and catch-up growth later on in childhood is minimal (UNICEF 2013). A key component of the MCHN package was promotion of health and nutrition behavior change through nutrition education in two forms. The first was monthly “courtyard sessions” led by trained community health volunteers (CHVs)3 with topics including optimal breastfeeding, complementary feeding and weaning practices, care for mothers during pregnancy and delivery, and hygiene practices. The second was cooking and feeding demonstration sessions. A third component of the package was monthly Growth Monitoring and Promotion sessions in which children’s height and weight was monitored. Children whose growth was faltering received follow-up care from CHVs. A fourth MCHN intervention was the provision of monthly food rations to pregnant women, women with children under two, and children under two living in eligible households. The ration was provided both to fill gaps in nutritional intake and to provide an incentive to participate in behavior change activities. It contained wheat, vegetable oil and yellow split peas. Integrated into these MCHN interventions were efforts to establish linkages with preventive and curative health and nutrition services, build capacity for community-based integrated management of childhood illnesses, and facilitate linkages of mothers with the Ministry of Health and Family Welfare program to provide micro-nutrient supplementation for pregnant and lactating mothers. Women’s empowerment
Although there have been gains in women’s empowerment in Bangladesh in recent years, discrimination against women remains strong and pervasive in Bangladesh (Nosback, Champion and Mutahara 2014). At the start of the SHOUHARDO II project, very few women could make basic economic decisions on their own, their freedom of movement was restricted, only five percent earned cash income, and over a quarter had experienced some form of domestic violence in the previous year (Caldwell, Ravesloot and Smith 2011). CARE’s commitment to women’s empowerment as a means of addressing underlying causes of child undernutrition is a distinguishing feature of the SHOUHARDO II design. The central intervention designed to do so was Empowerment, Knowledge and Transformative Action (EKATA) groups for promoting life-skills education, empowerment and social change. Made up of 20 women and 15 adolescent girls recruited from among interested community members, and facilitated bi-weekly by a paid volunteer, the groups provided a platform for empowering women and adolescent girls through education, solidarity, group planning, and rights advocacy. The EKATA intervention had a broad range of goals: increasing women’s decision making power at household and community levels, reducing gender-based violence, raising awareness of educational entitlements for women and girls, building women’s leadership, advocacy, and literacy skills, and consciousness-building around women’s’ rights in
3 The CHVs were married women with children who were at least 20 years old with secondary education, previous experience in
health related work and socially accepted by their community. They received a four-day training program as well as counseling and facilitation skills. For continued education and support, they gathered for a one-day meeting once per quarter and received technical support from CARE and partner NGO technical staff.
14
existing legislation and important social issues, including dowry, early marriage, divorce, and violence against women. More directly focused on promoting the economic empowerment of women was the establishment of self-help savings groups. While men could be members of these groups, they were directed at women, and the majority of members were women. The groups provided a means for women to save for investment purposes, pool their incomes in times of need, and avoid taking loans from money lenders. Note that another project intervention directed at women’s empowerment in the long run was the establishment of Early Child Care for Development (ECCD) centers, preschools that introduce a learning process, flow of information, and preparation for entering formal schooling that has been traditionally denied to girls. An equal number of girls and boys are enrolled. In addition, parenting sessions are held for mothers and fathers with the aim of improving parenting skills, especially related to girls’ enrollment in school. ECCD is not evaluated in this study as it is not expected to directly empower the current generation of women. Livelihoods promotion: Core Occupational Groups This set of interventions was designed to directly address food insecurity and poverty in the project area by increasing food production and incomes. Project beneficiary households were divided into four distinct Core Occupational Groups (COGs) based on asset holdings (availability of land, access to water bodies, and labor availability) for the receipt of packages of input support and training. The sets of interventions are: (1) Crop production Provision of seeds/seedlings, organic fertilizer and training in irrigation, field preparation and crop management to support the production of key field crops (e.g., rice, wheat and maize). (2) Fisheries
Provision of fingerlings, lime, fish meal and fertilizer for fish culture, in addition to fish nets, boats, and aluminum patil/pots for fish capture.
(3) Comprehensive homestead development (CHD) Provision of saplings, seeds, organic fertilizer for homestead gardens and animals (chickens, ducks and goats) and fencing for animal rearing (4) Income generating activities (IGA)
Entrepreneur development and business management training; skill training based on selected trade.
Water and sanitation
Diarrheal disease is a key cause of child undernutrition in Bangladesh, with lack of access to safe water and sanitary latrines being its main structural cause (United Nations Integrated Regional Information Network (IRIN), 2010). At the start of the project, while 61 percent of households had access to safe water, only 26 percent had access to a sanitary latrine. This problem was addressed by assisting households in obtaining safe, arsenic-free drinking water through the installation of tube wells and arsenic testing, as well as access to sanitary latrines.

15
2.3 Participation in project interventions Table 2 presents data on the percent of households in project villages with children under five that participated in each intervention by region.
Table 2: Participation in SHOUHARDO II project interventions, by region
Coast Haor
Mid Char
North Char
All
(Percent of households)
Mother and Child Health and Nutrition (MCHN) Courtyard sessions 63.9 66.7 64.3 67.2 66.3
Cooking/feeding sessions 53.2 56.7 63.0 67.5 61.1
Child growth monitoring 54.9 63.6 60.7 66.6 63.6
Food ration 62.0 61.9 57.3 55.2 58.9 All MCHN interventions (Full participation) 41.0 43.9 45.1 45.8 44.6
Any MCHN intervention 70.4 72.9 72.2 77.3 74.1
Women's empowerment Mother is EKATA group member 4.9 2.8 8.2 9.6 6.1
Mother is savings group member 10.8 10.3 8.7 9.5 9.8
Any empowerment intervention 14.3 11.8 14.0 15.6 13.6
Livelihoods promotion Crop production 11.3 12.1 16.1 10.2 12.1
Comprehensive Homestead Development (CHD) 29.5 28.6 17.5 20.8 24.2
Fisheries 6.4 6.5 2.1 5.6 5.5
Income generating activities (IGA) 20.9 23.7 28.0 26.9 25.3
Any livelihoods promotion intervention 66.2 67.4 58.2 58.5 62.9
Water and sanitation Any water and sanitation intervention 24.6 26.0 6.4 13.0 18.4
Any SHOUHARDO II intervention 77.8 78.9 80.2 81.0 79.8
Three-quarters of all households participated in at least one MCHN intervention over the life of the project, with roughly equal participation in the educational, growth monitoring, and food ration interventions. Near 45 percent of households participated in all four MCHN interventions, hereafter termed “full participation” in MCHN. The next most commonly participated in intervention is livelihoods promotion, with a prevalence of 63 percent. Roughly a quarter of households participated in CHD and IGA, the most popular of the livelihoods promotion interventions. Twelve percent participated in crop production and only five percent in fisheries. Participation of mothers living in households with children under five in EKATA was quite low, at six percent, perhaps due to the child care time constraints felt by these mothers. Participation in savings groups was somewhat higher, at 10 percent, giving a total overall participation prevalence in the two women’s empowerment interventions considered here of 14 percent. Finally, 20 percent of households participated in the project’s water and sanitation interventions.
16
Overall, 80 percent of households living SHOUHARDO II project villages participated in the project’s interventions in some form. Overall participation prevalences vary little across the four regions, although there are some substantial regional differences for membership in EKATA groups (higher in Mid and North Char) and participation in water and sanitation interventions (higher in Coast and Haor).
3. Conceptual framework and measurement of stunting and its
determinants
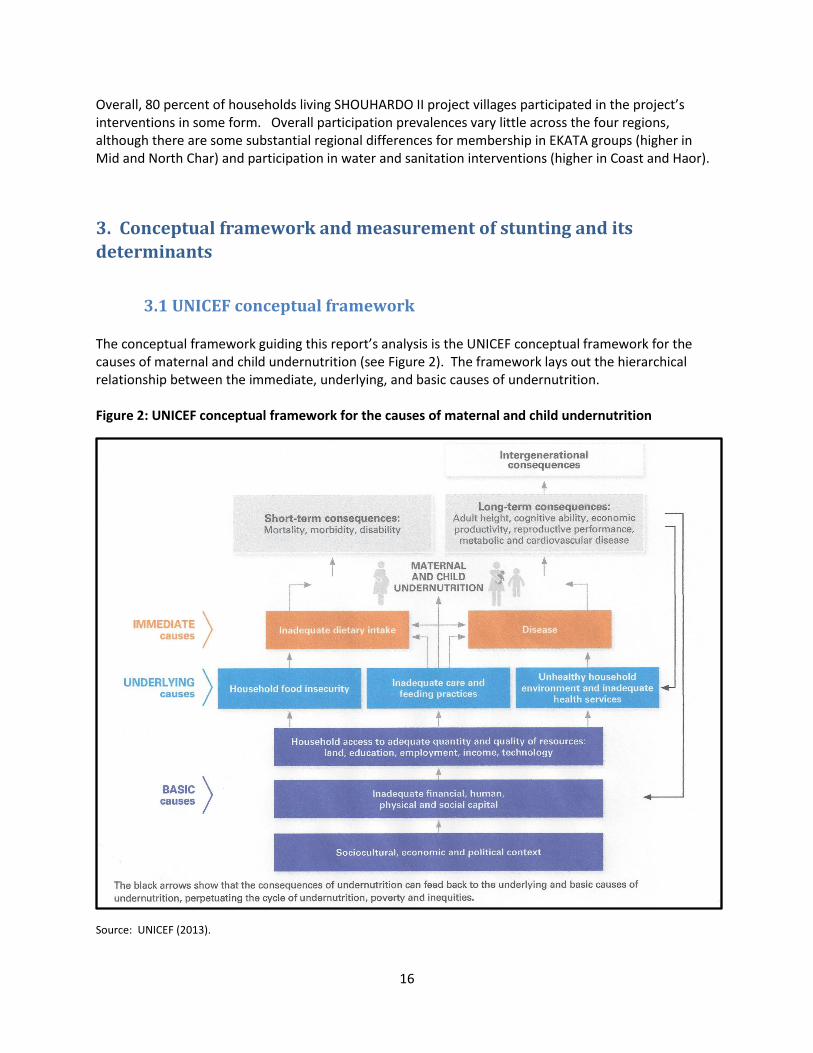
3.1 UNICEF conceptual framework The conceptual framework guiding this report’s analysis is the UNICEF conceptual framework for the causes of maternal and child undernutrition (see Figure 2). The framework lays out the hierarchical relationship between the immediate, underlying, and basic causes of undernutrition. Figure 2: UNICEF conceptual framework for the causes of maternal and child undernutrition
Source: UNICEF (2013).

17
The immediate causes, which manifest themselves at the level of the individual child, are inadequate dietary intake (energy, protein, fat, and micronutrients) and disease. These factors themselves are interdependent. A child with inadequate dietary intake is more susceptible to disease; disease in turn depresses appetite, inhibits the absorption of nutrients in food, and competes for a child’s energy. The underlying causes, which impact child nutritional status through the immediate causes, manifest themselves at the household level. The first is household food insecurity, or the inability of a household to access enough food of adequate quality for all of its members to live an active, healthy life. The second is inadequate quality of caring practices for children and their mothers. Examples of caring practices for children are child feeding, health-seeking behaviors, and cognitive stimulation. The most obvious aspect of care for women that affects children’s nutritional wellbeing is care and support during pregnancy and lactation. Women are typically the main caretakers of children after birth, and in order to provide quality care they need continued adequate food consumption and health care, rest and measures to protect their mental health, such as protection from abuse. The third underlying cause is an unhealthy household environment and inadequate health services, which condition children’s exposure to pathogens and the use of preventative and curative health care. Elements of a health environment include access to safe water, to sanitary facilities for disposing of human waste and to health services. Physiologically, a mother’s nutritional status is closely tied that that of her child. Adequate maternal nutrition and health are crucial to prevent child undernutrition. Pregnancy increases nutrient needs and is a time when illness and environmental and psychosocial stress can contribute to undernutrition of an unborn child through impaired fetal development and low birthweight. Undernourished girls have a greater likelihood of becoming undernourished mothers, who then have a greater likelihood of giving birth to a low birthweight baby, leading to an intergenerational cycle of undernutrition. The issue of maternal undernutrition is particularly important to take into account in Bangladesh, which has both a high prevalence of maternal undernutrition (24 in 2011) and low birthweight (22 in 2006) (UNICEF 2013). Finally, the basic causes, which in turn impact nutritional status through the underlying causes, manifest themselves at broader geographical levels, such as national, regional or global. They form the economic, political, environmental, social and cultural context in which children’s nutritional status is determined. While the SHOUHARDO II project addresses some of the basic causes of child undernutrition, such as poverty and the disempowerment of women, this impact assessment focusses only on the underlying and immediate causes (in addition to stunting itself).
3.2 Measures of stunting and its determinants
In this section the measures of stunting and its determinants employed as dependent variables in this study are described. As noted in the introduction, one of the reasons the study includes analysis of the determinants of stunting in addition to stunting itself is because it helps understand the pathways through which stunting may have been influenced by the project. A second reason is that improvements in the determinants are necessary for bringing about improvements in children’s nutritional health. Evidence that the project brought about such improvements thus give alternative

18
evidence regarding the impact of the project on stunting. In the case of the evaluation of SHOUHARDO II, the need for such alternative evidence is heightened: as discussed below (Section 4.2), the selection of households into the project’s MCHN interventions was partially based on whether or not the household had a child under five who was undernourished. Statistically, this makes it more difficult to draw out the impact of the project on stunting itself.
3.2.1 Stunting
Stunting is a result of inadequate growth of the fetus and child and results in a failure to achieve expected height compared to a healthy, well-nourished child of the same age. It is a cumulative indicator of growth failure and a marker of chronic insufficient protein and energy intake, frequent infection, sustained inappropriate feeding practices, and impaired brain development (Black et al 2013; UNICEF 2013). The rationale for employing stunting as an indicator of undernutrition for this impact evaluation is four-fold. First, it is a key SHOUHARDO II project outcome indicator against which progress towards project goals was assessed. Second, replacing underweight, it has become the consensus measure among the international community to mark the damage that is done from the interaction of poor diet and repeated infections (Black et. al. 2013; UNICEF 2013). Third, it is a measure of long-term, chronic undernutrition rather than undernutrition as a result of short-term fluctuations in dietary intake and/or health. It is thus particularly well suited to the evaluation of this project, which took place over more than four years. Fourth, stunting was more prevalent than either wasting (measuring acute undernutrition) or underweight (a composite measure of both chronic and acute undernutrition) at the start of the project and thus represented a more widespread problem. The specific indicator employed as a dependent variable for this analysis is children’s height-for- age z-score (HAZ) measured using data collected on height or length and months of age. A child is considered stunted if her or his HAZ is less than -2 standard deviations below the median of a global reference population of children who are well nourished and received key recommended caring practices. The current reference is the World Health Organization 2006 Child Growth Standards (de Onis et al. 2004).
3.2.2 Determinants of stunting
The selection of the determinants of stunting included in this analysis is guided by the conceptual framework presented above. It is also influenced by the project outcome and impact indicators included in its Indicator Performance Tracking Table (see TANGO 2015) as well as the statistical methods employed and data availabilities. The determinants include indicators of all three underlying causes of child undernutrition (food insecurity, inadequate caring practices, and an unhealthy household environment) and both immediate causes (inadequate dietary intake and disease). The variables are listed in Box 1 and described in detail in Appendix 1.

19
4. Data The data from two cross-sectional, population-based surveys of all households in SHOUHARDO II villages, whether eligible to participate in project interventions or not, are employed for this impact evaluation. The first is the project baseline survey, conducted between December 8, 2010 and January 2, 2011. The second is the project endline survey, conducted between November 17 and December 12, 2014. To ensure comparability, the data collection methodology was identical for the two surveys. The survey questionnaires, which can be found in Caldwell, Ravesloot and Smith (2011) and TANGO, International (2015), were designed by TANGO, International in collaboration with CARE Bangladesh and Food and Nutrition Technical Assistance-II. The data collection was conducted by Mitra and Associates and TANGO, International. A two-stage, stratified sampling design was employed, with two levels of stratification. The first was a division of the SHOUHARDO II operational area into its four geographical regions – Coast, Haor, Mid
Box 1. Determinants of stunting employed as dependent variables
Household food security
Number of months of adequate household food provisioning
Household dietary diversity score
Household hunger score Caring practices for mothers during pregnancy
Antenatal care during pregnancy
Antenatal care in a medical facility during pregnancy
More food during pregnancy
More rest during pregnancy
Vitamin A six weeks from delivery
Iron/folic acid during pregnancy Caring practices for children
Mother’s knowledge of hand washing at five critical times
Safe disposal of feces of children 0-35 months
Number of vaccinations received (0-23m)
Vitamin A capsule in the last six months (6-23m)
Monomix multivitamin supplement (6-23m) Household health environment
Access to safe water
Access to sanitation Mother’s and children’s food consumption
Mother’s dietary diversity
Child minimum dietary diversity (6-23m)
Child minimum meal frequency (6-23m)
Child minimum acceptable diet (6-23m) Children’s health
Child diarrhea (0-59m) Mother’s nutritional status
Mother’s Body Mass Index
Note: Variable definitions are given in Appendix 1.

20
Char, and North Char – reflecting the distinct geographic areas where the project was implemented. The second level of stratification was into the two intervention arms defining the RCT embedded into the project’s design: MCHN/PEP and PM2A, as described above. An equal number of villages and households were sampled in the resulting eight strata. Following stratification, sampling took place in two stages. In the first, 25 villages were randomly chosen within each stratum using probability proportionate to size (PPS) sampling. In the second, 45 households were randomly selected in each village, for a total of 9,000 households. Sample size calculations were based on ensuring the ability to detect a 10 percentage-point change in stunting prevalence between the project’s baseline and endline surveys from a projected initial prevalence of 50%. Assumptions of a 95 percent confidence level, 80 percent power, and a design effect of 2.0 yielded a minimum sample size of 666 households per stratum. To keep the sample size reasonable, a single sample of households was selected to collect both socio-economic data (from all households) and health and nutrition data (needed only from households with children under five). To do so, the sample size factored in the proportion of the population in Bangladesh that is aged 6-59 months and the average household size. Applying the required sample size above to these factors plus adding in a 10 percent cushion to account for non-response yielded a final sample size of 1,119 households per strata, or a total of 8,952 households. The sampling of 45 households within 200 villages met this sample size requirement.
Only the data collected from households with children under five with valid anthropometric data were employed for this study. In these households, an index child was randomly chosen for collection of data on children’s and mother’s health and nutrition.4 After cleaning of the anthropometric data, the analytic sample size for the study is 2,471 children under five (6-59 months) and 871 children under two (6-23 months). For household-level variables, such as the food security indicators, data are employed for households with children under six months as well, increasing the sample size to 2,844.
5. Impact evaluation methodologies
An impact evaluation is a study conducted in order to determine the extent to which changes in outcomes can be attributed to a project or intervention. Evaluating such attribution requires comparing what happened to the outcome with an intervention (the factual) to what would have happened to the outcome without it, the latter referred as the “counterfactual”. The counterfactual is never known with certainty because the exact same participants in an intervention cannot not participate in it at the same time. Given this issue, two necessary conditions for an impact evaluation to be conducted in a rigorous manner are that (1) a non-participant control group be available so that a counterfactual can be identified; and (2) that the problem of selection bias be addressed (Waddington et. al. 2012). This latter
4 For the baseline survey child anthropometric data were collected only for one index child in each household having a child
under five. For the endline, following Food-for-Peace guidance, anthropometric data were collected for all children under five in each household, with data for other child-level variables being collected only for an index child. In this report’s analysis of the endline data, only that for the selected index child is employed for two reasons. First, doing so allows valid comparisons of stunting prevalences over time (endline households with multiple children and thus greater child care burdens have greater representation than they do in the baseline). Second, for the impact analysis methods involving regression, it is not possible to properly control for intra-household correlations statistically when only some households are represented more than once.

21
problem arises because, in most cases, either purposeful targeting of project interventions to specific populations (e.g., the most poor) and/or self-selection of participants into interventions takes place. This renders the control group and the participant group fundamentally different from one another prior to the commencement of project activities (Waddington et. al. 2012; Khandker, Koolwal & Samad, 2010). The SHOUHARDO II surveys are population based. Ample data for households that did not participate in the project’s interventions at all or only in its MCHN activities— whether due to the PM2A RCT allocation mechanism or by choice—are available, thus providing a pool of potential control group households. Further, as outlined below, the endline survey was extended to allow collection of data necessary for addressing the problem of selection bias, that is, data on factors affecting households’ participation in various interventions. A special effort was made to collect data on factors that are typically “unobservable”, the exclusion of which can lead to bias in estimates of the impacts of interventions. As described here, the data allow use of a variety of impact evaluation methodologies, including descriptive and regression-based methods, to determine whether and how the SHOUHARDO II project led to the 12.9 percentage-point reduction in the prevalence of stunting among children under five observed since the project’s inception.
5.1 Descriptive methods
The first descriptive method is a comparison of the change in stunting in the project area with the change nationally over the same time period. This analysis is important for ruling out the possibility that the change in stunting in the project area was due to forces external to the project. Specifically, we examine the change in stunting among children under five living in eligible project households between the baseline and endline surveys compared to the change that took place for this age group in rural areas countrywide in recent years. The data used are from three nationally-representative Demographic and Health Surveys (DHS), those undertaken in 2004, 2007 and 2011 (NIPORT et al. 2005, 2009 and 2013) and a survey conducted in 2013 administered using the same methods as those of the DHS (Shahin et al. 2014).5 Note that the project’s population of 370,000 people is very small relative to that of Bangladesh as a whole (roughly 160 million), such that changes in the project area had negligible influence on the stunting prevalence country wide.
The second method is a comparison of the actual age trajectory of the stunting among a specific age cohort of children living in eligible project households compared to the projected age trajectory of that cohort at the time of the baseline, that is, before the project’s activities commenced. The cohort is children who were 6-18 months old at baseline (in December 2010) and 48-60 months at endline (December 2014). Stunting typically shows a large increase over these age groups. Depending on whether their household actually participated in them, this cohort of children was exposed to the project’s MCHN interventions for an average of 12 months and to the rest of its interventions for an
5 This survey was conducted by the National Institute of Population Research and Training (NIPORT), the same organization that
conducts Bangladesh’s Demographic and Health Surveys. The sampling scheme was similar to that of the DHS to ensure comparability of data across the surveys.

22
average of three and a half years. We explore whether the change for these children shows an altered pattern from that projected at baseline. The third method is a comparison of the changes in stunting and its determinants between the baseline and endline surveys for the group of households who were eligible to participate and the group who were not eligible to participate. This intent-to-treat (effect of treatment as assigned), difference-in-difference analysis allows determination of whether the eligible households did better than non-eligible households while taking into account any initial differences between the groups at baseline. By doing so it controls for any changes that took place in the project area that are not related to project interventions or that are only indirectly related to them through spillover effects. Spillover effects occur when an intervention has an impact on households that do not participate in it. Examples of how this could have occurred in the SHOUHARDO II project were MCHN behavior change messages and technical skills gained through COG groups being disseminated to non-participants by participants.
5.2 Instrumental variables regression analysis
Instrumental variables analysis is a regression technique that allows us to rigorously estimate the impact of participation in the SHOUHARDO II project using the endline survey data by correcting for systematic differences between the households that actually participated in it and those that did not. It does so by controlling for selection bias due to both observable factors affecting participation and outcomes and unobservables. Examples of such unobservable factors that are typically not measured are ability, entrepreneurship, attitudes towards risk, weather shocks, social capital, and pre-project outcome levels (Habicht et al. 2009; Gilligan and Hoddinott 2007; Linnemayr and Alderman 2011). By controlling for these factors we are ensuring that in our estimations only the causal effect is being identified, and that only the causal portion of the observed relationship is represented by regression coefficient estimates.
Of particular importance in the case of SHOUHARDO II is to control for the fact that the project’s MCHN interventions were purposefully targeted towards households whose children were identified to be undernourished. These children’s mothers were given greater priority by CHVs during the implementation of MCHN activities and special encouragement to participate in courtyard sessions, cooking/feeding sessions, and growth monitoring of their child (Wadud 2015). Given that food rations were used as an incentive to participate in the other interventions, these children’s mothers were also probably more likely to receive a food ration than mothers whose children were not undernourished. The IV method corrects for this type of reverse causality, where the treatment variable itself is influenced by the outcome.
The basic regression model used to evaluate the impact of the SHOUHARDO II project on children’s long-term nutritional status and other dependent variables is:
,
where Ti is a dummy variable equal to 1 if the household participated in the project, γ is the treatment effect, and the Xi are child, mother and household characteristics believed to influence outcomes. The term εi is the unobserved error term. If the decision to participate, T, is correlated with the error term, Ordinary Least Squares (OLS) regression will yield biased estimates of project impact. Two-stage least squares (2SLS) is used to correct for this bias. In the first stage, a set of instruments, Z, along with the

23
child, mother and household characteristics, X, are used to predict the treatment status of each household:
In the second stage, the predicted value of T is used to estimate project impact:
The term γ measures project impact. The child, mother and household characteristics used as independent variables in the IV regression analysis (the Xi) are listed in Box 2. These variables are the typical observables found in reduced-form analyses of child undernutrition (e.g., Smith et al. 2003).
Box 2. Child, mother and household characteristics used as independent variables
for Instrumental Variables/OLS regressions
Child characteristics
Age in months, age-squared
Whether child is a girl Mother characteristics
Mother’s age
Mother’s education level a/ None Primary Secondary
Household characteristics
Age of household head
Whether household is headed by a female
Education of household head a/ None Primary Secondary
Occupation of household head: Farming
Agricultural laborer
Non-agricultural laborer Salaried employment Self employment Unpaid household work Other
Household size
Household age-sex composition Percent females 0-16, 16-30, and 30+ Percent males 0-16, 16-30, and 30+
Well-being category at baseline Extreme poor Poor Middle Middle-rich Rich
Region of residence Coast Haor Mid Char North Char
a/ For models with a child or mother-level dependent variable, mother’s education is employed. For models with
household-level dependent variables, the education of the household head is employed.

24
With respect to the instrumental variables employed (the Zi), a valid instrument must satisfy two conditions. First, the “relevance” condition specifies that the instrument must be sufficiently correlated with participation in the intervention. Second, the “overidentification” condition specifies that the instrument must only be correlated with the outcome of interest through T. That is, it must only affect the outcome through its effect on participation in the project and not through any other means (Bazzi and Clemens 2013; Baum, Schaffer and Stillman 2007).
The random allocation of villages into PM2A and MCHN/PEP groups discussed in Section 2.1.2 is an exogenous allocation mechanism underlying the planned treatment status of households that satisfies both conditions. As will be seen, planned treatment status has a strong correlation with actual participation and, for most of the dependent variables of this study, has no influence on outcomes except through influencing participation. Linnemayr and Alderman (2011) successfully used such planned treatment status as an instrument for actual treatment status in the case of an impact evaluation where significant deviation from the (randomized) planned treatment status occurred (see also Ten Have et al. 2008). As shown in Table 3, deviation from planned treatment status also occurred in the case of SHOUHARDO II. A substantial proportion of non-eligible households in MCHN/PEP villages participated in project interventions (35 percent of these households), and non-eligible households in PM2A villages participated in women’s empowerment, livelihoods promotion and water and sanitation interventions.
Table 3: Planned versus actual treatment status, by type of intervention (Percent of households participating in interventions)
RCT intervention arm 1:
MCHN/PEP RCT intervention arm 2:
PM2A
PEP Non-PEP PEP Non-PEP
Eligible Actual Eligible Actual Eligible Actual Eligible Actual
MCHN Any MCHN intervention 100 87.7
0 30.9
100 90.4
100 84.1
Received a food ration 100 75.1
0 6.5
100 79.1
100 73.8
Women's empowerment 100 17.5
0 2.5
100 19.4
0 7.9
Livelihoods promotion 100 86.3
0 7.8
100 85.4
0 6.2
Water and sanitation 100 21.6
0 6.8
100 25.3
0 19.4
Any SHOUHARDO II intervention 100 94.6 0 35.0 100 95.4 85.7
Note: Highlighted areas of table represent deviations from planned treatment.
In some cases the actual instrument employed here for IV testing and estimation is planned treatment status, while in others it is the PM2A status of the village of residence. These instruments are complemented by several others (specified in the IV results section below), as the use of multiple instruments is required for testing the overidentification condition.
While the main instruments employed are arguably correlated with participation and theoretically exogenous, statistical tests of the relevance and overidentification conditions are undertaken for formal verification. With regard to instrument relevance, a test of whether the instruments are strong enough to remove a substantial portion of the OLS bias if it exists is undertaken. The Kleibergen-Paap rk Wald first-stage F statistic is reported and compared to critical values developed by Stock and Yogo (2005) for weak-instruments hypothesis tests. The null hypothesis that the maximum bias in the coefficient

25
estimate for each potentially endogenous variable is greater than 5, 10 or 20 percent of the OLS bias is assessed. This test identifies cases of weak instruments, which can arise even when the correlations between the endogenous regressors and instruments are significant at conventional levels (5% and 1%). Next, Hansen’s J test for overidentification of all instruments, which is robust to heteroskedasticity and within-group correlation, is conducted. If the J-statistic p-value is <0.1, the instruments are considered to not be valid.
Given relevant and valid instruments, the test for endogeneity employed and implementation of 2SLS is undertaken using the STATA command xtivreg2 developed by Schaffer (2010). Where testing indicates that the treatment variable is not endogenous, OLS is used for estimation rather than 2SLS.
5.3 Propensity score matching
The IV analysis can only be undertaken for participation in the SHOUHARDO II project as a whole and not for its individual interventions.6 Yet knowledge of the impacts of individual interventions is needed to understand how the SHOUHARDO II project brought about a reduction in stunting if it in fact did. Was the reduction due solely to the MCHN “direct nutrition” interventions, including the monthly distributions of food aid, or did the interventions that addressed deeper causes and were likely to set in motion sustainable impacts contribute as well?
Using the endline survey data, this question is investigated using PSM to create comparable-on-observables control groups for each intervention from among households that did not participate in them to serve as the counterfactual. The impact of interventions is estimated using the difference in HAZ (and its determinants) between the control group and intervention group. To isolate the independent impact of each intervention, the fact that there may be differences in participation in the other project interventions across the participant and control groups is accounted for in the analysis. Note that for MCHN, the analysis relies on the “full participation” variable, defined as participation in all four MCHN interventions. Doing so allows construction of an adequately-sized control group. The matching process in PSM takes place using measured indicators of characteristics that are believed to influence participation in an intervention as well as those influencing the outcome of interest. If these observed characteristics are the only ones influencing participation, the estimates are deemed unbiased and the important “conditional independence” condition is met. However, if unobserved characteristics also influence participation, then the estimates will be biased (Khandker, et al., 2010). The challenge then, is to collect data on the entire universe of such characteristics so that none can be deemed unobserved. In addition to planned participation established at baseline (see Section 4.2), households’ participation in SHOUHARDO II interventions was influenced by two broad factors: (1) targeting conducted by project administrators; and (2) households’ and individuals’ own decisions on whether to participate. As part of the SHOUHARDO II endline survey, data were collected for many of the determinants of participation and outcomes typically employed in conventional PSM impact analyses. These are the same variables used in the IV analysis (listed in Box 1).
6 This is because the participation decision for individual interventions, as we will see in this report, was highly dependent on
participation in other interventions. It is not possible to address the endogeneity of multiple treatment variables simultaneously in the context of this research project.
26
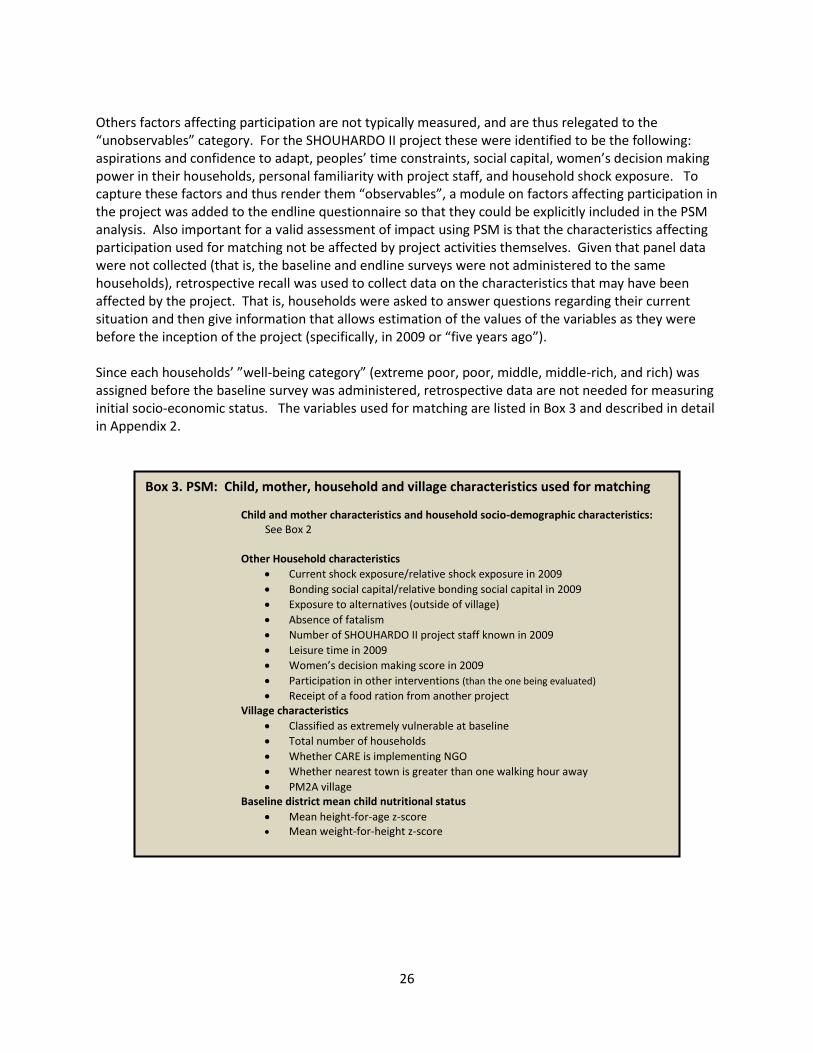
Others factors affecting participation are not typically measured, and are thus relegated to the “unobservables” category. For the SHOUHARDO II project these were identified to be the following: aspirations and confidence to adapt, peoples’ time constraints, social capital, women’s decision making power in their households, personal familiarity with project staff, and household shock exposure. To capture these factors and thus render them “observables”, a module on factors affecting participation in the project was added to the endline questionnaire so that they could be explicitly included in the PSM analysis. Also important for a valid assessment of impact using PSM is that the characteristics affecting participation used for matching not be affected by project activities themselves. Given that panel data were not collected (that is, the baseline and endline surveys were not administered to the same households), retrospective recall was used to collect data on the characteristics that may have been affected by the project. That is, households were asked to answer questions regarding their current situation and then give information that allows estimation of the values of the variables as they were before the inception of the project (specifically, in 2009 or “five years ago”). Since each households’ ”well-being category” (extreme poor, poor, middle, middle-rich, and rich) was assigned before the baseline survey was administered, retrospective data are not needed for measuring initial socio-economic status. The variables used for matching are listed in Box 3 and described in detail in Appendix 2.
Box 3. PSM: Child, mother, household and village characteristics used for matching
Child and mother characteristics and household socio-demographic characteristics: See Box 2
Other Household characteristics
Current shock exposure/relative shock exposure in 2009
Bonding social capital/relative bonding social capital in 2009
Exposure to alternatives (outside of village)
Absence of fatalism
Number of SHOUHARDO II project staff known in 2009
Leisure time in 2009
Women’s decision making score in 2009
Participation in other interventions (than the one being evaluated)
Receipt of a food ration from another project Village characteristics
Classified as extremely vulnerable at baseline
Total number of households
Whether CARE is implementing NGO
Whether nearest town is greater than one walking hour away
PM2A village Baseline district mean child nutritional status
Mean height-for-age z-score Mean weight-for-height z-score
27
For any intervention, PSM estimates of impact are generated in three steps. The first is to estimate a probit participation model using data on both participants and non-participants to compute a probability of participation, or “propensity score”, for each household conditional on the observed characteristics. In the second step, participant households are matched with non-participant households based on similarity of propensity scores. An important condition for the success of this step is “common support”. Participant households must be similar enough to non-participant households in the observed characteristics so that there are sufficient non-participant households close by in the propensity score distribution with which to make matches (Khandker, et al., 2010). Participant propensity scores that are higher than the maximum or lower than the minimum of the non-participant distribution are dropped. In the third step of PSM, the average value of the outcome variable of the matched participant and non-participant groups of households are compared to calculate an estimate of the impact of the intervention, or the “average treatment effect on the treated” (ATT).
Of the many techniques available, PSM is conducted here using kernel matching, for which each treated household is matched to a group of non-treated households with propensity scores within a certain radius.7 The control group outcome is computed as a weighted average, with a lower weight given the greater is the propensity score difference from the treated household. The analysis is conducted using PSMATCH2 in STATA along with PSTEST to test for matching effectiveness (Leuven & Sianesi, 2003). Matching effectiveness is evaluated by conducting t-tests for equality in the mean values of the characteristics on which matching is based across the participant and matched non-participant groups of households. An overall summary measure is given by the p-value from a likelihood ratio test for the joint insignificance of the characteristics after matching (that is, using the matched sample only). If the characteristics are no longer jointly significant (p>0.10), then matching has succeeded.
7 The radius depends on the bandwidth of the kernel. After finding that variations between 0.01 and 0.10 make little difference
to the ATT estimates, a bandwidth of 0.05 is used for all estimates.
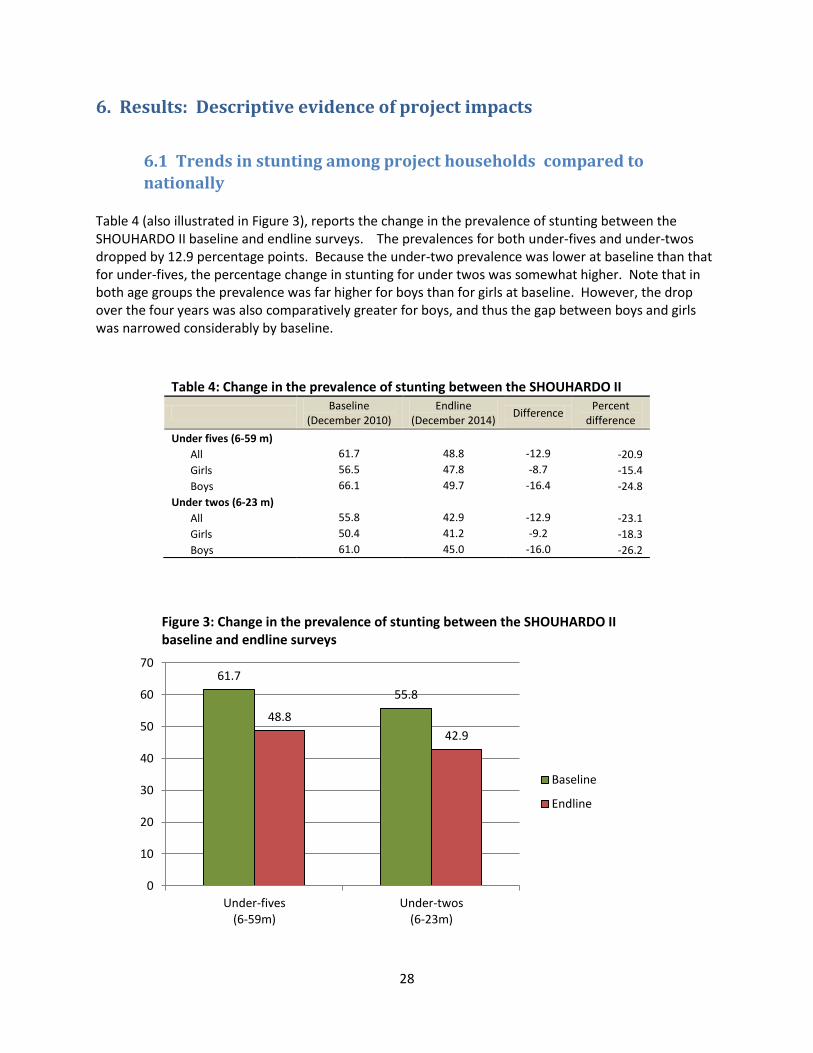
28
6. Results: Descriptive evidence of project impacts
6.1 Trends in stunting among project households compared to
nationally Table 4 (also illustrated in Figure 3), reports the change in the prevalence of stunting between the SHOUHARDO II baseline and endline surveys. The prevalences for both under-fives and under-twos dropped by 12.9 percentage points. Because the under-two prevalence was lower at baseline than that for under-fives, the percentage change in stunting for under twos was somewhat higher. Note that in both age groups the prevalence was far higher for boys than for girls at baseline. However, the drop over the four years was also comparatively greater for boys, and thus the gap between boys and girls was narrowed considerably by baseline.
Table 4: Change in the prevalence of stunting between the SHOUHARDO II
Baseline
(December 2010) Endline
(December 2014) Difference
Percent difference
Under fives (6-59 m) All 61.7 48.8 -12.9 -20.9
Girls 56.5 47.8 -8.7 -15.4
Boys 66.1 49.7 -16.4 -24.8
Under twos (6-23 m)
All 55.8 42.9 -12.9 -23.1
Girls 50.4 41.2 -9.2 -18.3
Boys 61.0 45.0 -16.0 -26.2
Figure 3: Change in the prevalence of stunting between the SHOUHARDO II baseline and endline surveys
61.7
55.8
48.8
42.9
0
10
20
30
40
50
60
70
Under-fives (6-59m)
Under-twos (6-23m)
Baseline
Endline

29
A comparison of the change in the prevalence of stunting for under-fives among SHOUHARDO II’s participant population with trends in rural Bangladesh is given in Figure 4. Although less than that of the SHOUHARDO I project,8 compared to the national trend, the SHOUHARDO II population saw a rapid reduction over the period. The average annual decline was 3.2 percentage points while the trend in rural Bangladesh whole was 0.6 percentage-points per year. This comparative evidence rules out the possibility that the decline in stunting seen among the SHOUHARDO II project population was brought about by positive forces emanating from wider favorable economic, climatic or policy-related trends in the country.
Figure 4: Change in stunting prevalence among children under five: SHOUHARDO I and II
Sources: SHOUHARDO I data: Smith et al. (2012). SHOUHARDO II data: TANGO, International (2015). National (rural) prevalences: NIPORT et al. (2005, 2009, 2013) and Shahin et al.(2014).
8 The total reduction for the SHOUHARDO I project was of 15.7 percentage points over 3.5 years, or 4.5 percentage points per
year.
56.1
40.4
61.7
52.7
48.8
44.3
45.0 42.7
41.3
30
35
40
45
50
55
60
65
2004 2005 2006 2007 2008 2009 2010 2011 2012 2013 2014 2015
SHOUHARDO I
SHOUHARDO II
National (rural)

30
6.2 Shift in the age trajectory of stunting among project households Following the typical pattern for children from poor households in developing countries, in
Bangladesh there is normally a steep increase in stunting as children age over the six month to 2 year-old range. This increase is associated with poor weaning practices and exposure to infectious disease. Continued high prevalences for older age groups are due to the initial growth failure at younger ages as well as poor household food access (Beaton et al. 1990). The SHOUHARDO II baseline data exhibit this pattern, as can be seen in Figure 5.
Figure 5: Age trajectory of stunting among 0-59 month olds in project area at baseline
Source: SHOUHARDO II baseline survey.
Table 5 shows the pattern for Bangladeshi children in 2011, giving stunting prevalences for the
age cohort of interest, the group of children who were 6-18 months old at the time of the baseline and 48-60 by the time of the endline. The prevalence was 30.5 among 6-18 month olds, rising to 41.9 for 48-60 month olds. By contrast, there was no increase in stunting prevalence among the children that had been exposed to SHOUHARDO II project interventions (the change was -0.6 percentage points). This finding is even more notable given that not all children in the 6-18 month group at baseline were exposed to the project’s MCHN interventions for the full 18 month eligibility period (6-24 months), simply because they were not in the eligible age range for that long. For example, the 18 month olds were only exposed to project interventions for six months.
10
20
30
40
50
60
70
1 4 7 10 13 16 19 22 25 28 31 34 37 40 43 46 49 52 55 58
Pe
rce
nt
stu
nte
d
Age (months)
6-18 month
olds
48-60 month
olds

31
Table 5: Age trajectory of stunting among 0-5 year olds: Comparison of SHOUHARDO II participant children with Bangladeshi children
Stunting among 6-18 month olds
Stunting among 48-60 month olds
Increase (percentage
points)
Bangladeshi children (2011) 30.5 41.9 11.4
Project participant children 49.3 48.7 -0.6
(baseline) (endline)
Source: Data for Bangladeshi children are from NIPORT et al. (2013).
We can deduce from this evidence that something happened to the children living in project
households that prevented many of them from becoming stunted as they aged, an indication that the project’s interventions plausibly led to a reduction in stunting.
6.3 Difference-in-difference analysis
As noted in Section 2.1, the SHOUHARDO II project was designed such that all households in project villages randomly assigned to the PM2A programming approach were eligible to participate in project interventions. By contrast, in MCHN/PEP villages, only the PEP were eligible to participate, leaving a group of non-eligible surveyed households that can serve as a control group for intent-to-treat comparison purposes. The group is non-PEP households in MCHN/PEP villages. As mentioned, this design was adhered to for the most part. We can thus compare the change over time between baseline and endline for the evaluation outcome indicators listed in Box 1 across the two groups while taking into account the baseline differences between them. Doing so allows us to gain some insight into whether the SHOUHARDO II project’s interventions themselves led to any changes in the outcomes. This difference-in-difference analysis is presented in Table 6. Statistically significant differences between the baseline and endline at the 5% or lower level are indicated with a star (*). Note first that, as would be expected given its higher economic status as a group, the non-eligible group started out at baseline with more favorable outcomes than the participant group. The only exceptions are for two indicators: safe disposal of feces and the percent of children 6-23 months with minimum meal frequency. By contrast, by the time of the endline survey, the eligible group was doing better than the non-eligible group for 16 of the 24 indicators despite starting out poorer than them. It is also important to note that while eligible households’ actual participation rate, at 94 percent, was quite high compared to non-eligible households, the participation rate for the latter was not negligible. Thirty-five percent of non-eligible households participated in the project. This means that we can expect to see some improvement for these groups associated with the project’s interventions if the interventions are having a positive impact overall. It is also possible and likely that these households experienced the positive benefits of the project through spillover effects (see Section 5.2). For almost every indicator, the absolute change over time was more favorable for eligible households than non-eligible households. That is, in the case of indicators for which an increase indicates better well-being, the increase was greater for eligible households. In the case of indicators for which a decrease indicates better well-being, the decrease was greater for eligible households. The indicators that improved the most for eligible versus non-eligible households are:

32
The percent of mothers who received Vitamin A within six weeks of delivery;
The percent of children 6-23 months who received Vitamin A in the last six months; and
The percent of children 6-23 months with minimum dietary diversity. There are two exceptions to these more favorable trends for eligible households: The percent of children with minimum meal frequency increased slightly more for non-eligible households, and the decline in the prevalence of diarrhea was greater for non-eligible households. Table 6: Difference-in-difference analysis: Changes in child undernutrition and its determinants from baseline to endline for eligible versus non-eligible households
Eligible households
Non-eligible households (Comparison group)
Difference in
difference
Baseline Endline Change Baseline Endline Change
Household food security
Number of months of adequate food 6.3 11.1 4.8 * 8.6 11.4 2.8 * 2.0
Household dietary diversity 4.8 9.0 4.2 * 6.1 8.7 2.6 * 1.6
Household hunger score 2.00 0.33 -1.67 * 0.85 0.27 -0.58 * -1.1
Caring practices for mothers during pregnancy (%)
Antenatal care during pregnancy 48.0 86.7 38.7 * 60.8 80.6 19.8 * 18.9
Antenatal care in a medical facility 33.6 64.1 30.5 * 49.0 65.9 16.9 * 13.6
More food during pregnancy 13.1 58.5 45.4 * 18.1 51.6 33.5 * 11.9
More rest during pregnancy 23.6 66.2 42.6 * 27.0 57.3 30.3 * 12.3
Vitamin A 6 weeks from delivery 34.6 83.4 48.8 * 41.1 64.8 23.7 * 25.1
Iron/folic acid during pregnancy 45.4 86.6 41.2 * 49.3 74.4 25.1 * 16.1
Caring practices for children
Hand washing at five critical times (%) 9.5 31.9 22.4 * 10.3 22.2 11.9 * 10.5
Safe disposal of feces (0-35m) (%) 47.2 69.3 22.1 * 46.5 60.7 14.2 * 7.9
No. of vaccinations received (0-23m) 5.8 7.0 1.2 * 6.4 6.9 0.5 * 0.7
Vitamin A capsule last 6m (6-23m) (%) 58.1 85.5 27.4 * 62.4 64.8 2.4 25.0
Child receiving Monomix (6-23m) (%) 2.4 31.7 29.3 * 2.6 14.4 11.8 * 17.5
Household health environment
Access to safe water (%) 58.0 76.1 18.1 * 62.9 68.3 5.4 12.7
Access to improved toilet facility (%) 20.8 52.9 32.1 * 40.5 59.6 19.1 * 13.0
Mother's and children's food consumption (6-23m)
Mother's dietary diversity 4.6 8.4 3.8 * 5.7 7.85 2.2 * 1.7
Child: minimum dietary diversity (%) 13.9 59.9 46.0 * 21.9 44.2 22.3 * 23.7
Child: minimum meal frequency (%) 47.4 63.2 15.8 * 36.1 52.3 16.2 * -0.4
Child: minimum acceptable diet (%) 9.7 46.4 36.7 * 12.3 35.3 23.0 * 13.7
Children's health (%)
Diarrhea in last two weeks (0-59m) 12.6 5.5 -7.1 * 17.4 6.1 -11.3 * 4.2
Mother's nutritional status
Mother's Body Mass Index 19.5 20.4 0.9 * 20.0 21.4 1.4 * -0.5
Child stunting (%)
Under fives 61.7 48.8 -12.9 * 52.0 44.8 -7.2 -5.7
Under twos 55.8 42.9 -12.9 * 46.5 43.1 -3.4 -9.5
Notes: Stars represent statistical significance of the difference at the 5% or lower level.

33
The prevalence of stunting, our main indicator of interest, for children under five of eligible households declined by 12.9 percentage points, while that for children under five of ineligible households declined by only 7.2 percentage points. This yields a difference-in-difference of -5.7 . That for under-twos is even greater, at -9.5. These difference-in-difference results, along with those associated with the outcome variables that are determinants of stunting, are evidence that the SHOUHARDO II project interventions caused reductions in stunting among project participants. Because of the lack of a true randomized control group for this comparison, it is not possible to estimate the actual amount of the stunting reduction that was brought about. However, given the high participation in some project interventions by ineligible households and spillover effects, we can safely say that the difference-in-difference estimates are lower bounds on the amount of the stunting reduction caused by the project.
7. Results: Instrumental Variables evidence of project impacts IV estimates of the impact of participation in SHOUHARDO II on height-for-age z-scores of children under five and under two are reported in Table 7. The instruments employed are: a dummy variable representing the planned treatment status of households and a dummy variable indicating whether or not the household is more than a one-hour walk to the nearest town, which was collected at the household level. Note that the instruments for all regressions reported in this section are listed in Appendix 3 and described in Appendix 2. The regressions in Table 7 satisfy the relevance condition (see Kleinbergen-Paap Walk F-statistic) and pass the overidentification test (chi-sq p-value>0.1), indicating they are valid for this analysis. The endogeneity test further indicates that participation is indeed endogenous (chi-sq p-value<0.1), and that 2SLS is thus the appropriate estimation technique. The 2SLS regression coefficient for the specification using HAZ of under-fives as the dependent variable is 0.49 z-scores; that for under-twos is 0.71, 26 percent higher.9 Both are statistically significant at the 5% level and provide further evidence that the project had a positive and substantial impact on HAZ for both age groups. Figure 6 illustrates the results and shows those for boys and girls. The girl-boy difference is particularly stark for under-twos and indicates that the project had a much greater impact on boys’ long-term nutritional status than girls, explaining why the decline in stunting prevalence over the project’s operational period was so much higher for boys (see Table 4).
9 For reference, the total increase in HAZ between the baseline and endline surveys was 0.41 z-scores for under-fives and 0.42
z-scores for under-twos.

34
Table 7: Instrumental variables estimates of the impact of participation in the SHOUHARDO II project on children's height-for-age z-scores
Under fives (6-59 months)
Under twos (6-23 months)
Coefficient (2SLS)
z-statistic
Coefficient
(2SLS) z-
statistic
Participation in SHOUHARDO II 0.488 2.37 ** 0.706 2.20 **
Child's age -0.055 -5.55 *** -0.133 -1.93 *
Child's age-squared 0.001 4.22 *** 0.003 1.11
Girl child 0.094 1.31
0.305 2.24 **
Mother's age 0.015 2.44 ** -0.002 -0.18
Mother's education: None a/ Primary 0.090 1.18
0.074 0.57
Secondary 0.247 2.73 *** 0.347 2.51 **
Age of household head 0.001 0.27
0.003 0.56
Female household head -0.117 -0.71
-0.096 -0.38
Occupation of head: Farming a/ Agricultural laborer 0.087 0.91
-0.013 -0.08
Non-agricultural laborer 0.118 1.03
0.337 1.37
Salaried employment 0.096 0.68
0.005 0.02
Self employment 0.032 0.33
0.040 0.29
Unpaid household work 0.311 1.62
0.375 1.34
Other 0.092 0.84
0.159 0.87
Household size 0.002 0.09
0.018 0.56
Age-sex composition: % females 0-16 a/ Percent females 16-30 0.010 2.31 ** 0.006 0.66
Percent females 30+ 0.002 0.40
-0.007 -0.99
Percent males 0-16 0.005 2.25 ** 0.007 1.72 *
Percent males 16-30 0.006 1.96 ** 0.005 0.78
Percent males 30+ 0.007 1.63
-0.003 -0.37
Well-being category: Extreme poor a/ Poor -0.057 -0.56
-0.212 -1.07
Lower middle 0.344 2.36 ** 0.323 1.33
Middle 0.309 1.96 * 0.127 0.46
Rich 0.425 2.37 ** 0.239 0.79
Region: Coast a/ Haor -0.441 -5.16 *** -0.505 -3.64 ***
Mid Char 0.008 0.09
-0.065 -0.41
North Char 0.068 0.70
-0.066 -0.38
Number of observations
2,475
871
Weak instrument test
Kleibergen-Paap rk Wald F-stat
110.3
43.5
Maximal IV relative bias
b/
b/
Overidentification test (chi-sq p-value)
0.899
0.317
Endogeneity test (chi-sq p-value) 0.016 0.021
a/ Reference category. b/ Maximal IV relative bias statistics not reported by STATA because the estimation is not sufficiently overidentified, rendering the test not well defined (Shaeffer 2012). Notes: z-statistics are robust to heteroskedasticity and clustering by village. Stars represent statistical significance at the 10%(*), 5%(**) and 1%(***) levels.

35
Figure 6: Instrumental variables estimates of the impact of participation in the SHOUHARDO II project on children's height-for-age z-scores (HAZ)
Turning to the determinants of stunting, Table 8 reports the regression results for the measures of household food security. They indicate that the SHOUHARDO II project’s interventions served to increase the number of months in which households had adequate food, to increase the diversity of households’ diets, an indicator of dietary quality, and to reduce household hunger. Note that the regressions for household-level variables employ the education of the household head as a dependent variable while those for child and mother –level variables employ mother’s education. Table 9 reports results for the remaining determinants of stunting. In this table the dependent variables are listed in the far-left column, and the coefficient estimates are only reported for the impact of participation in the project. The next column to the right gives the estimation technique employed, which depends on the endogeneity test statistic. The relevance, overidentification, and endogeneity test statistics are given in the four far-right columns. Among the underlying determinants, in addition to food security, the results indicate that the project’s interventions led to improvements in the quality of caring practices for mothers and children and in household health environments. With regard to caring practices for mothers during pregnancy, they led to increases in antenatal care, increased the likelihood that mother will receive more food and rest during pregnancy, and increased Vitamin A and iron/folic acid supplementation among pregnant mothers. With regard to caring practices for children, they increased the use of hygiene practices by mothers and vitamin supplementation for children. The estimates suggest that they did not, however, serve to increase the number of vaccinations received by children. Finally, the results indicate that the increases in access to safe water among project households (see Table 6) were brought about by the project’s interventions
0.488
0.562
0.484
0.706
0.562
0.934
0
0.1
0.2
0.3
0.4
0.5
0.6
0.7
0.8
0.9
1
All Girls Boys All Girls Boys
Under-fives (6-59m)
Under-twos (6-23m)
H
A
Z

36
Table 8: Instrumental variables estimates of the impact of participation in the SHOUHARDO II project on household food security
Months of adequate food provisioning
Household dietary diversity score
Hunger score
Coefficient (2SLS)
z-statistic
Coefficient
(2SLS) z-
statistic
Coefficient (2SLS)
z-statistic
Participation in SHOUHARDO II 1.175 3.06 *** 9.365 5.29 *** -0.444 -2.06 **
Age of household head 0.004 1.68 * -0.007 -0.84
-0.003 -1.8 *
Female household head -0.294 -1.63
-0.411 -1.04
0.331 1.88 *
Education of household head: None a/ Primary 0.027 0.41
0.780 4.44 *** -0.018 -0.51
Secondary 0.214 2.96 *** 0.869 3.36 *** -0.050 -1.1
Occupation of head: Farming a/ Agricultural laborer -0.495 -5.54 *** -0.566 -2.42 ** 0.213 3.83 ***
Non-agricultural laborer -0.429 -3.59 *** -0.277 -0.97
0.173 2.64 ***
Salaried employment 0.126 1.30
0.126 0.35
-0.118 -2.7 ***
Self employment 0.045 0.62
0.052 0.22
0.033 0.63
Unpaid household work 0.275 1.44
0.570 1.3
-0.261 -1.46
Other -0.240 -2.21 ** -0.610 -2.31 ** 0.130 2.62 ***
Household size -0.041 -2.36 ** 0.054 1.1
0.010 1.05
Age-sex composition: % females 0-16 a/ Percent females 16-30 0.010 3.02 *** 0.032 3.55 *** -0.003 -1.25
Percent females 30+ 0.005 1.43
0.029 2.93 *** 0.000 -0.08
Percent males 0-16 0.001 0.78
0.005 1.08
0.000 -0.41
Percent males 16-30 0.012 3.70 *** 0.034 3.25 *** -0.003 -1.49
Percent males 30+ 0.010 2.59 *** 0.043 3.32 *** -0.004 -1.75 * Well-being category: Extreme poor a/
Poor 0.345 3.56 *** -0.561 -2.25 ** -0.115 -1.89 *
Lower middle 0.795 5.21 *** 1.819 3.23 *** -0.247 -2.7 ***
Middle 1.058 6.40 *** 2.828 4.25 *** -0.393 -3.86 *** Rich 1.338 6.80 *** 4.150 5.02 *** -0.463 -3.95 *** Region: Coast a/
Haor 0.116 1.07
-0.085 -0.24
0.009 0.16
Mid Char -0.053 -0.40
-0.900 -2.7
0.028 0.43
North Char -0.079 -0.57
-0.872 -2.15 ** 0.127 1.87 *
Number of observations
2,844
2,844
2,844
Weak instrument test Kleibergen-Paap rk Wald F-stat
59.6
15.7
59.6 Maximal IV relative bias
5%
10%
5%
Overidentification test (chi-sq p-value)
0.335
0.851
0.463 Endogeneity test (chi-sq p-value) 0.001 0.000 0.016
Notes: z-statistics are robust to heteroskedasticity and clustering by village. Stars represent statistical significance at the 10%(*), 5%(**) and 1%(***) levels.

37
Table 9: Instrumental variables/OLS estimates of the impact of participation in the SHOUHARDO II project on determinants of children’s nutritional status
Estim- ation
method Coeff- icient
z-statistic
N
Weak instrument test Overident-
ification test
(chi-sq p-value)
Endogen- eity test
(chi-sq p-value)
Kleibergen-Paap rk Wald F-
stat
Maximal IV
relative bias
Household food security Number of months of adequate food 2SLS 1.18 3.06 *** 2,844 59.6 5%
0.335 0.001
Household dietary diversity 2SLS 9.37 5.29 *** 2,844 15.7 10%
0.851 0.000
Household hunger score 2SLS -0.44 -2.06 ** 2,844 59.6 5%
0.463 0.016
Caring practices for mothers during pregnancy Antenatal care during pregnancy 2SLS 4.960 4.66 *** 2,840 61.6 5%
0.311 0.000
Antenatal care in a medical facility OLS 0.092 3.37 *** 2,840 90.2 10%
0.754 0.710
More food during pregnancy 2SLS 1.010 3.55 *** 2,829 24.9 10%
0.325 0.001
More daytime rest during pregnancy 2SLS 0.608 4.33 *** 2,824 45.9 5%
0.190 0.000
Vitamin A within 6 weeks of delivery OLS 0.307 4.71 *** 2,730 110.7 a/
0.592 0.015
Iron/folic acid during pregnancy 2SLS 0.417 3.68 *** 2,831 32.3 5%
0.161 0.013
Caring practices for children
Hand washing at five critical times 2SLS 0.423 2.92 *** 2,844 59.8 5%
0.129 0.004
Safe disposal of feces (0-35m) 2SLS 0.375 2.29 ** 1,845 40.6 5%
0.220 0.078
No. of vaccinations received (0-23m) OLS -0.008 -0.07
918 16.7 5%
0.239 0.158
Vitamin A capsule last 6m (6-23m) OLS 0.156 3.47 *** 873 22.1 5%
0.700 0.612
Child receiving multivitamin (6-23m) 2SLS 0.537 3.30 *** 871 21.4 5%
0.512 0.002
Household health environment
Access to safe water 2SLS 0.276 3.70 *** 2,844 92.4 5%
0.584 0.000
Access to an improved toilet facility OLS -0.019 -0.69 2,844 91.4 5% 0.204 0.147
Mother's and children's food consumption
Mother's dietary diversity 2SLS 7.950 4.24 *** 2,734 14.3 10%
0.925 0.000
Minimum dietary diversity (6-23m) OLS 0.215 4.78 *** 845 20.0 5%
0.140 0.649
Minimum meal frequency (6-23m) 2SLS 0.438 2.17 ** 766 20.5 5%
0.747 0.065
Minimum acceptable diet (6-23m) OLS 0.203 4.35 *** 740 19.0 5%
0.338 0.317
Mother's nutritional status and food consumption Mother's Body Mass Index IV set 1 2SLS 1.870 1.75 * 2,522 39.0 5%
0.360 0.041
Mother's Body Mass Index IV set 2 OLS -0.253 -0.10
2,522 93.3 a/
0.690 0.129
Children's health
Diarrhea in last two weeks (0-59m) 2SLS -0.002 -0.12 2,834 73 5% 0.791 0.528 a/ Maximal IV relative bias test statistics not reported by STATA because the estimation is not sufficiently overidentified, rendering the test not well defined (Shaeffer 2012).
Notes: z-statistics are robust to heteroskedasticity and clustering by village. Stars represent statistical significance at the 10%(*), 5%(**) and 1%(***) levels.

38
Turning to the immediate determinants of children’ nutritional status, the IV evidence indicates that all four indicators of mother’s and children’s food consumption were positively impacted by the SHOUHARDO II project, including mother’s dietary diversity and, for children, minimum dietary diversity, minimum meal frequency and minimum acceptable diet. The data give ambivalent results for mothers’ nutritional status, with one set of instruments indicating a positive impact on mother’s Body Mass Index and another indicating no impact. Lastly, the results indicate no impact of the project’s interventions on diarrhea among children under five. Overall these results suggest that the project had a positive impact on children’s nutritional status and that this was brought about by:
Increases in household food security;
Improvements in the quality of caring practices for mothers during pregnancy;
Increased use of hygiene practices by mothers;
Increased vitamin supplementation for children;
Improvements in access to safe water;
Improved food consumption for mothers and children; and
Possibly, improved nutritional status of mothers.
8. Results: Propensity Score Matching evidence on the impact of specific
interventions In this section, the PSM estimates of the average treatment effect on the treated (ATT) of the four intervention sets of focus—MCHN, women’s empowerment, livelihoods promotion, and water and sanitation—are presented. As discussed in the methods section, underlying these estimates are probit-regression predictions of each household’s propensity score for participating in the intervention of interest. The full participation regression results are presented in Appendix 4, but will be briefly summarized in each section here. Note that for each intervention the assessment is only undertaken for outcomes they would be expected to influence.
8.1 Mother and child health and nutrition interventions
Recall that the participation variable for the MCHN interventions indicates whether the household participates in all four MCHN interventions: courtyard sessions, cooking/feeding sessions, child growth monitoring, and receipt of a food ration. Forty-five percent of households in project villages did so, leaving an ample potential pool of households for matching. It was not possible to undertake analysis for each of the four interventions individually because of their high participation rates, which meant that a large enough pool of households for matching was not available.

39
The probit propensity score model for full participation in MCHN interventions given in Appendix 4, Error! Reference source not found. reveals that the following factors influenced households’ and others’ participation in MCHN interventions:
Participation in the other three interventions
Whether the household received a food ration from another project
Household demographic characteristics: age and sex of the child, mother’s and household head’s age, education of household head, age-sex composition, region of residence
Whether the household resides in a PM2A village
Relative shock exposure in 2009
Relative bonding social capital in 2009
Number of SHOUHARDO II project staff known in 2009
Mother’s leisure time in 2009
Baseline district-level HAZ and weight-for-height z-scores. It is important to keep in mind that the PSM estimates are only able to account for observable, measured determinants of households’ participation in interventions as opposed to the IV estimates, which are designed to account for observable and unobservable determinants. As such, the selection bias caused by targeting of MCHN interventions to mothers in households with children that are undernourished is not corrected for in the estimates presented here. This bias is likely to lead to underestimation of the impacts of the MCHN interventions on HAZ and other variables closely related to it in the hierarchy of causality, in particular, mothers’ nutritional status. Baseline district-level anthropometric z-scores were included to help control for this selection bias. However, doing so is not likely to adequately control for household-level selection bias. Table 10 presents the PSM results. The far-right column reports on the key statistic that allows one to assess the degree of matching quality. Matching is of adequate quality for all of the dependent variables of interest (chi-squared p-value>0.1). The percent of sample households falling in the common support is also very high. As illustrated in Figure 7 for the example of the number of months of adequate food provisioning, the common support condition is strongly satisfied. This figure shows the propensity score distribution of participating versus non-participating households, and that there are ample non-participating households with propensity scores close by in the distribution with which to be matched (with the exception of a few households having very high propensity scores). Note that matching quality and common support statistics, although not reported, are of adequate quality for all PSM results presented in the rest of Section 8. The results point to a positive impact of MCHN participation on at least some aspect of all three underlying determinants of children’s nutritional status. They indicate that they served to increase household dietary diversity, to improve all six caring practices for mothers and all five caring practices for children, and to increase access to sanitary toilet facilities. Among the immediate determinants, the results indicate that the MCHN interventions increased mothers’ dietary diversity and the likelihood that a child has minimum dietary diversity. The PSM results indicate no impact of the MCHN interventions on children’s HAZ and in fact a negative impact on mothers’ body mass index. This is likely related to the negative selection bias discussed above.
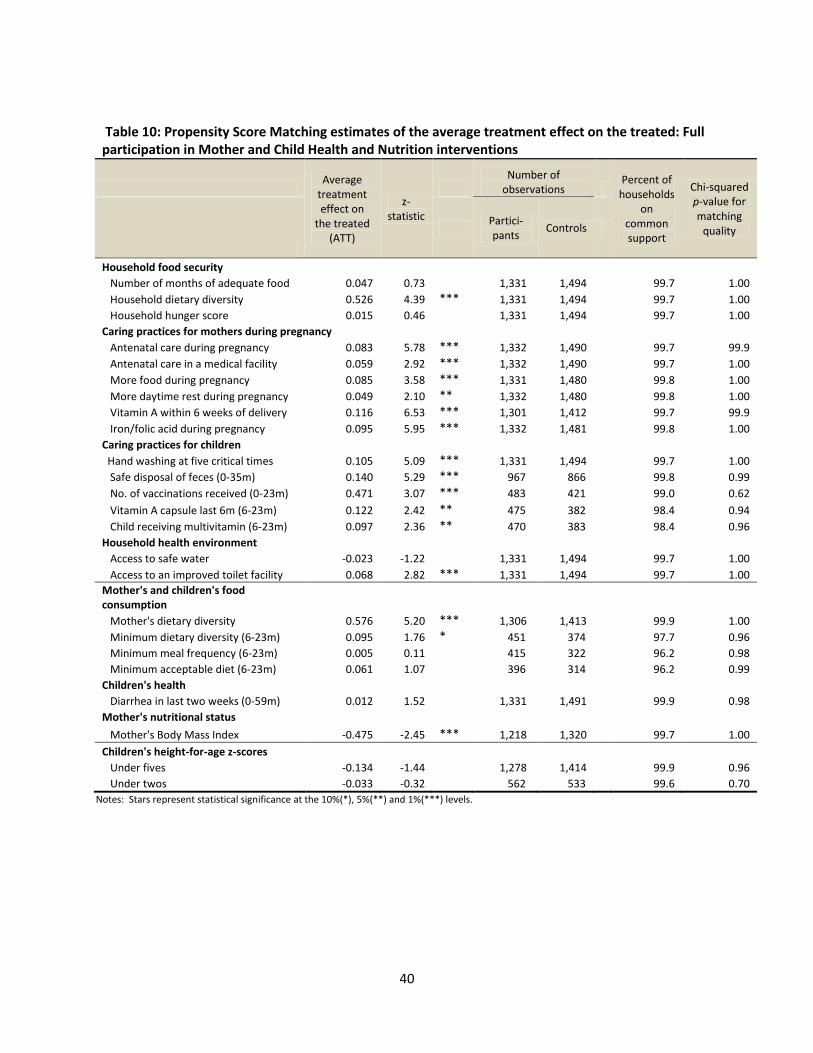
40
Table 10: Propensity Score Matching estimates of the average treatment effect on the treated: Full participation in Mother and Child Health and Nutrition interventions
Average
treatment effect on
the treated (ATT)
z-statistic
Number of
observations Percent of
households on
common support
Chi-squared p-value for matching
quality
Partici- pants
Controls
Household food security
Number of months of adequate food 0.047 0.73
1,331 1,494
99.7 1.00
Household dietary diversity 0.526 4.39 *** 1,331 1,494
99.7 1.00
Household hunger score 0.015 0.46
1,331 1,494
99.7 1.00
Caring practices for mothers during pregnancy Antenatal care during pregnancy 0.083 5.78 *** 1,332 1,490
99.7 99.9
Antenatal care in a medical facility 0.059 2.92 *** 1,332 1,490
99.7 1.00
More food during pregnancy 0.085 3.58 *** 1,331 1,480
99.8 1.00
More daytime rest during pregnancy 0.049 2.10 ** 1,332 1,480
99.8 1.00
Vitamin A within 6 weeks of delivery 0.116 6.53 *** 1,301 1,412
99.7 99.9
Iron/folic acid during pregnancy 0.095 5.95 *** 1,332 1,481
99.8 1.00
Caring practices for children
Hand washing at five critical times 0.105 5.09 *** 1,331 1,494
99.7 1.00
Safe disposal of feces (0-35m) 0.140 5.29 *** 967 866
99.8 0.99
No. of vaccinations received (0-23m) 0.471 3.07 *** 483 421
99.0 0.62
Vitamin A capsule last 6m (6-23m) 0.122 2.42 ** 475 382
98.4 0.94
Child receiving multivitamin (6-23m) 0.097 2.36 ** 470 383
98.4 0.96
Household health environment Access to safe water -0.023 -1.22
1,331 1,494
99.7 1.00
Access to an improved toilet facility 0.068 2.82 *** 1,331 1,494 99.7 1.00
Mother's and children's food consumption
Mother's dietary diversity 0.576 5.20 *** 1,306 1,413
99.9 1.00
Minimum dietary diversity (6-23m) 0.095 1.76 * 451 374
97.7 0.96
Minimum meal frequency (6-23m) 0.005 0.11
415 322
96.2 0.98
Minimum acceptable diet (6-23m) 0.061 1.07
396 314
96.2 0.99
Children's health
Diarrhea in last two weeks (0-59m) 0.012 1.52
1,331 1,491
99.9 0.98
Mother's nutritional status Mother's Body Mass Index -0.475 -2.45 *** 1,218 1,320 99.7 1.00
Children's height-for-age z-scores
Under fives -0.134 -1.44
1,278 1,414
99.9 0.96
Under twos -0.033 -0.32 562 533 99.6 0.70
Notes: Stars represent statistical significance at the 10%(*), 5%(**) and 1%(***) levels.

41
Figure 7: Common support: Propensity scores of participant and non-participant households for full participation in MCHN interventions
Note: The dependent variable used for this example is number of months of adequate household food provisioning.
0 .2 .4 .6 .8 1Propensity Score
Untreated Treated: On support
Treated: Off support

42
8.2 Women’s empowerment interventions
The probit propensity score model for participation in the empowerment interventions is given in Appendix 4, Table 17. The following factors influenced households’ and mothers’ participation in these interventions:
Participation in the other three interventions
Whether the household received a food ration from another project
Household demographic characteristics: child’s age, gender and occupation of household head, age-sex composition, region of residence
Household well-being category
Whether the village of residence is classified as extremely vulnerable
Total number of households in the village
Whether CARE is the implementing NGO in the village
Whether the household resides in a PM2A village
Relative shock exposure in 2009
Bonding social capital
Number of SHOUHARDO II project staff known in 2009. Table 11 presents the PSM results. Overall, they suggest that the empowerment interventions led to some important improvements in the areas of household food security, caring practices for mothers and children, mothers’ food consumption, and children’s health. Membership in an EKATA group is associated with increased antenatal care during pregnancy, increased likelihood that a mother will receive vitamin A within six weeks of delivery, and knows the five critical times for hand washing. Note that the small sample of mothers participating in EKATA limits our ability to detect statistically significant results for this intervention, especially for the outcomes applying to children under two. Membership in a savings group is positively associated with increased household and mother’s dietary diversity and with reduced household hunger. With respect to caring practices, it increases post-delivery Vitamin A supplementation for mothers and the safe disposal of children’s feces. Together, the PSM results suggest that the women’s empowerment interventions increase household food security, increase women’s dietary diversity, lead to women consuming more food during their pregnancies and increase the likelihood that they will receive vitamin A supplementation. Women participating in the interventions are more likely to know about or practice hygienic behaviors, and perhaps this is why their children are less likely to have diarrhea. It is important to keep in mind that some health and nutrition behavior change messages were reinforced in the EKATA groups. Thus it is not clear that the impacts seen here are due to this factor or to improvement in women’s empowerment itself, an important subject for future research. Here, again, no positive influence on HAZ can be detected.

43
Table 11: Propensity Score Matching estimates of the average treatment effect on the treated (ATT): Mother’s participation in women’s empowerment interventions
Mother is a member of an EKATA group
Mother is a member of
a savings group
Mother is a member of an EKATA group or a savings group
ATT z-statistic ATT z-statistic ATT z-statistic
Household food security Number of months of adequate food 0.136 1.25
0.133 1.29
0.065 0.83
Household dietary diversity 0.373 1.50
0.514 2.92 *** 0.547 3.28 ***
Household hunger score 0.001 0.02
-0.089 -1.89 * -0.080 -1.91 *
Caring practices for mothers during pregnancy Antenatal care during pregnancy 0.046 1.76 * 0.006 0.3
0.025 1.40
Antenatal care in a medical facility -0.01 -0.35
0.014 0.44
0.024 0.90
More food during pregnancy 0.045 1.19
0.053 1.43
0.048 1.80 *
More daytime rest during pregnancy 0.057 1.35
0.036 1.27
0.023 0.91
Vitamin A within 6 weeks of delivery 0.048 1.72 * 0.068 3.27 *** 0.064 2.97 *** Iron/folic acid during pregnancy 0.004 0.14
0.015 0.67
0.013 0.76
Caring practices for children
Hand washing at five critical times 0.094 2.19 ** 0.008 0.28
0.034 1.62
Safe disposal of feces (0-35m) 0.026 0.67
0.077 2.08 ** 0.082 2.51 **
No. of vaccinations received (0-23m) 0.247 0.99
0.093 0.41
0.245 1.33
Vitamin A capsule last 6m (6-23m) 0.007 0.12
0.008 0.16
0.028 0.66
Child receiving multivitamin (6-23m) -0.05 -0.55
-0.019 -0.33
-0.014 -0.30
Mother's and children's food consumption Mother's dietary diversity 0.280 1.23
0.610 3.24 *** 0.550 4.58 ***
Minimum dietary diversity (6-23m) 0.056 0.58
-0.028 -0.32
0.011 0.18
Minimum meal frequency (6-23m) 0.038 0.37
0.012 0.15
0.038 0.57
Minimum acceptable diet (6-23m) 0.105 0.96
0.046 0.68
0.103 1.57
Children's health
Diarrhea in last two weeks (0-59m) -0.01 -0.93
-0.021 -1.63
-0.026 -2.80 ***
Mother's nutritional status Mother's Body Mass Index -0.21 -0.07 -0.134 -0.53 -0.236 -0.98
Children's height-for-age z-score Under fives -0.06 -0.43
-0.109 -0.96
-0.065 -0.73
Under twos -0.21 -0.73 0.020 0.09 0.043 0.25
Notes: Stars represent statistical significance at the 10%(*), 5%(**) and 1%(***) levels.

44
8.3 Livelihoods promotion interventions
The following factors influenced households’ and mothers’ participation in the four livelihoods promotion interventions, that is, all or one of: Crop production, CHD, Fisheries and IGA (see Appendix 4, Table 18):
Participation in the other three interventions
Whether the household received a food ration from another project
Household demographic characteristics: mother’s and household head’s age and education, occupation of household head, age-sex composition, region of residence
Household well-being category
Whether the household resides in a PM2A village
Current bonding social capital and relative bonding social capital in 2009
Number of SHOUHARDO II project staff known in 2009
Index of leisure time10
Women’s decision making score in 2009
Baseline district-level HAZ.
The PSM results (Table 12) suggest that the livelihoods promotion interventions had an impact on
household food security, mother’s and children’s food consumption, and mother’s nutritional status.
All four of the interventions had a positive impact on either household dietary diversity or mother’s
dietary diversity. Two of the interventions had a positive impact on both: CHD and Fisheries. Fisheries
additionally served to reduce household hunger and increase the likelihood of a child having minimum
dietary diversity. The analysis suggests that two of the interventions lead to improvements in mothers’
body mass index: CHD and Fisheries.
10
This index refers to the leisure time of the respondent for Part I of the questionnaire, which was typically either the household head or the spouse of the household head.

45
Table 12: Propensity Score Matching estimates of the average treatment effect on the treated (ATT): Participation in livelihood promotion interventions
Crop production
Comprehensive Homestead
Development
Fisheries
Income Generating Activities
Any agriculture/ income
generation intervention
ATT
z-statistic
ATT z-
statistic ATT
z-statistic ATT
z-statistic
ATT z-
statistic
Household food security Months of adequate food 0.045 0.35
0.054 0.41
-0.09 -0.47
-0.09 -0.69
-0.012 -0.12
Household dietary diversity 0.646 2.30 ** 0.612 2.15 ** 0.566 1.37
0.64 2.74 *** 0.756 3.46 ***
Household hunger score 0.015 0.23
0.036 0.50
-0.28 -1.81 * 0.064 0.85
0.014 0.18
Mother's and children's food consumption Mother's dietary diversity 0.354 1.3
0.448 2.19 ** 0.728 2.26 ** 0.253 1.04
0.464 2.27 **
Minimum dietary diversity (6-23m) 0.067 0.67
0.104 1.11
0.205 1.68 * 0.07 0.70
0.069 0.74
Minimum acceptable diet (6-23m) 0.036 0.28
0.055 0.45
-0.04 -0.26
-0.14 -1.14
-0.032 -0.29
Mother's nutritional status Mother's Body Mass Index -0.23 -0.64 0.590 1.99 ** 0.807 1.76 * 0.42 1.38 0.430 1.55
Children's height-for-age z-score Under fives -0.04 -0.23
-0.15 -1.19
0.040 0.22
-0.06 -0.43
-0.059 -0.41
Under twos -0.15 -0.46 -0.15 -0.61 0.300 0.68 -0.20 -0.85 -0.117 -0.49 Notes: Stars represent statistical significance at the 10%(*), 5%(**) and 1%(***) levels.
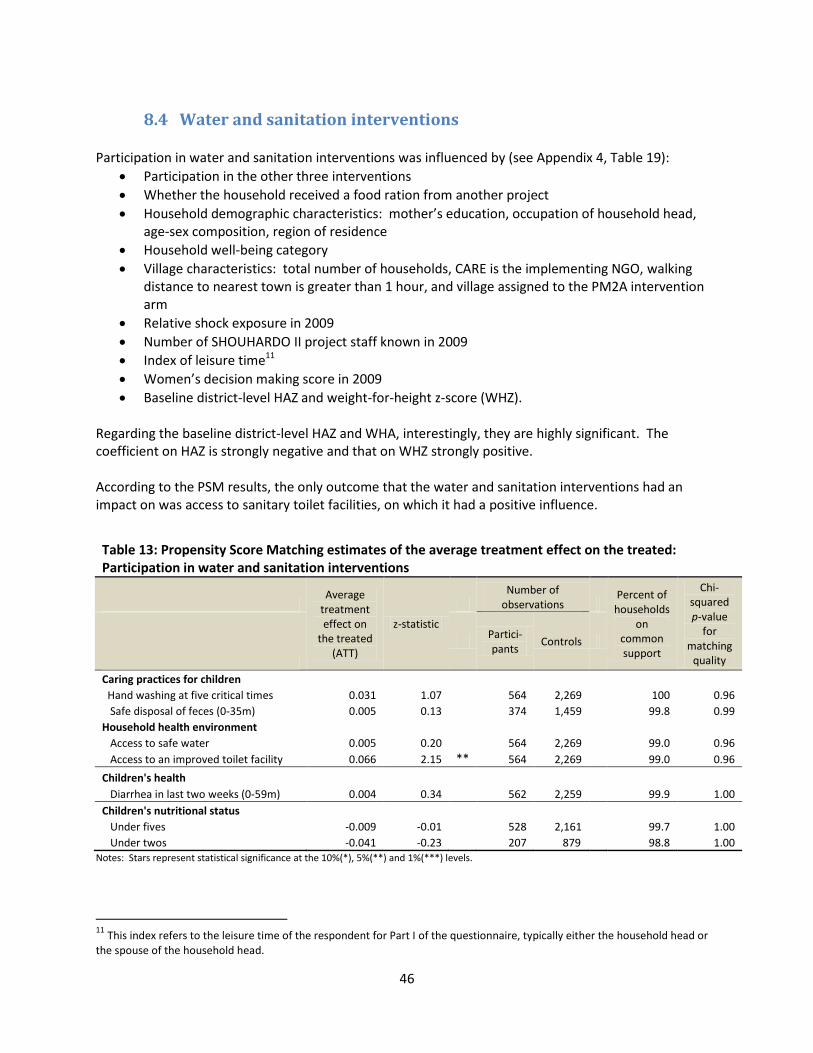
46
8.4 Water and sanitation interventions
Participation in water and sanitation interventions was influenced by (see Appendix 4, Table 19):
Participation in the other three interventions
Whether the household received a food ration from another project
Household demographic characteristics: mother’s education, occupation of household head, age-sex composition, region of residence
Household well-being category
Village characteristics: total number of households, CARE is the implementing NGO, walking distance to nearest town is greater than 1 hour, and village assigned to the PM2A intervention arm
Relative shock exposure in 2009
Number of SHOUHARDO II project staff known in 2009
Index of leisure time11
Women’s decision making score in 2009
Baseline district-level HAZ and weight-for-height z-score (WHZ). Regarding the baseline district-level HAZ and WHA, interestingly, they are highly significant. The coefficient on HAZ is strongly negative and that on WHZ strongly positive. According to the PSM results, the only outcome that the water and sanitation interventions had an impact on was access to sanitary toilet facilities, on which it had a positive influence.
Table 13: Propensity Score Matching estimates of the average treatment effect on the treated: Participation in water and sanitation interventions
Average
treatment effect on
the treated (ATT)
z-statistic
Number of
observations Percent of
households on
common support
Chi-squared p-value
for matching
quality
Partici- pants
Controls
Caring practices for children
Hand washing at five critical times 0.031 1.07
564 2,269
100 0.96
Safe disposal of feces (0-35m) 0.005 0.13
374 1,459
99.8 0.99
Household health environment Access to safe water 0.005 0.20
564 2,269
99.0 0.96
Access to an improved toilet facility 0.066 2.15 ** 564 2,269
99.0 0.96
Children's health Diarrhea in last two weeks (0-59m) 0.004 0.34 562 2,259 99.9 1.00
Children's nutritional status Under fives -0.009 -0.01
528 2,161
99.7 1.00
Under twos -0.041 -0.23 207 879 98.8 1.00 Notes: Stars represent statistical significance at the 10%(*), 5%(**) and 1%(***) levels.
11
This index refers to the leisure time of the respondent for Part I of the questionnaire, typically either the household head or the spouse of the household head.

47
9. Summary and conclusions Overall, the evidence presented in this report indicates that the SHOUHARDO II project was very successful in reducing stunting among children under five. While it is not possible to pinpoint the exact amount of stunting reduction caused with accuracy, it seems likely that a large portion, if not all, of the 12.9 percentage–point reduction in the prevalence of stunting observed between the baseline and endline surveys can be attributable to the project. Combined, the following findings support this conclusion:
The average annual decline in the stunting prevalence among eligible project households was 3.2 percentage points while the trend in rural Bangladeshi households in recent years has been a lower 0.6 percentage points per year. This comparative evidence rules out the possibility that the decline among project children was due to positive forces emanating from wider favorable economic, climatic, or policy-related trends in the country.
The normal large increase in stunting prevalence seen for children as they age from the 6-18 to the 48-60 month age group was not found for the group of children whose households participated in SHOUHARDO II interventions. Something happened that prevented many children from becoming stunted as they aged.
A difference-in-difference (DID) analysis comparing the changes over time for eligible project households compared to non-eligible project households indicates that the stunting prevalence fell more for eligible households. The difference is particularly strong for children under two.
Instrumental variables (IV) estimates of the impact of participation in the project confirm that it had a substantial, positive impact on children’s height-age-z-scores, particularly for children under two and for boys.
Propensity score matching (PSM) analysis indicates no impact of the project on child stunting. This can be attributed to the inability to control for a known, yet unobservable, factor affecting participation in the project’s MCHN activities: the purposeful targeting of children who were already undernourished.
The DID, IV and PSM analyses all indicate that the project’s interventions led to improvements in a broad array of determinants of stunting, improvements which are necessary for reducing stunting.
The findings regarding project impacts on the determinants of stunting give insight into how the stunting reductions were brought about. Table 14 summarizes these findings from the various analyses. The left-hand panel focusses on the DID and IV analyses as well as the “single-difference” results, that is, the change from baseline and endline for eligible project households (reported in Table 6). The right-hand panel focuses on the PSM results for individual project interventions. Positive impacts revealed by a particular analysis are indicated by purple shading. Negative impacts are indicated by red shading. Table 14’s summary reveals that the stunting reductions were brought about by improvements in household food security, in the quality of caring practices for mothers during pregnancy, in the quality of caring practices for children, in household health environments, in mother’s and children’s food consumption and, most likely, in mother’s nutritional status. With respect to household food security, DID, IV and PSM evidence all indicate that the project’s interventions increased household dietary diversity, an indicator of dietary quality, and reduced

48
Table 14: Summary of findings from single difference, difference-in-difference, instrumental variables, and propensity score matching analyses
Evidence of impact of participation in the SHOUHARDO II project
Evidence of the impact of participation in
project interventions (PSM)
Single
difference Single
difference
Difference -in-
difference IV/OLS MCHN
Women's empower
-ment
Livelihoods promotion
Water and
sanitation
Household food security
Number of months of adequate food
Household dietary diversity
Household hunger score
Caring practices for mothers during pregnancy
Antenatal care during pregnancy
Antenatal care in a medical facility
More food during pregnancy
More daytime rest during pregnancy
Vitamin A within 6 weeks of delivery
Iron/folic acid during pregnancy
Caring practices for children
Hand washing at five critical times
Safe disposal of feces (0-35m)
No. of vaccinations received (0-23m)
Vitamin A capsule last 6m (6-23m)
Child receiving multivitamin (6-23m)
Household health environment
Access to safe water
Access to an improved toilet facility
Mother's and children's food consumption
Mother's dietary diversity
Minimum dietary diversity (6-23m)
Minimum meal frequency (6-23m)
Minimum acceptable diet (6-23m)
Children's health
Diarrhea in last two weeks (0-59m)
Mother's nutritional status and food consumption
Mother's Body Mass Index IV set 1
Mother's Body Mass Index IV set 2
Child height-for-age z-score
Under fives
Under twos Note: Purple shading indicates evidence of a positive impact for any of the interventions in an intervention set. Red shading indicates evidence of a negative impact. Single difference and difference-in-difference results are presented in Table 6. IV/OLS estimates are presented in Tables 7 through 9. PSM estimates are presented in Tables 10 through 13.

49
household hunger. The DID and IV analyses, but not PSM, indicate that they also led to increases in the amount of food households have access to, as measured by reported number of months of adequate food provisioning. With respect to caring practices for mothers during pregnancy, all methods point to project impacts on antenatal care, including whether that care is received in a medical facility. They suggest that the project led to women consuming more food and getting more day-time rest during their pregnancies. Finally, because of the project more women are receiving vitamin A supplementation within six weeks of their delivery and iron/folic acid supplementation during their pregnancy. The DID, IV and PSM results indicate that project interventions led to greater knowledge among mothers of the appropriate times for hand washing and an increase in the practice of safely disposing of children’s feces. They also increased vitamin supplementation for children, including Vitamin A and multivitamin supplementation. While the DID and PSM results suggest that they increased child immunization, the IV evidence does not support this conclusion. Different methods imply different project impacts in the area of household health environments. The DID and IV analyses suggest that the project brought about increased access to safe water, but not to sanitary toilet facilities. The DID and PSM analyses suggest that it brought about increased access to sanitary toilet facilities, but not to safe water. In all, while these results are incongruous, we can safely say that at least some of the improvement in household health environments seen between the baseline and endline surveys among eligible households (an increase in prevalences of 18.1 and 32.1 percentage points, respectively, for safe water and sanitary toilet facilities) can be attributed to the project. With regard to food consumption, dietary diversity was enhanced not only for households as a whole but specifically for mothers and children as well according to all three types of analysis. The DID and IV analyses confirm that the large increase in the percent of children 6-23 months who have a minimum acceptable diet, from 10 to 46 percent, was at least partially caused by the project’s interventions. The evidence is ambiguous for diarrhea incidence among children under five. The DID analysis showed that the reduction in diarrhea prevalence seen for eligible project households from baseline to endline (from 12.6 to 5.5 percent) was less than for non-eligible households. While the PSM results indicate a favorable impact, the IV analysis indicates none. Mother’s BMI changed little over the project’s implementation period. Yet the IV results give some evidence of a positive impact, and the PSM results that one of the project interventions (livelihoods promotion) had a positive impact. The negative PSM results seen for MCHN are likely due to a combination of the close relationship between mother’s and children’s nutritional status (see Section 3.1) and, again, the negative selection bias associated with the targeting of undernourished children. While the evidence presented in this report is not strong, it appears that the project likely led to some improvement in mothers’ nutritional status. The PSM results give insight into the question of which interventions brought about the reductions in stunting and improvements in its determinants. None of the interventions were found to improve children’s nutritional status. Again, this is likely due to the inability of the PSM method to control for the (unobservable) targeting of undernourished children.

50
The PSM results suggest that the MCHN interventions had a broad influence, improving household, mother’s and children’s dietary diversity; all of the caring practices for mothers during pregnancy; all of the caring practices for children; and access to sanitary toilet facilities. The women’s empowerment interventions also facilitated improvements in a variety of determinants of stunting, including household and mother’s dietary diversity, antenatal care during pregnancy, taking more food during pregnancy, post-delivery Vitamin A supplementation of mothers, and indicators of the knowledge and use of hygiene practices. The PSM results additionally suggest that they served to reduce hunger and prevent of diarrhea among children. The livelihoods promotion activities increased household, mother and children’s dietary diversity and reduced household hunger. According to the PSM results, that they also improved mothers’ nutritional status. Finally, the project’s water and sanitation interventions are found to have increased access to sanitary toilet facilities. In conclusion, this report finds that the SHOUHARDO II project was successful in reducing child stunting. Two factors that contributed to its success were: 1) it addressed a broad range of underlying and immediate causes of chronic undernutrition; and 2) the integrated approach that brought to bear not only nutrition-specific MCHN interventions to address the problem, but also interventions designed to empower women, to promote households’ livelihoods, and to improve households’ health environments. Suggested areas for future research are whether the project’s women’s empowerment interventions actually empowered women and whether the SHOUHARDO II project was able to shield households and children from the impacts of climate shocks.

51
Appendix 1. Determinants of stunting employed as dependent variables:
Variable descriptions
Variable Description
Household food security
Number of months of adequate food The number of months of months in the previous year that the household had adequate food, as reported by the member responsible for preparing food (Bilinsky and Swindale 2010).
Household dietary diversity Number of food groups, out of 15, from which food was consumed by any household member in the previous 24 hours.
Household hunger score
A score assigned based on the frequency of occurrence of three situations in the last four weeks (no food to eat of any kind in household, going to sleep at night hungry, going a whole day and night without eating), with frequency scores of no=0, rarely or sometimes=1, and often=2. The scale ranges from 0 to 6 (Ballard et al. 2011).
Caring practices for mothers during pregnancy
Antenatal care during pregnancy Mother received antenatal care during current or recent pregnancy.
Antenatal care in a medical facility Mother received antenatal care during current or recent pregnancy in a medical facility (government hospital, other government health facility, private hospital/clinic, or community clinic).
More food during pregnancy Mother indicated she took more food than she usually takes during current or recent pregnancy.
More rest during pregnancy Mother indicated she took more daytime rest than she usually takes during current or recent pregnancy.
Vitamin A 6 weeks from delivery Mother received Vitamin A within one and a half months of delivery of child.
Iron/folic acid during pregnancy Mother took iron and folic acid during the last pregnancy.
Caring practices for children
Hand washing at five critical times
Mother indicated it is important to wash hands at all five of the following critical times: before eating, before breastfeeding/feeding child, before cooking/preparing food, after defecation/urination, after cleaning child that defecated/changing child diaper.
Safe disposal of feces (0-35m) Mother of child 0-35 months indicated that the last time her child defecated it was in toilet or the feces was disposed of in toilet.
Number of vaccinations received (0-23m)
Total number of vaccinations received, out of a total of eight (BCG, Polio 1, 2 and 3, DPT/Penta 1, 2 and 3, and measles) by child 0-23 months.
Vitamin A capsule last 6m (6-23m) Mother of child 6-23 months indicated they gave child a Vitamin A capsule in the last six months.
Child receiving Monomix (6-23m) Mother of child 6-23 months indicated they are giving child Monimix or other sprinkles packets in food.
Household health environment
Access to safe water
Household has access to water from one of the following sources: hand tube well, tara pump, deep tube well, shallow tube well, ring well/indara, piped water, pond sand filter, or rainwater harvesting system. The water must be normally available from the source and it must not have been unavailable for a day or longer in the two weeks preceding the survey.
Access to an improved toilet facility Household has access to a ring-slab/offset latrine with a water seal, a pit latrine that is covered, a septic latrine, or a local adopted hygienic latrine.
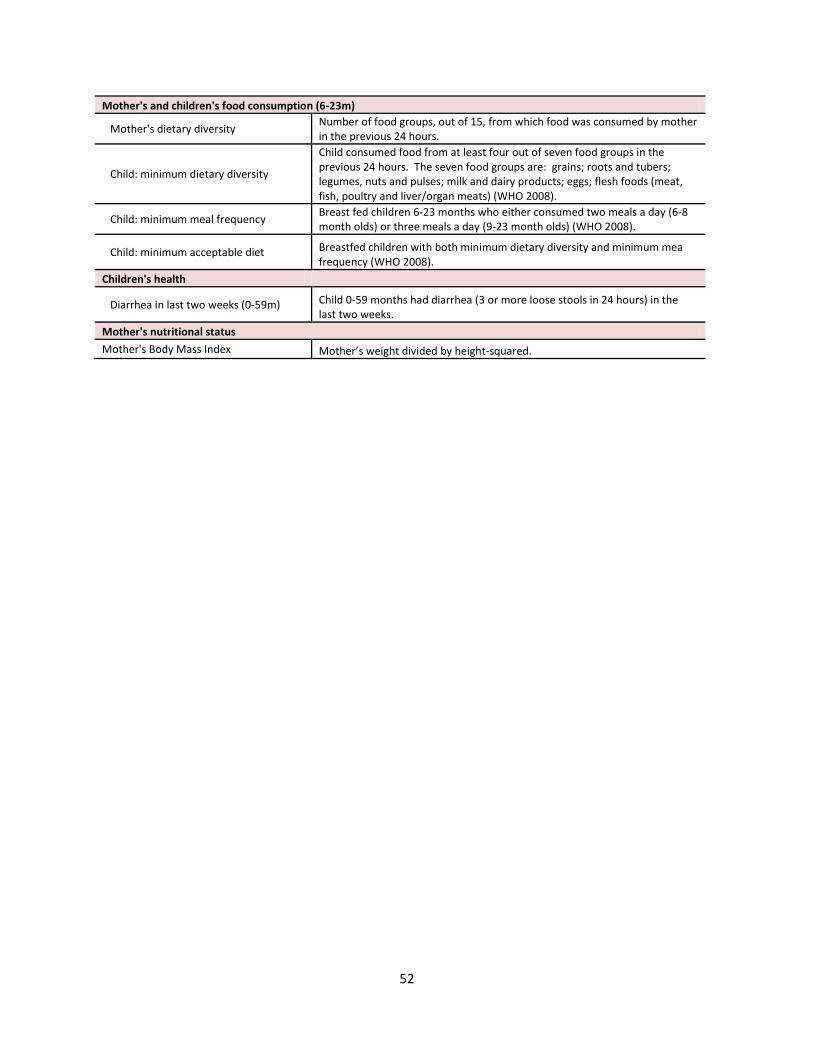
52
Mother's and children's food consumption (6-23m)
Mother's dietary diversity Number of food groups, out of 15, from which food was consumed by mother in the previous 24 hours.
Child: minimum dietary diversity
Child consumed food from at least four out of seven food groups in the previous 24 hours. The seven food groups are: grains; roots and tubers; legumes, nuts and pulses; milk and dairy products; eggs; flesh foods (meat, fish, poultry and liver/organ meats) (WHO 2008).
Child: minimum meal frequency Breast fed children 6-23 months who either consumed two meals a day (6-8 month olds) or three meals a day (9-23 month olds) (WHO 2008).
Child: minimum acceptable diet Breastfed children with both minimum dietary diversity and minimum mea frequency (WHO 2008).
Children's health
Diarrhea in last two weeks (0-59m) Child 0-59 months had diarrhea (3 or more loose stools in 24 hours) in the
last two weeks.
Mother's nutritional status
Mother's Body Mass Index Mother’s weight divided by height-squared.
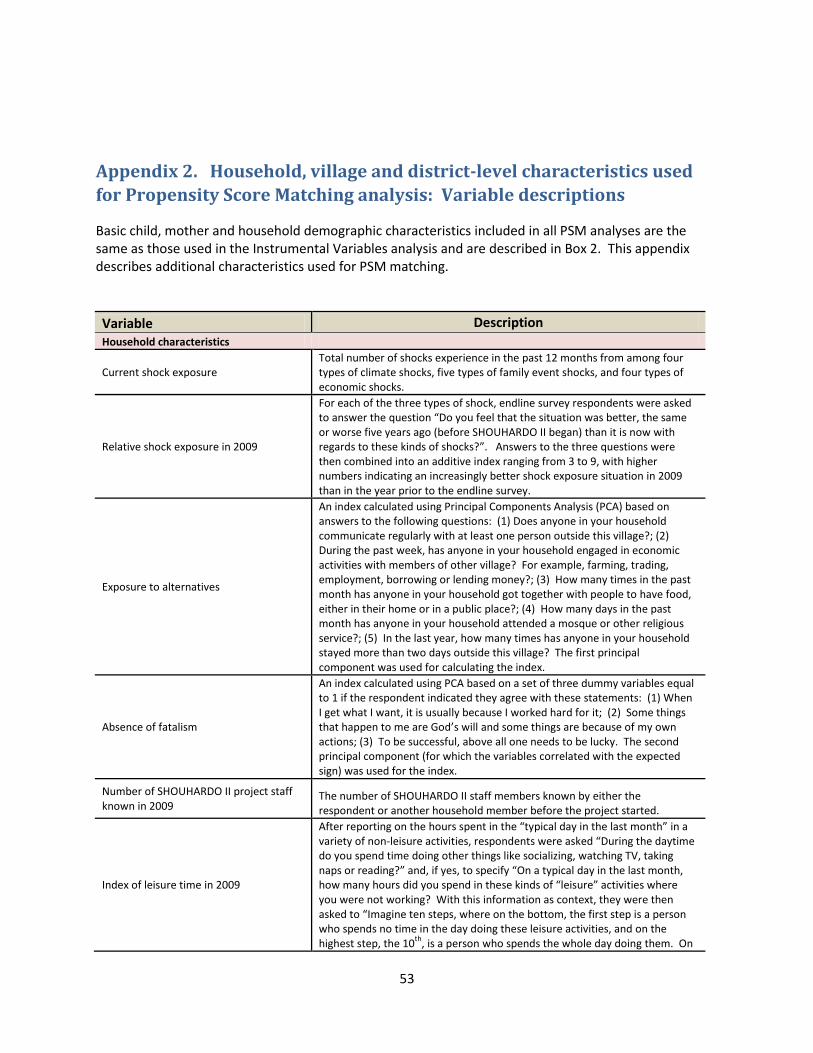
53
Appendix 2. Household, village and district-level characteristics used
for Propensity Score Matching analysis: Variable descriptions
Basic child, mother and household demographic characteristics included in all PSM analyses are the same as those used in the Instrumental Variables analysis and are described in Box 2. This appendix describes additional characteristics used for PSM matching.
Variable Description
Household characteristics
Current shock exposure Total number of shocks experience in the past 12 months from among four types of climate shocks, five types of family event shocks, and four types of economic shocks.
Relative shock exposure in 2009
For each of the three types of shock, endline survey respondents were asked to answer the question “Do you feel that the situation was better, the same or worse five years ago (before SHOUHARDO II began) than it is now with regards to these kinds of shocks?”. Answers to the three questions were then combined into an additive index ranging from 3 to 9, with higher numbers indicating an increasingly better shock exposure situation in 2009 than in the year prior to the endline survey.
Exposure to alternatives
An index calculated using Principal Components Analysis (PCA) based on answers to the following questions: (1) Does anyone in your household communicate regularly with at least one person outside this village?; (2) During the past week, has anyone in your household engaged in economic activities with members of other village? For example, farming, trading, employment, borrowing or lending money?; (3) How many times in the past month has anyone in your household got together with people to have food, either in their home or in a public place?; (4) How many days in the past month has anyone in your household attended a mosque or other religious service?; (5) In the last year, how many times has anyone in your household stayed more than two days outside this village? The first principal component was used for calculating the index.
Absence of fatalism
An index calculated using PCA based on a set of three dummy variables equal to 1 if the respondent indicated they agree with these statements: (1) When I get what I want, it is usually because I worked hard for it; (2) Some things that happen to me are God’s will and some things are because of my own actions; (3) To be successful, above all one needs to be lucky. The second principal component (for which the variables correlated with the expected sign) was used for the index.
Number of SHOUHARDO II project staff known in 2009
The number of SHOUHARDO II staff members known by either the respondent or another household member before the project started.
Index of leisure time in 2009
After reporting on the hours spent in the “typical day in the last month” in a variety of non-leisure activities, respondents were asked “During the daytime do you spend time doing other things like socializing, watching TV, taking naps or reading?” and, if yes, to specify “On a typical day in the last month, how many hours did you spend in these kinds of “leisure” activities where you were not working? With this information as context, they were then asked to “Imagine ten steps, where on the bottom, the first step is a person who spends no time in the day doing these leisure activities, and on the highest step, the 10
th, is a person who spends the whole day doing them. On

54
Variable Description a typical day in the last month, which step were you on?”. The respondent was shown a picture of a ladder with ten steps to point to. Finally, they were asked “Which step were you on five years ago (before SHOUHARDO II began?”. The answer to this question, ranging from 1 to 10, was used as an index of leisure time in 2009.
Index of leisure time of child’s mother in 2009
Calculated as above, but for the index child’s mother.
Decision making score of a women in the household in 2009
An adult women in the household was asked questions (without men present) about her ability to take part in 12 types of decisions, ranging from buying small food items, to moving to a shelter during a time of disaster. The possible responses were: Can decide alone, can decide with husband or other adult male family member, husband makes decision after discussion with wife, not involved in decision. The responses were used to create an index based on the mean across the various types of decisions, with only those included that the woman felt was applicable to her situation. Scores were calculated only for women reporting that at least five types of decisions were applicable to her situation.
Decision making score of child’s mother in 2009
Calculated as above, but for the index child’s mother.
Participation in other interventions For each type of the four types of intervention, participation in other interventions is measured using three dummy variables equal to one if the household participated in the intervention and zero otherwise.
Receipt of a food ration from another project
A dummy variable equal to one if the household received a food ration from a project other than the SHOUHARDO II project.
Village characteristics
Classified as extremely vulnerable at baseline
Dummy variable equal to one if the village was classified as extremely vulnerable by project administrators at baseline.
Total number of households Total number of households in the village.
Whether CARE is the implementing NGO Dummy variable equal to one if CARE is the implementing agency for the village (as opposed to another of the 16 Bangladeshi implementing NGOs).
Whether the nearest town is greater than one walking hour away
Average across households in the village of a dummy variable equal to one if household reports that the nearest town is greater than one hour away by walking.
PM2A village Dummy variable equal to one if the village was randomly assigned to the PM2A intervention arm.
District mean child nutritional status at baseline
District mean HAZ at baseline Mean HAZ across households in each district calculated using the baseline survey data.
District mean WHZ at baseline Mean WHZ across households in each district calculated using the baseline survey data.

55
Appendix 3. Instruments employed for Instrumental Variables tests and
2SLS regressions
Table 15: Instrumental variables used for endogeneity testing and 2SLS estimates of the impact of participation in the SHOUHARDO II project
Planned treatment status of
household
Household located in a PM2A village
Number of
project staff
knew in 2009
More than a 1
hour walk to nearest
town
More than a 2
hour walk to Upazila head-
quarters
Friend/ relative
of Upazila elected leader
Absence of
fatalism index
Shock exposure
& relative shock
exposure in 2009
Household food security Number of months of adequate food, household hunger score x x x
Household dietary diversity x x x Caring practices for mothers during pregnancy
Antenatal care during pregnancy x x X
Antenatal care in a medical facility x x
More food during pregnancy x x
More daytime rest during pregnancy x x x x
Vitamin A within 6 weeks of delivery x x
Iron/folic acid during pregnancy x x x
Caring practices for children Hand washing at five critical times, safe disposal of feces x x x
No. of vaccinations received, Vitamin A in last 6 m, Multivitamin x x x
Household health environment
Access to safe water x x x
Access to an improved toilet facility x x x Mother's and children's food consumption
Mother's dietary diversity x x x Minimum dietary diversity, acceptable diet x x x
Minimum meal frequency (6-23m) x x x
Children's health
Diarrhea in last two weeks (0-59m) x x x Mother's nutritional status and food consumption
Mother's Body Mass Index IV set 1 x x x x
Mother's Body Mass Index IV set 2 x x
Child height-for-age z-score
x x
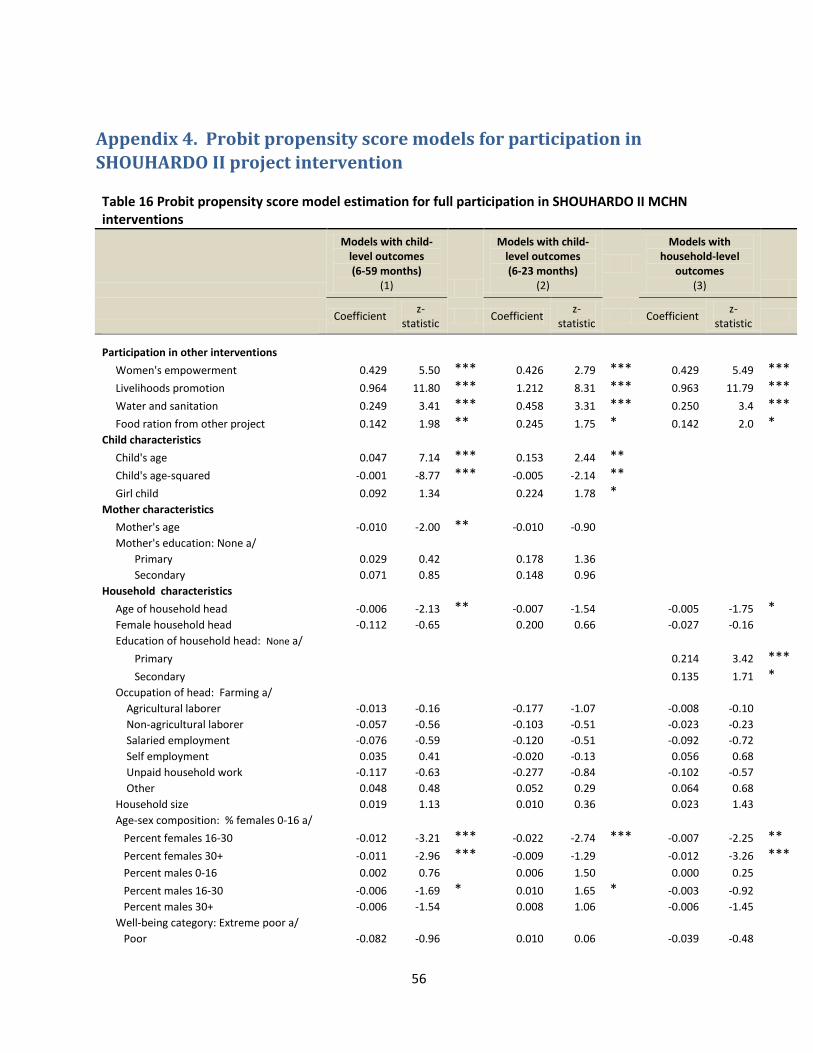
56
Appendix 4. Probit propensity score models for participation in
SHOUHARDO II project intervention Table 16 Probit propensity score model estimation for full participation in SHOUHARDO II MCHN interventions
Models with child-level outcomes (6-59 months)
(1)
Models with child-level outcomes (6-23 months)
(2)
Models with household-level
outcomes (3)
Coefficient
z-statistic
Coefficient z-
statistic Coefficient
z-statistic
Participation in other interventions Women's empowerment 0.429 5.50 *** 0.426 2.79 *** 0.429 5.49 ***
Livelihoods promotion 0.964 11.80 *** 1.212 8.31 *** 0.963 11.79 ***
Water and sanitation 0.249 3.41 *** 0.458 3.31 *** 0.250 3.4 ***
Food ration from other project 0.142 1.98 ** 0.245 1.75 * 0.142 2.0 * Child characteristics
Child's age 0.047 7.14 *** 0.153 2.44 ** Child's age-squared -0.001 -8.77 *** -0.005 -2.14 ** Girl child 0.092 1.34
0.224 1.78 *
Mother characteristics Mother's age -0.010 -2.00 ** -0.010 -0.90
Mother's education: None a/ Primary 0.029 0.42
0.178 1.36
Secondary 0.071 0.85
0.148 0.96
Household characteristics Age of household head -0.006 -2.13 ** -0.007 -1.54
-0.005 -1.75 *
Female household head -0.112 -0.65
0.200 0.66
-0.027 -0.16
Education of household head: None a/ Primary
0.214 3.42 ***
Secondary
0.135 1.71 * Occupation of head: Farming a/
Agricultural laborer -0.013 -0.16
-0.177 -1.07
-0.008 -0.10
Non-agricultural laborer -0.057 -0.56
-0.103 -0.51
-0.023 -0.23
Salaried employment -0.076 -0.59
-0.120 -0.51
-0.092 -0.72
Self employment 0.035 0.41
-0.020 -0.13
0.056 0.68
Unpaid household work -0.117 -0.63
-0.277 -0.84
-0.102 -0.57
Other 0.048 0.48
0.052 0.29
0.064 0.68
Household size 0.019 1.13
0.010 0.36
0.023 1.43
Age-sex composition: % females 0-16 a/ Percent females 16-30 -0.012 -3.21 *** -0.022 -2.74 *** -0.007 -2.25 **
Percent females 30+ -0.011 -2.96 *** -0.009 -1.29
-0.012 -3.26 ***
Percent males 0-16 0.002 0.76
0.006 1.50
0.000 0.25
Percent males 16-30 -0.006 -1.69 * 0.010 1.65 * -0.003 -0.92
Percent males 30+ -0.006 -1.54
0.008 1.06
-0.006 -1.45
Well-being category: Extreme poor a/ Poor -0.082 -0.96
0.010 0.06
-0.039 -0.48

57
Lower middle -0.129 -1.01
0.128 0.54
-0.113 -0.93
Middle -0.208 -1.51
-0.196 -0.79
-0.151 -1.15
Rich -0.081 -0.49
-0.248 -0.80
-0.141 -0.89
Region: Coast a/ Haor 0.106 1.13
-0.036 -0.21
0.179 2.02 **
Mid Char 0.524 5.35 *** 0.530 2.83 *** 0.547 5.88 ***
North Char 0.585 6.28 *** 0.679 3.84 *** 0.535 6.09 *** Village characteristics
Classified as extremely vulnerable 0.054 0.89
0.070 0.61
0.084 1.45
Total number of households 0.000 -1.19
0.000 -0.37
0.000 -1.35
CARE is implementing NGO -0.058 -0.46
-0.065 -0.25
-0.034 -0.28
Nearest town > 1 hour away -0.001 -0.49
-0.001 -0.28
0.000 -0.50
PM2A village 0.394 7.08 *** 0.513 4.95 *** 0.360 6.78 *** Other potential participation determinants
Current shock exposure -0.025 -1.14
-0.001 -0.02
-0.032 -1.53
Relative shock exposure in 2009 -0.048 -3.35 *** -0.082 -2.96 *** -0.047 -3.49 *** Bonding social capital (index) -0.019 -0.67
-0.054 -0.99
-0.023 -0.85
Relative bonding social capital in 2009 0.136 3.82 *** 0.188 2.79 *** 0.127 3.72 *** Exposure to alternatives (index) -0.063 -0.27
-0.202 -0.46
-0.015 -0.07
Absence of fatalism (index) 0.017 0.56
0.003 0.05
0.030 1.08
Number of project staff known (2009) 0.032 2.29 ** 0.002 0.08
0.026 1.97 **
Mother's leisure time index (2009) 0.014 1.05
-0.044 -1.72 * 0.012 0.93
Decision making score of mother (2009) 0.004 0.28
-0.002 -0.06
0.002 0.16
District mean child nutritional status (2009) Height-for-age z-score -0.356 -1.96 * -0.590 -1.48
-0.242 -1.40
Weight-for-height z-score -0.290 -1.67 * -0.445 -1.35
-0.234 -1.41
Number of observations
2,696
871
2,834
Pseudo R-squared 0.207 0.276 0.172 Notes: Stare represent statistical significance at the 1(*), 5%(**) and 1%(***) levels. Dependent variables employed for example models: (1) height-for-age z-score; (2) dummy variable for whether child received a vitamin A capsule in the last 6 months; (3) months of adequate household food provisioning.

58
Table 17 Probit propensity score model estimation for full participation in SHOUHARDO II women’s
empowerment interventions
Models with child-level
outcomes
(6-59 months)
(1)
Models with child-level
outcomes
(6-23 months)
(2)
Models with
household-level
outcomes
(3)
Coefficient z-statistic Coefficient z-statistic Coefficient z-statistic
Participation in other interventions MCHN 0.905 6.72 *** 1.067 4.01 *** 0.903 6.92 ***
Livelihoods promotion 0.467 4.30 *** 0.409 2.14 ** 0.454 4.29 ***
Water and sanitation 0.139 1.69 * 0.105 0.68
0.152 1.91 *
Food ration from other project -0.156 -1.87 * -0.298 -1.82 * -0.140 -1.72 * Child characteristics
Child's age 0.014 1.73 * -0.070 -0.95
Child's age-squared 0.000 -1.82 * 0.002 0.78
Girl child -0.067 -0.83
-0.061 -0.41
Mother characteristics Mother's age -0.002 -0.25
0.014 1.01
Mother's education: None a/ Primary 0.109 1.37
0.208 1.39
Secondary 0.050 0.50
0.173 0.95
Household characteristics Age of household head 0.001 0.38
-0.004 -0.56
0.002 0.48
Female household head 0.297 1.45
0.904 2.44 ** 0.319 1.64
Education of household head: None a/ Primary
0.071 0.95
Secondary
-0.032 -0.32
Occupation of head: Farming a/ Agricultural laborer 0.160 1.60
0.485 2.60 *** 0.126 1.30
Non-agricultural laborer 0.081 0.68
0.255 1.11
0.073 0.63
Salaried employment 0.024 0.15
-0.570 -1.68 * 0.090 0.57
Self employment 0.032 0.31
0.100 0.53
0.026 0.26
Unpaid household work -0.206 -0.92
-0.615 -1.51
-0.202 -0.95
Other -0.129 -1.03
-0.240 -0.98
-0.130 -1.06
Household size -0.003 -0.12
0.005 0.13
0.000 -0.02
Age-sex composition: % females 0-16 a/ Percent females 16-30 -0.011 -2.18 ** -0.012 -1.21
-0.009 -2.19 **
Percent females 30+ -0.010 -2.10 ** -0.019 -2.04 ** -0.010 -2.21 **
Percent males 0-16 -0.001 -0.40
0.002 0.54
0.000 0.11
Percent males 16-30 0.002 0.48
0.004 0.55
0.003 0.74
Percent males 30+ 0.008 1.51
0.023 2.43 ** 0.009 1.84 *
Well-being category: Extreme poor a/ Poor -0.091 -0.92
0.076 0.38
-0.047 -0.49
Lower middle -0.298 -1.75 * 0.040 0.13
-0.271 -1.63
Middle -0.094 -0.53
0.108 0.34
-0.054 -0.31
Rich -0.616 -2.24 ** -0.370 -0.69
-0.493 -1.92 *

59
Region: Coast a/ Haor -0.221 -1.96 * -0.531 -2.33 ** -0.156 -1.43
Mid Char -0.088 -0.74
-0.132 -0.60
-0.075 -0.65
North Char -0.014 -0.13
-0.042 -0.21
0.002 0.02
Village characteristics Classified as extremely vulnerable -0.169 -2.34 ** -0.043 -0.31
-0.173 -2.45 **
Total number of households 0.000 -3.75 *** 0.000 -1.39
0.000 -3.55 ***
CARE is implementing agency 0.286 2.00 ** 0.908 3.28 *** 0.313 2.25 ** Nearest town > 1 hour away -0.001 -0.66
-0.002 -0.94
-0.001 -0.85
PM2A village 0.109 1.64
0.201 1.60
0.120 1.83 *
Other potential participation determinants Current shock exposure 0.036 1.40
0.019 0.37
0.037 1.46
Relative shock exposure in 2009 0.054 3.26 *** 0.099 3.13 *** 0.055 3.47 ***
Bonding social capital (index) 0.090 2.56 ** 0.109 1.62
0.081 2.37 **
Relative bonding social capital in 2009 -0.035 -0.83
-0.011 -0.13
-0.022 -0.54
Exposure to alternatives (index) 0.207 0.73
0.585 1.13
0.188 0.68
Absence of fatalism (index) -0.004 -0.11
-0.084 -1.29
-0.011 -0.31
Number of project staff known (2009) 0.027 1.73 * -0.011 -0.36
0.027 1.76 *
Mother's leisure time index (2009) 0.009 0.58
0.040 1.29
0.004 0.26
Decision making score of mother (2009) 0.002 0.12
-0.024 -0.75
0.003 0.21
District mean child nutritional status (2009) Height-for-age z-score 0.081 0.36
-0.040 -0.08
0.172 0.77
Weight-for-height z-score -0.112 -0.53
0.034 0.08
-0.014 -0.07
Number of observations
2,696
871
2,834
Pseudo R-squared 0.124 0.186 0.120 Notes: Stare represent statistical significance at the 105**), 5%(**) and 1%(***) levels. Dependent variables employed for example models: (1) height-for-age z-score; (2) dummy variable for whether child received a vitamin A capsule in the last 6 months; (3) months of adequate household food provisioning.

60
Table 18: Probit propensity score model estimation for participation in livelihoods promotion interventions
Models with child-level outcomes (6-59 months)
(1)
Models with child-level outcomes (6-23 months)
(2)
Models with household-level
outcomes (3)
Coefficient
z-statistic
Coefficient z-
statistic Coefficient
z-statistic
Participation in other interventions MCHN 1.140 12.62 *** 1.420 8.03 *** 1.143 13.21 ***
Women's empowerment 0.452 4.14 *** 0.435 2.19 ** 0.450 4.23 ***
Water and sanitation 0.519 5.07 *** 0.301 1.65 * 0.481 4.92 ***
Food ration from other project 0.237 2.44 ** 0.142 0.75
0.228 2.44 **
Child characteristics Child's age -0.002 -0.27
-0.088 -1.07
Child's age-squared 0.000 0.71
0.003 1.23
Girl child -0.050 -0.55
-0.121 -0.70
Mother characteristics Mother's age 0.012 1.81 * 0.011 0.79
Mother's education: None a/ Primary -0.029 -0.33
-0.163 -0.98
Secondary -0.192 -1.83 * -0.238 -1.21
Household characteristics Age of household head 0.017 4.48 *** 0.017 2.57 *** 0.013 3.68 ***
Female household head 0.189 0.90
0.161 0.39
0.163 0.80
Education of household head: None a/ Primary
-0.242 -3.09 ***
Secondary
-0.306 -3.01 *** Occupation of head: Farming a/
Agricultural laborer 0.215 1.93 * 0.457 2.12 ** 0.203 1.90 * Non-agricultural laborer 0.053 0.42
0.160 0.63
0.080 0.64
Salaried employment -0.010 -0.06
-0.106 -0.35
0.064 0.38
Self employment 0.024 0.22
0.231 1.12
0.046 0.43
Unpaid household work 0.056 0.24
0.026 0.06
-0.010 -0.04
Other 0.126 0.97
-0.060 -0.25
0.156 1.24
Household size 0.017 0.77
0.002 0.07
0.009 0.44
Age-sex composition: % females 0-16 a/ Percent females 16-30 -0.008 -1.65 * -0.014 -1.32
-0.013 -2.99 ***
Percent females 30+ -0.003 -0.56
-0.009 -0.89
-0.002 -0.41
Percent males 0-16 -0.003 -1.03
-0.008 -1.54
-0.001 -0.70
Percent males 16-30 -0.012 -2.83 *** -0.010 -1.24
-0.013 -3.27 ***
Percent males 30+ -0.002 -0.48
0.007 0.69
-0.003 -0.53
Well-being category: Extreme poor a/ Poor 0.172 1.66 * 0.369 1.91 * 0.200 2.00 **
Lower middle -2.236 -15.18 *** -2.386 -8.28 *** -2.147 -15.17 ***
Middle -2.278 -13.67 *** -1.991 -6.69 *** -2.119 -13.41 ***
Rich -2.975 -10.38 *** -3.138 -5.35 *** -2.765 -10.56 *** Region: Coast a/
Haor 0.430 3.38 *** 0.375 1.50
0.320 2.64 ***
Mid Char -0.162 -1.32
-0.426 -1.75 * -0.179 -1.51
North Char -0.077 -0.66
-0.196 -0.86
-0.111 -1.00

61
Table 18: Probit propensity score model estimation for participation in livelihoods promotion interventions
Models with child-level outcomes (6-59 months)
(1)
Models with child-level outcomes (6-23 months)
(2)
Models with household-level
outcomes (3)
Coefficient
z-statistic
Coefficient z-
statistic Coefficient
z-statistic
Village characteristics Classified as extremely vulnerable -0.081 -1.05
0.054 0.35
-0.054 -0.73
Total number of households 0.000 0.05
0.000 1.05
0.000 0.09
CARE is implementing agency 0.066 0.39
-0.289 -0.86
0.026 0.16
Nearest town > 1 hour away 0.001 1.04
0.002 0.84
0.001 1.19
PM2A village -0.148 -2.03 ** -0.142 -1.02
-0.165 -2.35 **
Other potential participation determinants Current shock exposure 0.027 1.00
-0.009 -0.16
0.035 1.30
Relative shock exposure in 2009 0.007 0.37
-0.043 -1.17
0.010 0.53
Bonding social capital (index) -0.051 -1.43
0.011 0.16
-0.061 -1.76 *
Relative bonding social capital in 2009 0.181 4.12 *** 0.213 2.52 ** 0.190 4.40 *** Exposure to alternatives (index) 0.441 1.43
0.415 0.72
0.364 1.23
Absence of fatalism (index) -0.042 -1.15
-0.049 -0.68
-0.039 -1.12
Number of project staff known (2009) 0.031 1.70
0.024 0.73
0.036 2.08 **
Leisure time index (2009) 0.023 1.32
0.061 1.85 * 0.015 0.90
Women's decision making score (2009) 0.056 3.02 *** 0.096 2.65 *** 0.064 3.56 *** District mean child nutritional status (2009)
Height-for-age z-score 0.465 1.94 ** 0.840 1.47
0.294 1.29
Weight-for-height z-score -0.039 -0.17
-0.013 -0.03
-0.064 -0.28
Number of observations
2,696
843
2,834
Pseudo R-squared 0.529 0.565 0.521 Notes: Stars represent statistical significance at the 10%(*), 5%(**) and 1%(***) levels. Dependent variables employed for example models: (1) height-for-age z-score; (2) dummy variable for whether child has minimum dietary diversity; (3) months of adequate household food provisioning.

62
Table 19: Probit propensity score model estimation for participation in water and sanitation interventions
Models with child-level outcomes (6-59 months)
(1)
Models with child-level outcomes (6-23 months)
(2)
Models with household-level
outcomes (3)
Coefficient
z-statistic
Coefficient z-
statistic Coefficient
z-statistic
Participation in other interventions MCHN 0.568 5.30 *** 0.541 5.27 *** 0.539 5.28 ***
Women's empowerment 0.144 1.70 * 0.153 1.85 * 0.149 1.81 *
Livelihoods promotion 0.522 4.72 *** 0.482 4.57 *** 0.484 4.61 ***
Food ration from other project 0.244 3.14 *** 0.248 3.28 *** 0.248 3.29 *** Child characteristics
Child's age -0.001 -0.18
-0.001 -0.12
Child's age-squared 0.000 0.14
0.000 0.19
Girl child 0.096 1.21
0.100 1.30
Mother characteristics Mother's age 0.005 0.81
0.005 0.87
Mother's education: None a/ Primary -0.193 -2.50
-0.174 -2.33 **
Secondary -0.157 -1.63
-0.141 -1.50
Household characteristics Age of household head 0.003 0.95
0.002 0.72
0.002 0.70
Female household head -0.004 -0.02
0.074 0.39
0.075 0.39
Education of household head: None a/ Primary
-0.085 -1.16
Secondary
-0.051 -0.53
Occupation of head: Farming a/ Agricultural laborer -0.287 -2.86 *** -0.265 -2.74 *** -0.250 -2.60 ***
Non-agricultural laborer -0.135 -1.14
-0.137 -1.19
-0.132 -1.16
Salaried employment -0.227 -1.39
-0.284 -1.77 * -0.288 -1.75 *
Self employment -0.076 -0.77
-0.075 -0.78
-0.082 -0.86
Unpaid household work 0.010 0.04
-0.073 -0.36
-0.077 -0.37
Other -0.241 -2.04 ** -0.245 -2.12 ** -0.260 -2.26 ** Household size 0.010 0.52
0.017 0.90
0.013 0.73
Age-sex composition: % females 0-16 a/ Percent females 16-30 0.005 1.08
0.004 0.88
0.000 -0.04
Percent females 30+ -0.006 -1.23
-0.005 -1.12
-0.006 -1.42
Percent males 0-16 -0.002 -0.91
-0.002 -0.93
-0.004 -2.18 **
Percent males 16-30 -0.003 -0.65
-0.001 -0.18
-0.003 -0.86
Percent males 30+ -0.006 -1.15
-0.003 -0.66
-0.005 -1.11
Well-being category: Extreme poor a/ Poor 0.275 2.59 *** 0.241 2.37 ** 0.239 2.36 **
Lower middle 0.321 1.94 * 0.229 1.44
0.227 1.43
Middle 0.380 2.13 ** 0.288 1.69 * 0.280 1.65 * Rich 0.263 1.16
0.128 0.58
0.139 0.64
Region: Coast a/ Haor -0.004 -0.04
-0.013 -0.13
-0.027 -0.28
Mid Char -0.776 -6.23 *** -0.825 -6.78 *** -0.850 -7.08 ***

63
Table 19: Probit propensity score model estimation for participation in water and sanitation interventions
Models with child-level outcomes (6-59 months)
(1)
Models with child-level outcomes (6-23 months)
(2)
Models with household-level
outcomes (3)
Coefficient
z-statistic
Coefficient z-
statistic Coefficient
z-statistic
North Char -0.491 -4.44 *** -0.558 -5.17 ** -0.579 -5.45 *** Village characteristics
Classified as extremely vulnerable 0.045 0.63
0.032 0.47
0.030 0.43
Total number of households 0.000 2.91 *** 0.000 2.89 *** 0.000 2.94 ***
CARE is implementing agency -1.000 -5.16 *** -1.005 -5.25 *** -1.013 -5.28 ***
Nearest town > 1 hour away -0.003 -2.64 *** -0.003 -2.55 ** -0.003 -2.59 ***
PM2A village 0.207 3.15 *** 0.199 3.11 *** 0.193 3.02 *** Other potential participation determinants
Current shock exposure 0.024 0.88
0.027 1.04
0.030 1.14
Relative shock exposure in 2009 -0.076 -4.23 *** -0.070 -4.08 *** -0.069 -4.01 *** Bonding social capital (index) 0.000 -0.01
-0.006 -0.17
-0.008 -0.24
Relative bonding social capital in 2009 -0.004 -0.11
0.003 0.08
0.004 0.11
Exposure to alternatives (index) 0.003 0.01
-0.049 -0.18
-0.038 -0.14
Absence of fatalism (index) -0.033 -0.89
-0.022 -0.62
-0.024 -0.69
Number of project staff known (2009) 0.069 4.29 *** 0.068 4.32 *** 0.068 4.35 *** Leisure time index (2009) 0.016 1.00
0.020 1.30
0.018 1.14
Women's decision making score (2009) -0.022 -1.31
-0.028 -1.69 * -0.028 -1.68 *
District mean child nutritional status (2009) Height-for-age z-score -0.824 -4.08 *** -0.753 -3.90 *** -0.740 -3.87 ***
Weight-for-height z-score 0.928 4.86 *** 0.909 4.90 *** 0.931 5.07 ***
Number of observations
2,696
2824
2,834
Pseudo R-squared 0.223 0.218 0.215 Notes: Stars represent statistical significance at the 10%(*), 5%(**) and 1%(***) levels. Dependent variables employed for example models: (1) height-for-age z-score; (2) whether child under five had diarrhea in the last two weeks; (3) whether mother has knowledge of five critical times for hand washing.
64
References Ballard, Terri, Coates, Jennifer; Swindale, Anne, and Deitchler, Megan. 2011. Household Hunger Scale: Indicator Definition and Measurement Guide. Washington, DC: Food and Nutrition Technical Assistance II Project, FHI 360. Baum, C. F., Schaffer, M. E., & Stillman, S. 2007. Enhanced routines for instrumental variables/generalized method of moments estimation and testing. The Stata Journal, 7(4), 464–506. Bazzi, S., & Clemens, M. A. 2013. Blunt instruments: Avoiding common pitfalls in identifying the causes of economic growth. American Economic Journal: Macroeconomics, 5(2), 152–186. Bhutta, Z. A., Das, J. K., Rizvi, A., Gaffey, M. F., Walker, N., Horton, S., et al. 2013. Evidence-based interventions for improvement of maternal and child nutrition: What can be done and at what cost?. The Lancet. Bilinsky, Paula and Anne Swindale. 2010. Months of Adequate Household Food Provisioning (MAHFP) for Measurement of Household Food Access: Indicator Guide (v.4). Washington, D.C.: FHI 360/FANTA Black, R. E., Victora, C. G., Walker, S. P., Bhutta, Z. A., Christian, P., de Onis, M., et al. 2013. Maternal and child undernutrition and overweight in low-income and middle-income countries. The Lancet. Caldwell, Richard, Bruce Ravesloot and Lisa Smith. 2011. CARE Bangladesh SHOUHARDO II program: Baseline study report. TANGO, International, Tucson, AZ. de Onis, M., Garza, C., Victora, C. G., Bhan, M. K., & Norum, K. R.Guest editors. 2004. The WHO multicentre growth reference study (MGRS): Rationale, planning, and implementation. Food and Nutrition Bulletin, 25(1), S3–S84. FANTA-2. 2010. Title II Technical Reference Materials. TRM-01: Preventing Malnutrition in Children Under 2 Approach (PM2A): A Food-Assisted Approach. Revised November 2010. Washington, D.C.: Food and Nutrition Technical Assistance II Project (FANTA-2). Gillespie, S., Haddad, L., Mannar, V., Menon, P., & Nisbett, N. The Maternal and Child Nutrition Study Group. 2013. The politics of reducing malnutrition: Building commitment and accelerating progress. The Lancet, 382(9891), 552–569. Gilligan, D. O., & Hoddinott, J. 2007. Is there persistence in the impact of emergency food aid? Evidence on consumption, food security, and assets in rural Ethiopia. American Journal of Agricultural Economics, 89(2), 225-242. Habicht, J. P., Gretel, H., & Lapp, J. 2009. Methodologies to evaluate the impact of large scale nutrition programs. Doing Impact Evaluation, 13. Haddad, L. 2012. How can we build an enabling political environment to fight undernutrition? European Journal of Development Research, 25(1), 13–20.

65
Integrated Regional Information Network. 2010. Bangladesh: Towards “sanitation for all by 2010”. IRIN Asia. IRIN humanitarian news and analysis. Retrieved from: <http://www.irinnews.org/ Report.aspx?ReportID=77094>. Khandker, S. R., Koolwal, G. B., & Samad, H. A. 2010. Handbook on impact evaluation: Quantitative methods and practices. Washington, DC: The World Bank. Leuven, E., & Sianesi, B. 2003. PSMATCH2: Stata module to perform full Mahalanobis and propensity score
matching, common support graphing, and covariate imbalance testing. Version 3.1.5 2 May 2009.
Linnemayr, Sebastian and Harold Alderman. 2011. Almost random: Evaluating a large-scale randomized
nutrition program in the presence of crossover. Journal of Development Economics 96(1): 106-114.
National Institute of Population Research and Training (NIPORT), Mitra and Associates, and ICF International. 2013. Bangladesh Demographic and Health Survey 2011. Dhaka, Bangladesh and Calverton, Maryland, USA: NIPORT, Mitra and Associates, and ICF International.
National Institute of Population Research and Training (NIPORT), Mitra and Associates, and Macro International. 2009. Bangladesh Demographic and Health Survey 2007. Dhaka, Bangladesh and Calverton, Maryland, USA: National Institute of Population Research and Training, Mitra and Associates, and Macro International. National Institute of Population Research and Training (NIPORT), Mitra and Associates, and ORC Macro. 2005. Bangladesh Demographic and Health Survey 2004. Dhaka, Bangladesh and Calverton, Maryland [USA]: National Institute of Population Research and Training, Mitra and Associates, and ORC Macro.
Ruel, M. T., & Alderman, H. The Maternal and Child Nutrition Study Group. 2013. Nutrition-sensitive
interventions and programmes: How can they help to accelerate progress in improving maternal and child
nutrition? The Lancet.
Schaffer, M.E. 2010. xtivreg2: Stata module to perform extended IV/ 2SLS, GMM and AC/HAC, LIML and k-
class regression for panel data models. <http://ideas.repec.org/c/boc/bocode/s456501.html>.
Schaeffer, Mark E. 2012. Statalist discussion “ivreg questions”. March 19, 2012.
Shahin S, Bhadra SK and Ahsanul Alam M. Utilization of Essential Service Delivery (UESD) Survey 2013. 2014. Dhaka: National Institute of Population Research and Training (NIPORT). http://www.nfpcsp.org/agridrupal/sites/default/files/1385218571-UESD%20Survey%202013%20provisional%20report.pdf Smith, Lisa and Haddad, Lawrence. 2015. Reducing Child Undernutrition: Past Drivers and Priorities for the
Post-MDG Era. World Development. (68): 180-224.
Smith, L.C., Khan, F, Frankenberger, T.R., Wadud, A.K.M. Abdul. 2013. Admissible Evidence in the Court of
Development Evaluation? The Impact of CARE’s SHOUHARDO Project on Child Stunting in Bangladesh. World
Development (41): 196-216.

66
Smith, L. C., Ramakrishnan, U., Ndiaye, A., Haddad, L., & Martorell, R. 2003. The importance of women’s
status for child nutrition in developing countries. IFPRI Research Report #131. Washington, DC:
International Food Policy Research Institute.
Stock, J. H., & Yogo, M. 2005. Testing for weak instruments in Linear IV regression. In J. H. Stock, & D. W. K.
Andrews (Eds.), Identification and inference for econometric models: Essays in Honor of Thomas J.
Rothenberg. New York: Cambridge University Press.
Ten Have, Thomas R., Sharon-Lise T. Normand, Sue M. Marcus, C. Hendricks Brown, Philip Lavori, and
Haihua Duan. 2008. Intent-to-treat vs. non-intent-to-treat analyses under treatment non-adherence in
mental health randomized trials. Psychiatr Ann. 38(12): 772-783.
United Nations Children’s Fund (UNICEF). 2013. Improving child nutrition: The achievable imperative for
global progress. UNICEF: New York.
Waddington, Hugh, Howard White, Birte Snilstveit, Jorge Garcia Hombrados, Martina Vojtkova, Philip
Davies, Ami Bhavsar, John Eyers, Tracey Perez Koehlmoos, Mark Petticrew, Jeffrey C. Valentine and Peter
Tugwell. 2012. How to do a good systematic review of effects in international development: a tool kit.
Journal of Development Effectiveness 4(3): 359-387.
Wadud, Abdul. 2015. Personal email communication. February 8, 2015
World Bank. 2013. Improving nutrition through multisectoral approaches. Washington, DC: World Bank.
World Health Organization (WHO). 2008. Indicators for assessing infant and young childfeeding practices. World Health Organization, Geneva.