Quantitative evaluation of dual-energy digital mammography for calcification imaging
15
Quantitative evaluation of dual-energy digital mammography for calcification imaging This article has been downloaded from IOPscience. Please scroll down to see the full text article. 2004 Phys. Med. Biol. 49 2563 (http://iopscience.iop.org/0031-9155/49/12/007) Download details: IP Address: 152.15.236.17 The article was downloaded on 29/08/2013 at 08:26 Please note that terms and conditions apply. View the table of contents for this issue, or go to the journal homepage for more Home Search Collections Journals About Contact us My IOPscience
Transcript of Quantitative evaluation of dual-energy digital mammography for calcification imaging

Quantitative evaluation of dual-energy digital mammography for calcification imaging
This article has been downloaded from IOPscience. Please scroll down to see the full text article.
2004 Phys. Med. Biol. 49 2563
(http://iopscience.iop.org/0031-9155/49/12/007)
Download details:
IP Address: 152.15.236.17
The article was downloaded on 29/08/2013 at 08:26
Please note that terms and conditions apply.
View the table of contents for this issue, or go to the journal homepage for more
Home Search Collections Journals About Contact us My IOPscience

INSTITUTE OF PHYSICS PUBLISHING PHYSICS IN MEDICINE AND BIOLOGY
Phys. Med. Biol. 49 (2004) 2563–2576 PII: S0031-9155(04)72261-7
Quantitative evaluation of dual-energy digitalmammography for calcification imaging
S Cheenu Kappadath and Chris C Shaw
Department of Imaging Physics, The University of Texas M D Anderson Cancer Center, Houston,TX 77030, USA
E-mail: [email protected]
Received 18 November 2003, in final form 30 March 2004Published 26 May 2004Online at stacks.iop.org/PMB/49/2563DOI: 10.1088/0031-9155/49/12/007
AbstractDual-energy digital mammography (DEDM), where separate low- and high-energy images are acquired and synthesized to cancel the tissue structures,may improve the ability to detect and visualize microcalcifications. Underideal imaging conditions, when the mammography image data are free ofscatter and other biases, DEDM could be used to determine the thicknessesof the imaged calcifications. We present quantitative evaluation of aDEDM technique for calcification imaging. The phantoms used in theevaluation were constructed by placing aluminium strips of known thicknesses(to simulate calcifications) across breast-tissue-equivalent materials of differentglandular-tissue compositions. The images were acquired under narrow-beamgeometry and high exposures to suppress the detrimental effects of scatterand random noise. The measured aluminium thicknesses were found to beapproximately linear with the true aluminium thicknesses and independentof the underlying glandular-tissue composition. However, the dual-energyimages underestimated the true aluminium thickness due to the presence ofscatter from adjacent regions. Regions in the DEDM image that containedno aluminium yielded very low aluminium thicknesses (<0.07 mm). Thealuminium contrast-to-noise ratio in the dual-energy images increased withthe aluminium thickness and decreased with the glandular-tissue composition.The changes to the aluminium contrast-to-noise ratio and the contrastof the tissue structures between the low-energy and DEDM images are alsopresented.
1. Introduction
In mammography, the presence and morphology of microcalcification clusters may provideearly indications of breast cancer (Voegeli 1989). Microcalcifications are composed mainly
0031-9155/04/122563+14$30.00 © 2004 IOP Publishing Ltd Printed in the UK 2563

2564 S C Kappadath and C C Shaw
of calcium compounds that have greater x-ray attenuation than the surrounding breasttissue. However, visualization of microcalcifications may be obscured in mammograms byoverlapping tissue structures. Tissue structures in mammograms arise due to the differencesin the x-ray attenuation between adipose tissue, glandular tissue, ducts, vessels and soft-tissuemasses in the breast.
Dual-energy imaging, in which separate low- and high-energy images are acquired andsynthesized to cancel or reduce the contrast of tissue structures, may improve the visibilityof calcifications. The principles of dual-energy imaging have been discussed extensivelyin previous literature (Alvarez and Macovski 1976, Brody et al 1981a, Lehmann et al 1981,Johns and Yaffe 1985, Ishigaki et al 1986, Boone et al 1990, Cardinal and Fenster 1990,Ergun et al 1990, Shaw and Gur 1992, Breitenstein and Shaw 1998, Kappadath and Shaw2003). Its use has been investigated for several imaging procedures, including computedtomography (Alvarez and Macovski 1976, Brooks 1977, Rutt and Fenster 1980, Vetter et al1986), chest radiography (Brody et al 1981b, Lehmann et al 1981, Ishigaki et al 1986,Ergun et al 1990, Shaw and Gur 1992, Guillemaud et al 2001, Sabol et al 2001) andmammography (Johns et al 1985, Johns and Yaffe 1985, Chakraborty and Barnes 1989,Boone et al 1990, Boone 1991, Brettle and Cowen 1994, Asaga et al 1995, Breitensteinand Shaw 1998, Lemacks et al 2002, Kappadath and Shaw 2003). Most dual-energytechniques use a weighted subtraction technique (linear combination of the logarithmic low-and high-energy images) to generate the dual-energy images (Ishigaki et al 1986, Ergun et al1990, Boone 1991, Brettle and Cowen 1994, Asaga et al 1995). The linear subtraction method,although simple to implement, is prone to artefacts caused by residual tissue structures,because the dual-energy image formation process is fundamentally nonlinear in nature(Alvarez and Macovski 1976, Brody et al 1981, Johns and Yaffe 1985, Chuang and Huang1988, Cardinal and Fenster 1990, Kappadath and Shaw 2003).
Theoretical work in dual-energy mammography (Johns and Yaffe 1985, Chakrabortyand Barnes 1989, Boone et al 1990, Boone 1991, Breitenstein and Shaw 1998, Lemacks et al2002) has focused primarily on modelling of the calcification image generation process andinvestigating the effects of the x-ray spectra and detector on the signal-to-noise ratio in dual-energy images. There have been only two reports on experimental work in dual-energymammography for calcification imaging. Johns et al (1985) reported on a nonlinear dual-energy imaging technique with a prototype scanned projection digital radiography systemusing 50 and 110 kVp x-ray spectra. Their work demonstrated that dual-energy imagingof crushed bone chips placed under breast tissue samples could increase their visualizationby reducing the contrast of tissue structures, however, the applicability of their methods issomewhat limited because the prototype detector system and x-ray techniques used in theirstudy cannot be duplicated with current clinical mammography systems. Brettle and Cowen(1994) theoretically modelled and experimentally verified a dual-energy imaging techniquebased on linear subtraction by imaging aluminium discs of 1 mm diameter and differentthicknesses (to simulate calcifications) placed under 50% glandular and 50% adipose tissue-equivalent materials using a commercial computed radiography detector. They concluded thatdual-energy imaging could be used to image calcifications of size greater than ∼470 µm,significantly poorer than the traditional single-energy mammography. The low- andhigh-energy exposures were performed using two separate x-ray tubes with different anodetargets to optimize the energy spectral separation. However, the alignment and registrationof the two images were extremely difficult, rendering their method impractical for clinicaluse.
Under ideal imaging conditions, when the imaged subject can be well represented bytwo materials and the image data are free of scatter and other biases or artefacts, dual-energy

Dual-energy digital mammography 2565
imaging could be used to determine the projected thicknesses of the two different materials—similar to the requirement of two independent equations to solve for two unknown variables.It has been shown that the imaging of a compressed breast could be considered as a twomaterial imaging problem, namely, the calcification thickness and the breast tissue composition(Lemacks et al 2002, Kappadath and Shaw 2003).
Quantitative information from mammograms could supplement and enhance currentmammographic interpretation. For example, quantitative information on the thicknesses of thecalcifications imaged in the mammograms could be readily incorporated into computer-aideddetection algorithms. Quantitative information on the breast density of localized regions couldbe used in follow-up studies of suspicious regions on the mammograms. Finally, quantitativeinformation does not depend on the image display parameters and therefore is less prone toobserver misinterpretation.
Here we report on quantitative evaluation of a dual-energy digital mammography (DEDM)technique for calcification imaging. We use the calibrated nonlinear inverse-mappingtechnique of Kappadath and Shaw (2003) to generate the calcification image from separatelyacquired low- and high-energy images. The three imaging requirements to perform quantitativeevaluation of dual-energy images are that (1) the low- and high-energy images contain noscatter, (2) the imaged materials are identical to the materials used for the calibration of theinverse-mapping function, and (3) the image noise is relatively low. Due to these stringentrequirements quantitative evaluation of dual-energy calcification images is fundamentallydifficult and has not been performed previously. In order to optimize the imaging conditionsfor quantitative evaluation of DEDM, the low- and high-energy images in this work wereacquired under narrow-beam geometry to minimize the effects of scatter, the low- and high-energy x-ray exposures were not limited to screening levels to minimize the effects of randomnoise in the dual-energy images, and the imaged materials were identical to the materialsused for the calibration of the inverse-mapping function. It is important to note that we donot, in this study, try to determine the minimum detectable calcification using DEDM, butrather evaluate the quantitative information that could be extracted using DEDM under optimalimaging conditions.
The quantitative evaluation, in this work, was performed on images of two tissue-equivalent blocks with different glandular-tissue composition partially covered by analuminium strip, acquired under narrow-beam geometry using a commercially availableflat-panel-based mammography system. Because of the difficulty in making calcificationphantoms of uniform and precise thicknesses that are required for quantitative evaluation,machined aluminium strips were used to simulate the calcifications in this study. Calcifications(calcite and calcium oxalate) can be simulated by aluminium because they have similar x-rayattenuation properties in the mammographic energy regime. Various images with differentaluminium thicknesses and different tissue-equivalent blocks were acquired. Quantitativeevaluation of DEDM images was performed by comparing the measured dual-energyaluminium thicknesses to the imaged aluminium thicknesses.
Theoretical calculations have shown that the reduction in the contrast of tissue structureswith dual-energy imaging comes at the expense of decreased calcification contrast-to-noiseratio (Johns and Yaffe 1985, Boone et al 1990, Brettle and Cowen 1994, Lemacks et al 2002).The advantages of DEDM will depend on weighing the complicated interplay betweenthe benefits of removing the contrast of tissue structure against the drawback of reducedcalcification contrast-to-noise ratio. Calculations of image metrics that follow both the contrastof tissue structures and the aluminium contrast-to-noise ratio in the low-energy and DEDMimages are also presented.

2566 S C Kappadath and C C Shaw
2. Background
A breast of thickness T can be considered to be composed of three materials: adipose tissue(thickness ta), glandular tissue (thickness tg), and calcifications (thickness tc). The threeunknowns (material thicknesses) can also be expressed as total breast thickness (T ), glandularratio (gr = tg/(ta + tg)) and calcification thickness (tc). During mammography, the breast isusually compressed to a largely uniform thickness that can be easily measured. With the totalthickness (T) known, there are only two remaining unknowns: the glandular ratio (gr) and thecalcification thickness (tc).
If I0(E) is the incident photon fluence per unit energy, E, then the transmitted fluence perunit energy incident on the detector, I (E), is given by
I (E) = I0(E) exp(−µa(E)T − gr{µg(E) − µa(E)}T − µc(E)tc) (1)
where µa, µg, and µc are the linear attenuation coefficients of adipose tissue, glandular tissueand calcifications, respectively. The reference signal (S0) and transmitted signal (S) can beobtained by integrating the unattenuated and transmitted fluence, respectively, weighted bythe energy-dependent detector response over the photon spectrum at the detector. The log-signal function, D, defined as the natural logarithm of the ratio of the measured unattenuated(reference) signal, S0, over the transmitted signal, S, is given by
D(gr, tc) ≡ ln(S0/S)
= ln
(∫I0(E)Q(E) dE
/ ∫I0(E) exp(−µa(E)T
− gr{µg(E) − µa(E)}T − µc(E)tc)Q(E) dE
)(2)
where Q is the detector response (signal produced per x-ray photon detected). The log-signalis the average attenuation weighted by the incident x-ray spectrum and detector response. Indual-energy imaging, a second high-energy log-signal function must be measured, Dh(gr, tc),in addition to the low-energy log-signal function, Dl(gr, tc). The low- and high-energy log-signals are measured independently by using x-ray beams of different spectra (or kVp).
The goal of dual-energy calcification imaging is to convert the measured log-signalfunctions, Dl(gr , tc) and Dh(gr, tc), into the calcification thickness, tc(Dl,Dh) and glandularratio, gr(Dl,Dh). The use of poly-energetic x-ray spectra in diagnostic imaging and the energydependence of the x-ray attenuation result in a nonlinear relationship between [Dl, Dh] and[gr, tc], as depicted by equation (2). It has been shown that a cubic inverse-mapping function,described by
tc = c0 + c1Dl + c2Dh + c3D2l + c4D
2h + c5DlDh + c6D
3l + c7D
3h (3)
where ci are the coefficients of the cubic function, predetermined from separately acquiredcalibration data, could adequately model the calcification thickness as a function of thelow- and high-energy log-signal values (Kappadath and Shaw 2003).
3. Materials and methods
3.1. X-ray techniques used for imaging
A full-field digital mammography system (Senographe 2000D, GE Medical Systems,Milwaukee, WI) which uses an aSi:H flat-panel detector coupled with a CsI(Tl) converterlayer (Vedantham et al 2000), the only FDA approved full-field digital mammographic systemavailable at the time of this work, was used for calibration and imaging the test phantom.
Dual-energy digital mammography 2567
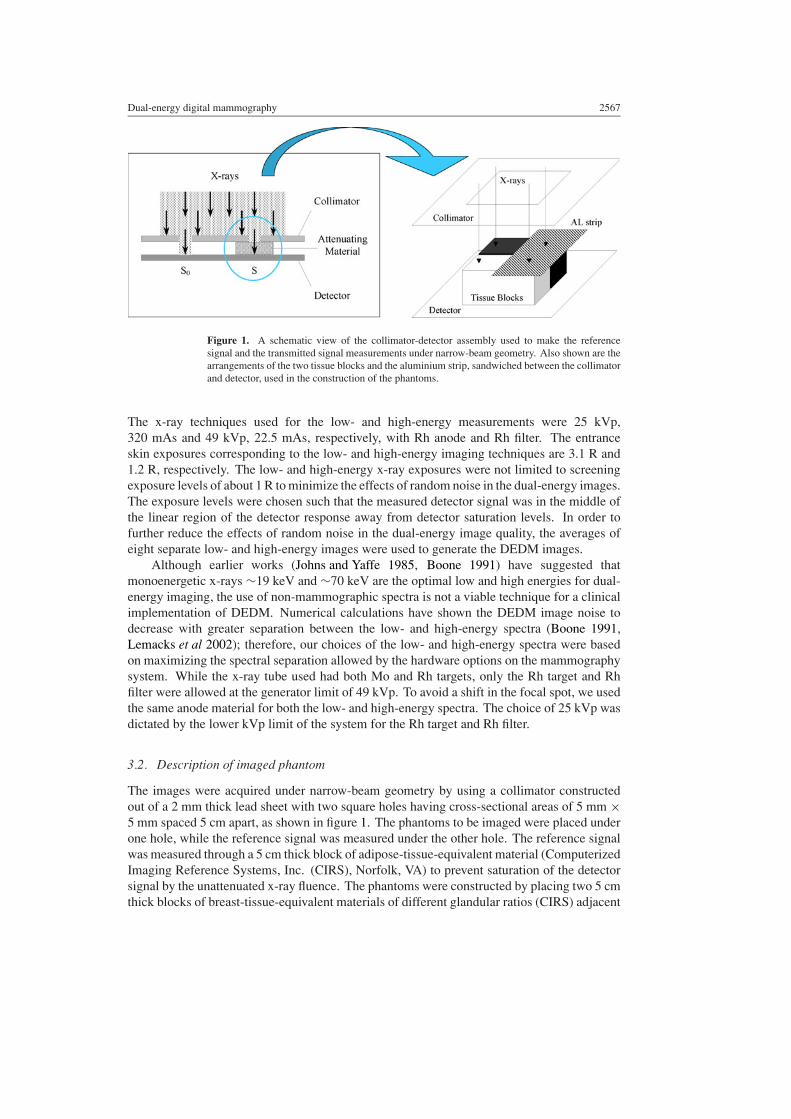
Figure 1. A schematic view of the collimator-detector assembly used to make the referencesignal and the transmitted signal measurements under narrow-beam geometry. Also shown are thearrangements of the two tissue blocks and the aluminium strip, sandwiched between the collimatorand detector, used in the construction of the phantoms.
The x-ray techniques used for the low- and high-energy measurements were 25 kVp,320 mAs and 49 kVp, 22.5 mAs, respectively, with Rh anode and Rh filter. The entranceskin exposures corresponding to the low- and high-energy imaging techniques are 3.1 R and1.2 R, respectively. The low- and high-energy x-ray exposures were not limited to screeningexposure levels of about 1 R to minimize the effects of random noise in the dual-energy images.The exposure levels were chosen such that the measured detector signal was in the middle ofthe linear region of the detector response away from detector saturation levels. In order tofurther reduce the effects of random noise in the dual-energy image quality, the averages ofeight separate low- and high-energy images were used to generate the DEDM images.
Although earlier works (Johns and Yaffe 1985, Boone 1991) have suggested thatmonoenergetic x-rays ∼19 keV and ∼70 keV are the optimal low and high energies for dual-energy imaging, the use of non-mammographic spectra is not a viable technique for a clinicalimplementation of DEDM. Numerical calculations have shown the DEDM image noise todecrease with greater separation between the low- and high-energy spectra (Boone 1991,Lemacks et al 2002); therefore, our choices of the low- and high-energy spectra were basedon maximizing the spectral separation allowed by the hardware options on the mammographysystem. While the x-ray tube used had both Mo and Rh targets, only the Rh target and Rhfilter were allowed at the generator limit of 49 kVp. To avoid a shift in the focal spot, we usedthe same anode material for both the low- and high-energy spectra. The choice of 25 kVp wasdictated by the lower kVp limit of the system for the Rh target and Rh filter.
3.2. Description of imaged phantom
The images were acquired under narrow-beam geometry by using a collimator constructedout of a 2 mm thick lead sheet with two square holes having cross-sectional areas of 5 mm ×5 mm spaced 5 cm apart, as shown in figure 1. The phantoms to be imaged were placed underone hole, while the reference signal was measured under the other hole. The reference signalwas measured through a 5 cm thick block of adipose-tissue-equivalent material (ComputerizedImaging Reference Systems, Inc. (CIRS), Norfolk, VA) to prevent saturation of the detectorsignal by the unattenuated x-ray fluence. The phantoms were constructed by placing two 5 cmthick blocks of breast-tissue-equivalent materials of different glandular ratios (CIRS) adjacent

2568 S C Kappadath and C C Shaw
to each other, with each occupying half of the collimated area. Next, an aluminium stripof known thickness was placed across the two tissue blocks so that it also occupied half ofthe collimated area, resulting in four distinct regions of interest (ROIs), each with a differentcombination of aluminium thickness and tissue composition, as shown in figure 1.
Machined aluminium was used to simulate the calcifications because of the difficultyin making uniform calcifications of precise thicknesses. Calcifications, composed mainlyof calcite and calcium oxalate (Fandos-Morera et al 1988), can be simulated by aluminiumbecause the ratios of their linear attenuation coefficients are about 0.6−0.8 for energies between20 and 50 keV, i.e., they have similar x-ray attenuation properties.
3.3. Phantom images
The imaged phantoms were designed to yield contrast between the two different glandular ratioregions with no aluminium present, representing the tissue structure, and contrast betweenregions with and without an aluminium strip over each of the two different glandular ratios,representing the calcification contrast. Two sets (series A and B) of phantom images wereacquired. Series A images were designed to investigate the performance of DEDM fordifferent aluminium thicknesses over tissue blocks containing a fixed pair of glandular ratios;aluminium thicknesses of 0.39, 0.78, 1.17, 1.56 and 1.95 mm were imaged over tissue blockswith glandular ratios of 0.25 and 0.75. Series B images were designed to investigate theperformance of DEDM for a fixed aluminium thickness over tissue blocks containing differentpairs of glandular ratios; aluminium thickness of 1.17 mm was imaged over tissue blocks pairsof glandular ratios 0.25 and 0.0, 0.25 and 0.5, 0.25 and 0.75, 0.25 and 1.0.
3.4. Construction of dual-energy aluminium images
With a detector pixel size of 0.1 mm and a collimator hole size of 5 mm × 5 mm (correspondingto a projected area of 5.4 mm × 5.4 mm in the detector plane), the low- and high-energy imagesignals were measured over a region of approximately 54 pixels × 54 pixels. The meanvalue from the central 11 pixels × 11 pixels under the reference spot was used to computethe reference signal for each image. Each of the four ROIs that formed the projected imagescorresponded to a region of about 27 pixels × 27 pixels. The machined collimated hole wasnot a perfect square, and the boundaries between the four ROIs were not perfectly aligned ineither the horizontal or the vertical directions. The central 22 pixels × 22 pixels of the fourROIs in each of the images were extracted and realigned to yield 44 pixels × 44 pixels low-and high-energy images. Henceforth, ROIs will refer to the 22 pixels × 22 pixels area, andimages will refer to the 44 pixels × 44 pixels images.
The image signals together with the reference signals were used to compute the low- andhigh-energy log-signal values using equation (2) on a pixel-by-pixel basis. The low- and high-energy log-signal values together with the calibrated cubic inverse-mapping function describedby equation (3) were used to compute the DEDM aluminium thicknesses on a pixel-by-pixelbasis. The coefficients of the cubic function were computed using the technique describedin Kappadath and Shaw (2003). The calibration of the cubic function used in this workwas performed for a breast-equivalent-tissue thickness of 5 cm and the reference signal wasmeasured through 5 cm of adipose-equivalent-tissue material. The median, root-mean-square(rms) and absolute-maximum residuals of the fit to the calibration data with the cubic functionwere −0.013, 0.096 and 0.247 mm, respectively.
Dual-energy digital mammography 2569
3.5. Quantitative measurements of the aluminium thickness
The mean and standard deviation of the pixel-by-pixel aluminium thickness values (mm) overeach ROI in the DEDM aluminium images were used to estimate the measured aluminiumthickness (S) and measurement errors (σ ), respectively. The S and σ values for the fourdifferent ROIs in the images are identified by the subscript nomenclature ‘AL/GR’, whereAL = 0, 0.39, 0.78, 1.17, 1.56 or 1.95 corresponding to the imaged aluminium thicknessin mm, and GR = 0.00, 0.25, 0.50, 0.75 or 1.00 corresponding to the glandular ratio of theunderlying tissue block.
For series A, we compared the aluminium thickness inferred using DEDM to the truealuminium thickness imaged over tissue blocks with glandular ratios of 0.25 and 0.75 (SAL/0.25
and SAL/0.75). The DEDM aluminium thicknesses were also computed for ROIs with noaluminium present (S0/0.25 and S0/0.75) to evaluate the residual aluminium thickness in theDEDM images. For series B, a comparison was made of the measured aluminium thicknessusing DEDM to the fixed aluminium thickness of 1.17 mm imaged over tissue blocks withdifferent glandular ratios (S1.17/GR). The DEDM aluminium thicknesses were also computedfor ROIs with no aluminium present over tissue blocks with different glandular ratios (S0/GR).
3.6. Image metric for evaluating image noise: the contrast-to-noise ratio
A standard metric used to evaluate the noise in the image is the contrast-to-noise ratio (CNR).The CNR for the aluminium strip of thickness AL over the tissue region with glandular ratioGR, CNRAL/GR, computed with respect to the noise in the same tissue region (σ 0/GR), is givenby
CNRAL/GR = (|SAL/GR − S0/GR|)/σ0/GR. (4)
The changes in the image noise between the low-energy image and dual-energy aluminiumimage have been tracked by computing and comparing the CNR for all the aluminium strips inboth the low- and dual-energy images over each of the two tissue blocks in series A data. Themean and standard deviation of the raw-pixel values (ADUs) over each ROI in the low-energyimages were used to estimate the measured low-energy signal and noise levels, respectively.In order to study the change in the CNR solely due to the underlying tissue composition,the dual-energy images from series B data were used to compute the CNR of the 1.17 mmaluminium strip over tissue blocks with different glandular ratios.
3.7. Image metric for evaluating tissue structures: the contrast-to-background ratio
The contrast due to tissue structures constitutes a fixed pattern background that couldinterfere with the detection and visualization of calcifications. Unlike the random noise, thecontrast due to tissue structures is independent of the exposure level and limits the detectionand visualization of calcifications with mammograms; similar to the situation with chestradiographs where the detection of subtle nodules is limited by the anatomical structures(Samei et al 1999). Although the interference due to the tissue structures cannot be easilyquantified, we compute an image metric referred to as the contrast-to-background ratio (CBR)(Lemacks et al 2002) to represent the level of tissue structure contrast in the images. The CBRis defined as the ratio of the contrast of the aluminium to the contrast of the tissue structures;therefore, a low CBR value implies a high contrast for the tissue structures leading to poorervisualization of the aluminium strip. The CBR for the aluminium strip of thickness AL over

2570 S C Kappadath and C C Shaw
-0.5
0
0.5
1
1.5
2
2.5
0 0.5 1 1.5 2 2.5
Image AL Thickness (mm)
Mea
sure
d A
L T
hic
knes
s (m
m) AL-True AL/0.25 AL/0.75
0/0.25 0/0.75
(a)
-0.4
0.0
0.4
0.8
1.2
1.6
-0.2 0 0.2 0.4 0.6 0.8 1 1.2
Image Glandular Ratio
Mea
sure
d A
L T
hic
knes
s (m
m) AL-True 1.17/GR 0/GR
(b)
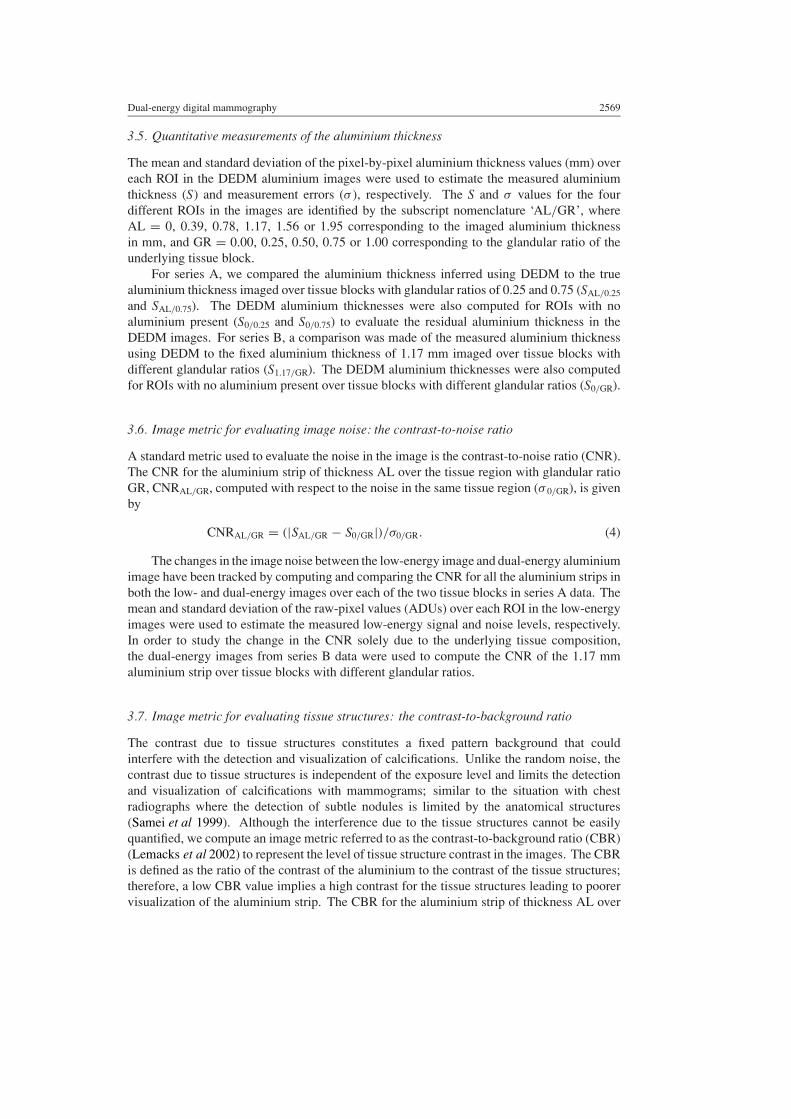
Figure 2. (a) The aluminium thickness (AL/0.25 and AL/0.75) and background level (0/0.25and 0/0.75) measured in the four ROIs in series A dual-energy aluminium images as a function ofthe image phantom aluminium thickness. The solid line (AL-true) represents the true aluminiumthickness. (b) The aluminium thickness (1.17/GR) and background level (0/GR) measured in thetwo ROIs with different glandular ratios in series B dual-energy aluminium images as a functionof the image phantom glandular ratio. The solid line (AL-true) represents the true aluminiumthickness of 1.17 mm.
the tissue regions with glandular ratios of GR1 and GR2 (CBRAL/GR1 and CBRAL/GR2) can becomputed with respect to the contrast over either of the two tissue regions as follows:
CBRAL/GR1 = (|SAL/GR1 − S0/GR1|)/(|S0/GR1 − S0/GR2|) (5)
CBRAL/GR2 = (|SAL/GR2 − S0/GR2|)/(|S0/GR1 − S0/GR2|). (6)
The changes in the contrast of the tissue structure between the low-energy image anddual-energy aluminium image have been tracked by computing and comparing the CBR forthe aluminium strips over each of the two tissue blocks in series A data.
4. Results
4.1. Measurements of the aluminium thickness in the dual-energy images
The measured aluminium thicknesses in the four ROIs of the DEDM aluminium series Aimages, namely SAL/0.25, SAL/0.75, S0/0.25, and S0/0.75, together with the measurement errors areplotted in figure 2(a) as a function of the imaged aluminium thickness. The aluminiumthickness measured with the DEDM images varied approximately linearly with the true(imaged) aluminium thickness. The aluminium thicknesses measured over glandular ratio0.25 (SAL/0.25) were consistently lower than the true thicknesses, while the aluminiumthicknesses over measured glandular ratio 0.75 (SAL/0.75) were lower than the true thicknessabove ∼1 mm. The difference between the true and measured aluminium thicknesses weregreater for SAL/0.25 than for SAL/0.75. In all cases, the aluminium thicknesses measured overregions with no aluminium (S0/0.25 and S0/0.75) yielded aluminium thicknesses near zero(<0.07 mm).
The measured aluminium thicknesses in the two relevant ROIs of the DEDM aluminiumseries B images, namely S1.17/GR and S0/GR, are plotted in figure 2(b) as a function of theunderlying glandular ratio. The measured aluminium thickness underestimated the 1.17 mmaluminium thickness over all glandular ratios. Apart from the measurement over glandular

Dual-energy digital mammography 2571
1.0
10.0
100.0
1000.0
0 0.5 1 1.5 2 2
Image AL Thickness (mm)
AL
Co
ntr
ast-
to-N
ois
e R
atio
.5
LE: AL/0.25 LE: AL/0.75
DE: AL/0.25 DE: AL/0.75
(a)
-4
0
4
8
12
16
20
-0.2 0 0.2 0.4 0.6 0.8 1 1.2
Image Glandular Ratio
1.17
mm
AL
CN
R
(b)
Figure 3. (a) The CNRs (CNRAL/0.25, CNRAL/0.75) of the aluminium strip versus the imagedaluminium thickness for the low-energy and dual-energy series A images. (b) The aluminium CNRs(CNR1.17/GR) plotted against the underlying glandular ratio for series B dual-energy aluminiumimages.
ratio 0.0, there appears to be a trend consistent with higher glandular ratio leading to highermeasured aluminium thickness. As before, the aluminium thicknesses measured over regionswith no aluminium (S0/GR) yielded aluminium thicknesses near zero irrespective of theunderlying glandular ratio. The measured DEDM image noise over regions with no aluminium(σ 0/GR) increased with the glandular ratio because the noise increased with glandular ratio inthe low- and high-energy images due to lower x-ray transmission through tissue with higherglandular ratio.
4.2. The CNRs in the low- and dual-energy images
The CNRs of the aluminium strip in series A images (CNRAL/0.25 and CNRAL/0.75) calculatedfor the low-energy and DEDM aluminium images using equation (4) are plotted infigure 3(a). In both the low-energy and DEDM images, the aluminium CNRs increasedwith the true aluminium thickness. Because of the narrow-beam imaging conditions and highexposures used, it is the change in the CNRs between the low-energy and DEDM images thatare of relevance, rather than the exact values of the CNRs. The aluminium CNRs were about10 times lower in the DEDM images compared to the low-energy images. The aluminiumCNRs over glandular ratio 0.75 (CNRAL/0.75) were lower than the aluminium CNRs overglandular ratio 0.25 (CNRAL/0.25) because the noise increased with higher glandular ratio inboth the low- and dual-energy images.
The CNRs of the 1.17 mm aluminium strip over different glandular ratios in series Bimages (CNR1.17/GR) calculated for the DEDM images using equation (4) are plotted infigure 3(b). The fixed 1.17 mm thick aluminium CNRs (CNR1.17/GR) decrease with glandularratio because of the increase in noise with higher glandular ratio. It is the change in thefixed aluminium thickness CNRs between low and high glandular ratios regions that are ofrelevance, rather than the exact value of the CNRs. The aluminium CNRs were about 4 timesgreater over glandular ratio 0.0 than over glandular ratio 1.0.
4.3. The CBRs in the low- and dual-energy images
The CBRs of the aluminium strip in series A images (CBRAL/0.25 and CBRAL/0.75) calculatedfor the low- and dual-energy images using equations (5) and (6) are plotted in figure 4. Again,

2572 S C Kappadath and C C Shaw
0.1
1.0
10.0
100.0
0 0.5 1 1.5 2 2
Image AL Thickness (mm)
Co
ntr
ast-
to-B
ackg
rou
nd
Rat
io
.5
LE: AL/0.25 LE: AL/0.75
DE: AL/0.25 DE: AL/0.75
Figure 4. The CBRs (CBRAL/0.25 and CBRAL/0.75) of the aluminium strip versus the imagedaluminium thickness for the low-energy and dual-energy series A images.
it is the change in the CBRs between the low-energy and DEDM images that are of relevance,rather than the exact values of the CBRs. In contrast to the behaviour of the CNRs, thelow-energy images showed lower CBRs than the dual-energy images. The aluminium CBRswere about 10 times greater in the DEDM images compared to the low-energy images. Thealuminium CBRs over glandular ratio 0.75 (CBRAL/0.75) were higher than the aluminium CBRsover glandular ratio 0.25 (CBRAL/0.25) in the dual-energy images because lower aluminiumthicknesses were measured over glandular ratio 0.25 (see figure 2(a)).
5. Discussion
Ideally, the DEDM aluminium images should, regardless of the underlying tissue composition,yield zero aluminium thickness for ROIs that do not contain aluminium and the true aluminiumthickness for ROIs that do contain aluminium. However, the aluminium thicknesses estimatedfrom the DEDM images underestimated the true aluminium thicknesses (figure 2). Asdiscussed below, scatter contamination from ROIs with no aluminium into ROIs withaluminium leads to the observed discrepancy. Because the aluminium strips covered onlyhalf of the tissue blocks in the aperture, there were two well-separated raw-pixel value (signal)regimes in the low- and high-energy phantom images: a high-signal regime corresponding toROIs with no aluminium, and a low-signal regime corresponding to ROIs with aluminium.Because of the small size of the ROIs, the scatter that was present in each ROI was relatednot only to the magnitude of the signal in the ROI but also to the scatter that spilled overfrom the surrounding ROIs. Therefore, the scatter from high-signal (non-aluminium) regionscould increase the measured signal level in the low-signal (aluminium) regions. For a givenglandular ratio, a higher signal would correspond to thinner aluminium in the calibration data;therefore, the inverse-mapping function would yield thinner (lower) values for the aluminiumROIs with spillover scatter.
We tested the spillover scatter hypothesis by explicitly correcting for the scatter in eachROI of the low- and high-energy images prior to generating the DEDM images. We measuredthe transmission through each ROI independently by further collimating the x-ray beam witha ∼1 mm circular aperture through 1 mm of Pb. Use of this smaller aperture ensured that the

Dual-energy digital mammography 2573
0
0.5
1
1.5
2
0 0.5 1 1.5 2 2.5
Image AL Thickness (mm)
Mea
sure
d A
L T
hic
knes
s (m
m)
AL-True
AL/0.25
AL/0.75
SC: AL/0.25
SC: AL/0.75
Figure 5. The spillover scatter corrected aluminium thickness (SC: AL/0.25 and SC: AL/0.75)and the original aluminium thickness (0/0.25 and 0/0.75) measured in series A dual-energyaluminium images as a function of the image phantom aluminium thickness. The solid line(AL-true) represents the true aluminium thickness.
adjacent ROIs were not exposed during the x-ray transmission measurements; hence, therewould be no contributions due to spillover scatter from adjacent ROIs. The mean signal inthe central 5 pixels × 5 pixels was considered to be the primary transmission signal for eachROI. The estimated primary signal from each ROI was subtracted from the original ROI signalto estimate the scatter present in the ROI. In this manner, the measured signals for ROIswith aluminium were corrected for scatter in both the low- and high-energy series A images.The measured scatter-to-primary ratios (SPR) for ROIs with aluminium increased with theimaged aluminium thickness, from 4% to 25% in the low-energy images and from 1% to10% in the high-energy images. The scatter-corrected ROIs were used to generate scatter-corrected DEDM aluminium images. The aluminium thicknesses estimated after scattercorrections are shown in figure 5 together with the original estimates. The scatter-correctedDEDM measurements were closer to the true aluminium thickness than the original estimates.The mean absolute residuals for SAL/0.25 and SAL/0.75 after scatter corrections were ∼63 and∼160 µm, significantly smaller than ∼430 and ∼240 µm for the original estimates. Thescatter that spilled over from the low-signal (aluminium) regions was found to be low (<1%);therefore, the non-aluminium signals in the phantom images were accurately reproduced inthe DEDM images. We have thus verified that spillover of scatter from non-aluminium intoaluminium regions in the low- and high-energy images led to the underestimation of thealuminium thickness in the DEDM images.
The measured signals in the single-energy images were lower for ROIs with higherglandular ratios because the x-ray attenuation is greater for tissue with higher glandular ratio,i.e., S0/0.75 < S0/0.25 in series A single-energy images. Therefore the amount of scatter fromROIs without aluminium that contaminated ROIs with aluminium was lower for ROIs withhigher glandular ratios. Because the amount of scatter contamination in ROIs with aluminiumwas proportional to the signal in the adjacent ROIs without aluminium, the amount of scatterfrom ROIs without aluminium decreased with glandular ratio, i.e., scatter contribution waslower for SAL/0.75 than for SAL/0.25. Therefore, the DEDM aluminium estimates were closerto the true aluminium thickness for aluminium ROIs over glandular ratio 0.75, as observedin figure 2(a). The relationship between scatter contamination and glandular ratio could also

2574 S C Kappadath and C C Shaw
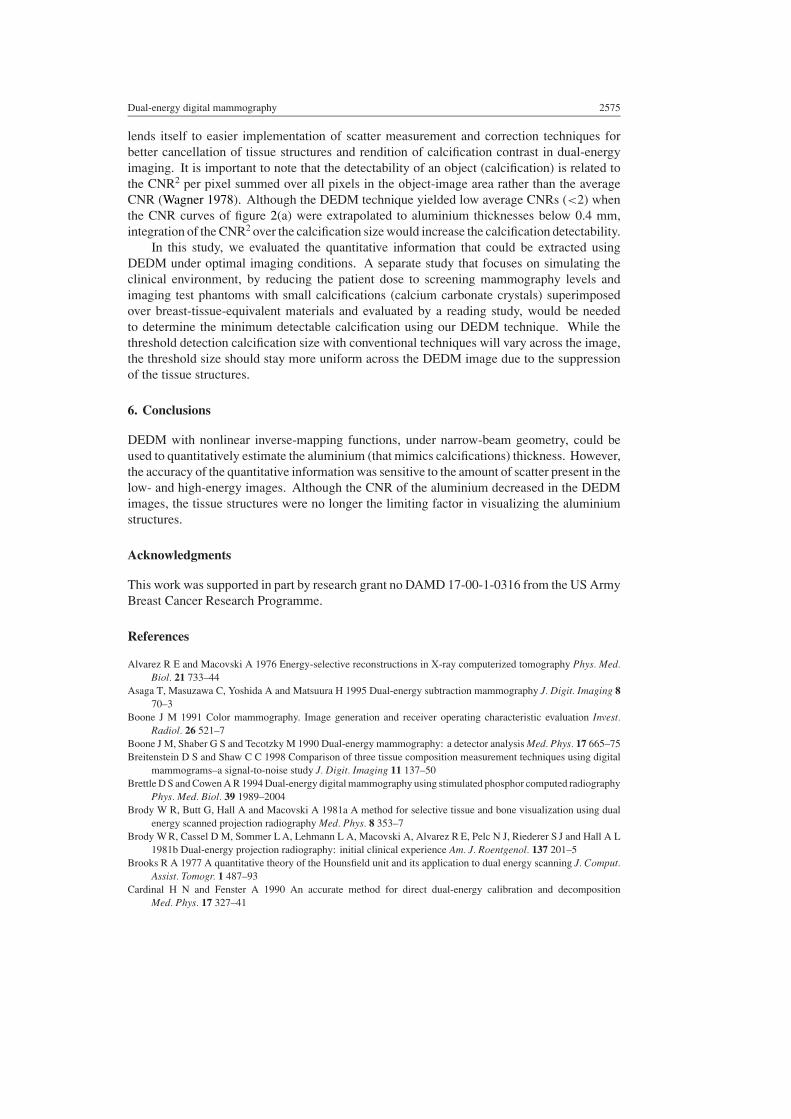
Figure 6. (a) The low-energy image of the phantom with 1.17 mm of aluminium over tissue blockswith glandular ratios of 0.25 and 0.75. The grey-scale levels in the image span 0–3000 counts inthe raw signal value. (b) The corresponding dual-energy aluminium image of the phantom with1.17 mm of aluminium over tissue blocks with glandular ratios of 0.25 and 0.75. The grey-scalelevels in the images span aluminium thicknesses from −2 to 2 mm.
explain the observed trend of higher glandular ratio leading to higher measured aluminiumthicknesses as seen in figure 2(b).
Although it may be difficult to extract accurate quantitative information from DEDMimages, the DEDM images may still be diagnostically useful if the measured aluminiumthickness increases monotonically with the true thickness (as seen in figure 2), and thecontrast due to tissue structures is suppressed (as seen in figure 4). The suppression ofthe tissue structures in the DEDM images can be directly visualized by comparing the DEDMimages to the low-energy images. The low-energy and DEDM images of 1.17 mm thickaluminium strip superimposed over two tissue blocks with glandular ratios of 0.25 and 0.75are shown in figures 6(a) and (b), respectively. There are two significant differences betweenthe low- and dual-energy images. First, there were only two dominant grey-scale levels inthe DEDM images (corresponding to the tissue and the aluminium ROIs), compared to four(each corresponding to a single ROI) in the low-energy images. The contrast between theROIs with different glandular ratios in the low-energy image (figure 6(a)) has largely beensuppressed in the DEDM image (figure 6(b)). Second, the DEDM images displayed lowerCNR values for the aluminium strips compared to the low-energy image in each of the ROIs(figure 3). The cancellation of tissue contrast could also be inferred by the higher CBR valuesfor the DEDM images (figure 4). In general, the appearance of other single- (low- and high-)energy and DEDM images are qualitatively similar to the images shown in figures 6(a) and(b), respectively.
Calcifications of clinical interest that can be realistically detected are typically 100–400 µm wide and could cover an area up to 4 pixels wide. Because calcifications are smalland appear sparsely in mammograms, the scatter under them is not sensitive to the calcificationsize (unlike the phantoms imaged in this work). The scatter distribution in raw images willprimarily be determined by the attenuation pattern of tissue structures leading to a smoothlyvarying scatter component across the whole image. A smoothly varying scatter component
Dual-energy digital mammography 2575
lends itself to easier implementation of scatter measurement and correction techniques forbetter cancellation of tissue structures and rendition of calcification contrast in dual-energyimaging. It is important to note that the detectability of an object (calcification) is related tothe CNR2 per pixel summed over all pixels in the object-image area rather than the averageCNR (Wagner 1978). Although the DEDM technique yielded low average CNRs (<2) whenthe CNR curves of figure 2(a) were extrapolated to aluminium thicknesses below 0.4 mm,integration of the CNR2 over the calcification size would increase the calcification detectability.
In this study, we evaluated the quantitative information that could be extracted usingDEDM under optimal imaging conditions. A separate study that focuses on simulating theclinical environment, by reducing the patient dose to screening mammography levels andimaging test phantoms with small calcifications (calcium carbonate crystals) superimposedover breast-tissue-equivalent materials and evaluated by a reading study, would be neededto determine the minimum detectable calcification using our DEDM technique. While thethreshold detection calcification size with conventional techniques will vary across the image,the threshold size should stay more uniform across the DEDM image due to the suppressionof the tissue structures.
6. Conclusions
DEDM with nonlinear inverse-mapping functions, under narrow-beam geometry, could beused to quantitatively estimate the aluminium (that mimics calcifications) thickness. However,the accuracy of the quantitative information was sensitive to the amount of scatter present in thelow- and high-energy images. Although the CNR of the aluminium decreased in the DEDMimages, the tissue structures were no longer the limiting factor in visualizing the aluminiumstructures.
Acknowledgments
This work was supported in part by research grant no DAMD 17-00-1-0316 from the US ArmyBreast Cancer Research Programme.
References
Alvarez R E and Macovski A 1976 Energy-selective reconstructions in X-ray computerized tomography Phys. Med.Biol. 21 733–44
Asaga T, Masuzawa C, Yoshida A and Matsuura H 1995 Dual-energy subtraction mammography J. Digit. Imaging 870–3
Boone J M 1991 Color mammography. Image generation and receiver operating characteristic evaluation Invest.Radiol. 26 521–7
Boone J M, Shaber G S and Tecotzky M 1990 Dual-energy mammography: a detector analysis Med. Phys. 17 665–75Breitenstein D S and Shaw C C 1998 Comparison of three tissue composition measurement techniques using digital
mammograms–a signal-to-noise study J. Digit. Imaging 11 137–50Brettle D S and Cowen A R 1994 Dual-energy digital mammography using stimulated phosphor computed radiography
Phys. Med. Biol. 39 1989–2004Brody W R, Butt G, Hall A and Macovski A 1981a A method for selective tissue and bone visualization using dual
energy scanned projection radiography Med. Phys. 8 353–7Brody W R, Cassel D M, Sommer L A, Lehmann L A, Macovski A, Alvarez R E, Pelc N J, Riederer S J and Hall A L
1981b Dual-energy projection radiography: initial clinical experience Am. J. Roentgenol. 137 201–5Brooks R A 1977 A quantitative theory of the Hounsfield unit and its application to dual energy scanning J. Comput.
Assist. Tomogr. 1 487–93Cardinal H N and Fenster A 1990 An accurate method for direct dual-energy calibration and decomposition
Med. Phys. 17 327–41

2576 S C Kappadath and C C Shaw
Chakraborty D P and Barnes G T 1989 An energy sensitive cassette for dual-energy mammography Med. Phys. 167–13
Chuang K-S and Huang H K 1988 Comparison of four dual energy image decomposition methods Phys. Med. Biol.33 455–66
Ergun D L, Mistretta C A, Brown D E, Bystrianyk R T, Sze W K, Kelcz F and Naidich D P 1990 Single-exposuredual-energy computed radiography: improved detection and processing Radiology 174 243–9
Fandos-Morera A, Prats-Esteve M, Tura-Soteras J M and Traveria-Cros A 1988 Breast tumors: composition ofmicrocalcifications Radiology 169 325–7
Guillemaud R, Robert-Coutant C, Darboux M, Gagein J-J and Dinten J-M 2001 Evaluation of dual-energy radiographywith a digital x-ray detector Proc. SPIE 4320 469–78
Ishigaki T, Sakuma S, Horikawa Y, Ikeda M and Yamaguchi H 1986 One-shot dual-energy subtraction imagingRadiology 161 271–3
Johns P C, Drost D J, Yaffe M J and Fenster A 1985 Dual-energy mammography: initial experimental results Med.Phys. 12 297–304
Johns P C and Yaffe M J 1985 Theoretical optimization of dual-energy x-ray imaging with application tomammography Med. Phys. 12 289–96
Kappadath S C and Shaw C C 2003 Dual-energy digital mammography: Calibration and inverse-mapping techniquesto estimate calcification thickness and glandular-tissue ratio Med. Phys. 30 1110–7
Lehmann L A, Alvarez R E, Macovski A and Brody W R 1981 Generalized image combinations in dual KVP digitalradiography Med. Phys. 8 659–67
Lemacks M R, Kappadath S C, Shaw C C, Liu X and Whitman G 2002 A dual-energy subtraction technique formicrocalcification imaging in digital mammography—A signal-to-noise analysis Med. Phys. 29 1739–51
Rutt B and Fenster A 1980 Split-filter computed tomography: a simple technique for dual energy scanning J. Comput.Assist. Tomogr. 4 501–9
Sabol J M, Avinash G B, Nicolas F, Claus B, Zhao J and Dobbins J T 2001 The development and characterization ofa dual-energy subtraction imaging system for chest radiography based on CsI:Tl amorphous silicon flat-paneltechnology Proc. SPIE 4320 399–408
Samei E, Flynn M J and Eyler W R 1999 Detection of subtle lung nodules: Relative influence of quantum andanatomic noise on chest radiographs Radiology 213 727–34
Shaw C C and Gur D 1992 Comparison of three different techniques for dual-energy subtraction imaging in digitalradiography: a signal-to-noise analysis J. Digit. Imaging 5 262–70
Vedantham S et al 2000 Full breast digital mammography with an amorphous silicon-based flat panel detector:physical characteristics of a clinical prototype Med. Phys. 27 558–67
Vetter J R, Perman W H, Kalendar W A, Mazess R B and Holden J E 1986 Evaluation of a prototype dual-energycomputed tomographic apparatus: II. Determination of vertebral bone mineral content Med. Phys. 13 340–3
Voegeli D R 1989 Mammographic signs of malignancy Handbook of Breast Imaging ed M E Peters, D R Voegeli andK A Scanlan (New York: Churchill Livingstone) pp 183–217
Wagner R F 1978 Decision theory and the detail signal-to-noise ratio of Otto Schade Photogr. Sci. Eng. 22 41–5