Quantitative Analysis of Total Soluble Solids and ... · and titratable acidity (TA) are important...
4
Abstract—Quality of sweet tamarind (‘Prakaytong’variety) must be acceptable as customer needs. Total soluble solids (TSS) and titratable acidity (TA) are important indexes for consideration of quality. Short wavelength near infrared spectroscopy (SW-NIRS) in transmittance mode ranged 665- 955 nm was investigated to use for detection of total soluble solids and titratable acidity in sweet tamarind. A set of 209 samples (137 samples for a calibration set and 72 samples for a prediction set) was used for total soluble solids determination. A set of 163 samples (104 samples for a calibration set and 59 samples for a prediction set) was used for titratable acidity determination. Partial least squares regression (PLSR) was used to develop the calibration models. Smoothing (Savitsky– Golay) spectral pretreatment obtained good results of a calibration model for total soluble solids (R=0.90, RMSEC=1.71) and obtained accuracy for screening in the prediction set (R=0.86, RMSEP=1.91). Smoothing (Savitsky– Golay) combined with first derivative spectral pretreatment obtained accepted results for the calibration model for titratable acidity (R=0.87, RMSEC=0.29) and obtained accuracy for screening in the prediction set (R=0.83, RMSEP=0.33). All results indicated that it is possible to use SW-NIRS for nondestructive prediction of total soluble solids and titratable acidity in sweet tamarind. Index Terms—Sweet tamarind, total soluble solids, titratable acidity, near infrared spectroscopy. I. INTRODUCTION Sweet tamarind (Tamarindus indica L.) is one of important fruit in Thailand. It grows in many provinces of Thailand such as Phetchabun, Lampang, Chiangmai, Nakhonratchasima and Ubonratchathani [1]. In between 2007-2011, the export value of sweet tamarind has been increased [2]. However, consumers buy sweet tamarind on the basis of quality using sugar content and acid content as indicators. In recent years, near infrared spectroscopy has been a nondestructive method to detect qualities in fruits such as mangosteen [3], apple [4] and orange [5]. Advantages of NIRS are nondestructive, fast and reliable. The objective of this work is to study a feasibility of using SW-NIRS for determination of total soluble solids and titratable acidity in sweet tamarind. Manuscript received January 14, 2013; revised March 17, 2013. S. Suktanarak and S. Teerachaichayut are with Faculty of Agro-Industry, King Mongkut‟s Institute of Technology Ladkrabang, Chalongkrung Road, Ladkrabang, Bangkok 10520, Thailand (e-mail: [email protected], ktsontis@ kmitl.ac.th). II. MATERIALS AND METHOD A. Sample Sweet tamarinds („Prakaytong‟ variety) were divided into 2 groups. They were used for total soluble solids analysis and titratable acidity analysis. A set of 209 sweet tamarinds was used for determination of total soluble solids and a set of 179 sweet tamarinds was used for determination of titratable acidity. All samples were purchased from auction market in Thailand. Good appearances of samples were sorted before using in this research. B. Spectral Acquisition The short wavelength near infrared spectrophotometer (PureSpect, Saika TIF., Japan) was used for a nondestructive measurement. The SW-NIR spectra were acquired by transmittance mode in the wavelength range 665-955 nm. Scanning was done at the center of seed pods in each sample. C. Data Analysis The spectral pretreatments were investigated in order to obtain the best result of calibration. The calibration models were developed using partial least squares regression (PLSR). Statistical analysis was performed by using the Unscrambler (CAMO, Oslo, Norway). D. Reference Analysis For total soluble solids determination, 230 samples were divided into 2 sets which were used for the calibration set (137 samples) and the prediction set (72 samples). For titratable acidity determination, 163 samples were divided into 2 sets which were used for the calibration set (104 samples) and the prediction set (59 samples). After spectral measurements, juice was squeezed from sweet tamarind flesh. Total soluble solids content of samples was measured using a digital refractometer (PR101, Palette Series, Atago Co., Ltd., Tokyo, Japan) and titratable acidity was analyzed using auto titrator (METTLER TOLEDO, T50). III. RESULT A. Calibration Model for Total Soluble Solids Determination Samples were classified into three groups as low total soluble solids (53.3-64.16), medium total soluble solids (65- 69.1) and high total soluble solids (70-78.8). The features of averaged original spectra of sweet tamarinds based on total soluble solids were shown in Fig. 1 a). Due to sweet tamarinds contained with a hard stone in each pod, the noise occurred in spectra. Spectral pretreatment using smoothing (Savitsky–Golay) was applied and obtained the features of Quantitative Analysis of Total Soluble Solids and Titratable Acidity of Sweet Tamarind by SW-NIRS S. Suktanarak and S. Teerachaichayut International Journal of Bioscience, Biochemistry and Bioinformatics, Vol. 3, No. 4, July 2013 328 DOI: 10.7763/IJBBB.2013.V3.224
Transcript of Quantitative Analysis of Total Soluble Solids and ... · and titratable acidity (TA) are important...

Abstract—Quality of sweet tamarind (‘Prakaytong’variety)
must be acceptable as customer needs. Total soluble solids (TSS)
and titratable acidity (TA) are important indexes for
consideration of quality. Short wavelength near infrared
spectroscopy (SW-NIRS) in transmittance mode ranged 665-
955 nm was investigated to use for detection of total soluble
solids and titratable acidity in sweet tamarind. A set of 209
samples (137 samples for a calibration set and 72 samples for a
prediction set) was used for total soluble solids determination.
A set of 163 samples (104 samples for a calibration set and 59
samples for a prediction set) was used for titratable acidity
determination. Partial least squares regression (PLSR) was
used to develop the calibration models. Smoothing (Savitsky–
Golay) spectral pretreatment obtained good results of a
calibration model for total soluble solids (R=0.90,
RMSEC=1.71) and obtained accuracy for screening in the
prediction set (R=0.86, RMSEP=1.91). Smoothing (Savitsky–
Golay) combined with first derivative spectral pretreatment
obtained accepted results for the calibration model for
titratable acidity (R=0.87, RMSEC=0.29) and obtained
accuracy for screening in the prediction set (R=0.83,
RMSEP=0.33). All results indicated that it is possible to use
SW-NIRS for nondestructive prediction of total soluble solids
and titratable acidity in sweet tamarind.
Index Terms—Sweet tamarind, total soluble solids, titratable
acidity, near infrared spectroscopy.
I. INTRODUCTION
Sweet tamarind (Tamarindus indica L.) is one of
important fruit in Thailand. It grows in many provinces of
Thailand such as Phetchabun, Lampang, Chiangmai,
Nakhonratchasima and Ubonratchathani [1]. In between
2007-2011, the export value of sweet tamarind has been
increased [2]. However, consumers buy sweet tamarind on
the basis of quality using sugar content and acid content as
indicators.
In recent years, near infrared spectroscopy has been a
nondestructive method to detect qualities in fruits such as
mangosteen [3], apple [4] and orange [5]. Advantages of
NIRS are nondestructive, fast and reliable. The objective of
this work is to study a feasibility of using SW-NIRS for
determination of total soluble solids and titratable acidity in
sweet tamarind.
Manuscript received January 14, 2013; revised March 17, 2013.
S. Suktanarak and S. Teerachaichayut are with Faculty of Agro-Industry,
King Mongkut‟s Institute of Technology Ladkrabang, Chalongkrung Road,
Ladkrabang, Bangkok 10520, Thailand (e-mail: [email protected],
ktsontis@ kmitl.ac.th).
II. MATERIALS AND METHOD
A. Sample
Sweet tamarinds („Prakaytong‟ variety) were divided into
2 groups. They were used for total soluble solids analysis
and titratable acidity analysis. A set of 209 sweet tamarinds
was used for determination of total soluble solids and a set
of 179 sweet tamarinds was used for determination of
titratable acidity. All samples were purchased from auction
market in Thailand. Good appearances of samples were
sorted before using in this research.
B. Spectral Acquisition
The short wavelength near infrared spectrophotometer
(PureSpect, Saika TIF., Japan) was used for a nondestructive
measurement. The SW-NIR spectra were acquired by
transmittance mode in the wavelength range 665-955 nm.
Scanning was done at the center of seed pods in each sample.
C. Data Analysis
The spectral pretreatments were investigated in order to
obtain the best result of calibration. The calibration models
were developed using partial least squares regression
(PLSR). Statistical analysis was performed by using the
Unscrambler (CAMO, Oslo, Norway).
D. Reference Analysis
For total soluble solids determination, 230 samples were
divided into 2 sets which were used for the calibration set
(137 samples) and the prediction set (72 samples). For
titratable acidity determination, 163 samples were divided
into 2 sets which were used for the calibration set (104
samples) and the prediction set (59 samples). After spectral
measurements, juice was squeezed from sweet tamarind
flesh. Total soluble solids content of samples was measured
using a digital refractometer (PR101, Palette Series, Atago
Co., Ltd., Tokyo, Japan) and titratable acidity was analyzed
using auto titrator (METTLER TOLEDO, T50).
III. RESULT
A. Calibration Model for Total Soluble Solids
Determination
Samples were classified into three groups as low total
soluble solids (53.3-64.16), medium total soluble solids (65-
69.1) and high total soluble solids (70-78.8). The features of
averaged original spectra of sweet tamarinds based on total
soluble solids were shown in Fig. 1 a). Due to sweet
tamarinds contained with a hard stone in each pod, the noise
occurred in spectra. Spectral pretreatment using smoothing
(Savitsky–Golay) was applied and obtained the features of
Quantitative Analysis of Total Soluble Solids and
Titratable Acidity of Sweet Tamarind by SW-NIRS
S. Suktanarak and S. Teerachaichayut
International Journal of Bioscience, Biochemistry and Bioinformatics, Vol. 3, No. 4, July 2013
328DOI: 10.7763/IJBBB.2013.V3.224
averaged smoothing spectra as shown in Fig. 1 b).
TABLE I: STATISTICAL CHARACTERISTICS OF SAMPLES IN THE
CALIBRATION SET AND PREDICTION SET FOR TOTAL SOLUBLE SOLIDS
DETERMINATION
Items Calibration set Prediction set
Number of sample 137 72
Range 53.3-78.3 57.5-77.8
Mean 67.69 68.02
Standard deviation 4.0 3.85
Unit oBrix oBrix
Wavelength 665-955 nm 665-955 nm
In Table I, it showed the standard deviation of total
soluble solids of samples is quite similar in the calibration
and prediction set. As well as, a range of total soluble solids
in the prediction set were in the range of the calibration set.
Spectra pretreatments were investigated as shown in Table
II. It showed that smoothing (Savitsky–Golay, 3-point fit)
spectral pretreatment obtained the best result (R=0.74,
RMSEP = 2.77). Therefore, smoothing (Savitsky–Golay, 3-
point fit) spectral pretreatment was used for establishment a
calibration model for total soluble solids in this study. In
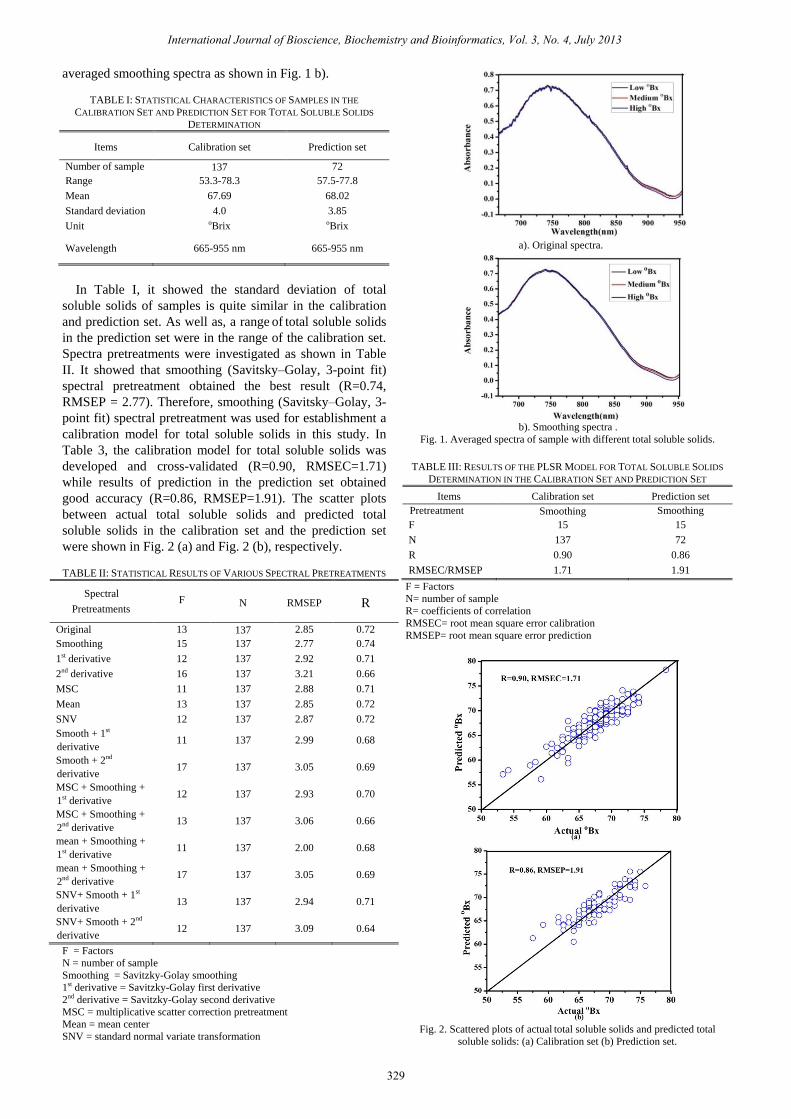
Table 3, the calibration model for total soluble solids was
developed and cross-validated (R=0.90, RMSEC=1.71)
while results of prediction in the prediction set obtained
good accuracy (R=0.86, RMSEP=1.91). The scatter plots
between actual total soluble solids and predicted total
soluble solids in the calibration set and the prediction set
were shown in Fig. 2 (a) and Fig. 2 (b), respectively.
TABLE II: STATISTICAL RESULTS OF VARIOUS SPECTRAL PRETREATMENTS
Spectral
Pretreatments
F
N RMSEP R
Original 13 137 2.85 0.72
Smoothing 15 137 2.77 0.74
1st derivative 12 137 2.92 0.71
2nd derivative 16 137 3.21 0.66
MSC 11 137 2.88 0.71
Mean 13 137 2.85 0.72
SNV 12 137 2.87 0.72
Smooth + 1st
derivative 11 137 2.99 0.68
Smooth + 2nd
derivative 17 137 3.05 0.69
MSC + Smoothing +
1st derivative 12 137 2.93 0.70
MSC + Smoothing +
2nd derivative 13 137 3.06 0.66
mean + Smoothing +
1st derivative 11 137 2.00 0.68
mean + Smoothing +
2nd derivative 17 137 3.05 0.69
SNV+ Smooth + 1st
derivative 13 137 2.94 0.71
SNV+ Smooth + 2nd
derivative 12 137 3.09 0.64
F = Factors
N = number of sample
Smoothing = Savitzky-Golay smoothing
1st derivative = Savitzky-Golay first derivative
2nd derivative = Savitzky-Golay second derivative
MSC = multiplicative scatter correction pretreatment
Mean = mean center
SNV = standard normal variate transformation
a). Original spectra.
b). Smoothing spectra .
Fig. 1. Averaged spectra of sample with different total soluble solids.
TABLE III: RESULTS OF THE PLSR MODEL FOR TOTAL SOLUBLE SOLIDS
DETERMINATION IN THE CALIBRATION SET AND PREDICTION SET
Items Calibration set Prediction set
Pretreatment Smoothing Smoothing
F 15 15
N 137 72
R 0.90 0.86
RMSEC/RMSEP 1.71 1.91
F = Factors
N= number of sample
R= coefficients of correlation
RMSEC= root mean square error calibration
RMSEP= root mean square error prediction
Fig. 2. Scattered plots of actual total soluble solids and predicted total
soluble solids: (a) Calibration set (b) Prediction set.
International Journal of Bioscience, Biochemistry and Bioinformatics, Vol. 3, No. 4, July 2013
329

B. Calibration Model for Titratable Acidity
Determination
TABLE IV: STATISTICAL CHARACTERISTICS OF CALIBRATION SET AND
PREDICTION SET FOR TITRATABLE ACIDITY DETERMINATION
Items Calibration set Prediction set
Number of sample 104 58
Range 0.26-3.59 0.27-3.44
Mean 2.12 2.09
Standard deviation 0.61 0.62
Unit %TA %TA
Wavelength 665-955 nm 665-955 nm
In Table VI, the statistical characteristics of the
calibration set and the prediction set were used for titratable
acidity determination in this study. Averaged original
spectra of sweet tamarind groups having different titratable
acidity (0.26-2.09 for a group of low titratable acidity, 2.10-
2.57 for a group of medium titratable acidity and 2.61-3.59
for a group of high titratable acidity) were shown in Fig. 3.
Fig. 3. Averaged original spectra of samples with different titratable acidity.
TABLE V: STATISTICAL RESULTS OF VARIOUS SPECTRAL
PRETREATMENTS
Spectral
Pretreatments
F
N RMSEP R
Original 6 104 0.44 0.69
Smoothing 3 104 0.43 0.62
1st derivative 14 104 0.44 0.71
2nd derivative 3 104 0.48 0.62
MSC 12 104 0.45 0.69
Mean 6 104 0.44 0.69
SNV 6 104 0.48 0.63
Smooth + 1st
derivative 5 104 0.43 0.71
Smooth + 2nd
derivative 4 104 0.49 0.60
MSC + Smoothing +
1st derivative 4 104 0.47 0.64
MSC + Smoothing +
2nd derivative 4 104 0.49 0.60
mean + Smoothing +
1st derivative 5 104 0.47 0.65
mean + Smoothing +
2nd derivative 4 104 0.49 0.60
SNV+ Smooth + 1st
derivative 6 104 0.50 0.62
SNV+ Smooth + 2nd
derivative 4 104 0.48 0.62
F = Factors
N= number of sample
Smoothing = Savitzky-Golay smoothing
1st derivative = Savitzky-Golay first derivative
2nd derivative = Savitzky-Golay second derivative
MSC = multiplicative scatter correction pretreatment
Mean = mean centerresult
SNV = standard normal variate transformation
Table V showed spectral pretreatment using smoothing
combined with first derivative obtained the best result
(R=0.71, RMSEP=0.43). Therefore, smoothing and first
derivative spectral pretreatments were used to develop the
calibration model for titratable acidity in this study. In Table
6, the calibration model for titratable acidity was cross-
validated (R=0.87, RMSSEC=0.29) and used for
determination of titratable acidity in the prediction set
(R=0.83, RMSEP=0.33). The scatter plots between actual
titratable acidity and predicted titratable acidity in the
calibration set and the prediction set were shown in Fig. 4 (a)
and Fig. 4 (b), respectively.
TABLE VI: RESULTS OF THE PLSR MODEL FOR TITRATABLE ACIDITY
DETERMINATION IN THE CALIBRATION SET AND PREDICTION SET
Items Calibration set Prediction set
Pretreatment Smoothing+
first derivative
Smoothing+
first derivative
F 5 5
N 104 59
R 0.87 0.83
RMSEC/RMSEP 0.29 0.33
F = Factors
N= number of sample
R= coefficients of correlation
RMSEC= root mean square error calibration
RMSEP= root mean square error prediction
Fig. 4. Scattered plots of actual tritrable acidity and predicted tritrable
acidity: (a) Calibration set (b) Prediction set.
IV. CONCLUSION
In this study, the results indicated that spectral
International Journal of Bioscience, Biochemistry and Bioinformatics, Vol. 3, No. 4, July 2013
330

pretreatments were required for calibration models. SW-
NIRS is possible to use as a non-destructive technique for
prediction of total soluble solids and titratable acidity of
intact sweet tamarind.
ACKNOWLEDGMENT
This research was funded by office of the national research
council of Thailand. The authors acknowledge the use of use
of laboratory and equipment at the Kasetsart Agricultural
and Agro-Industrial Product Improvement Institute (KAPI).
Finally, the authors would like to thank Assoc. Prof.
Panmanas Sirisomboon for technical help.
spectroscopy,” J. Postharvest Biology and Technology, vol. 43, pp.
202-206, 2007.
[4] M. R. Sohn, K. S. Park, and S. I. Cho, “Near infra-red reflectance
spectroscopy for non-invasive measuring internal quality of apple
fruit,” J. Near Infrared Anal, vol. 1, pp. 27-30, 2000.
[5] A. Cayuela and C. Weiland, “Intact orange quality prediction with
who portable NIR spectrometers,” J. postharvest biology and
technology, vol. 58, pp. 113-120, 2010.
Sineenart Suktanarak
was born on 4 December, 1987,
in Chonburi.
She is
studying master degree of agro-
industry in depart of food science at King Mongkut‟s
institute of Technology Ladkrabang
from 2010 still
now. She
graduated bachelor degree from King
Mongkut‟s university of Technology North Bangkok
in major agro-industry and management
from
2007 to
2010.
Sontisuk Teerachaichayut
was born on 22 November,
1963, in Nakornnayok, Thailand. He got his Ph.D in
Postharvest Technology, Kasetsart University,
Bangkok, Thailand
in 2007.
International Journal of Bioscience, Biochemistry and Bioinformatics, Vol. 3, No. 4, July 2013
331
REFERENCES
[1] C. Sajjapong, The tamarind plants, Bangkok: Matichon Public
Company, 2009, pp. 31-33.
[2] Agricultural Information Center at Office of Agricultural Economics.
Quantities and value of exportstamarind. (2011). [Online]. Available:
http://www.oae.go.th/oae_report/export_import/export_result.php.
[3] S. Teerachaichayut, K. Y. Kil, A. Terdwongworakul, W. Thanapase,
and Y. Nakanishi, “Non-destructive prediction of translucent flesh
disorder in intact mangosteen by short wavelength near infrared