Quantitative Analysis of the Effect of Iterative ... · Quantitative Analysis of the Effect of...
9
Yonsei Med J http://www.eymj.org Volume 56 Number 1 January 2015 253 Quantitative Analysis of the Effect of Iterative Reconstruction Using a Phantom: Determining the Appropriate Blending Percentage Hyun Gi Kim, Yong Eun Chung, Young Han Lee, Jin-Young Choi, Mi-Suk Park, Myeong-Jin Kim, and Ki Whang Kim Department of Radiology, Research Institute of Radiological Science, Severance Hospital, Yonsei University College of Medicine, Seoul, Korea. Received: December 3, 2013 Revised: March 9, 2014 Accepted: March 26, 2014 Corresponding author: Dr. Yong Eun Chung, Department of Radiology, Yonsei University College of Medicine, 50-1 Yonsei-ro, Seodaemun-gu, Seoul 120-752, Korea. Tel: 82-2-2228-7400, Fax: 82-2-393-3035 E-mail: [email protected] ∙ The authors have no financial conflicts of interest. © Copyright: Yonsei University College of Medicine 2015 This is an Open Access article distributed under the terms of the Creative Commons Attribution Non- Commercial License (http://creativecommons.org/ licenses/by-nc/3.0) which permits unrestricted non- commercial use, distribution, and reproduction in any medium, provided the original work is properly cited. Purpose: To investigate the optimal blending percentage of adaptive statistical it- erative reconstruction (ASIR) in a reduced radiation dose while preserving a de- gree of image quality and texture that is similar to that of standard-dose computed tomography (CT). Materials and Methods: The CT performance phantom was scanned with standard and dose reduction protocols including reduced mAs or kVp. Image quality parameters including noise, spatial, and low-contrast resolu- tion, as well as image texture, were quantitatively evaluated after applying various blending percentages of ASIR. The optimal blending percentage of ASIR that pre- served image quality and texture compared to standard dose CT was investigated in each radiation dose reduction protocol. Results: As the percentage of ASIR in- creased, noise and spatial-resolution decreased, whereas low-contrast resolution increased. In the texture analysis, an increasing percentage of ASIR resulted in an increase of angular second moment, inverse difference moment, and correlation and in a decrease of contrast and entropy. The 20% and 40% dose reduction proto- cols with 20% and 40% ASIR blending, respectively, resulted in an optimal quali- ty of images with preservation of the image texture. Conclusion: Blending the 40% ASIR to the 40% reduced tube-current product can maximize radiation dose reduction and preserve adequate image quality and texture. Key Words: CT Image quality, iterative reconstruction, filtered back projection, radiation dose reduction, texture analysis INTRODUCTION Radiation doses can be reduced by lowering the tube current. However, there is a limit to tube current reduction with the currently used image reconstruction meth- od, filtered back projection (FBP). This is because reduction of the tube current‒ time product increases image noise and influences the diagnostic image quality. 1 Unlike FBP, the iterative reconstruction technique can reduce image noise even in low-dose computed tomography (CT) images, because it can be operated in raw data space and can accurately characterize data acquisition according to each phys- Original Article http://dx.doi.org/10.3349/ymj.2015.56.1.253 pISSN: 0513-5796, eISSN: 1976-2437 Yonsei Med J 56(1):253-261, 2015
Transcript of Quantitative Analysis of the Effect of Iterative ... · Quantitative Analysis of the Effect of...

Yonsei Med J http://www.eymj.org Volume 56 Number 1 January 2015 253
Quantitative Analysis of the Effect of Iterative Reconstruction Using a Phantom:
Determining the Appropriate Blending Percentage
Hyun Gi Kim, Yong Eun Chung, Young Han Lee, Jin-Young Choi, Mi-Suk Park, Myeong-Jin Kim, and Ki Whang Kim
Department of Radiology, Research Institute of Radiological Science, Severance Hospital, Yonsei University College of Medicine, Seoul, Korea.
Received: December 3, 2013Revised: March 9, 2014Accepted: March 26, 2014Corresponding author: Dr. Yong Eun Chung, Department of Radiology, Yonsei University College of Medicine, 50-1 Yonsei-ro, Seodaemun-gu, Seoul 120-752, Korea. Tel: 82-2-2228-7400, Fax: 82-2-393-3035E-mail: [email protected]
∙ The authors have no financial conflicts of interest.
© Copyright:Yonsei University College of Medicine 2015
This is an Open Access article distributed under the terms of the Creative Commons Attribution Non-Commercial License (http://creativecommons.org/ licenses/by-nc/3.0) which permits unrestricted non-commercial use, distribution, and reproduction in any medium, provided the original work is properly cited.
Purpose: To investigate the optimal blending percentage of adaptive statistical it-erative reconstruction (ASIR) in a reduced radiation dose while preserving a de-gree of image quality and texture that is similar to that of standard-dose computed tomography (CT). Materials and Methods: The CT performance phantom was scanned with standard and dose reduction protocols including reduced mAs or kVp. Image quality parameters including noise, spatial, and low-contrast resolu-tion, as well as image texture, were quantitatively evaluated after applying various blending percentages of ASIR. The optimal blending percentage of ASIR that pre-served image quality and texture compared to standard dose CT was investigated in each radiation dose reduction protocol. Results: As the percentage of ASIR in-creased, noise and spatial-resolution decreased, whereas low-contrast resolution increased. In the texture analysis, an increasing percentage of ASIR resulted in an increase of angular second moment, inverse difference moment, and correlation and in a decrease of contrast and entropy. The 20% and 40% dose reduction proto-cols with 20% and 40% ASIR blending, respectively, resulted in an optimal quali-ty of images with preservation of the image texture. Conclusion: Blending the 40% ASIR to the 40% reduced tube-current product can maximize radiation dose reduction and preserve adequate image quality and texture.
Key Words: CT Image quality, iterative reconstruction, filtered back projection, radiation dose reduction, texture analysis
INTRODUCTION
Radiation doses can be reduced by lowering the tube current. However, there is a limit to tube current reduction with the currently used image reconstruction meth-od, filtered back projection (FBP). This is because reduction of the tube current‒time product increases image noise and influences the diagnostic image quality.1 Unlike FBP, the iterative reconstruction technique can reduce image noise even in low-dose computed tomography (CT) images, because it can be operated in raw data space and can accurately characterize data acquisition according to each phys-
Original Article http://dx.doi.org/10.3349/ymj.2015.56.1.253pISSN: 0513-5796, eISSN: 1976-2437 Yonsei Med J 56(1):253-261, 2015

Hyun Gi Kim, et al.
Yonsei Med J http://www.eymj.org Volume 56 Number 1 January 2015254
deep cavities, each with different sizes (3.2, 6.4, 9.5, 12.7, 19.1, and 25.4 mm) (Fig. 1C). The rows of the cavities are aligned on each side of the center line with the space be-tween the holes being equal to their diameters. These cavi-ties were filled with a solution of water and iodine contrast (Ultravist 300, Schering, Berlin, Germany) that had an at-tenuation value that differed by less than 10 HU compared to that of the background acrylic block. Texture analysis was also performed using the low-contrast resolution module.
CT data acquisitionAll CT acquisitions were obtained with a fast-kVp switch-ing dual-energy multi-detector CT scanner (Discovery CT 750 HD, GE Healthcare, Waukesha, WI, USA). We fol-lowed standard acquisition protocol (120 kVp, 250 mAs) for the AAPM phantom as suggested by the Korean Institute for Accreditation of Medical Image (KIAMI).12 Standard acqui-sition was set as the following: a tube current‒time product of 250 mAs, a tube voltage of 120 kVp, a section thickness of 0.625 mm, a 10 mm collimation, a 1-second gantry rota-tion time, a standard reconstruction algorithm, axial mode, a 50-cm acquisition field of view, and a 25-cm display field of view. Reconstruction slice thickness was 10 mm with an inter-slice distance of 10 mm. Data for reduced doses were obtained by using different tube current-time products (100, 150, and 200 mAs) or different tube voltages (80 and 100 kVp). The degree of ASIR blending after image acquisition was applied at six different levels: 0%, 20%, 40%, 60%, 80%, and 100%.
Quantitative image analysisFor the quantitative analysis, image noise was evaluated by measuring the SD of the CT numbers. A 4×4-cm2 square region of interest (ROI) was placed at the 6 o’clock posi-tion from the central metallic bar of the phantom, and a SD of the CT numbers (HU) was obtained (Fig. 1A). If the SD of the CT numbers was within 7 HU, the quality of image was considered acceptable.12 The SD of the CT numbers of each image from the different reduced radiation dose proto-cols and different percentages of ASIR were obtained.
To convert the acceptance limit of spatial resolution ac-cording to KIAMI more objective, the quantitative analysis tool was developed. Since 1.0-mm size holes (the accep-tance level of KIAMI) were readily differentiated by all the levels of radiation doses (including the lowest dose), 0.75 mm holes were selected for the reference instead of 1.0 mm holes. Using a software program (Aquarius intuition edi-
ical model of the CT system.1 The recently developed adap-tive statistical iterative reconstruction (ASIR; GE Health-care, Waukesha, WI, USA) technique uses both information obtained from FBP and iterative reconstruction. ASIR is mathematically less complex compared to the conventional iterative reconstruction technique, resulting in shorter pro-cessing times.2,3 There are several studies showing that ASIR could reduce radiation doses without degrading diag-nostic performance in various organs while providing the optimal blending percentage of ASIR.3-10 However, most of these studies involve qualitative image analysis or limited quantitative analysis, such as comparison of the standard de-viation (SD) of CT numbers from a sufficient number of pixels. Considering that the images with higher ASIR blend-ing percentages seem to lose their sharpness with artificial appearance,5 an objective image analysis using more pa-rameters than in previous studies might be needed to deter-mine an optimal blending percentage of ASIR.
Therefore, the purpose of this study was to investigate op-timal blending percentages of ASIR that should be applied to the conventional FBP images acquired with reduced radi-ation doses. Quantitative parameters (noise, spatial resolu-tion, low-contrast resolution, and image texture) of different percentages of ASIR images were compared with those of reference images using the CT performance phantom.
MATERIALS AND METHODS
PhantomThe American Association of Physicists in Medicine (AA-PM) CT performance phantom (model 76-410-4130, Nucle-ar Associates, Carle Place, NY, USA)11 consisted of several modules with different inserts for the evaluation of CT per-formance. A water tank module consisting of a water-filled acrylic cylinder 21.59 cm in outer diameter was used for the evaluation of image noise (Fig. 1A). Spatial resolution could be assessed with resolution blocks, which consist of eight sets of five holes (1.75, 1.5, 1.25, 1.00, 0.75, 0.61, 0.5, and 0.4 mm in circumference) (Fig. 1B). All cavities of holes were filled with air, and distances between the set of holes were equal to the holes’ diameter. Holes of at least 1.0 mm needed to be differentiated by the observer to meet the adequate level of spatial resolution [window width: 300 to 400 Hounsfield unit (HU); window level: -200 to -100 HU].12 In terms of low-contrast resolution, the AAPM phantom includes a solid acrylic block that has sets of two

Appropriate Percentage with Iterative Reconstruction
Yonsei Med J http://www.eymj.org Volume 56 Number 1 January 2015 255
was the average CNR value obtained from the standard protocol of 0% ASIR. As lower tube voltages result in dif-ferent HU values, due to the photoelectric effect, 80 and 100 kVp acquisition protocols were excluded from the low-contrast resolution comparison.9
Texture analysis can detect subtle differences in images. There are several mathematical methods and computer soft-ware programs dedicated to texture analysis. Among them, we adopted the grey-level co-occurrence matrices (GLCM) method,5,6 and an open plug-in of GLCM texture analysis for ImageJ (http://rsb.info.nih.gov/ij/plugins/) was used. Texture analysis was performed with CT images of a low-contrast resolution module, and five consecutive axial im-ages were loaded in ImageJ. A 130×130 pixel rectangular ROI was placed outside the cavities filled with iodine solu-tion. Five parameters were calculated by the GLCM texture plug-in, including angular second momentum (ASM), con-
tion, TeraRecon, San Mateo, CA, USA), a line passing the center of the 0.75 mm size holes was drawn, and a graph of the CT number (y-axis) differences along the line (x-axis) was made. The graph showed four peaks between the holes, and five HU differences between the valleys and peaks of each of the lines were obtained (Fig. 2). If the four HU peaks, which indicate high attenuation of the background between the five holes, have a specific level of difference compared to the background valley HU values, the results could objectively show that the five holes are well separated from the background image. Lines were drawn three times to reduce the HU value variation that was dependent on the position of the lines. The average value of the HU differenc-es was 49.4 HU with a standard FBP image. When we ap-plied different percentages of ASIR on the standard image, the 0.75-mm size holes could not be differentiated with ASIR blending percentages of 60% or higher, and the aver-age value of the HU differences was 29.8 at 60% ASIR blending. Hence, we set 30 HU as the cutoff value (round-ing up to the nearest whole unit), which meant that the av-erage HU differences between two holes should be at least 30 HU for discrimination.
To objectively evaluate low-contrast resolution, the con-trast noise ratio (CNR) was calculated using the following equation:
CNR=[(HU of the hole)-(HU of the background)]/SD of background
The HUs of the hole and the background were measured by drawing regions of interest (204.1 mm2) in and out of the largest hole of the image.
Three slices of each protocol image were selected to cal-culate the average CNR value. A CNR value >1.63 was considered an acceptable limit of quality because this limit
Fig. 1. American Association of Physicists in Medicine (AAPM) CT performance phantom. Selected blocks from the AAPM phantom were used to quantify noise (A), spatial resolution (B), low-contrast resolution, and texture (C).
A B C
Fig. 2. Schematic graph of a HU graph drawn by the linear HU difference between five holes of the same size. HU, Hounsfield unit.

Hyun Gi Kim, et al.
Yonsei Med J http://www.eymj.org Volume 56 Number 1 January 2015256
CTDIvol and DLP were obtained from the scanner console for each protocol.
RESULTS
NoiseNoise decreased with an increase in the percentage of ASIR (Fig. 3). Image noise was less than 7 HU in the majority of 60%, 40%, and 20% ASIR blended images with 100-mAs, 150-mAs, and 200-mAs acquisitions, respectively. With re-duction of the tube voltage to 80 kVp or 100 kVp (while maintaining 250 mAs), the noise value was less than 7 HU in 80% and 40% ASIR blended images, making the appro-priate ASIR percentage at least 80% and 40%, respectively.
Spatial resolutionThe average value of HU differences decreased with an in-creasing percentage of ASIR (Fig. 4A). With 100% ASIR, four peaks could not be differentiated from the HU graph; therefore, the average value of HU differences were not cal-culated (Fig. 4B). With 20% ASIR in the 100-mAs protocol, the average value of the HU differences was 31.8 HU, and with 40% ASIR, the average was 29.8 HU, making 20% the acceptable limit of ASIR blending. With the 150-mAs proto-col, 40% ASIR resulted in an average difference of 31.4 HU, and 60% ASIR resulted in an average of 21.8 HU, making 40% the acceptable limit of ASIR blending (Fig. 4C). With the 200-mAs protocol, the acceptable limit of ASIR blending was also 40% (with an average HU differ-ence of 33.4 HU). Compared to the standard protocol, 100 kVp resulted in higher HU differences without ASIR blend-
trast, correlation, inverse difference moment (IDM), and entropy. The ASM and IDM represent measures of homo-geneity. Contrast represents the amount of local variation present in an image. Correlation represents a measure of gray-tone linear dependencies within the image; a higher correlation value means a more consistent texture value along certain lines. Entropy represents randomness of the image; higher entropy values mean less homogeneous im-age textures.6,13 The average value of five consecutive im-ages was calculated each of the different radiation dose set-tings and blending percentages of ASIR.
Radiation dose assessmentThe CT dose index (CTDIvol, mGy) and dose length prod-ucts (DLPs, mGy*cm) were recorded in each protocol. A
Fig. 3. Noise (standard deviation of CT numbers) of different acquisition protocols according to increasing ASIR percentage. The reference line shows the acceptable noise value of 7. If the value is <7, the quality of im-age is considered acceptable. ASIR, adaptive statistical iterative recon-struction.
Fig. 4. Average HU differences between the peaks and valleys are shown according to increasing ASIR percentage. A difference of at least 30 HU needed to be met for optimal quality in terms of spatial resolution (A). Two graphs of the 150-mAs acquisition protocol with ASIR 100% (B) and 40% (C) are shown. HU, Hounsfield unit; ASIR, adaptive statistical iterative reconstruction.
ASIR blending percentage (%)
0.00
5.00
10.00
15.00
Noi
se (s
tand
ard
devia
tion
of C
T nu
mbe
rs)
0 20 40 60 80 100
100 mAs 150 mAs 200 mAs 80 kVp 100 kVp
ASIR blending percentage (%)
0.00
10.00
20.00
30.00
40.00
50.00
60.00
Spat
ial r
esol
utio
n (d
iffer
ence
s of C
T nu
mbe
rs)
0 20 40 60 80
100 mAs 150 mAs 200 mAs 80 kVp 100 kVp
A B C

Appropriate Percentage with Iterative Reconstruction
Yonsei Med J http://www.eymj.org Volume 56 Number 1 January 2015 257
mAs) with 20% ASIR also satisfied the required values of analyzed image qualities and texture parameters. The other acquisition protocols with reduced tube current-time product or tube voltage did not fulfill image quality requirements and failed to show similar image texture to that of standard images in corresponding percentages of ASIR.
Radiation dose The CTDIvol and DLP of standard protocol (120 kVp and 250 mAs) were 20.86 mGy and 834 mGy*cm, respectively. The CTDIvol and DLP of protocols of decreased tube cur-rent-time products were as follows: for the 100 mAs proto-col, 8.34 mGy and 333 mGy*cm (60.0% reduction); for the 150 mAs protocol, 12.51 mGy and 500 mGy*cm (40.0% reduction); and for the 200 mAs protocol, 16.69 mGy and 667 mGy*cm (20.0% reduction). The CTDIvol and DLP of decreased tube voltage protocols were as follows: for the 80 kVp protocol, 7.03 mGy and 281 mGy*cm (66.3% reduc-tion) and for the 100 kVp protocol, 13.16 mGy and 526 mGy*cm (36.9% reduction).
DISCUSSION
Our results showed that with an increase in the percentage of ASIR, noise and spatial resolution decreased, and low-contrast resolution increased. In the texture analysis, an in-crease in the percentage of ASIR resulted in an increase of ASM, IDM, and correlation and in a decrease of contrast and entropy. Blending 40% ASIR with a reduced tube cur-
ing; however, the limit of ASIR blending was 40% because 60% ASIR blending resulted in an average difference of 25.4 HU. The optimal blending percentage of ASIR with the 80 kVp acquisition protocol was 20%, as 20% recon-struction images showed an average HU difference of 30.6 HU and 40% ASIR reconstruction images showed an aver-age HU difference of 22.8 HU.
Low-contrast resolutionLow-contrast resolution increased with an increasing per-centage of ASIR (Fig. 5). With the 100 mAs acquisition pro-tocol, the CNR value was 1.42 with 40% ASIR but 1.70 with 60% ASIR, making 60% the lowest ASIR required. With the 150-mAs acquisition protocol, the CNR value was 1.56 with 20% ASIR but 1.71 with 40% ASIR, making 40% the lowest ASIR required. With the 200-mAs acquisition protocol, the CNR value was 1.46 without ASIR but 1.70 with 20% ASIR, making 20% the lowest ASIR required.
TextureFig. 6 includes five texture analysis graphs showing the dif-ferent texture feature values according to an increase in the percentage of ASIR at different acquisition protocols. With increasing percentage of ASIR, ASM, IDM, and correlation values increased, representing higher texture uniformity and homogeneity for higher percentages of ASIR (Fig. 6A, B, and C). However, contrast and entropy values decreased with increasing percentages of ASIR, representing increased uni-formity of gray images and decreased randomness in the image (Fig. 6D and E). With the 100-mAs acquisition pro-tocol, 60% ASIR resulted in images closest to the standard image texture for all five features. The 150 and 200 mAs protocols required only 40% and 20% ASIR (respectively) to obtain the closest texture feature values to that of a stan-dard image. With the 80-kVp protocol, the appropriate per-centage of ASIR varied between 60% or 80%, depending on the texture features. With the 100-kVp protocol, all of the other four features except for correlation showed similar values to standard images with 40% ASIR.
Overall assessment of quantitative analysisThe respective results of the quality of each image are sum-marized in Table 1. The reduced tube-current time product of 40.0% (from 250 mAs to 150 mAs) with 40% ASIR sat-isfied all the noise, spatial, and low contrast resolution, as well as the five parameters of image texture. The reduced tube-current time product of 20.0% (from 250 mAs to 200
Fig. 5. Contrast to noise ratio that was obtained to quantify low-contrast resolution according to an increase in the percentage of ASIR. The refer-ence line indicates a value of 1.63, which was defined as the lowest ac-ceptable limit. ASIR, adaptive statistical iterative reconstruction.
ASIR blending percentage (%)
0.00
2.00
1.00
3.00
4.00
Cont
rast
to n
oise
ratio
0 20 40 60 80 100
100 mAs 150 mAs 200 mAs

Hyun Gi Kim, et al.
Yonsei Med J http://www.eymj.org Volume 56 Number 1 January 2015258
According to previous reports, image noise can be de-creased by increasing the blending percentage of ASIR,2,4 and a previous phantom study determined that noise de-creased about 75% and 50% from the original image with
rent-time product of 150 mAs (40% dose reduction) result-ed in quantitatively acceptable image quality in terms of noise, spatial, and low-contrast resolution and showed simi-lar image texture to that of standard-dose CT images.
Fig. 6. Texture analysis graphs showing five different texture features according to an increase in the percentage of ASIR: angular second moment (A), in-verse different moment (B), correlation (C), contrast (D), and entropy (E). The reference line of each graph shows the value of standard images.
ASIR blending percentage (%)
ASIR blending percentage (%) ASIR blending percentage (%)
ASIR blending percentage (%) ASIR blending percentage (%)
5.500
0.000 0.000
0.000 0.000
6.500
0.005100.000
0.001
0.100
6.000
7.500
0.200
7.000
0.010
200.000
0.002
8.500
0.020
0.004 0.300
8.000
0.015
300.000
0.003
Entro
pyCo
rrela
tion
Cont
rast
Angu
lar s
econ
d m
omen
t
Inve
rse
diffe
rent
mom
ent
0
0 0
0 0
20
20 20
20 20
40
40 40
40 40
60
60 60
60 60
80
80 80
80 80
100
100 100
100 100
Protocol 100 mAs 150 mAs 200 mAs 80 kVp 100 kVp
E
C D
A B
Protocol 100 mAs 150 mAs 200 mAs 80 kVp 100 kVp
Protocol 100 mAs 150 mAs 200 mAs 80 kVp 100 kVp
Protocol 100 mAs 150 mAs 200 mAs 80 kVp 100 kVp
Protocol 100 mAs 150 mAs 200 mAs 80 kVp 100 kVp
Appropriate Percentage with Iterative Reconstruction
Yonsei Med J http://www.eymj.org Volume 56 Number 1 January 2015 259
In terms of low-contrast resolution, most previous studies have reported unanimous results that an increase in the per-centage of ASIR resulted in increased low-contrast resolu-tion, which is consistent with our results.2,5,7,10 The CNR was calculated from the HU difference between the cavity and the background divided by the noise value. As noise decreases in proportion to the blending percentage of ASIR without changing the HU of both the cavity and the back-ground, the CNR could only increase. Therefore, although CNR decreases with reduced tube current-time product due to noise elevation, it could be preserved with an adequate percentage of ASIR, which decreases noise.1 Our results also showed that when a 40% or higher percentage of ASIR is applied, 150 mAs can achieve a higher CNR value of 1.63. Therefore, we were able to quantitatively confirm that with lower tube current-time product protocols, an increased blending percentage of ASIR was necessary to achieve a CNR similar to the standard-dose protocol. However, since the CNR cannot directly represent cavity detectability and potential outcome of diagnostic performances, further inves-tigation on this aspect should be done with the clinical data.
In quantitative texture analysis, the results met expecta-tions. With an increase in ASIR blending percentage, image homogeneity (ASM and IDM values) and consistency in tex-ture along certain lines (correlation) also increased, whereas the amount of local variation (contrast) and randomness in the image (entropy) decreased. These results suggest that not only image noise but also image texture parameters are affected by the blending percentage of ASIR. Previous re-ports have shown differences of acquired images depend-ing on subjective methods or on quantitative methods using the SD of CT numbers. However, these methods for com-paring noise texture are not sufficient for texture analysis.
100% and 50% ASIR, respectively.2 In our results, image noise decreased with an increase in the percentage of ASIR, which was comparable with the results of the previous study. However, the degree of noise reduction according to ASIR blending varied among different dose reduction proto-cols. With 40% ASIR blending, about 50% noise reduction was achieved in the 200-mAs dose reduction protocol (8.1 HU→4.0 HU), whereas only about 30% noise reduction was achieved in the 150-mAs protocol (8.6 HU→5.9 HU). Dose reduction protocols might be different from center to center due to varying patient demographics such as BMI, and our results suggest that an optimal ASIR blending per-centage should be tailored to various site-specific radiation dose protocols.
Some controversy exists regarding the effect of iterative reconstruction on spatial resolution. Several studies reported that spatial resolution is not affected or increased by iterative reconstruction compared to FBP images,8,14 whereas another study reported that spatial resolution decreased after applying iterative reconstruction.2 In our study, spatial resolution was preserved up to certain threshold of the ASIR blending per-centage with each decreased tube time-current product and tube voltage protocol. However, when ASIR was blended more than the threshold percentage, the spatial resolution did not meet either of our quantitative standards. These results might be due to the blurred change of the image which was represented as decreased HU difference between the two small cavities. The discordance between the previous studies and ours might be due to the comparison of fixed tube time-current product reductions and ASIR blending percentages in the previous studies; in contrast, we compared images of var-ious reduced tube current-time product and tube voltages with various blending percentages of ASIR.
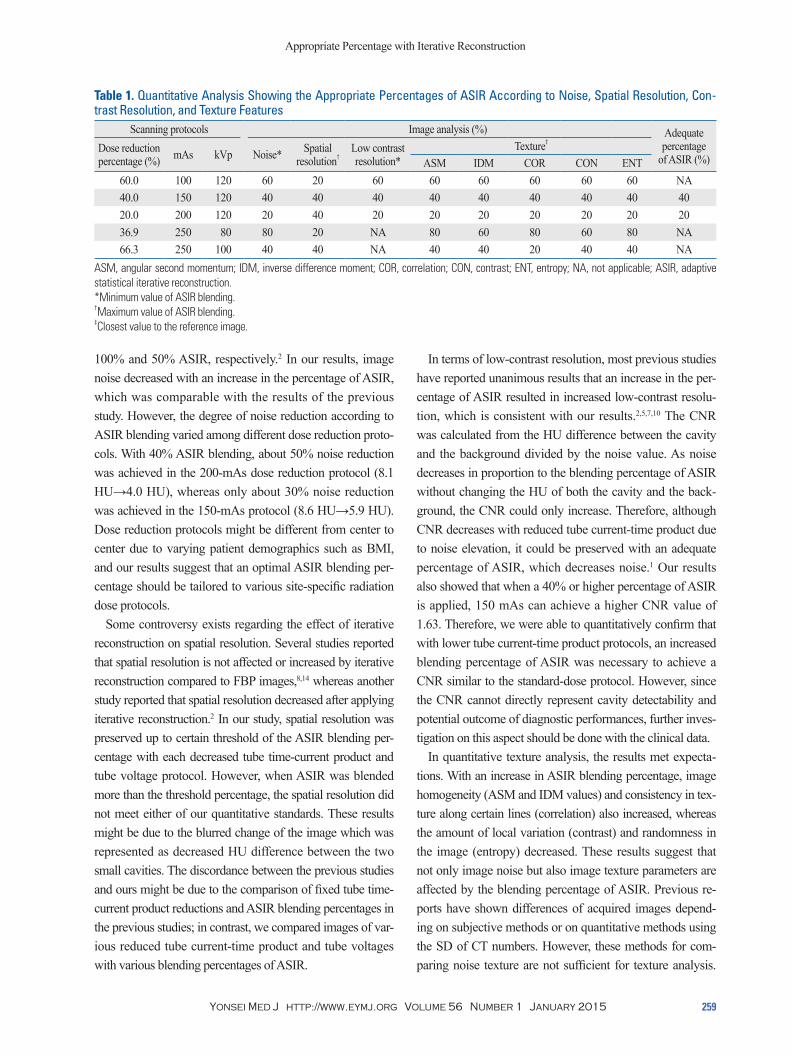
Table 1. Quantitative Analysis Showing the Appropriate Percentages of ASIR According to Noise, Spatial Resolution, Con-trast Resolution, and Texture Features
Scanning protocols Image analysis (%) Adequate percentage
of ASIR (%)Dose reduction percentage (%) mAs kVp Noise* Spatial
resolution†Low contrast resolution*
Texture‡
ASM IDM COR CON ENT60.0 100 120 60 20 60 60 60 60 60 60 NA40.0 150 120 40 40 40 40 40 40 40 40 4020.0 200 120 20 40 20 20 20 20 20 20 2036.9 250 80 80 20 NA 80 60 80 60 80 NA66.3 250 100 40 40 NA 40 40 20 40 40 NA
ASM, angular second momentum; IDM, inverse difference moment; COR, correlation; CON, contrast; ENT, entropy; NA, not applicable; ASIR, adaptive statistical iterative reconstruction.*Minimum value of ASIR blending. †Maximum value of ASIR blending. ‡Closest value to the reference image.
Hyun Gi Kim, et al.
Yonsei Med J http://www.eymj.org Volume 56 Number 1 January 2015260
our study should be confirmed with patient data in the fu-ture. Although we have not proven the diagnostic perfor-mance with patients, as long as the aim of the study was to analyze image quality that is affected by the reconstruction methods, we expect that this study can provide a quantita-tive method to evaluate dose reduction protocols with dif-ferent reconstruction methods in future studies with patients or an anthropomorphic phantom. Second, images with sim-ilar textures to standard-dose CT images were selected for choosing the optimal ASIR blending percentage. However, a similar texture to the reference image does not directly re-sult in better diagnostic accuracy, and the relationship be-tween image texture and diagnostic accuracy should be confirmed in future studies.
In conclusion, both noise and spatial resolution decreased with an increase in the percentage of ASIR, whereas low-contrast resolution increased with an increase in the percent-age of ASIR. In texture analysis, an increase in the percent-age of ASIR resulted in an increase of ASM, IDM and correlation and in a decrease in contrast and entropy. Apply-ing 40% ASIR to FBP images of 40% reduced time tube-cur-rent product (from 250 mAs to 150 mAs) satisfied standard image quality and texture expectations in quantitative ways.
ACKNOWLEDGEMENTS
We thank Kyung Suk Seo and Min Jeong Yun who are em-ployees of GE Healthcare Korea, for technical assistance.
This work was supported by the a faculty research grant of Yonsei University College of Medicine (6-2012-0039).
REFERENCES
1. Silva AC, Lawder HJ, Hara A, Kujak J, Pavlicek W. Innovations in CT dose reduction strategy: application of the adaptive statisti-cal iterative reconstruction algorithm. AJR Am J Roentgenol 2010;194:191-9.
2. Brenner DJ, Hall EJ. Computed tomography--an increasing source of radiation exposure. N Engl J Med 2007;357:2277-84.
3. Singh S, Kalra MK, Gilman MD, Hsieh J, Pien HH, Digumarthy SR, et al. Adaptive statistical iterative reconstruction technique for radiation dose reduction in chest CT: a pilot study. Radiology 2011;259:565-73.
4. Brady SL, Yee BS, Kaufman RA. Characterization of adaptive sta-tistical iterative reconstruction algorithm for dose reduction in CT: A pediatric oncology perspective. Med Phys 2012;39:5520-31.
5. García G, Maiora J, Tapia A, De Blas M. Evaluation of texture for classification of abdominal aortic aneurysm after endovascular re-
Other methods such as noise spectrum or histogram analysis can be used to perform texture analysis; however, these methods are often time consuming and inaccessible to radi-ologists. Additionally, studies have yet to indicate that these methods are sufficient for texture analysis of CT images. Therefore, although it is not a well-established analysis tech-nology for CT images, the GLCM method, which was pre-viously used as a purely mathematical calculation, has been used to perform texture analysis.13 Moreover, we hypothe-sized that if original images and ASIR images can be shown to have similar texture parameters through the GLCM meth-od, the results will correctly identify the similarity of the two images.
In terms of the overall quantitative assessment in our phantom study, image noise and low-contrast resolution set the minimum limit of the ASIR blending percentage, and spatial resolution set the maximum limit. In terms of texture analysis, each quantitative parameter had the closest value to the reference image (i.e., the standard-dose CT image). In the 100-mAs protocol (dose reduction of 60.0%) and the 80-kVp protocol (dose reduction of 36.9%), there was a dis-crepancy between the minimum percentage of ASIR that needed to be applied to compensate for increased noise and decreased low-contrast resolution and the maximum per-centage of ASIR needed to maintain adequate spatial resolu-tion. Therefore, there was no adequate ASIR blending per-centage for those two protocols. For the 100-kVp protocol (dose reduction of 66.3%), 40% ASIR performed well for both the noise and spatial resolution standards. Four of five texture parameters also manifested image textures similar to the standard-dose CT image, but the IDM showed a tex-ture similar to that of the standard image in 20% ASIR blending. The 200-mAs (dose reduction of 20.0%) and 150-mAs (dose reduction of 40.0%) protocols satisfied the image quality standards with 20% and 40% of ASIR, respectively. Between the two quantitatively qualifying protocols, the 150-mAs protocol with 40% ASIR blending seemed to be more appropriate when considering the radiation dose re-duction effect. This result was similar to that of a previous study which compared the noise spectrum curve of FBP and ASIR images in a water phantom and showed that ap-plying 40% ASIR was considered optimal when the radia-tion dose is reduced to 50%.5
Several limitations of our study merit consideration. First, this study was performed using a phantom. Consider-ing that the image quality of a low-dose CT might manifest differently according to the BMI of patients, the results of

Appropriate Percentage with Iterative Reconstruction
Yonsei Med J http://www.eymj.org Volume 56 Number 1 January 2015 261
10. Prakash P, Kalra MK, Digumarthy SR, Hsieh J, Pien H, Singh S, et al. Radiation dose reduction with chest computed tomography using adaptive statistical iterative reconstruction technique: initial experience. J Comput Assist Tomogr 2010;34:40-5.
11. Judy P, Balter S, Bassano D, McCullough E, Payne J, Rothenberg L. AAPM report No. 1 phantoms of performance evaluation and quality assurance of CT scanner. Chicago, IL: American Associa-tion of Physicists in Medicine; 1977.
12. Park HJ, Jung SE, Lee YJ, Cho WI, Do KH, Kim SH, et al. The relationship between subjective and objective parameters in CT phantom image evaluation. Korean J Radiol 2009;10:490-5.
13. Haralick RM, Shanmugam K, Dinstein IH. Textural features for image classification. IEEE Trans Syst Man Cybern B Cybern 1973;3:610-21.
14. May MS, Wüst W, Brand M, Stahl C, Allmendinger T, Schmidt B, et al. Dose reduction in abdominal computed tomography: intrain-dividual comparison of image quality of full-dose standard and half-dose iterative reconstructions with dual-source computed to-mography. Invest Radiol 2011;46:465-70.
pair. J Digit Imaging 2012;25:369-76. 6. Kato H, Kanematsu M, Zhang X, Saio M, Kondo H, Goshima S,
et al. Computer-aided diagnosis of hepatic fibrosis: preliminary evaluation of MRI texture analysis using the finite difference method and an artificial neural network. AJR Am J Roentgenol 2007;189:117-22.
7. Yanagawa M, Honda O, Yoshida S, Kikuyama A, Inoue A, Sumi-kawa H, et al. Adaptive statistical iterative reconstruction tech-nique for pulmonary CT: image quality of the cadaveric lung on standard- and reduced-dose CT. Acad Radiol 2010;17:1259-66.
8. Prakash P, Kalra MK, Kambadakone AK, Pien H, Hsieh J, Blake MA, et al. Reducing abdominal CT radiation dose with adaptive statistical iterative reconstruction technique. Invest Radiol 2010; 45:202-10.
9. Mendler MH, Bouillet P, Le Sidaner A, Lavoine E, Labrousse F, Sautereau D, et al. Dual-energy CT in the diagnosis and quantifi-cation of fatty liver: limited clinical value in comparison to ultra-sound scan and single-energy CT, with special reference to iron overload. J Hepatol 1998;28:785-94.