
Quantifying Bounded Rationality: Managerial Behaviour and ...
Upload
tristan-wiggillCategory
view
317download
1
Eugene Herbert
QUANTIFYING THE VALUE OF MANAGING DRIVER BEHAVIOUR
WITH KEY FLEET MANAGEMNT TOOLS


Driven by what ?
Business Savvy?
Rubber
Stamp ?
Current and
take cognizance
of Challenges
first point.
WFM ?
AARTO. Corruption
In vehicles and fitted to
vehicles
Availability / Skills /
Culture
Infrastructure
deteriorating
(Driver) (Supervisor) (Management)
(Policies) (Law) (COPS) (Roads)
(Technology) (Incentives)

RISK !


Risk Homeostasis Theory
"Risk Homeostasis Theory maintains that, in any activity, people accept a certain level of subjectively estimated risk to their health, safety, and other things they value, in exchange for the benefits they hope to receive from that activity (transportation, work, eating, drinking, drug use, recreation, romance, sports or whatever)."


DANGER THERMOSTAT
Wilde argues that safety campaigns tend to move accidents around rather than reduce them because traditional approaches do not motivate individuals to change their "target level" of risk, the amount of risk they are willing to accept in their everyday lives
People have a sort of built-in danger thermostat, he says, a subconscious sense of ambient risk. Make things safer in one aspect of their lives, and they will tend to use up this safety benefit by adapting their behaviour to the new reality and increasing risk-taking in another.

TECHNOLOGY
Recent revelations about the effects of automobile antilock braking systems (ABS) on crash rates lend weight to Professor Wilde's theory. The systems work. They help prevent skidding and offer drivers better control in emergencies. But evidence shows that drivers with ABS-equipped vehicles tend to drive faster and rely more on their brakes than drivers who don't have the devices. According to the U.S. Highway Loss Data Institute the systems have not reduced either the frequency or the cost of crashes

Your attendance at this work shop !
So, which of the two risky decisions do you take?"

THE MUNICH TAXICAB STUDY The drivers were not aware that their driver behaviour was being observed and the observers did not know whether they were in a taxi with ABS or without. The drivers did, of course, know whether or not they were operating an ABS cab, because of their familiarity with the car they were driving.
Subsequent analysis of the rating scales showed that drivers of cabs with ABS made sharper turns in curves, were less accurate in their lane-holding behaviour, proceeded at a shorter forward sight distance, made more poorly adjusted merging manoeuvres and created more 'traffic conflicts'."

ON TRAFFIC LIGHTS AND ACCIDENTS ATINTERSECTIONS
Traffic lights are not to be condemned, but-contrary to naive opinion among some professionals and the general public-they serve no safety purpose, not even in the intersections proper or in their immediate vicinity.
Numerous studies on the effect of traffic lights on accidents have compared the numbers of accidents at intersections before and after installation

The effect is that fewer right-angle accidents happen, but more rear-end accidents, as well as left-turn and side-swipe collisions, occur, and the total frequency remains roughly the same.
The latter is also true for the average severity of intersection accidents. Although driver actions are drastically altered by these devices, accident loss is not, and the risk remains the same."

MANAGING RISK
"If a person's decision-making or vehicle-handling skills are poor, that person's level of perceived risk should be high, and if it is not, this reflects overconfidence in one's skills.
The same holds for sensory abilities. To be colour-blind or hard of hearing does not imply a significant increase in accident liability, provided the driver considers these handicaps in the estimationon of risk.
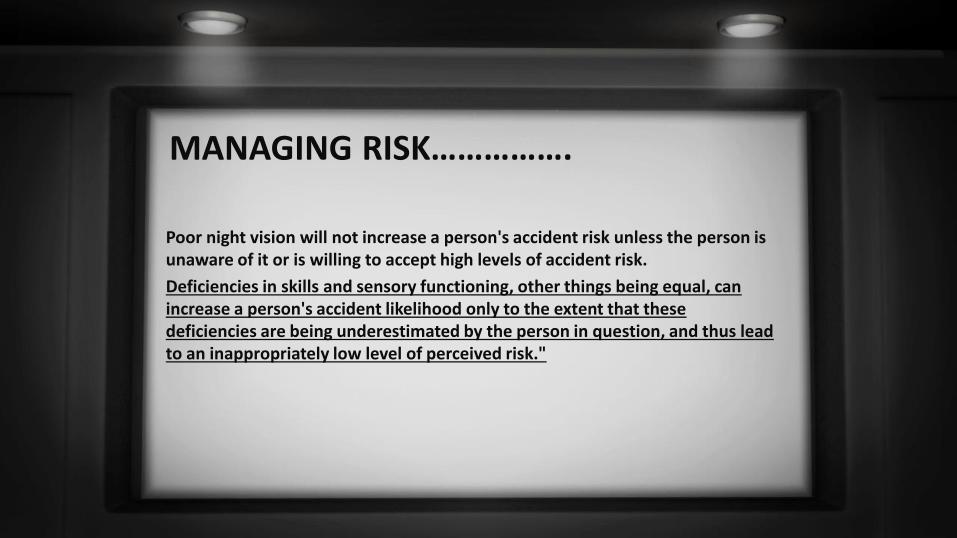
MANAGING RISK…………….
Poor night vision will not increase a person's accident risk unless the person is unaware of it or is willing to accept high levels of accident risk.
Deficiencies in skills and sensory functioning, other things being equal, can increase a person's accident likelihood only to the extent that these deficiencies are being underestimated by the person in question, and thus lead to an inappropriately low level of perceived risk."

Does cautious mean safe?...
"...Mrs. Cautious Driver presents an interesting paradox. She was very careful indeed, in fact, so careful that her behaviour was rather unpredictable to other drivers.
…This made her liable to having accidents. On the other hand, if everybody were to behave as cautiously as she, there would be fewer crashes."

ARE WE UNIQUE ?

EXAMINE WHAT HAPPENS IN AN
AFRICAN CONTEXT

CHANGED DRIVER BENEFITS EVIDENT
• SUBSTANTIAL FUEL SAVINGS
• LESS CRASHES
• SEVERITY OF CRASHES REDUCED
• FUEL SAVING
• IMPROVED PRODUCTIVITY

DRIVER BEHAVIOR AND EVENT MONITORING Driver Behavior events
oHarsh Accelerate
oHarsh Brake
oHarsh Corner
oHarsh Bump
oOver-speeding
oExcess Idle
oOver RPM


OPERATIONAL COSTS
Fleet management solution saves a Transport Company 80 000 litres of fuel in six months
• A Transport and Warehousing Company recently reported that Ctrack, saved them 80 000 litres of fuel over their entire fleet of 250 vehicles in 2015 over just a period of six months. This was due largely to managing drivers’ speed violations and reducing downtime of their vehicles, which was made possible by utilising Ctrack’s advanced fleet management solution.
• The results were impressive. In the second quarter of 2015, speeding events were reduced by 48%, while a fuel saving of 2% was seen. During the third quarter, there was a further reduction of 32% in speeding events, together with a fuel saving of 2%. This equals to a fuel saving of 80 000 litres (approximately R900 000) over two quarters in 2015.


PROBLEM STATEMENT
Global statistics suggest approximately 85% of road incidents arethe result of human error
Estimates suggest further that fatigue contributes to approximately30% of all fatal incidents and 15% of incidents causing serious injury
The African region remains the least motorised of the six worldregions, possessing only 2% of the world’s vehicles, but suffers thehighest rates of road traffic fatalities, contributing up to 16% ofglobal road fatalities

MICROSLEEP
FRIGHTENING FACT: The reaction time of a driver who has beenawake for 17-19 hours is similar to the reaction time of a driver at thelegal alcohol limit. Not sleeping for 20–25 hours will reduce a driver’sreaction time to the equivalent reaction time of someone that is twicethe legal limit.
The Si lent K i l ler
You can drift in and out of sleep without knowing it. Sleep experts referto this as a microsleep and its duration can be up to 30 seconds

MANAGING FATIGUE
Cutting Edge Technology
Advanced algorithms to detect driver fatigue and distraction in
Pro-active telematics unit that can prevent accidents IN real-time
Immediate in-cab intervention– alarm and vibrating seat
Discreet dash-mounted sensors
Over-speed, harsh braking, rapid cornering and cell phone use alerts
24/7/365 Call centre intervention
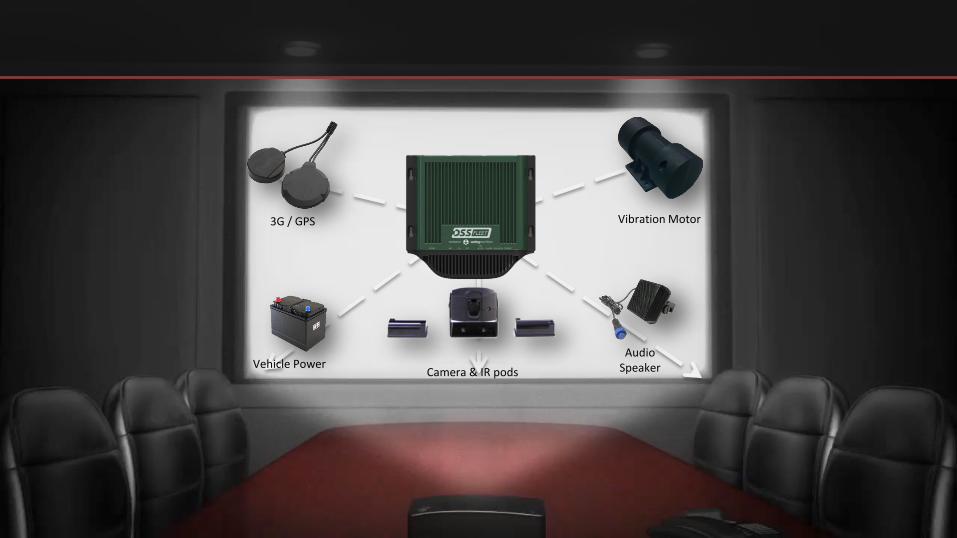
Vehicle PowerCamera & IR pods
Audio Speaker
Vibration Motor 3G / GPS

FATIGUE & DISTRACTION MONITORING

PROCESS

Passive camera system

In-cab driver alerts
Driver falling asleep with in-cab alerts active

TESTED ……..Reduction of 80% in fatigue and distraction related events following implementationof DSS
0,0
0,2
0,4
0,6
0,8
1,0
1,2
1,4
1,6
Fatigue E
vents
per
mobile
hour
(Norm
aliz
ed r
ate
)
DSS baseline testing
DSS enabled & basic training DSS enabled & FMP implemented
80% reduction in fatigue and distraction.
Time

BENEFITSSpeed Monitoring and Fatigue Detection
Immediate Driver Alert
Distraction Events e.g. cell phone
Call Centre Monitoring and Client Notification
Improved Road Safety
Change Driver Behaviour e.g. Awareness increases
Demonstrate Stakeholder Commitment

SUCCESSFUL OUTCOMES
Lowered risk in operations
Economical benefits
Safer Roads for all South Africans
Increased operational visibility –Proactive vs Reactive
Fuel saving
Reduction in maintenance costs
Insurance premium discount

PUT THE SPOTLIGHT ON CAMERAS
“I have worked with DriveCam (now DriveRisk) since 13th February 2014 in my capacity as the project lead on a Driving Safety Project for BPSA (Pty) Ltd. Our project is aimed at improving our drivers’ safety and going beyond the standard interventions with both engineering solutions on the vehicles and driver training and awareness. Initially, there was some resistance to fully utilising the plethora of data and access to in-depth analysis which limited the positive impact of DriveRisk on improving driver safety. However, in-house workshops were held with our drivers and supervisors to discuss their concerns and resistance. The outcomes of these workshops were used to engage Ben Bezuidenhout who designed a session that would assist us in addressing the behavioral aspects that needed addressing before the data could be used in a positive way to reinforce good practices and awareness. These sessions were held at all of our depots across South Africa. We received excellent feedback from DriveRisk that we now need to use to continue to emphasize the key aspect of positive reinforcement with our drivers. To date we have seen a steady decline in the number of incidents and an increase in coaching events for positive actions.” Nigel Lees National SHEQ Manager BPSA (Pty) Ltd


Accident Investigation Specialist
“The driver of the 3rd party vehicle did not stop at the mandatory stop. From the on-board
video camera in the truck it can it can clearly be seen that the party vehicle did not stop, but
continued straight onto the R34.” “The positioning of the Volvo on approach to the
intersection at approximately 1 second prior to impact, an approximate distance of 20
meters and at the indicated speed of 72 km/hr. would therefore have been wholly
insufficient time to have avoided the accident at all.”
Conclusion “ Based on the evidence supplied and sourced, set out herein, the following
conclusions and/or indications can be made: It remains highly improbable (Virtually
Impossible) that the driver of the Volvo would have avoided the accident. It must reasonably
be assumed that at some point prior to impact that even if the Volvo driver had reduced his
speed as a precautionary action (let`s assume to 60km/h), the Toyota would nonetheless
have entered the path of the Volvo.
Assuming various factors it can be calculated that the Volvo would have required a distance
and time of approximately 41.3meters and 4 seconds respectively to have brought his
vehicle to a stop from 60km/h. “ Report compiled by Mr. C Proctor – Parker (Accident Specialist).

MASTERDRIVE DRIVING ASSESSMENT
Conclusion: Had the drive not been in a state of micro sleeping he would have noticed the suspicious pedestrian at around 00:03. At this point he had enough distance and time to reduce speed and alter his position to deal with the pedestrian effectively and safely. The standard defensive driver awareness tool is S.I.P.D.E – Search. Identify. Predict. Decide. Execute.) Clearly this was not used or even considered by the driver. As a defensive driver the definition states that he should “drive so as to prevent a crash despite the incorrect action of other road users in all weather, road or traffic conditions”. Drive Safely, Gary Clackworthy Group General Manager & Operations Director Tel: 011 867 4778 / 0861 100 618 Fax: 086 671 9051 Email: [email protected]

• Save you money on Fuel• Reduce crashes• Improve Productivity• Stop Drivers Sleeping on the job
None of which can be done without establishing a baseline.
PUT THE SPOTLIGHT ON PROMISES
RISK ASSESSMENT.


Main Content Page Layout

Qualified personnel to interpret information
Contextualize information gleaned from technology
Formulate training methodology to see improvement -benchmark
Ongoing engagement with management and drivers to re-enforce values
DRIVER BEHAVIOR
DATA MINING
DATA ANALYSIS -PRE
DATA PLANNING
DATA ANALYSIS -POST


Centrifugal Force
Influenced by speed and changed road conditions
Centre of Gravity
Affected by height and components of weight
Slosh and Surge
Tanker design combined with road conditions.
Data Assessed in Terms of :

BRAND
Fatalities
Productivity
insurance
Liability
Crashes
Speeding

Questions? Need More Information?
Eugene Herbert
Tel: 0861100618
www.masterdrive.co.za