Quantifying the Level of Gerrymandering in Michigan · Anne Mervenne Mervenne & Company Aleksandra...
50
June 2018 | Report 402 Quantifying the Level of Gerrymandering in Michigan 102 YEARS OF UNCOMPROMISING POLICY RESEARCH 38777 Six Mile Road, Suite 208 | Livonia, MI 48152 | 734.542.8001 115 West Allegan, Suite 480 | Lansing, MI 48933 | 517.485.9444 P.O. Box 1612 | Holland, MI 49422 | 616-294-8359 | crcmich.org
Transcript of Quantifying the Level of Gerrymandering in Michigan · Anne Mervenne Mervenne & Company Aleksandra...

June 2018 | Report 402
Quantifying the Level of Gerrymandering in Michigan
102 YEARS OF UNCOMPROMISING POLICY RESEARCH
38777 Six Mile Road, Suite 208 | Livonia, MI 48152 | 734.542.8001 115 West Allegan, Suite 480 | Lansing, MI 48933 | 517.485.9444
P.O. Box 1612 | Holland, MI 49422 | 616-294-8359 | crcmich.org

BOARD OF DIRECTORS
Citizens Research Council of Michigan is a tax deductible 501(c)(3) organization
Chair Aleksandra A. MiziolekVice Chair Michael P. McGeeTreasurer Laura Appel
Todd AndersonBlue Cross Blue Shield of MichiganLaura AppelMichigan Health & Hospital AssociationBeth A. BialyPlante Moran, PLLCLawrence N. BluthPenske CorporationChase CantrellBuilding Community ValueStephan W. CurrieMichigan Association of Counties
Daniel DomenicucciErnst & Young LLPTerence M. DonnellyDickinson Wright PLLCRandall W. EbertsW. E. Upjohn InstituteRichard A. Favor, Jr.DeloitteJune Summers HaasHonigman Miller Schwartz and Cohn LLPJim HolcombMichigan Chamber of CommerceMarybeth S. HoweWells Fargo BankWendy Lewis JacksonThe Kresge FoundationHarry KempLear CorporationMichael P. McGeeMiller, Canfield, Paddock and Stone PLC
Anne MervenneMervenne & CompanyAleksandra A. MiziolekCooper Standard Paul R. ObermeyerComerica BankJames M. PolehnaKelly ServicesJulie RidenourSteelcase FoundationCamilo SernaDTE EnergyCarolee K. SmithConsumers EnergyChristine Mason SoneralITC Holdings Corp.Kathleen WilburMichigan State University
ChairEugene A. Gargaro, Jr.
Terence E. AdderleyKelly Services, Inc.Laura AppelMichigan Health & Hospital AssociationDonald BachandSaginaw Valley State UniversityBeth ChappellRediMinds, Inc.Brian M. ConnollyOakwood Healthcare, Inc., RetiredMatthew P. CullenRock Ventures LLCStephen R. D’ArcyDetroit Medical CenterRichard DeVore PNC BankTerence M. Donnelly Dickinson Wright PLLCJohn M. DunnWestern Michigan University
David O. EgnerRalph C. Wilson, Jr. FoundationDavid L. EislerFerris State UniversityFritz EricksonNorthern Michigan UniversityMark T. GaffneyTeamsters 214Eugene A. Gargaro, Jr.Manoogian FoundationDan GilmartinMichigan Municipal LeagueAllan D. GilmourWayne State University, EmeritusAlfred R. Glancy IIIUnico Investment Group LLCThomas J. HaasGrand Valley State UniversityRichard C. HampsonCitizens BankPaul C. HillegondsMichigan Health Endowment FundMarybeth S. HoweWells Fargo Bank
Daniel J. KellyDeloitte. RetiredMary KramerCrain Communications, Inc.William J. Lawrence, III42 North Partners LLCEdward C. Levy, Jr.Edw. C. Levy Co.Daniel T. LisAttorney-At-LawDaniel LittleUniversity of Michigan-DearbornAlphonse S. LucarelliErnst & Young LLP. Retired Michael P. McGeeMiller, Canfield, Paddock and Stone PLCLarry MerrillMIchigan Townships AssociationAnne MervenneMervenne & Co.Aleksandra A. MiziolekCooper StandardGlenn D. MrozMichigan Technological University
James M. NicholsonPVS ChemicalsDon R. ParfetApjohn Group LLCPhilip H. PowerThe Center for MichiganJames E. ProppePlante MoranJohn Rakolta Jr.WalbridgeMilton W. RohwerTALENT 2025George E. RossCentral Michigan UniversityJohn M. SchreuderFirst National Bank of MichiganAmanda Van DusenMiller, Canfield, Paddock and Stone PLCTheodore J. VogelCMS Energy Corporation, Retired
BOARD OF TRUSTEES
Quantifying the Level of Gerrymandering in Michigan
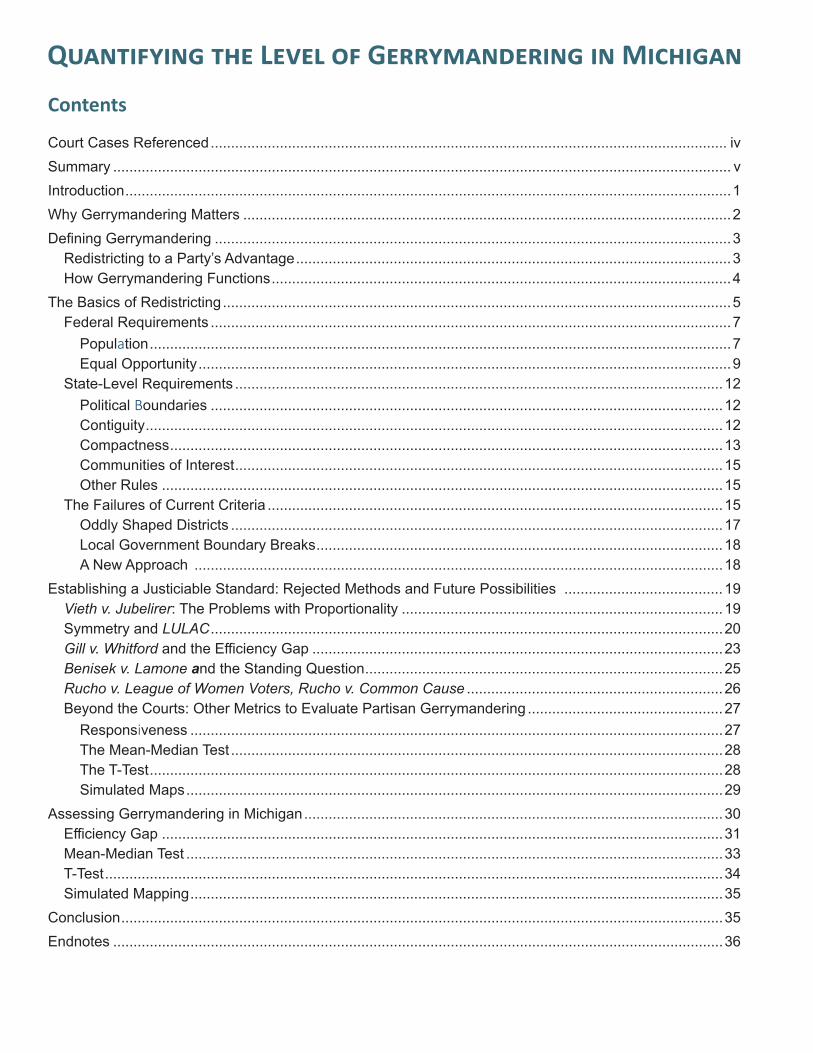
Contents
Court Cases Referenced ............................................................................................................................... ivSummary ........................................................................................................................................................ vIntroduction .....................................................................................................................................................1Why Gerrymandering Matters ........................................................................................................................2Defining Gerrymandering ...............................................................................................................................3
Redistricting to a Party’s Advantage ...........................................................................................................3How Gerrymandering Functions .................................................................................................................4
The Basics of Redistricting .............................................................................................................................5Federal Requirements ................................................................................................................................7
Population ...............................................................................................................................................7Equal Opportunity ...................................................................................................................................9
State-Level Requirements ........................................................................................................................12Political Boundaries ..............................................................................................................................12Contiguity ..............................................................................................................................................12Compactness ........................................................................................................................................13Communities of Interest ........................................................................................................................15Other Rules ..........................................................................................................................................15
The Failures of Current Criteria ................................................................................................................15Oddly Shaped Districts .........................................................................................................................17Local Government Boundary Breaks ....................................................................................................18A New Approach ..................................................................................................................................18
Establishing a Justiciable Standard: Rejected Methods and Future Possibilities .......................................19Vieth v. Jubelirer: The Problems with Proportionality ...............................................................................19Symmetry and LULAC ..............................................................................................................................20Gill v. Whitford and the Efficiency Gap .....................................................................................................23Benisek v. Lamone and the Standing Question ........................................................................................25Rucho v. League of Women Voters, Rucho v. Common Cause ...............................................................26Beyond the Courts: Other Metrics to Evaluate Partisan Gerrymandering ................................................27
Responsiveness ...................................................................................................................................27The Mean-Median Test .........................................................................................................................28The T-Test .............................................................................................................................................28Simulated Maps ....................................................................................................................................29
Assessing Gerrymandering in Michigan .......................................................................................................30Efficiency Gap ..........................................................................................................................................31Mean-Median Test ....................................................................................................................................33T-Test ........................................................................................................................................................34Simulated Mapping ...................................................................................................................................35
Conclusion ....................................................................................................................................................35Endnotes ......................................................................................................................................................36

Charts
Chart 1 Districts Divided Uniformly .................................................................................................................4
Chart 2 Packed Districts .................................................................................................................................4
Chart 3 Cracked Districts................................................................................................................................5
Chart 4 Typical S-Curves for Assessing District Proportionality ...................................................................21
Chart 5 Gerrymandered Vote-to-Seat Curve ................................................................................................28
Chart 6 Example Bell Curve .........................................................................................................................28
Figures
Figure 1 The Original “Gerry-mander” ............................................................................................................3
Appendix
Appendix A Uncontested Elections and Calculating Measures ....................................................................38
Boxes
Beyond Packing and Cracking – Other Forms of Gerrymandering ................................................................6
A Note on Population Shifts and State Apportionment .................................................................................10
Mapping Software and Gerrymandering: A Double-Edged Sword ...............................................................14
Michigan’s Unconstitutional Constitutional Provisions .................................................................................16
LULAC and Mid-Decade Redistricting: Concerns for Gerrymandering ........................................................22
The Efficiency Gap: The Trouble with a Single Metric Focuses ...................................................................24

Tables
Table 1 National District Variation ...................................................................................................................8
Table 2 Michigan’s Efficiency Gap for Congressional and Legislative Districts, 1998-2016 ......................... 32
Table 3 Michigan’s Mean-Median Difference for Congressional and Legislative Districts, 1998-2016 ........ 33
Table 4 Michigan’s T-Test Results ................................................................................................................34
Maps
Map 1 New York Assembly District 131, 2001-2010 .......................................................................................6
Map 2 Population Growth from 2010 to 2012 ...............................................................................................10
Map 3 Population Growth from 2010 to 2014 ............................................................................................... 11
Map 4 Population Growth from 2010 to 2016 ............................................................................................... 11
Map 5 Wisconsin’s 61st Assembly District ...................................................................................................13
Map 6 Illinois 4th Congressional District.......................................................................................................17
Map 7 Maryland 6th Congressional District ..................................................................................................26
Map 8 Michigan Congressional Districts 2012-Present ................................................................................30
Map 9 Michigan House District 76 ................................................................................................................30
Map 10 Senate District 8 and Macomb County ............................................................................................30

Court Cases Referenced
Baker v. Carr, 369 U.S. 186 (1962)
Wesberry v. Sanders, 376 U.S. 1 (1964)
Reynolds v. Sims, 377 U.S. 533 (1964)
Kirkpatrick v. Preisler, 394 U.S. 526 (1969)
Mahan v. Howell, 410 U.S. 315 (1973)
413 Mich. 96; 321 NW 2d 565 (1982)
Davis v. Bandemer, 478 U.S. 109 (1986)
LeRoux v. Secretary of State, 640 N.W. 2d 849 (2002)
Vieth v. Jubelirer, 541 U.S. 267 (2004)
League of Latin American Citizens v. Perry (LULAC, 2006)
Shelby County v. Holder, 570 U.S. 2 (2013)
Gill v. Whitford 585 U.S. ____ (2018)
Benisek v. Lamone, 585 U.S. ____ (2018)

Quantifying the Level of Gerrymandering in Michigan
Summary
In a Nutshell• The U.S. Supreme Court has ruled that partisan gerrymandering is subject to judicial review, but has not
accepted a standard that can be used to evaluate whether any state redistricting plan violates the U.S. Constitution.
• While the U.S. Supreme Court sent recent cases back to the District Courts, it is likely new cases will attempt to set a standard for how the courts should evaluate gerrymandering.
• Michigan’s congressional and legislative district maps fail several tests that are currently being discussed to evaluate partisan gerrymandering.
Partisan gerrymandering is not a new phenomenon in the United States. State legislatures have tried to draw district maps to advantage the majority party since at least 1812, when Massachusetts Governor Elbridge Gerry’s maps were lampooned, resulting in the term “Gerry-mander.” But attempts to resolve gerrymander-ing through the courts are much more recent.
In 1986, the United States Supreme Court heard its first partisan gerrymandering case, Davis v. Bandemer. While the Court agreed that the issue of partisan ger-rymandering was something that courts could resolve, they also ruled that the plaintiffs did not present a standard that provided acceptable evidence for the Court to overturn the maps. This charted the course for all partisan gerrymandering cases since; finding a standard that the Court deems acceptable is a neces-sary step to overturn a biased map.
With the U.S. Supreme Court recently sending two par-tisan gerrymandering cases back to the lower courts, political scientists are still looking for the holy grail of a court standard. Michigan is one of several states that has had claims that its maps are gerrymandered. Republicans held unitary control of the state legisla-ture during the 2001 and 2011 redistricting processes, and there have been claims Republicans have had a consistent electoral advantage. Based on available gerrymandering metrics, how do Michigan’s congres-sional and legislative districts grade?
It turns out, not too well. A handful of tests show that Michigan’s maps are beyond the threshold for what is considered gerrymandering, and show other signs that would indicate gerrymandering occurred.
The case regarding Wisconsin’s State Assembly, Gill v. Whitford, hoped to test out one of several new metrics to evaluate gerrymandering, the efficiency gap, which calculates the frequency that a party ‘wastes’ votes. A wasted vote, according to the method, is a vote cast for a party that is not helpful in putting the candidate past 50 percent of the two-party share of votes. Any vote cast for a losing candidate and any vote cast for a candidate after they receive a majority of the two-party vote share is considered wasted by the metric. Each party’s total wasted votes for an office type (congres-sional, state house, or state senate) would then be summed and the difference is taken and divided by the total votes cast to create a metric that can be compared across different states and years.
Wasted votes line up well with the theories of packing and cracking, the two primary methods used to create a partisan gerrymander. When districts are packed, an overwhelming majority of voters from the same party are put into one district. As most of the votes go to one party, the party that wins the district will waste many of their votes in an election that is not close. If a district is cracked, it means that regions are split so that one party wins a large number of districts by a narrow margin. While the voters for the losing party

Lorem ipsum dolor sit amet, consectetur adipiscing elit. Maecenas ultrices mi velit, sit amet malesuada elit venenatis et.
Sed condimentum sodales justo, a molestie tortor mattis ut. Cras ornare rutrum lorem, a auctor sem hendrerit ac.
Quisque auctor eros eu dui pretium condimentum in in leo. Phasellus interdum tellus in elementum maximus. Quisque
ut condimentum nulla. Nunc lorem ligula, vehicula id pretium ut, gravida sit amet nunc.
Nam gravida turpis a nulla vehicula fringilla. Nam a luctus augue, nec ultrices est. Proin a feugiat massa, id vulputate
metus. Mauris id lacinia elit, et lobortis sem. Sed quis diam pulvinar, egestas urna at, mattis odio. Phasellus bibendum
nulla vitae maximus imperdiet. Vestibulum ac quam volutpat, commodo enim id, molestie tortor. Morbi dapibus dapibus
ornare. Pellentesque quis massa tellus. In interdum in lacus nec fermentum. Nullam ullamcorper euismod justo at
dictum. Phasellus aliquet ultrices dolor, vel tempor diam convallis quis. Vestibulum hendrerit dignissim enim nec
dapibus. Integer volutpat congue tincidunt. Vestibulum sed nunc leo.
Morbi sed sapien vitae urna pretium dignissim eu at sapien. Aliquam eu nisl volutpat, commodo mauris sed, pharetra
ante. Nulla lobortis lectus ac sem imperdiet, at fringilla ante commodo. Aliquam sed ullamcorper nisl. Nullam sollicitudin
dolor purus, nec cursus mauris mattis quis. Pellentesque consectetur tellus vel nisi elementum volutpat. Suspendisse
sed dolor sit amet libero tincidunt congue. In egestas libero neque, vel cursus dui blandit vel.
Quisque sit amet venenatis eros. Nulla vulputate pulvinar mauris. Vestibulum pulvinar erat varius sem vestibulum, at
tristique nisl dapibus. Morbi hendrerit nisi malesuada, feugiat justo vitae, sagittis orci. Nam quis laoreet quam, a
faucibus risus. Morbi egestas molestie odio quis elementum. Suspendisse iaculis nisi id risus vehicula convallis. Donec
tincidunt congue fringilla.
Aliquam erat volutpat. Sed imperdiet augue sit amet eros rhoncus egestas. Mauris mauris nunc, scelerisque eu dapibus
nec, hendrerit a dolor. Duis vel nisl porttitor, dictum nulla id, molestie lacus. Nulla vehicula placerat justo, vel semper
metus luctus sed. Cras blandit ultrices ipsum sed facilisis. Maecenas varius eros orci, sed mollis arcu finibus eu. Nullam
ut quam ut lorem rutrum cursus non sed massa. Nunc sed sollicitudin orci. Integer libero tellus, iaculis in orci ut, ornare
vehicula ante.
Quisque sit amet venenatis eros. Nulla vulputate pulvinar mauris. Vestibulum pulvinar erat varius sem vestibulum, at
tristique nisl dapibus. Morbi hendrerit nisi malesuada, feugiat justo vitae, sagittis orci. Nam quis laoreet quam, a
faucibus risus. Morbi egestas molestie odio quis elementum. Suspendisse iaculis nisi id risus vehicula convallis. Donec
tincidunt congue fringilla.
Maecenas varius eros orci, sed mollis arcu finibus eu. Nullam ut quam ut lorem rutrum cursus non sed massa. Nunc sed
sollicitudin orci. Integer libero tellus, iaculis in orci ut, ornare vehicula ante.
Official Research Paper
Lorem Ipsum Research Paper TitleLorem Ipsum Sub-Heading
115 West Allegan Suite 480 | Lansing, MI 48933 | crcmich.org pg. 1
vi
Quantifying the Level of Gerrymandering in Michigan
in those districts could elect several candidates if they were districted fairly, they typically are unable to elect any candidate, and thus waste votes.
The original creators of the efficiency gap recommend-ed any score above an absolute value of eight would signal partisan bias beyond variability for state legisla-tive districts, and any value beyond the equivalent of two seats worth of votes for congressional districts, would signify partisan bias.
Table A shows the efficiency gap scores for Michigan’s congressional, state house, and state senate districts, with a positive value indicating the maps favored Re-publicans and a negative value indicating the maps favored Democrats. For most years after the 2000s redistricting process, Michigan’s maps exhibited an ef-ficiency gap that was beyond the test’s recommended threshold of eight. The results also show areas of inter-est in election trends; in 2006, a year where Democrats saw more success at the ballot box in the state (includ-ing winning 54 percent of the statewide vote), Republi-cans maintained a 22-16 majority in the state senate.
The results also show a large increase in the efficiency gap after the 2010s redistricting process as well, with the efficiency gap more than doubling for congressio-nal and state house districts between the last election under the 2000s map and the first election in the 2010s map, and the state senate efficiency gap increased to
its highest point the first year the 2010s map was used. While year to year variation can exist in the efficiency gap due to population shifts, changes in voter turnout, and the popularity of candidates, the magnitude of these increases the first year the 2010s map was used is a strong indication that gerrymandering may have occurred. This is an especially important consideration, as the increase from map cycle to map cycle provides evidence that the levels are not entirely caused by the self-sorting of the state’s population (e.g., the idea that Democrats tend to live in cities and Republicans in rural areas).
While the efficiency gap is at the center of Gill, many are not enamored with the test, and several other al-ternatives have been offered. The mean-median test compares the average (mean) and median vote share of all districts for each party. If the median is higher than the mean, it indicates that the party has more dis-tricts above the party’s average vote share than below, which would make it easier for the party to win seats. Unlike the efficiency gap, this test does not take into account seats actually won, eliminating large swings in the metric that occur when a close district flips.
A positive mean-median score (indicating a higher median) is evidence that the party had an electoral advantage from the redistricting scheme, while a nega-tive result would indicate a party was hindered by the scheme. If a party has more than half of its districts
Table A Michigan’s Efficiency Gap for Congressional and Legislative Districts, 1998-2016
1998 2000 2002 2004 2006 2008 2010 2012 2014 2016Congress -9.7 6.6 15.2 11.5 23.5 8.0 5.6 19.7 17.6 14.6MI House 8.1 11.9 11.0 9.7 11.6 8.2 5.8 13.6 13.3 10.1MI Senate 9.6 10.2 18.5 14.7 22.6
*See Appendix A for a discussion of the effects on the efficiency gap values of uncontested elections.
Note: The efficiency gap calculates the frequency that a party ‘wastes’ votes. A wasted vote, according to the method, is a vote cast for a party that is not helpful in putting the candidate past 50 percent of the two-party share of votes. Any vote cast for a losing candidate, and any vote cast for a candidate after they receive a majority of the two-party vote share, is considered wasted by the metric. Each party’s total wasted votes for an office type (congressional, state house, or state senate) would then be summed and the difference is taken and divided by the total votes cast to create a metric that can be compared across different states and years. The original creators of the efficiency gap recommended any score above an absolute value of eight would signal partisan bias beyond variability for state legislative districts, and any value beyond two seats for congressional districts, would signify partisan bias.
Source: Michigan Secretary of State voting data, Citizens Research Council calculations.

Lorem ipsum dolor sit amet, consectetur adipiscing elit. Maecenas ultrices mi velit, sit amet malesuada elit venenatis et.
Sed condimentum sodales justo, a molestie tortor mattis ut. Cras ornare rutrum lorem, a auctor sem hendrerit ac.
Quisque auctor eros eu dui pretium condimentum in in leo. Phasellus interdum tellus in elementum maximus. Quisque
ut condimentum nulla. Nunc lorem ligula, vehicula id pretium ut, gravida sit amet nunc.
Nam gravida turpis a nulla vehicula fringilla. Nam a luctus augue, nec ultrices est. Proin a feugiat massa, id vulputate
metus. Mauris id lacinia elit, et lobortis sem. Sed quis diam pulvinar, egestas urna at, mattis odio. Phasellus bibendum
nulla vitae maximus imperdiet. Vestibulum ac quam volutpat, commodo enim id, molestie tortor. Morbi dapibus dapibus
ornare. Pellentesque quis massa tellus. In interdum in lacus nec fermentum. Nullam ullamcorper euismod justo at
dictum. Phasellus aliquet ultrices dolor, vel tempor diam convallis quis. Vestibulum hendrerit dignissim enim nec
dapibus. Integer volutpat congue tincidunt. Vestibulum sed nunc leo.
Morbi sed sapien vitae urna pretium dignissim eu at sapien. Aliquam eu nisl volutpat, commodo mauris sed, pharetra
ante. Nulla lobortis lectus ac sem imperdiet, at fringilla ante commodo. Aliquam sed ullamcorper nisl. Nullam sollicitudin
dolor purus, nec cursus mauris mattis quis. Pellentesque consectetur tellus vel nisi elementum volutpat. Suspendisse
sed dolor sit amet libero tincidunt congue. In egestas libero neque, vel cursus dui blandit vel.
Quisque sit amet venenatis eros. Nulla vulputate pulvinar mauris. Vestibulum pulvinar erat varius sem vestibulum, at
tristique nisl dapibus. Morbi hendrerit nisi malesuada, feugiat justo vitae, sagittis orci. Nam quis laoreet quam, a
faucibus risus. Morbi egestas molestie odio quis elementum. Suspendisse iaculis nisi id risus vehicula convallis. Donec
tincidunt congue fringilla.
Aliquam erat volutpat. Sed imperdiet augue sit amet eros rhoncus egestas. Mauris mauris nunc, scelerisque eu dapibus
nec, hendrerit a dolor. Duis vel nisl porttitor, dictum nulla id, molestie lacus. Nulla vehicula placerat justo, vel semper
metus luctus sed. Cras blandit ultrices ipsum sed facilisis. Maecenas varius eros orci, sed mollis arcu finibus eu. Nullam
ut quam ut lorem rutrum cursus non sed massa. Nunc sed sollicitudin orci. Integer libero tellus, iaculis in orci ut, ornare
vehicula ante.
Quisque sit amet venenatis eros. Nulla vulputate pulvinar mauris. Vestibulum pulvinar erat varius sem vestibulum, at
tristique nisl dapibus. Morbi hendrerit nisi malesuada, feugiat justo vitae, sagittis orci. Nam quis laoreet quam, a
faucibus risus. Morbi egestas molestie odio quis elementum. Suspendisse iaculis nisi id risus vehicula convallis. Donec
tincidunt congue fringilla.
Maecenas varius eros orci, sed mollis arcu finibus eu. Nullam ut quam ut lorem rutrum cursus non sed massa. Nunc sed
sollicitudin orci. Integer libero tellus, iaculis in orci ut, ornare vehicula ante.
Official Research Paper
Lorem Ipsum Research Paper TitleLorem Ipsum Sub-Heading
115 West Allegan Suite 480 | Lansing, MI 48933 | crcmich.org pg. 1
vii
Quantifying the Level of Gerrymandering in Michigan
above the party’s average vote share, it means that their populations are distributed so that they outper-form their statewide average in more districts than they underperform. If the populations were distributed fairly, it is likely that the mean-median score would be close to zero. The national average mean-median score for states that showed no partisan advantage was 1.9 in 2012.
Michigan’s mean-median test results (see Table B) paint a similar picture as the state’s efficiency gap results. The scores reflected an extreme advantage for Republicans the first three elections after the 2001 redistricting process, and a large increase in advantage for Republicans after the 2011 re-drawing of districts. Since 2001, only one year for one election type had a difference below five points, which indicates there has been a consistent partisan advantage due to the maps. The state’s congressional districts after the 2000s redistricting process show an extreme increase in the measure; switching from a slight bias for Democrats to an extreme advantage for Republicans.
These scores show that Republicans are consistently advantaged by the maps, while Democrats have been consistently disadvantaged. Because the mean-medi-an test does not account for the number of seats won in any given year, the metric does not see as large of
swings in the Democratic wave election in 2006 or the Republican wave election in 2010. Similar to the ef-ficiency gap, the mean-median test shows a trend of an increase in partisan advantage under the 2010s maps.
The t-test is a statistical method to determine if two groups are likely to be assigned randomly from the same population. For evaluating gerrymandering, the test is used to compare the vote-share for each party. Districts are split based on the winning party, and given a value equal to the winner’s vote share. The test then determines the probability that the two groups of districts are statistically similar, or if they are distinct groups. Any results below .05, or 5 percent chance of the difference occurring randomly from the same group, is considered to be statistically significant evidence that the two populations are distinct.
If one party is winning districts by large margins, and the other wins several closer races, it can be an indi-cation that some districts were intentionally designed to have an over-abundance of voters from one party, while others were drawn to give a narrow advantage to the opposite party. This test does not address the magnitude of gerrymandering, or which party benefited from gerrymandering, but is a good indicator of if the difference in district results is likely to have occurred by chance, or was intentional.
Table B Michigan’s Mean-Median Difference for Congressional and Legislative Districts, 1998-2016
1998 2000 2002 2004 2006 2008 2010 2012 2014 2016
CongressRepublicans -5.0 -4.0 12.4 10.3 10.1 3.9 1.6 6.3 7.4 7.8Democrats 5.1 4.4 -12.0 -10.2 -9.8 -5.0 -5.4 -6.9 -8.4 -7.8
MI HouseRepublicans 4.1 7.4 5.9 6.0 5.3 0.4 4.0 6.9 5.4 5.9Democrats -5.0 -7.3 -6.4 -5.2 -4.6 0.4 -3.5 -6.5 -6.1 -5.6
MI SenateRepublicans 7.7 5.6 7.0 3.3 7.5Democrats -6.7 -5.3 -7.5 -8.6 -6.8
Note: The mean-median test is a simple way to determine if a dataset is skewed, or not distributed normally across the average. To apply this test, the average vote share for a party across the state is subtracted from its vote share in the median district. A positive number (indicating a higher median) is evidence that the party had an electoral advantage from the redistricting scheme, while a nega-tive result would indicate a party was hindered by the scheme.
Source: Michigan Secretary of State voting data, Citizens Research Council calculations.

Lorem ipsum dolor sit amet, consectetur adipiscing elit. Maecenas ultrices mi velit, sit amet malesuada elit venenatis et.
Sed condimentum sodales justo, a molestie tortor mattis ut. Cras ornare rutrum lorem, a auctor sem hendrerit ac.
Quisque auctor eros eu dui pretium condimentum in in leo. Phasellus interdum tellus in elementum maximus. Quisque
ut condimentum nulla. Nunc lorem ligula, vehicula id pretium ut, gravida sit amet nunc.
Nam gravida turpis a nulla vehicula fringilla. Nam a luctus augue, nec ultrices est. Proin a feugiat massa, id vulputate
metus. Mauris id lacinia elit, et lobortis sem. Sed quis diam pulvinar, egestas urna at, mattis odio. Phasellus bibendum
nulla vitae maximus imperdiet. Vestibulum ac quam volutpat, commodo enim id, molestie tortor. Morbi dapibus dapibus
ornare. Pellentesque quis massa tellus. In interdum in lacus nec fermentum. Nullam ullamcorper euismod justo at
dictum. Phasellus aliquet ultrices dolor, vel tempor diam convallis quis. Vestibulum hendrerit dignissim enim nec
dapibus. Integer volutpat congue tincidunt. Vestibulum sed nunc leo.
Morbi sed sapien vitae urna pretium dignissim eu at sapien. Aliquam eu nisl volutpat, commodo mauris sed, pharetra
ante. Nulla lobortis lectus ac sem imperdiet, at fringilla ante commodo. Aliquam sed ullamcorper nisl. Nullam sollicitudin
dolor purus, nec cursus mauris mattis quis. Pellentesque consectetur tellus vel nisi elementum volutpat. Suspendisse
sed dolor sit amet libero tincidunt congue. In egestas libero neque, vel cursus dui blandit vel.
Quisque sit amet venenatis eros. Nulla vulputate pulvinar mauris. Vestibulum pulvinar erat varius sem vestibulum, at
tristique nisl dapibus. Morbi hendrerit nisi malesuada, feugiat justo vitae, sagittis orci. Nam quis laoreet quam, a
faucibus risus. Morbi egestas molestie odio quis elementum. Suspendisse iaculis nisi id risus vehicula convallis. Donec
tincidunt congue fringilla.
Aliquam erat volutpat. Sed imperdiet augue sit amet eros rhoncus egestas. Mauris mauris nunc, scelerisque eu dapibus
nec, hendrerit a dolor. Duis vel nisl porttitor, dictum nulla id, molestie lacus. Nulla vehicula placerat justo, vel semper
metus luctus sed. Cras blandit ultrices ipsum sed facilisis. Maecenas varius eros orci, sed mollis arcu finibus eu. Nullam
ut quam ut lorem rutrum cursus non sed massa. Nunc sed sollicitudin orci. Integer libero tellus, iaculis in orci ut, ornare
vehicula ante.
Quisque sit amet venenatis eros. Nulla vulputate pulvinar mauris. Vestibulum pulvinar erat varius sem vestibulum, at
tristique nisl dapibus. Morbi hendrerit nisi malesuada, feugiat justo vitae, sagittis orci. Nam quis laoreet quam, a
faucibus risus. Morbi egestas molestie odio quis elementum. Suspendisse iaculis nisi id risus vehicula convallis. Donec
tincidunt congue fringilla.
Maecenas varius eros orci, sed mollis arcu finibus eu. Nullam ut quam ut lorem rutrum cursus non sed massa. Nunc sed
sollicitudin orci. Integer libero tellus, iaculis in orci ut, ornare vehicula ante.
Official Research Paper
Lorem Ipsum Research Paper TitleLorem Ipsum Sub-Heading
115 West Allegan Suite 480 | Lansing, MI 48933 | crcmich.org pg. 1
viii
Quantifying the Level of Gerrymandering in Michigan
Results from the t-test (see Table C) show that there are significant differences between the districts Repub-licans win and the districts Democrats win. Since the redistricting process in 2001, only two elections have had a t-test score above .05, which is the threshold for the test. This would indicate that the margin of victory for the districts Republicans win, and the margin of victory for districts Democrats win, is different across congressional, state house, and state senate districts. When combined with the previous two tests, it would suggest that Republicans have had a consistent ad-vantage in all election types.
These tests share one flaw; they do not account for how voters from each party are distributed through-out the state. As a result, these tests do not have a mechanism to distinguish abnormal scores due to highly concentrated Democratic populations, and intentional gerrymandering. An analysis by Jowei Chen and David Cottrell, professors at the University
of Michigan and Dartmouth respectively, found that some of the bias in Michigan is due to the distribu-tion of the state’s population, but the maps drawn in 2011 still produced an advantage for Republi-cans compared to the several congressional district schemes drawn by their algorithm. This would imply that, while the extent of gerrymandering implied by some of the tests may be exaggerated slightly, that political geography does not completely account for the bias in Michigan’s current congressional map. The recent U.S. Supreme Court decisions leave open the question to how the courts will handle par-tisan gerrymandering cases in the future. While the Court avoided creating a new standard or ending the possibility of one being created, it seems likely that another case will eventually force the Court to decide on the issue of partisan gerrymandering. Until then, Michiganders will have to evaluate what to do about gerrymandering without the federal court system.
Table C Michigan’s T-Test Results
1998 2000 2002 2004 2006 2008 2010 2012 2014 2016Congress 0.195 0.060 0.004 0.005 0.000 0.055 0.394 0.002 0.005 0.009MI House 0.000 0.000 0.000 0.000 0.000 0.000 0.037 0.000 0.000 0.000MI Senate 0.069 0.019 0.000 0.006 0.000
Note: The T-Test is a statistical method to determine if two groups are likely to be assigned randomly from the same population. Districts are split based on the winning party, and given a value equal to the winner’s vote share. The test then determines the probability that the two groups of districts are statistically similar, or if they are distinct groups. Any results below .05, or 5 percent chance of the difference occurring randomly from the same group, is considered to be statistically significant evidence that the two populations are distinct.
Source: Michigan Secretary of State voting data, Citizens Research Council calculations.

Quantifying the Level of Gerrymandering in Michigan
Lorem ipsum dolor sit amet, consectetur adipiscing elit. Maecenas ultrices mi velit, sit amet malesuada elit venenatis et.
Sed condimentum sodales justo, a molestie tortor mattis ut. Cras ornare rutrum lorem, a auctor sem hendrerit ac.
Quisque auctor eros eu dui pretium condimentum in in leo. Phasellus interdum tellus in elementum maximus. Quisque
ut condimentum nulla. Nunc lorem ligula, vehicula id pretium ut, gravida sit amet nunc.
Nam gravida turpis a nulla vehicula fringilla. Nam a luctus augue, nec ultrices est. Proin a feugiat massa, id vulputate
metus. Mauris id lacinia elit, et lobortis sem. Sed quis diam pulvinar, egestas urna at, mattis odio. Phasellus bibendum
nulla vitae maximus imperdiet. Vestibulum ac quam volutpat, commodo enim id, molestie tortor. Morbi dapibus dapibus
ornare. Pellentesque quis massa tellus. In interdum in lacus nec fermentum. Nullam ullamcorper euismod justo at
dictum. Phasellus aliquet ultrices dolor, vel tempor diam convallis quis. Vestibulum hendrerit dignissim enim nec
dapibus. Integer volutpat congue tincidunt. Vestibulum sed nunc leo.
Morbi sed sapien vitae urna pretium dignissim eu at sapien. Aliquam eu nisl volutpat, commodo mauris sed, pharetra
ante. Nulla lobortis lectus ac sem imperdiet, at fringilla ante commodo. Aliquam sed ullamcorper nisl. Nullam sollicitudin
dolor purus, nec cursus mauris mattis quis. Pellentesque consectetur tellus vel nisi elementum volutpat. Suspendisse
sed dolor sit amet libero tincidunt congue. In egestas libero neque, vel cursus dui blandit vel.
Quisque sit amet venenatis eros. Nulla vulputate pulvinar mauris. Vestibulum pulvinar erat varius sem vestibulum, at
tristique nisl dapibus. Morbi hendrerit nisi malesuada, feugiat justo vitae, sagittis orci. Nam quis laoreet quam, a
faucibus risus. Morbi egestas molestie odio quis elementum. Suspendisse iaculis nisi id risus vehicula convallis. Donec
tincidunt congue fringilla.
Aliquam erat volutpat. Sed imperdiet augue sit amet eros rhoncus egestas. Mauris mauris nunc, scelerisque eu dapibus
nec, hendrerit a dolor. Duis vel nisl porttitor, dictum nulla id, molestie lacus. Nulla vehicula placerat justo, vel semper
metus luctus sed. Cras blandit ultrices ipsum sed facilisis. Maecenas varius eros orci, sed mollis arcu finibus eu. Nullam
ut quam ut lorem rutrum cursus non sed massa. Nunc sed sollicitudin orci. Integer libero tellus, iaculis in orci ut, ornare
vehicula ante.
Quisque sit amet venenatis eros. Nulla vulputate pulvinar mauris. Vestibulum pulvinar erat varius sem vestibulum, at
tristique nisl dapibus. Morbi hendrerit nisi malesuada, feugiat justo vitae, sagittis orci. Nam quis laoreet quam, a
faucibus risus. Morbi egestas molestie odio quis elementum. Suspendisse iaculis nisi id risus vehicula convallis. Donec
tincidunt congue fringilla.
Maecenas varius eros orci, sed mollis arcu finibus eu. Nullam ut quam ut lorem rutrum cursus non sed massa. Nunc sed
sollicitudin orci. Integer libero tellus, iaculis in orci ut, ornare vehicula ante.
Official Research Paper
Lorem Ipsum Research Paper TitleLorem Ipsum Sub-Heading
115 West Allegan Suite 480 | Lansing, MI 48933 | crcmich.org pg. 1
1
Introduction
mandering cases, were both thrown out on procedural questions, so the Court sidestepped the core question of partisan gerrymandering. The Court, nonetheless, will likely face more partisan gerrymandering claims in the coming years. If the Court decides to intervene, it will have to decide upon an acceptable standard to evaluate the harms of partisan gerrymandering.
The question is not whether gerrymandering is danger-ous; gerrymandering of any kind poses a significant risk to the health of our government by undermining the power of targeted voting groups. Instead, the ques-tions should be focused along the lines of those Justice Kennedy asked in Vieth v. Jubelirer (2004); is there is a justiciable standard to determine if gerrymandering has occurred? And where should the power to both create maps and prevent self-interested parties from influencing the electoral process be vested?
As one of several states that allows the legislature to draw both congressional and state legislative districts, the maps drawn in 2011 by the Michigan Legislature have generated extensive criticism for creating a parti-san bias. Many metrics have been created in attempt to set a potential judicial standard to evaluate the presence of gerrymandering. Based on an evaluation of several metrics, there is reasonable evidence that Michigan’s maps exhibit a gerrymandering problem.
Questions of partisan gerrymandering are experienc-ing a moment of national attention. Two partisan ger-rymandering cases were recently argued at the U.S. Supreme Court; a third has been appealed to the Court. Several others--including one in Michigan --are either on trial at the lower federal court level or at various stages in state court systems.
While redistricting questions are in the spotlight, the problems being discussed are not new. Despite an initial hesitance to rule on questions of redistricting and gerrymandering to avoid getting too deep into the political rather than legal realm, the U.S. Supreme Court has ruled several times on a variety of claims related to the redistricting process.
Many of the Supreme Court’s rulings overturning states’ district maps have focused on the “one person, one vote” doctrine and racial gerrymandering; how-ever, the Court has yet to overturn a district map on partisan gerrymandering grounds. In 2004, the U.S. Supreme Court weighed in on the issue of partisan ger-rymandering in Vieth v. Jubelirer (2004), but reached a stalemate. While the Court upheld Pennsylvania’s district lines in the case, and five judges deemed that the partisan gerrymandering claims were justiciable, the Court concluded that there was no acceptable standard for the Court to intervene. Gill v. Whitford and Benisek v. Lamone, the two most recent partisan gerry-
Where should the power to both create maps and prevent self-interested parties from influencing the electoral process be vested?

Lorem ipsum dolor sit amet, consectetur adipiscing elit. Maecenas ultrices mi velit, sit amet malesuada elit venenatis et.
Sed condimentum sodales justo, a molestie tortor mattis ut. Cras ornare rutrum lorem, a auctor sem hendrerit ac.
Quisque auctor eros eu dui pretium condimentum in in leo. Phasellus interdum tellus in elementum maximus. Quisque
ut condimentum nulla. Nunc lorem ligula, vehicula id pretium ut, gravida sit amet nunc.
Nam gravida turpis a nulla vehicula fringilla. Nam a luctus augue, nec ultrices est. Proin a feugiat massa, id vulputate
metus. Mauris id lacinia elit, et lobortis sem. Sed quis diam pulvinar, egestas urna at, mattis odio. Phasellus bibendum
nulla vitae maximus imperdiet. Vestibulum ac quam volutpat, commodo enim id, molestie tortor. Morbi dapibus dapibus
ornare. Pellentesque quis massa tellus. In interdum in lacus nec fermentum. Nullam ullamcorper euismod justo at
dictum. Phasellus aliquet ultrices dolor, vel tempor diam convallis quis. Vestibulum hendrerit dignissim enim nec
dapibus. Integer volutpat congue tincidunt. Vestibulum sed nunc leo.
Morbi sed sapien vitae urna pretium dignissim eu at sapien. Aliquam eu nisl volutpat, commodo mauris sed, pharetra
ante. Nulla lobortis lectus ac sem imperdiet, at fringilla ante commodo. Aliquam sed ullamcorper nisl. Nullam sollicitudin
dolor purus, nec cursus mauris mattis quis. Pellentesque consectetur tellus vel nisi elementum volutpat. Suspendisse
sed dolor sit amet libero tincidunt congue. In egestas libero neque, vel cursus dui blandit vel.
Quisque sit amet venenatis eros. Nulla vulputate pulvinar mauris. Vestibulum pulvinar erat varius sem vestibulum, at
tristique nisl dapibus. Morbi hendrerit nisi malesuada, feugiat justo vitae, sagittis orci. Nam quis laoreet quam, a
faucibus risus. Morbi egestas molestie odio quis elementum. Suspendisse iaculis nisi id risus vehicula convallis. Donec
tincidunt congue fringilla.
Aliquam erat volutpat. Sed imperdiet augue sit amet eros rhoncus egestas. Mauris mauris nunc, scelerisque eu dapibus
nec, hendrerit a dolor. Duis vel nisl porttitor, dictum nulla id, molestie lacus. Nulla vehicula placerat justo, vel semper
metus luctus sed. Cras blandit ultrices ipsum sed facilisis. Maecenas varius eros orci, sed mollis arcu finibus eu. Nullam
ut quam ut lorem rutrum cursus non sed massa. Nunc sed sollicitudin orci. Integer libero tellus, iaculis in orci ut, ornare
vehicula ante.
Quisque sit amet venenatis eros. Nulla vulputate pulvinar mauris. Vestibulum pulvinar erat varius sem vestibulum, at
tristique nisl dapibus. Morbi hendrerit nisi malesuada, feugiat justo vitae, sagittis orci. Nam quis laoreet quam, a
faucibus risus. Morbi egestas molestie odio quis elementum. Suspendisse iaculis nisi id risus vehicula convallis. Donec
tincidunt congue fringilla.
Maecenas varius eros orci, sed mollis arcu finibus eu. Nullam ut quam ut lorem rutrum cursus non sed massa. Nunc sed
sollicitudin orci. Integer libero tellus, iaculis in orci ut, ornare vehicula ante.
Official Research Paper
Lorem Ipsum Research Paper TitleLorem Ipsum Sub-Heading
115 West Allegan Suite 480 | Lansing, MI 48933 | crcmich.org pg. 1
2
Quantifying the Level of Gerrymandering in Michigan
partisans are making the decisions.3
Gerrymandering also can erode public trust in the political process. When groups feel the system is designed to limit their voice, or prevent them from electing candidates, it can lead to citizen disengage-ment and weaken the representational aspect of our governmental system.
By no means is gerrymandering the sole cause of these problems. Studies have shown that polarization is only weakly correlated with partisan gerrymandering,4 as America has been diverging for years. Gerrymander-ing is not fully responsible for uncompetitive districts, as natural population sorting makes it difficult to find a middle ground and guarantees there will be winners
and losers in the redistricting process. Trust in our govern-ment is at one of the lowest points in history.5
Ultimately, gerrymandering is only one of several causes of these issues, and has a somewhat minor effect on problems like polarization. Removing political interests from the districting process may prove to be impossible, as even states that have
removed the legislature from the process have had problems with political interests involving themselves in the process.
This does not mean gerrymandering should be left unchecked.
Redistricting has significant policy and representational consequences, and no compelling public interest justi-fies partisan gerrymandering. Yet gerrymandering has been a prevalent part of American politics since the country was founded. The influence redistricting gives over the political process means the process should be monitored to ensure special interests are unable to abuse the process to the detriment of citizens.
While it is fairly easy to recognize the potential perils of gerrymandering, there have been problems identifying
Why Gerrymandering MattersThe redistricting process affects the core components of how our representative democracy functions. It determines which candidates appear on the ballot and, also, whom an elected representative represents. But in many states, including Michigan, redistricting can also determine who is in charge of deciding how districts are drawn in a state.
When elected officials control the process that deter-mines their own electoral fate, few checks can prevent abuse. Elected officials can draw maps in ways that make them more likely to stay in office, that ensure their political party is more likely to stay in power, or that make their political opponents more likely to lose an election. This practice, commonly known as ger-rymandering, allows political parties that gain unitary control over the redistricting process in a redistricting year to entrench control, sometimes in ways that can allow a minority of voters to elect a majority of represen-tatives.
While the discussion of parti-san gerrymandering primar-ily focuses on direct electoral consequences, the implica-tions of gerrymandering can go beyond who is elected into office. Gerrymandering can make representatives less responsive to large portions of the population by removing the electoral incentive to be accountable to segments that are not part of the electoral coalition. It also can lead to communities being split into several districts, creating a situation where no single district feels compelled to advocate for the needs of those communities, thus creating a lack of accountability.
It can lead to less competitive districts, exacerbat-ing polarization1 and reducing the population that is responsible for electing candidates. Safer districts become more about appealing to a party’s base than competitive elections where candidates have to ap-peal to all electors. It takes elections out of the hands of most, as representatives are effectively selected in primary elections, where fewer people vote2 and mostly
Gerrymandering allows political parties that gain unitary control over the redistricting process in a redistricting year to entrench control, sometimes in ways that can allow a minority of voters to elect a majority of representatives

Lorem ipsum dolor sit amet, consectetur adipiscing elit. Maecenas ultrices mi velit, sit amet malesuada elit venenatis et.
Sed condimentum sodales justo, a molestie tortor mattis ut. Cras ornare rutrum lorem, a auctor sem hendrerit ac.
Quisque auctor eros eu dui pretium condimentum in in leo. Phasellus interdum tellus in elementum maximus. Quisque
ut condimentum nulla. Nunc lorem ligula, vehicula id pretium ut, gravida sit amet nunc.
Nam gravida turpis a nulla vehicula fringilla. Nam a luctus augue, nec ultrices est. Proin a feugiat massa, id vulputate
metus. Mauris id lacinia elit, et lobortis sem. Sed quis diam pulvinar, egestas urna at, mattis odio. Phasellus bibendum
nulla vitae maximus imperdiet. Vestibulum ac quam volutpat, commodo enim id, molestie tortor. Morbi dapibus dapibus
ornare. Pellentesque quis massa tellus. In interdum in lacus nec fermentum. Nullam ullamcorper euismod justo at
dictum. Phasellus aliquet ultrices dolor, vel tempor diam convallis quis. Vestibulum hendrerit dignissim enim nec
dapibus. Integer volutpat congue tincidunt. Vestibulum sed nunc leo.
Morbi sed sapien vitae urna pretium dignissim eu at sapien. Aliquam eu nisl volutpat, commodo mauris sed, pharetra
ante. Nulla lobortis lectus ac sem imperdiet, at fringilla ante commodo. Aliquam sed ullamcorper nisl. Nullam sollicitudin
dolor purus, nec cursus mauris mattis quis. Pellentesque consectetur tellus vel nisi elementum volutpat. Suspendisse
sed dolor sit amet libero tincidunt congue. In egestas libero neque, vel cursus dui blandit vel.
Quisque sit amet venenatis eros. Nulla vulputate pulvinar mauris. Vestibulum pulvinar erat varius sem vestibulum, at
tristique nisl dapibus. Morbi hendrerit nisi malesuada, feugiat justo vitae, sagittis orci. Nam quis laoreet quam, a
faucibus risus. Morbi egestas molestie odio quis elementum. Suspendisse iaculis nisi id risus vehicula convallis. Donec
tincidunt congue fringilla.
Aliquam erat volutpat. Sed imperdiet augue sit amet eros rhoncus egestas. Mauris mauris nunc, scelerisque eu dapibus
nec, hendrerit a dolor. Duis vel nisl porttitor, dictum nulla id, molestie lacus. Nulla vehicula placerat justo, vel semper
metus luctus sed. Cras blandit ultrices ipsum sed facilisis. Maecenas varius eros orci, sed mollis arcu finibus eu. Nullam
ut quam ut lorem rutrum cursus non sed massa. Nunc sed sollicitudin orci. Integer libero tellus, iaculis in orci ut, ornare
vehicula ante.
Quisque sit amet venenatis eros. Nulla vulputate pulvinar mauris. Vestibulum pulvinar erat varius sem vestibulum, at
tristique nisl dapibus. Morbi hendrerit nisi malesuada, feugiat justo vitae, sagittis orci. Nam quis laoreet quam, a
faucibus risus. Morbi egestas molestie odio quis elementum. Suspendisse iaculis nisi id risus vehicula convallis. Donec
tincidunt congue fringilla.
Maecenas varius eros orci, sed mollis arcu finibus eu. Nullam ut quam ut lorem rutrum cursus non sed massa. Nunc sed
sollicitudin orci. Integer libero tellus, iaculis in orci ut, ornare vehicula ante.
Official Research Paper
Lorem Ipsum Research Paper TitleLorem Ipsum Sub-Heading
115 West Allegan Suite 480 | Lansing, MI 48933 | crcmich.org pg. 1
3
Quantifying the Level of Gerrymandering in Michigan
what a gerrymander looks like. A number of partisan gerrymandering court cases have gone to the U.S. Supreme Court over the last several decades, yet no map has been overturned. To this point, the Supreme Court has failed to accept a standard for evaluating whether a district map was gerrymandered.
Even though the Court has not set a standard, gerry-mandering related issues are in the spotlight nationally. Eight states have federal or state court challenges to
When single-member districts were used by states, they would draw district lines to intentionally favor the party in control of the legislature. While this occurred for decades prior, a term to describe these partisan redistricting was not coined until 1812, when Massa-chusetts Governor Elbridge Gerry redistricted his state in a manner that is still infamous today. The primary offender was a district said to look like a salamander, as it was long, thin, and curved around another district, as shown by a cartoon featured in the Boston Gazette on March 26, 1812. This district became known as the ‘Gerry-mander’ (Figure 1).
Figure 1 The Original “Gerry-mander”
partisan gerrymandering, including two that the U.S. Supreme Court recently heard, while seven states had petitions circulated to put redistricting reform on the ballot at some point within the last year. Michigan is the only state where both a federal court case has been filed and a citizen-led initiative to amend the state constitution to address gerrymandering are in the works. No matter what happens with the court case or the ballot initiative, the outcome will have a significant effect on Michigan elections going forward.
Defining Gerrymandering
Redistricting to a Party’s AdvantageBecause the stakes in the redistricting process are so high, questions often arise about the intent behind the drawing of districts. In most states, the legislature is in control of the entirety of the process. In these cases, the primary concern centers around whether districts are drawn to benefit those in control of the process. When one party controls the legislature and governor’s office in a redistricting year, there are few to no checks on how maps are drawn outside of federal law and state constitutional provisions. These conditions create an environment ripe for gerrymandering.
Some level of political gamesmanship has existed in the United States since the country was founded. Be-cause the United States Constitution left it up to states to decide how their representatives were elected, states, during the early years, had the ability to choose how elections were run. States could hold elections with single-member districts, where district lines were drawn and an elected official represented that district, and state-wide elections, where all voters voted for all representatives.
Historically, state legislatures chose the system (single-member or statewide) that benefited the political party in power. If the state elections were competitive, the legislature was unlikely to select the winner-take-all ap-proach of state-wide elections. Instead, the state would set up districts to ensure at least some representation in case the political calculus changed. Conversely, if one party earned a larger majority of votes, a winner-take-all system was chosen so that party was able to gain complete control in the state.6

Lorem ipsum dolor sit amet, consectetur adipiscing elit. Maecenas ultrices mi velit, sit amet malesuada elit venenatis et.
Sed condimentum sodales justo, a molestie tortor mattis ut. Cras ornare rutrum lorem, a auctor sem hendrerit ac.
Quisque auctor eros eu dui pretium condimentum in in leo. Phasellus interdum tellus in elementum maximus. Quisque
ut condimentum nulla. Nunc lorem ligula, vehicula id pretium ut, gravida sit amet nunc.
Nam gravida turpis a nulla vehicula fringilla. Nam a luctus augue, nec ultrices est. Proin a feugiat massa, id vulputate
metus. Mauris id lacinia elit, et lobortis sem. Sed quis diam pulvinar, egestas urna at, mattis odio. Phasellus bibendum
nulla vitae maximus imperdiet. Vestibulum ac quam volutpat, commodo enim id, molestie tortor. Morbi dapibus dapibus
ornare. Pellentesque quis massa tellus. In interdum in lacus nec fermentum. Nullam ullamcorper euismod justo at
dictum. Phasellus aliquet ultrices dolor, vel tempor diam convallis quis. Vestibulum hendrerit dignissim enim nec
dapibus. Integer volutpat congue tincidunt. Vestibulum sed nunc leo.
Morbi sed sapien vitae urna pretium dignissim eu at sapien. Aliquam eu nisl volutpat, commodo mauris sed, pharetra
ante. Nulla lobortis lectus ac sem imperdiet, at fringilla ante commodo. Aliquam sed ullamcorper nisl. Nullam sollicitudin
dolor purus, nec cursus mauris mattis quis. Pellentesque consectetur tellus vel nisi elementum volutpat. Suspendisse
sed dolor sit amet libero tincidunt congue. In egestas libero neque, vel cursus dui blandit vel.
Quisque sit amet venenatis eros. Nulla vulputate pulvinar mauris. Vestibulum pulvinar erat varius sem vestibulum, at
tristique nisl dapibus. Morbi hendrerit nisi malesuada, feugiat justo vitae, sagittis orci. Nam quis laoreet quam, a
faucibus risus. Morbi egestas molestie odio quis elementum. Suspendisse iaculis nisi id risus vehicula convallis. Donec
tincidunt congue fringilla.
Aliquam erat volutpat. Sed imperdiet augue sit amet eros rhoncus egestas. Mauris mauris nunc, scelerisque eu dapibus
nec, hendrerit a dolor. Duis vel nisl porttitor, dictum nulla id, molestie lacus. Nulla vehicula placerat justo, vel semper
metus luctus sed. Cras blandit ultrices ipsum sed facilisis. Maecenas varius eros orci, sed mollis arcu finibus eu. Nullam
ut quam ut lorem rutrum cursus non sed massa. Nunc sed sollicitudin orci. Integer libero tellus, iaculis in orci ut, ornare
vehicula ante.
Quisque sit amet venenatis eros. Nulla vulputate pulvinar mauris. Vestibulum pulvinar erat varius sem vestibulum, at
tristique nisl dapibus. Morbi hendrerit nisi malesuada, feugiat justo vitae, sagittis orci. Nam quis laoreet quam, a
faucibus risus. Morbi egestas molestie odio quis elementum. Suspendisse iaculis nisi id risus vehicula convallis. Donec
tincidunt congue fringilla.
Maecenas varius eros orci, sed mollis arcu finibus eu. Nullam ut quam ut lorem rutrum cursus non sed massa. Nunc sed
sollicitudin orci. Integer libero tellus, iaculis in orci ut, ornare vehicula ante.
Official Research Paper
Lorem Ipsum Research Paper TitleLorem Ipsum Sub-Heading
115 West Allegan Suite 480 | Lansing, MI 48933 | crcmich.org pg. 1
4
Quantifying the Level of Gerrymandering in Michigan
The term gerrymandering has evolved to encompass the practice of adjusting political boundaries in a way that provides an intentional political advantage to a specific group or individual. A redistricting scheme can be altered in several ways to disadvantage specific people or voting groups, but the two at the forefront are racial and partisan gerrymandering.
How Gerrymandering FunctionsRacial and partisan gerrymandering function quite similarly; a racial or political group with control of the redistricting process draws maps intentionally to disfavor another race or party. District lines drawn to reduce minority or a particular political party influence utilize two techniques: packing and cracking.
Chart 1-3 represent a hypothetical state to help dem-onstrate how packing and cracking show up in districts; each circle represents the location in the state of a voter and their chosen political party (green party and purple party). There are 15 voters who vote for green (representing 60 percent of the electorate), and ten who vote for purple (40 percent of the electorate). In Chart 1, five districts are created by districting the state via horizontal lines. As a result, the green party wins three districts (electing three representatives) or 60 percent of the total five districts, and the purple party wins two districts or 40 percent of the total. This result is proportional to the overall population of voters.
Chart 1 Districts Divided Uniformly
Packing is the process of jamming as many voters of a specific political party or minority group into as few of districts as possible, limiting the total number of
districts that the group can win and thus elect officials representing the group. Chart 2 provides a visualiza-tion of how packing could work. Instead of the party with more voters (i.e. green party) winning the majority of districts, most of the green party’s voters are packed into the two districts where nine of ten voters in these districts are from the same party. This leaves the purple party in control of three districts, a majority, despite representing only 40 percent of all voters.
Chart 2 Packed Districts
Not only does packing have the effect of limiting the total number of candidates a single group can elect, it also limits the competitiveness of the packed district. If 80 percent of voters within a given district have a similar mindset in terms of how they will vote, then the general election is more likely to be less competitive than the primary election for that seat. These effects can limit independent and opposition party members’ voices in their district, particularly if the state uses a closed primary to elect general election candidates. Further, packing limits the accountability of the representative elected to office as there is little incentive for the elected official to respond to voices of those from a minority party because the risk of a general election challenge is very minimal. It can even be argued that packing leads to more extreme candidates, as the primary is more important than the general election. If four candidates run in a primary, 25 percent of one party would decide the representative for the entire district.
In a similar but opposite fashion, cracking (also occa-sionally called fracturing) occurs when a minority group or political party stronghold is divided into pieces in a way that it is unable to elect candidates at all. This type of gerrymandering is shown in Chart 3, where the

Lorem ipsum dolor sit amet, consectetur adipiscing elit. Maecenas ultrices mi velit, sit amet malesuada elit venenatis et.
Sed condimentum sodales justo, a molestie tortor mattis ut. Cras ornare rutrum lorem, a auctor sem hendrerit ac.
Quisque auctor eros eu dui pretium condimentum in in leo. Phasellus interdum tellus in elementum maximus. Quisque
ut condimentum nulla. Nunc lorem ligula, vehicula id pretium ut, gravida sit amet nunc.
Nam gravida turpis a nulla vehicula fringilla. Nam a luctus augue, nec ultrices est. Proin a feugiat massa, id vulputate
metus. Mauris id lacinia elit, et lobortis sem. Sed quis diam pulvinar, egestas urna at, mattis odio. Phasellus bibendum
nulla vitae maximus imperdiet. Vestibulum ac quam volutpat, commodo enim id, molestie tortor. Morbi dapibus dapibus
ornare. Pellentesque quis massa tellus. In interdum in lacus nec fermentum. Nullam ullamcorper euismod justo at
dictum. Phasellus aliquet ultrices dolor, vel tempor diam convallis quis. Vestibulum hendrerit dignissim enim nec
dapibus. Integer volutpat congue tincidunt. Vestibulum sed nunc leo.
Morbi sed sapien vitae urna pretium dignissim eu at sapien. Aliquam eu nisl volutpat, commodo mauris sed, pharetra
ante. Nulla lobortis lectus ac sem imperdiet, at fringilla ante commodo. Aliquam sed ullamcorper nisl. Nullam sollicitudin
dolor purus, nec cursus mauris mattis quis. Pellentesque consectetur tellus vel nisi elementum volutpat. Suspendisse
sed dolor sit amet libero tincidunt congue. In egestas libero neque, vel cursus dui blandit vel.
Quisque sit amet venenatis eros. Nulla vulputate pulvinar mauris. Vestibulum pulvinar erat varius sem vestibulum, at
tristique nisl dapibus. Morbi hendrerit nisi malesuada, feugiat justo vitae, sagittis orci. Nam quis laoreet quam, a
faucibus risus. Morbi egestas molestie odio quis elementum. Suspendisse iaculis nisi id risus vehicula convallis. Donec
tincidunt congue fringilla.
Aliquam erat volutpat. Sed imperdiet augue sit amet eros rhoncus egestas. Mauris mauris nunc, scelerisque eu dapibus
nec, hendrerit a dolor. Duis vel nisl porttitor, dictum nulla id, molestie lacus. Nulla vehicula placerat justo, vel semper
metus luctus sed. Cras blandit ultrices ipsum sed facilisis. Maecenas varius eros orci, sed mollis arcu finibus eu. Nullam
ut quam ut lorem rutrum cursus non sed massa. Nunc sed sollicitudin orci. Integer libero tellus, iaculis in orci ut, ornare
vehicula ante.
Quisque sit amet venenatis eros. Nulla vulputate pulvinar mauris. Vestibulum pulvinar erat varius sem vestibulum, at
tristique nisl dapibus. Morbi hendrerit nisi malesuada, feugiat justo vitae, sagittis orci. Nam quis laoreet quam, a
faucibus risus. Morbi egestas molestie odio quis elementum. Suspendisse iaculis nisi id risus vehicula convallis. Donec
tincidunt congue fringilla.
Maecenas varius eros orci, sed mollis arcu finibus eu. Nullam ut quam ut lorem rutrum cursus non sed massa. Nunc sed
sollicitudin orci. Integer libero tellus, iaculis in orci ut, ornare vehicula ante.
Official Research Paper
Lorem Ipsum Research Paper TitleLorem Ipsum Sub-Heading
115 West Allegan Suite 480 | Lansing, MI 48933 | crcmich.org pg. 1
5
Quantifying the Level of Gerrymandering in Michigan
purple group’s stronghold towards the right side of the demonstration is cut into four districts.
Chart 3 Cracked Districts
Cracking can divide particular communities in ways that make it difficult to create regional representation.
If a region that was cracked through the districting process has a particular policy interest, dividing it into several districts spreads those concerns over several representatives; but it is a minimal concern for each, as only a small portion of that representative’s voters are concerned with it, and in the case of a cracked district they are likely voting against their representa-tive anyway.
One of the more notable instances of cracking occurred in Los Angeles’ Koreatown. Despite being roughly a square mile in total area, portions of Koreatown were divided into five different state legislative districts dur-ing the 1991 redistricting process. After the 1992 Los Angeles riots, many in the community attempted to turn to their representatives to get help with the cleanup ef-forts; each representative refused to advocate for their interests as it did not have electoral benefits for them, and claimed it was a job for a different representative.7
The Basics of RedistrictingWhat, if anything, can be done to limit gerrymandering via the redistricting process? As a fundamental part of our representative system of government, the federal and state rules for the redistricting process are designed to prescribe how map makers draw electoral districts.
The redistricting process generally occurs in conjunc-tion with the U.S. Census Bureau’s decennial census, which provides states with updated population counts every ten years to ensure accurate apportionment for congressional representation (there are 435 seats in the U.S. House of Representatives). States are appor-tioned seats in the U.S. House based on their share of the total U.S. population. After reapportionment, states must draw congressional districts, keeping districts relatively equal in terms of population. States usually redistrict state legislative districts (e.g., house and senate) at the same time as congressional districts.
While the U.S. Constitution places one tangible limit on the redistricting process and allows Congress to place other limits, the U.S. Constitution gives states the ex-plicit power to design their own redistricting processes. As a result, state legislatures are responsible for draw-ing legislative maps in 37 states. Because there are few federal requirements, and there is a significant
amount at stake in the redistricting process, 37 states impose some level of state constitutional limitation on their own redistricting process.
The most widely adopted of these rules at some level limit the ability of legislatures to gerrymander. Measures like compactness have been used to try to discourage winding, narrow districts shown as the archetypal gerrymander. Even though these are impor-tant rules to enforce, advancements in technology have demonstrated that these measures are insufficient to prevent partisan gerrymandering.
While the U.S. Constitution places one tangible limit on the redistrict-ing process and allows Congress to place other limits, the U.S. Con-stitution gives states the explicit power to design their own redistrict-ing processes.

Lorem ipsum dolor sit amet, consectetur adipiscing elit. Maecenas ultrices mi velit, sit amet malesuada elit venenatis et.
Sed condimentum sodales justo, a molestie tortor mattis ut. Cras ornare rutrum lorem, a auctor sem hendrerit ac.
Quisque auctor eros eu dui pretium condimentum in in leo. Phasellus interdum tellus in elementum maximus. Quisque
ut condimentum nulla. Nunc lorem ligula, vehicula id pretium ut, gravida sit amet nunc.
Nam gravida turpis a nulla vehicula fringilla. Nam a luctus augue, nec ultrices est. Proin a feugiat massa, id vulputate
metus. Mauris id lacinia elit, et lobortis sem. Sed quis diam pulvinar, egestas urna at, mattis odio. Phasellus bibendum
nulla vitae maximus imperdiet. Vestibulum ac quam volutpat, commodo enim id, molestie tortor. Morbi dapibus dapibus
ornare. Pellentesque quis massa tellus. In interdum in lacus nec fermentum. Nullam ullamcorper euismod justo at
dictum. Phasellus aliquet ultrices dolor, vel tempor diam convallis quis. Vestibulum hendrerit dignissim enim nec
dapibus. Integer volutpat congue tincidunt. Vestibulum sed nunc leo.
Morbi sed sapien vitae urna pretium dignissim eu at sapien. Aliquam eu nisl volutpat, commodo mauris sed, pharetra
ante. Nulla lobortis lectus ac sem imperdiet, at fringilla ante commodo. Aliquam sed ullamcorper nisl. Nullam sollicitudin
dolor purus, nec cursus mauris mattis quis. Pellentesque consectetur tellus vel nisi elementum volutpat. Suspendisse
sed dolor sit amet libero tincidunt congue. In egestas libero neque, vel cursus dui blandit vel.
Quisque sit amet venenatis eros. Nulla vulputate pulvinar mauris. Vestibulum pulvinar erat varius sem vestibulum, at
tristique nisl dapibus. Morbi hendrerit nisi malesuada, feugiat justo vitae, sagittis orci. Nam quis laoreet quam, a
faucibus risus. Morbi egestas molestie odio quis elementum. Suspendisse iaculis nisi id risus vehicula convallis. Donec
tincidunt congue fringilla.
Aliquam erat volutpat. Sed imperdiet augue sit amet eros rhoncus egestas. Mauris mauris nunc, scelerisque eu dapibus
nec, hendrerit a dolor. Duis vel nisl porttitor, dictum nulla id, molestie lacus. Nulla vehicula placerat justo, vel semper
metus luctus sed. Cras blandit ultrices ipsum sed facilisis. Maecenas varius eros orci, sed mollis arcu finibus eu. Nullam
ut quam ut lorem rutrum cursus non sed massa. Nunc sed sollicitudin orci. Integer libero tellus, iaculis in orci ut, ornare
vehicula ante.
Quisque sit amet venenatis eros. Nulla vulputate pulvinar mauris. Vestibulum pulvinar erat varius sem vestibulum, at
tristique nisl dapibus. Morbi hendrerit nisi malesuada, feugiat justo vitae, sagittis orci. Nam quis laoreet quam, a
faucibus risus. Morbi egestas molestie odio quis elementum. Suspendisse iaculis nisi id risus vehicula convallis. Donec
tincidunt congue fringilla.
Maecenas varius eros orci, sed mollis arcu finibus eu. Nullam ut quam ut lorem rutrum cursus non sed massa. Nunc sed
sollicitudin orci. Integer libero tellus, iaculis in orci ut, ornare vehicula ante.
Official Research Paper
Lorem Ipsum Research Paper TitleLorem Ipsum Sub-Heading
115 West Allegan Suite 480 | Lansing, MI 48933 | crcmich.org pg. 1
6
Quantifying the Level of Gerrymandering in Michigan
Beyond Packing and Cracking – Other Forms of GerrymanderingIn addition to packing and cracking, other, typically more targeted, methods of gerrymandering exist. These other techniques are mostly focused on gearing a particular political result in a specific district. These methods typically are not used to advance a partisan gerrymander, but instead achieve other, more targeted goals.
Tacking – When a distant area with desired demographics is grabbed, it’s called tacking. This is alleged to have been the technique that New York Democrats used to draw Assembly District 131 in 2002 (see Map 1). Because most of the district is in the predominantly Republican suburbs, the redistricting entity added a trail of heavily Democratic residences (northeast corner) to keep the Democratic incumbent in office.1 Some states have used tacking to protect all incumbents, not just those from specific parties, to maintain high incumbency rates statewide.2
Hijacking – This technique involves separating an incum-bent candidate from the candidate’s constituents, thus creating a district in which the candidate has no name recognition. Following the 2000 census, Michigan lost a congressional seat. The 2001 redistricting plan shifted Congressman David Bonior’s (Democrat) residence from the 10th District to the more conservative 12th District; Bonior did not run for reelection but instead ran unsuc-cessfully to be the Democratic candidate for governor. If this shift was the result of gerrymandering, as the Harvard Law Review alleges,3 then it is an example of hijacking.
Kidnapping – Kidnapping occurs when two incumbent candidates are drawn into the same district so they must run against each other. Also in 2000, the Michigan’s redis-tricting plan moved the district boundaries of members of the U.S. House, John Dingell (Democrat) and Lynn Rivers (Democrat), resulting in a primary election in which the two ran against each other. John Dingell, who had served 23 terms in the U.S. House by that time, defeated Lynn Rivers, a four-term member, in the primary election. If Michigan gerrymandered these districts, as the Harvard Law Review implicates,4 then the technique that was used is kidnapping.
Eliminating Competitors – This method involves shifting district boundaries to move an incumbent’s potential competitor to another district. In 2000, 13-term incumbent Roger Green narrowly defeated his opponent in the primary election for New York’s 57th legislative seat. The redistricting that took place in New York after the 2000 census changed the boundaries of the district such that Green’s competitor no longer lived in the district, a change that many believe to be the result of gerrymandering. In 2004, Green had no primary elec-tion opponent. Two years later, Green’s challenger moved back into the 57th legislative district and defeated Green in that year’s primary election, going on to win the general election as well.5
1 “Gerrymandering, Pure and Corrupt.” Editorial. The New York Times. 11 Nov. 2009. Web. 6 Feb. 2011. www.nytimes.com/2009/ 11/12/opinion/12thu1.html.
2 Isenstadt, Alex. "California Incumbents Safe No More?" POLITICO. April 12, 2011. www.politico.com/story/2011/04/california-incumbents-safe-no-more-052970.
3 “Political Gerrymandering 2000-2008: ‘A Self-Limiting Enterprise’?” Harvard Law Review. 122 (2009): 1476 and 1487.4 “Political Gerrymandering 2000-2008: ‘A Self-Limiting Enterprise’?” Harvard Law Review. 122 (2009): 1476 and 1487.5 “Political Gerrymandering 2000-2008: ‘A Self-Limiting Enterprise’?” Harvard Law Review. 122 (2009): 1476.
Map 1 New York Assembly District 131, 2001-2010
Source: Citizens for a Better New York, Inc. Current Gerrymandering, www.cbgny.org/gerry.htm.

Lorem ipsum dolor sit amet, consectetur adipiscing elit. Maecenas ultrices mi velit, sit amet malesuada elit venenatis et.
Sed condimentum sodales justo, a molestie tortor mattis ut. Cras ornare rutrum lorem, a auctor sem hendrerit ac.
Quisque auctor eros eu dui pretium condimentum in in leo. Phasellus interdum tellus in elementum maximus. Quisque
ut condimentum nulla. Nunc lorem ligula, vehicula id pretium ut, gravida sit amet nunc.
Nam gravida turpis a nulla vehicula fringilla. Nam a luctus augue, nec ultrices est. Proin a feugiat massa, id vulputate
metus. Mauris id lacinia elit, et lobortis sem. Sed quis diam pulvinar, egestas urna at, mattis odio. Phasellus bibendum
nulla vitae maximus imperdiet. Vestibulum ac quam volutpat, commodo enim id, molestie tortor. Morbi dapibus dapibus
ornare. Pellentesque quis massa tellus. In interdum in lacus nec fermentum. Nullam ullamcorper euismod justo at
dictum. Phasellus aliquet ultrices dolor, vel tempor diam convallis quis. Vestibulum hendrerit dignissim enim nec
dapibus. Integer volutpat congue tincidunt. Vestibulum sed nunc leo.
Morbi sed sapien vitae urna pretium dignissim eu at sapien. Aliquam eu nisl volutpat, commodo mauris sed, pharetra
ante. Nulla lobortis lectus ac sem imperdiet, at fringilla ante commodo. Aliquam sed ullamcorper nisl. Nullam sollicitudin
dolor purus, nec cursus mauris mattis quis. Pellentesque consectetur tellus vel nisi elementum volutpat. Suspendisse
sed dolor sit amet libero tincidunt congue. In egestas libero neque, vel cursus dui blandit vel.
Quisque sit amet venenatis eros. Nulla vulputate pulvinar mauris. Vestibulum pulvinar erat varius sem vestibulum, at
tristique nisl dapibus. Morbi hendrerit nisi malesuada, feugiat justo vitae, sagittis orci. Nam quis laoreet quam, a
faucibus risus. Morbi egestas molestie odio quis elementum. Suspendisse iaculis nisi id risus vehicula convallis. Donec
tincidunt congue fringilla.
Aliquam erat volutpat. Sed imperdiet augue sit amet eros rhoncus egestas. Mauris mauris nunc, scelerisque eu dapibus
nec, hendrerit a dolor. Duis vel nisl porttitor, dictum nulla id, molestie lacus. Nulla vehicula placerat justo, vel semper
metus luctus sed. Cras blandit ultrices ipsum sed facilisis. Maecenas varius eros orci, sed mollis arcu finibus eu. Nullam
ut quam ut lorem rutrum cursus non sed massa. Nunc sed sollicitudin orci. Integer libero tellus, iaculis in orci ut, ornare
vehicula ante.
Quisque sit amet venenatis eros. Nulla vulputate pulvinar mauris. Vestibulum pulvinar erat varius sem vestibulum, at
tristique nisl dapibus. Morbi hendrerit nisi malesuada, feugiat justo vitae, sagittis orci. Nam quis laoreet quam, a
faucibus risus. Morbi egestas molestie odio quis elementum. Suspendisse iaculis nisi id risus vehicula convallis. Donec
tincidunt congue fringilla.
Maecenas varius eros orci, sed mollis arcu finibus eu. Nullam ut quam ut lorem rutrum cursus non sed massa. Nunc sed
sollicitudin orci. Integer libero tellus, iaculis in orci ut, ornare vehicula ante.
Official Research Paper
Lorem Ipsum Research Paper TitleLorem Ipsum Sub-Heading
115 West Allegan Suite 480 | Lansing, MI 48933 | crcmich.org pg. 1
7
Quantifying the Level of Gerrymandering in Michigan
Federal RequirementsPopulationA key federal requirement for redistricting plans is that districts should be of roughly equal population. Numerous rulings in the U.S. Supreme Court from the early 1960s determined that the Equal Protection Clause of the 14th Amendment to the U.S. Constitution established the principle of “one person, one vote” in regards to congressional, state, and sub-state legisla-tive representation. This standard requires that districts must maintain equal population.8
Population requirements keep individual voters on an even playing field. If one congressional district had half the population of another district, each vote in the more populous district would have half the effect on the election outcome; however, each district’s repre-sentative’s vote would have equal weight in Congress. As a result, districts that have larger than average population functionally dilute the power of some vot-ers, while votes in districts with a smaller population are inflated in value. Maintain-ing districts of equal size means that all citizens are represented about equally.
Because historically it was difficult to make districts exactly equal, especially with competing interests like maintaining Voting Rights Act compliance (see Equal Opportunity, page 9) and the desire to keep local gov-ernment units in one district, the courts gave states some leeway in meeting equal population guidelines. More leeway is given to state legislative districts than congressional districts. The leeway given varies depending on the specific needs articulated by state legislatures. In Wesberry v. Sanders (1963), the U.S. Supreme Court stated that:
“[A] state may legitimately desire to maintain the integrity of various political subdivisions, insofar as possible, and to provide for compact districts of contiguous territory…So long as the divergences from a strict population standard are based on le-gitimate considerations incident to the effectuation of a rational state policy, some deviations from the equality-population principle are constitutionally per-
missible with respect to the apportionment of seats in either or both of the two houses of a bicameral state legislature.”9
A few cases demonstrate the difference in variation that the Court is willing to allow. In a 1969 case regarding Missouri’s congressional districts, the Court found that a total deviation of six percent (e.g. having one district three percent above and one district three percent below the average district size) was too large, setting a strict standard for congressional districts.10
In a contrasting decision focusing on state legislatures in 1973, the Court accepted a total variation of 16.9 percent in Virginia’s legislative districts.11 This has created a precedent that compliance with “one person, one vote” standards in state legislative districts is less stringent.
In practice, the overwhelming majority of districts for both congressional and state seats tend to have little to no population variance. Table 1 shows the variation in
population of districts set up after the 2010 census. Only 10 states had variations in congressional districts larger than 10 people, with the overwhelming majority having a maximum variation of a single person. State legislative districts had higher variation, with lower chambers having a mean variation of 5.24 percent and up-
per chambers having a mean variation of 5.28 percent.a This shows that, while in theory it could be difficult to meet strict population requirements, in practice most states have little to no trouble meeting the require-ments, but use some of the flexibility afforded in state legislative redistricting to meet other state needs.
Michigan’s congressional districts have a minimal vari-ance; each district was set up with a maximum varia-tion of one person from district to district. The state
a Note: Mean variance was calculated without Hawaii due to the severe outlier status of Hawaii’s population variance, which exceeded 20 percent for the lower chamber and 40 percent for the upper chamber as it would skew that dataset. While this serves as an outlier nationally, these numbers are similar to historical variation for the state, as Hawaii attempts to main-tain island borders in districts when possible, and equalizing districts would lead to arbitrary combinations of islands.
In practice, the overwhelming majority of districts for both congressional and state seats tend to have little to no popula-tion variation.

Lorem ipsum dolor sit amet, consectetur adipiscing elit. Maecenas ultrices mi velit, sit amet malesuada elit venenatis et.
Sed condimentum sodales justo, a molestie tortor mattis ut. Cras ornare rutrum lorem, a auctor sem hendrerit ac.
Quisque auctor eros eu dui pretium condimentum in in leo. Phasellus interdum tellus in elementum maximus. Quisque
ut condimentum nulla. Nunc lorem ligula, vehicula id pretium ut, gravida sit amet nunc.
Nam gravida turpis a nulla vehicula fringilla. Nam a luctus augue, nec ultrices est. Proin a feugiat massa, id vulputate
metus. Mauris id lacinia elit, et lobortis sem. Sed quis diam pulvinar, egestas urna at, mattis odio. Phasellus bibendum
nulla vitae maximus imperdiet. Vestibulum ac quam volutpat, commodo enim id, molestie tortor. Morbi dapibus dapibus
ornare. Pellentesque quis massa tellus. In interdum in lacus nec fermentum. Nullam ullamcorper euismod justo at
dictum. Phasellus aliquet ultrices dolor, vel tempor diam convallis quis. Vestibulum hendrerit dignissim enim nec
dapibus. Integer volutpat congue tincidunt. Vestibulum sed nunc leo.
Morbi sed sapien vitae urna pretium dignissim eu at sapien. Aliquam eu nisl volutpat, commodo mauris sed, pharetra
ante. Nulla lobortis lectus ac sem imperdiet, at fringilla ante commodo. Aliquam sed ullamcorper nisl. Nullam sollicitudin
dolor purus, nec cursus mauris mattis quis. Pellentesque consectetur tellus vel nisi elementum volutpat. Suspendisse
sed dolor sit amet libero tincidunt congue. In egestas libero neque, vel cursus dui blandit vel.
Quisque sit amet venenatis eros. Nulla vulputate pulvinar mauris. Vestibulum pulvinar erat varius sem vestibulum, at
tristique nisl dapibus. Morbi hendrerit nisi malesuada, feugiat justo vitae, sagittis orci. Nam quis laoreet quam, a
faucibus risus. Morbi egestas molestie odio quis elementum. Suspendisse iaculis nisi id risus vehicula convallis. Donec
tincidunt congue fringilla.
Aliquam erat volutpat. Sed imperdiet augue sit amet eros rhoncus egestas. Mauris mauris nunc, scelerisque eu dapibus
nec, hendrerit a dolor. Duis vel nisl porttitor, dictum nulla id, molestie lacus. Nulla vehicula placerat justo, vel semper
metus luctus sed. Cras blandit ultrices ipsum sed facilisis. Maecenas varius eros orci, sed mollis arcu finibus eu. Nullam
ut quam ut lorem rutrum cursus non sed massa. Nunc sed sollicitudin orci. Integer libero tellus, iaculis in orci ut, ornare
vehicula ante.
Quisque sit amet venenatis eros. Nulla vulputate pulvinar mauris. Vestibulum pulvinar erat varius sem vestibulum, at
tristique nisl dapibus. Morbi hendrerit nisi malesuada, feugiat justo vitae, sagittis orci. Nam quis laoreet quam, a
faucibus risus. Morbi egestas molestie odio quis elementum. Suspendisse iaculis nisi id risus vehicula convallis. Donec
tincidunt congue fringilla.
Maecenas varius eros orci, sed mollis arcu finibus eu. Nullam ut quam ut lorem rutrum cursus non sed massa. Nunc sed
sollicitudin orci. Integer libero tellus, iaculis in orci ut, ornare vehicula ante.
Official Research Paper
Lorem Ipsum Research Paper TitleLorem Ipsum Sub-Heading
115 West Allegan Suite 480 | Lansing, MI 48933 | crcmich.org pg. 1
8
Quantifying the Level of Gerrymandering in Michigan
Table 1 National District Population and Variation
State 2010 Congressional 2010 State House 2010 State Senate
Ideal District Percent Overall Range Total Range Ideal District Percent Overall
Range Ideal District Percent Overall Range
Alabama 682,819 0.00 1 45,521 1.98 136,564 1.98 Alaska N/A N/A N/A 17,756 9.04 35,512 8.45 Arizona 710,224 0.00 0 213,067 8.78 213,067 8.78Arkansas 728,980 0.06 428 29,159 8.36 83,312 8.20 California 702,905 0.00 1 465,674 0.45 931,349 0.63Colorado 718,457 0.00 1 77,372 4.98 143,691 4.99Connecticut 714,819 0.00 1 23,670 5.99 99,280 9.79Delaware N/A N/A N/A 21,901 9.93 42,759 10.73 Florida 696,345 0.00 1 156,678 3.98 470,033 1.99Georgia 691,975 0.00 2 53,820 1.98 172,994 1.84 Hawaii 680,151 0.10 691 24,540 21.57 50,061 44.23 Idaho 783,791 0.09 682 44,788 9.70 44,788 9.70Illinois 712,813 0.00 1 108,734 0.00 217,468 0.00Indiana 720,422 0.00 1 64,838 1.74 129,676 2.88Iowa 761,589 0.01 76 30,464 1.93 60,927 1.65Kansas 713,280 0.00 15 22,716 2.87 70,986 2.03 Kentucky 723,228 0.00 1 43,394 10.00 114,194 9.84Louisiana 755,445 0.03 162 43,174 9.89 116,240 9.86 Maine 664,181 0.00 1 8,797 9.90 37,953 9.51 Maryland 721,529 0.00 1 40,938* 8.92 122,813 8.87Massachusetts 727,514 0.00 1 40,923 9.74 163,691 9.77Michigan 705,974 0.00 1 89,851 9.96 260,096 9.79Minnesota 662,991 0.00 1 79,163 1.42 39,582 1.60Mississippi 741,824 0.20 134 24,322 9.95 57,063 9.77 Missouri 748,616 0.00 1 36,742 7.80 176,145 8.50 Montana N/A N/A N/A 9,894 5.44 19,788 5.26 Nebraska 608,780 0.00 1 N/A N/A 37,272 7.39Nevada 675,138 0.00 1 64,299 1.33 128,598 0.80New Hampshire 658,235 0.00 4 3,291 9.90 54,853 8.83 New Jersey 732,658 0.00 1 219,797 5.20 219,797 5.20New Mexico 686,393 0.00 0 29,417 6.68 49,028 8.70New York 717,707 0.00 1 129,089 7.94 307,356 8.80 North Carolina 733,499 0.00 1 79,462 9.90 190,710 9.74North Dakota N/A N/A N/A 14,310 8.86 14,310 8.86Ohio 721,032 0.00 1 116,530 16.44 349,591 9.20 Oklahoma 750,270 0.00 1 37,142 1.81 78,153 2.03

Lorem ipsum dolor sit amet, consectetur adipiscing elit. Maecenas ultrices mi velit, sit amet malesuada elit venenatis et.
Sed condimentum sodales justo, a molestie tortor mattis ut. Cras ornare rutrum lorem, a auctor sem hendrerit ac.
Quisque auctor eros eu dui pretium condimentum in in leo. Phasellus interdum tellus in elementum maximus. Quisque
ut condimentum nulla. Nunc lorem ligula, vehicula id pretium ut, gravida sit amet nunc.
Nam gravida turpis a nulla vehicula fringilla. Nam a luctus augue, nec ultrices est. Proin a feugiat massa, id vulputate
metus. Mauris id lacinia elit, et lobortis sem. Sed quis diam pulvinar, egestas urna at, mattis odio. Phasellus bibendum
nulla vitae maximus imperdiet. Vestibulum ac quam volutpat, commodo enim id, molestie tortor. Morbi dapibus dapibus
ornare. Pellentesque quis massa tellus. In interdum in lacus nec fermentum. Nullam ullamcorper euismod justo at
dictum. Phasellus aliquet ultrices dolor, vel tempor diam convallis quis. Vestibulum hendrerit dignissim enim nec
dapibus. Integer volutpat congue tincidunt. Vestibulum sed nunc leo.
Morbi sed sapien vitae urna pretium dignissim eu at sapien. Aliquam eu nisl volutpat, commodo mauris sed, pharetra
ante. Nulla lobortis lectus ac sem imperdiet, at fringilla ante commodo. Aliquam sed ullamcorper nisl. Nullam sollicitudin
dolor purus, nec cursus mauris mattis quis. Pellentesque consectetur tellus vel nisi elementum volutpat. Suspendisse
sed dolor sit amet libero tincidunt congue. In egestas libero neque, vel cursus dui blandit vel.
Quisque sit amet venenatis eros. Nulla vulputate pulvinar mauris. Vestibulum pulvinar erat varius sem vestibulum, at
tristique nisl dapibus. Morbi hendrerit nisi malesuada, feugiat justo vitae, sagittis orci. Nam quis laoreet quam, a
faucibus risus. Morbi egestas molestie odio quis elementum. Suspendisse iaculis nisi id risus vehicula convallis. Donec
tincidunt congue fringilla.
Aliquam erat volutpat. Sed imperdiet augue sit amet eros rhoncus egestas. Mauris mauris nunc, scelerisque eu dapibus
nec, hendrerit a dolor. Duis vel nisl porttitor, dictum nulla id, molestie lacus. Nulla vehicula placerat justo, vel semper
metus luctus sed. Cras blandit ultrices ipsum sed facilisis. Maecenas varius eros orci, sed mollis arcu finibus eu. Nullam
ut quam ut lorem rutrum cursus non sed massa. Nunc sed sollicitudin orci. Integer libero tellus, iaculis in orci ut, ornare
vehicula ante.
Quisque sit amet venenatis eros. Nulla vulputate pulvinar mauris. Vestibulum pulvinar erat varius sem vestibulum, at
tristique nisl dapibus. Morbi hendrerit nisi malesuada, feugiat justo vitae, sagittis orci. Nam quis laoreet quam, a
faucibus risus. Morbi egestas molestie odio quis elementum. Suspendisse iaculis nisi id risus vehicula convallis. Donec
tincidunt congue fringilla.
Maecenas varius eros orci, sed mollis arcu finibus eu. Nullam ut quam ut lorem rutrum cursus non sed massa. Nunc sed
sollicitudin orci. Integer libero tellus, iaculis in orci ut, ornare vehicula ante.
Official Research Paper
Lorem Ipsum Research Paper TitleLorem Ipsum Sub-Heading
115 West Allegan Suite 480 | Lansing, MI 48933 | crcmich.org pg. 1
9
Quantifying the Level of Gerrymandering in Michigan
the strength of the black vote by forming a series of multi-member districts. The Court found that North Carolina had violated the Voting Rights Act with the district map it selected. In determining the case, the Court developed what would become known as the Gingles test, which provides a guideline to determine whether a Voting Rights Act violation occurred in the redistricting process. A violation occurs when the fol-lowing three conditions are present in a district:
• Minority groups that are “sufficiently large and geographically compact to constitute a majority in a single-member district”;
• Minority groups whose members are “politi-cally cohesive”, i.e. have a history of voting for the same candidate; and
• The majority group votes “sufficiently as a bloc to enable it…usually to defeat the mi-nority’s preferred candidate”.12
house and senate districts have much more variance than the national average. Michigan’s state legislative districts have nearly twice the median variation, putting Michigan among the states with the highest variance.
Equal OpportunitySection 2 of the federal Voting Rights Act of 1965 pro-vides a series of protections in an attempt to prohibit efforts to suppress votes of certain protected minority groups. When drawing both congressional and state legislative districts, states are prohibited from dividing minority groups or lumping them in larger communi-ties to diminish their voting power. The U.S. Supreme Court has looked at a handful of cases to determine what is deemed an unfair use of power.
The primary test was developed in the first of these cases, Thornburg v. Gingles (1986), in which the plain-tiffs claimed that the state of North Carolina diluted
State 2010 Congressional 2010 State House 2010 State Senate
Ideal District Percent Overall Range Total Range Ideal District Percent Overall
Range Ideal District Percent Overall Range
Oregon 766,215 0.00 2 63,851 3.10 127,702 2.99Pennsylvania 705,688 0.00 1 62,573 7.88 254,048 7.96 Rhode Island 526,284 0.00 1 14,034 4.98 27,699 5.01 South Carolina 660,766 0.00 1 37,301 4.99 100,551 9.55 South Dakota N/A N/A N/A 11,163** 4.68 23,262 9.47Tennessee 705,123 0.00 1 192,306 9.17 64,102 9.74 Texas 698,488 0.00 32 167,637 9.92 811,147 8.04Utah 690,971 0.00 1 36,852 1.55 95,306 0.39 Vermont N/A N/A N/A 4,172 18.90 20,858 18.20Virginia 727,366 0.00 1 80,010 2.00 200,026 4.00Washington 672,454 0.00 19 137,236 0.07 137,236 0.07West Virginia 617,665 0.79 4,871 18,530 9.99 109,000 10.00Wisconsin 710,873 0.00 1 57,444 0.76 172,333 0.62 Wyoming 536,626 0.00 0 9,394 9.84 18,788 9.37
N/A - The state only has one congressional representative, and thus does not have congressional districts.*In Maryland, each senate district is divided into three districts for the state’s General Assembly. There are several multi-member districts, some with two and some with three representatives. The number reported is for single-member legislative districts.**South Dakota senate districts are divided in two to create house districts. Some districts are left as multi-member districts. The number reported is for single-member districts.
Source: The National Conference of State Legislatures
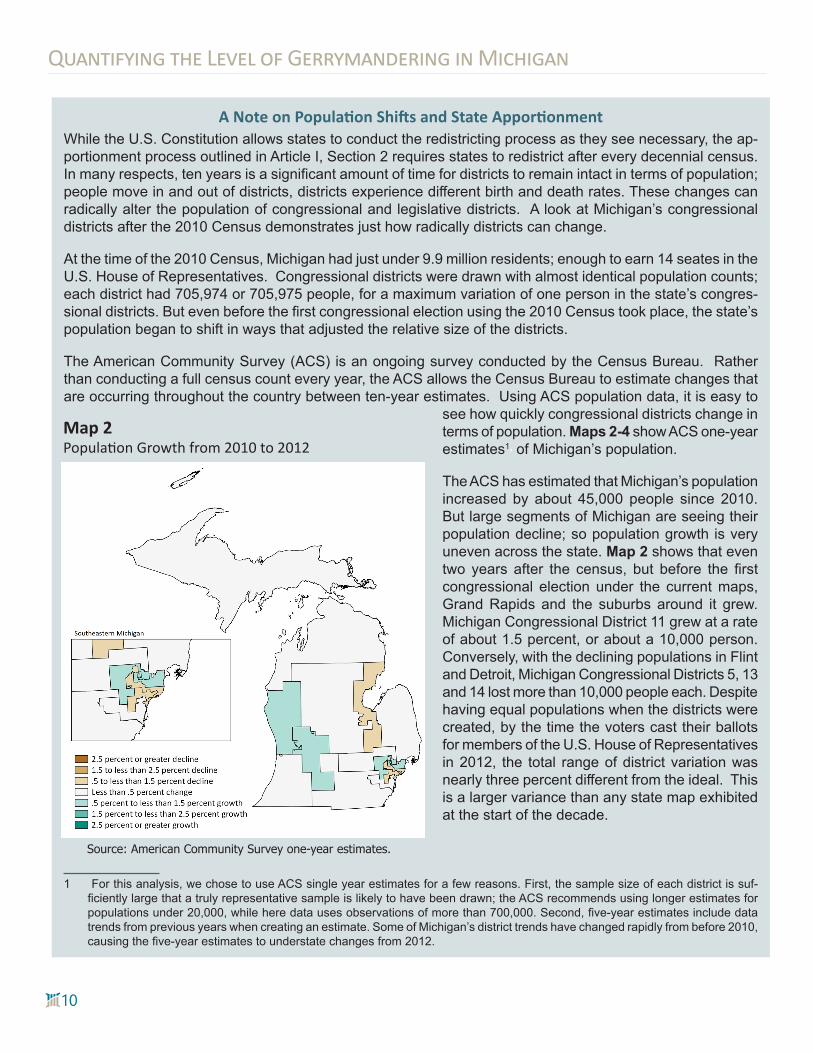
Lorem ipsum dolor sit amet, consectetur adipiscing elit. Maecenas ultrices mi velit, sit amet malesuada elit venenatis et.
Sed condimentum sodales justo, a molestie tortor mattis ut. Cras ornare rutrum lorem, a auctor sem hendrerit ac.
Quisque auctor eros eu dui pretium condimentum in in leo. Phasellus interdum tellus in elementum maximus. Quisque
ut condimentum nulla. Nunc lorem ligula, vehicula id pretium ut, gravida sit amet nunc.
Nam gravida turpis a nulla vehicula fringilla. Nam a luctus augue, nec ultrices est. Proin a feugiat massa, id vulputate
metus. Mauris id lacinia elit, et lobortis sem. Sed quis diam pulvinar, egestas urna at, mattis odio. Phasellus bibendum
nulla vitae maximus imperdiet. Vestibulum ac quam volutpat, commodo enim id, molestie tortor. Morbi dapibus dapibus
ornare. Pellentesque quis massa tellus. In interdum in lacus nec fermentum. Nullam ullamcorper euismod justo at
dictum. Phasellus aliquet ultrices dolor, vel tempor diam convallis quis. Vestibulum hendrerit dignissim enim nec
dapibus. Integer volutpat congue tincidunt. Vestibulum sed nunc leo.
Morbi sed sapien vitae urna pretium dignissim eu at sapien. Aliquam eu nisl volutpat, commodo mauris sed, pharetra
ante. Nulla lobortis lectus ac sem imperdiet, at fringilla ante commodo. Aliquam sed ullamcorper nisl. Nullam sollicitudin
dolor purus, nec cursus mauris mattis quis. Pellentesque consectetur tellus vel nisi elementum volutpat. Suspendisse
sed dolor sit amet libero tincidunt congue. In egestas libero neque, vel cursus dui blandit vel.
Quisque sit amet venenatis eros. Nulla vulputate pulvinar mauris. Vestibulum pulvinar erat varius sem vestibulum, at
tristique nisl dapibus. Morbi hendrerit nisi malesuada, feugiat justo vitae, sagittis orci. Nam quis laoreet quam, a
faucibus risus. Morbi egestas molestie odio quis elementum. Suspendisse iaculis nisi id risus vehicula convallis. Donec
tincidunt congue fringilla.
Aliquam erat volutpat. Sed imperdiet augue sit amet eros rhoncus egestas. Mauris mauris nunc, scelerisque eu dapibus
nec, hendrerit a dolor. Duis vel nisl porttitor, dictum nulla id, molestie lacus. Nulla vehicula placerat justo, vel semper
metus luctus sed. Cras blandit ultrices ipsum sed facilisis. Maecenas varius eros orci, sed mollis arcu finibus eu. Nullam
ut quam ut lorem rutrum cursus non sed massa. Nunc sed sollicitudin orci. Integer libero tellus, iaculis in orci ut, ornare
vehicula ante.
Quisque sit amet venenatis eros. Nulla vulputate pulvinar mauris. Vestibulum pulvinar erat varius sem vestibulum, at
tristique nisl dapibus. Morbi hendrerit nisi malesuada, feugiat justo vitae, sagittis orci. Nam quis laoreet quam, a
faucibus risus. Morbi egestas molestie odio quis elementum. Suspendisse iaculis nisi id risus vehicula convallis. Donec
tincidunt congue fringilla.
Maecenas varius eros orci, sed mollis arcu finibus eu. Nullam ut quam ut lorem rutrum cursus non sed massa. Nunc sed
sollicitudin orci. Integer libero tellus, iaculis in orci ut, ornare vehicula ante.
Official Research Paper
Lorem Ipsum Research Paper TitleLorem Ipsum Sub-Heading
115 West Allegan Suite 480 | Lansing, MI 48933 | crcmich.org pg. 1
10
Quantifying the Level of Gerrymandering in Michigan
A Note on Population Shifts and State ApportionmentWhile the U.S. Constitution allows states to conduct the redistricting process as they see necessary, the ap-portionment process outlined in Article I, Section 2 requires states to redistrict after every decennial census. In many respects, ten years is a significant amount of time for districts to remain intact in terms of population; people move in and out of districts, districts experience different birth and death rates. These changes can radically alter the population of congressional and legislative districts. A look at Michigan’s congressional districts after the 2010 Census demonstrates just how radically districts can change.
At the time of the 2010 Census, Michigan had just under 9.9 million residents; enough to earn 14 seates in the U.S. House of Representatives. Congressional districts were drawn with almost identical population counts; each district had 705,974 or 705,975 people, for a maximum variation of one person in the state’s congres-sional districts. But even before the first congressional election using the 2010 Census took place, the state’s population began to shift in ways that adjusted the relative size of the districts.
The American Community Survey (ACS) is an ongoing survey conducted by the Census Bureau. Rather than conducting a full census count every year, the ACS allows the Census Bureau to estimate changes that are occurring throughout the country between ten-year estimates. Using ACS population data, it is easy to
see how quickly congressional districts change in terms of population. Maps 2-4 show ACS one-year estimates1a of Michigan’s population.
The ACS has estimated that Michigan’s population increased by about 45,000 people since 2010. But large segments of Michigan are seeing their population decline; so population growth is very uneven across the state. Map 2 shows that even two years after the census, but before the first congressional election under the current maps, Grand Rapids and the suburbs around it grew. Michigan Congressional District 11 grew at a rate of about 1.5 percent, or about a 10,000 person. Conversely, with the declining populations in Flint and Detroit, Michigan Congressional Districts 5, 13 and 14 lost more than 10,000 people each. Despite having equal populations when the districts were created, by the time the voters cast their ballots for members of the U.S. House of Representatives in 2012, the total range of district variation was nearly three percent different from the ideal. This is a larger variance than any state map exhibited at the start of the decade.
1 For this analysis, we chose to use ACS single year estimates for a few reasons. First, the sample size of each district is suf-ficiently large that a truly representative sample is likely to have been drawn; the ACS recommends using longer estimates for populations under 20,000, while here data uses observations of more than 700,000. Second, five-year estimates include data trends from previous years when creating an estimate. Some of Michigan’s district trends have changed rapidly from before 2010, causing the five-year estimates to understate changes from 2012.
Map 2Population Growth from 2010 to 2012
Source: American Community Survey one-year estimates.

Lorem ipsum dolor sit amet, consectetur adipiscing elit. Maecenas ultrices mi velit, sit amet malesuada elit venenatis et.
Sed condimentum sodales justo, a molestie tortor mattis ut. Cras ornare rutrum lorem, a auctor sem hendrerit ac.
Quisque auctor eros eu dui pretium condimentum in in leo. Phasellus interdum tellus in elementum maximus. Quisque
ut condimentum nulla. Nunc lorem ligula, vehicula id pretium ut, gravida sit amet nunc.
Nam gravida turpis a nulla vehicula fringilla. Nam a luctus augue, nec ultrices est. Proin a feugiat massa, id vulputate
metus. Mauris id lacinia elit, et lobortis sem. Sed quis diam pulvinar, egestas urna at, mattis odio. Phasellus bibendum
nulla vitae maximus imperdiet. Vestibulum ac quam volutpat, commodo enim id, molestie tortor. Morbi dapibus dapibus
ornare. Pellentesque quis massa tellus. In interdum in lacus nec fermentum. Nullam ullamcorper euismod justo at
dictum. Phasellus aliquet ultrices dolor, vel tempor diam convallis quis. Vestibulum hendrerit dignissim enim nec
dapibus. Integer volutpat congue tincidunt. Vestibulum sed nunc leo.
Morbi sed sapien vitae urna pretium dignissim eu at sapien. Aliquam eu nisl volutpat, commodo mauris sed, pharetra
ante. Nulla lobortis lectus ac sem imperdiet, at fringilla ante commodo. Aliquam sed ullamcorper nisl. Nullam sollicitudin
dolor purus, nec cursus mauris mattis quis. Pellentesque consectetur tellus vel nisi elementum volutpat. Suspendisse
sed dolor sit amet libero tincidunt congue. In egestas libero neque, vel cursus dui blandit vel.
Quisque sit amet venenatis eros. Nulla vulputate pulvinar mauris. Vestibulum pulvinar erat varius sem vestibulum, at
tristique nisl dapibus. Morbi hendrerit nisi malesuada, feugiat justo vitae, sagittis orci. Nam quis laoreet quam, a
faucibus risus. Morbi egestas molestie odio quis elementum. Suspendisse iaculis nisi id risus vehicula convallis. Donec
tincidunt congue fringilla.
Aliquam erat volutpat. Sed imperdiet augue sit amet eros rhoncus egestas. Mauris mauris nunc, scelerisque eu dapibus
nec, hendrerit a dolor. Duis vel nisl porttitor, dictum nulla id, molestie lacus. Nulla vehicula placerat justo, vel semper
metus luctus sed. Cras blandit ultrices ipsum sed facilisis. Maecenas varius eros orci, sed mollis arcu finibus eu. Nullam
ut quam ut lorem rutrum cursus non sed massa. Nunc sed sollicitudin orci. Integer libero tellus, iaculis in orci ut, ornare
vehicula ante.
Quisque sit amet venenatis eros. Nulla vulputate pulvinar mauris. Vestibulum pulvinar erat varius sem vestibulum, at
tristique nisl dapibus. Morbi hendrerit nisi malesuada, feugiat justo vitae, sagittis orci. Nam quis laoreet quam, a
faucibus risus. Morbi egestas molestie odio quis elementum. Suspendisse iaculis nisi id risus vehicula convallis. Donec
tincidunt congue fringilla.
Maecenas varius eros orci, sed mollis arcu finibus eu. Nullam ut quam ut lorem rutrum cursus non sed massa. Nunc sed
sollicitudin orci. Integer libero tellus, iaculis in orci ut, ornare vehicula ante.
Official Research Paper
Lorem Ipsum Research Paper TitleLorem Ipsum Sub-Heading
115 West Allegan Suite 480 | Lansing, MI 48933 | crcmich.org pg. 1
11
Quantifying the Level of Gerrymandering in Michigan
Map 3 shows that, for the most part, the trends of 2012 continued. While the state population increased slightly, most regions saw the prior year trends con-tinue. The total range of variation from the average population per district reached 5.4 percent in 2014, or a difference of nearly 40,000 people between the largest and smallest district. This variance is only half of one percent lower than the variation in Missouri’s congressional districts that were deemed too large in Kirkpatrick v. Preisler (1969).
These trends continued to accelerate in 2016, as presented Map 4. By 2016, all but one congressional district had deviated from the average by more than 0.5 percent. Rural areas tended to show a pace of slow decline over the course of the six years ana-lyzed, while the trends shown in Map 2 continued. Due to changes in population, the range of deviation in congressional district populations reached nearly 11 percent, with some districts seven percent lower than the ideal, while other districts were about 3.5 percent above that mark.
Just six years into the 10-year cycle, deviation between districts increased to a point where the largest district in the state had nearly 80,000 more people than the smallest district in the state, meaning the total variance in district size was almost double the variance found in Missouri’s districts, which were overturned by the U.S. Supreme Court in the Kirkpatrick v. Preisler case. Population shifts that occur after the census are not considered when determining if districts were drawn with equal representation; and they are not a sign of any sort of gerrymandering or political intent.
There are lessons to take from this, however. Some-times populations shift dramatically over the course of 10 years; significant changes in districts are nec-essary to maintain compliance with equal population standards. The 2020 Census process will likely be no different; with current trends of declining populations in Detroit, Flint, and rural districts and increasing popula-tion in other centers. As a result, Michigan’s congres-sional districts will have to shift to stay close to ideal population levels. From period to period, even when a state does not gain or lose an additional seat in the U.S. Congress through reapportionment, change in district borders is inevitable.
Map 3Population Growth from 2010 to 2014
Source: American Community Survey one-year estimates.
Map 4 Population Growth from 2010 to 2016
Source: American Community Survey one-year estimates.

Lorem ipsum dolor sit amet, consectetur adipiscing elit. Maecenas ultrices mi velit, sit amet malesuada elit venenatis et.
Sed condimentum sodales justo, a molestie tortor mattis ut. Cras ornare rutrum lorem, a auctor sem hendrerit ac.
Quisque auctor eros eu dui pretium condimentum in in leo. Phasellus interdum tellus in elementum maximus. Quisque
ut condimentum nulla. Nunc lorem ligula, vehicula id pretium ut, gravida sit amet nunc.
Nam gravida turpis a nulla vehicula fringilla. Nam a luctus augue, nec ultrices est. Proin a feugiat massa, id vulputate
metus. Mauris id lacinia elit, et lobortis sem. Sed quis diam pulvinar, egestas urna at, mattis odio. Phasellus bibendum
nulla vitae maximus imperdiet. Vestibulum ac quam volutpat, commodo enim id, molestie tortor. Morbi dapibus dapibus
ornare. Pellentesque quis massa tellus. In interdum in lacus nec fermentum. Nullam ullamcorper euismod justo at
dictum. Phasellus aliquet ultrices dolor, vel tempor diam convallis quis. Vestibulum hendrerit dignissim enim nec
dapibus. Integer volutpat congue tincidunt. Vestibulum sed nunc leo.
Morbi sed sapien vitae urna pretium dignissim eu at sapien. Aliquam eu nisl volutpat, commodo mauris sed, pharetra
ante. Nulla lobortis lectus ac sem imperdiet, at fringilla ante commodo. Aliquam sed ullamcorper nisl. Nullam sollicitudin
dolor purus, nec cursus mauris mattis quis. Pellentesque consectetur tellus vel nisi elementum volutpat. Suspendisse
sed dolor sit amet libero tincidunt congue. In egestas libero neque, vel cursus dui blandit vel.
Quisque sit amet venenatis eros. Nulla vulputate pulvinar mauris. Vestibulum pulvinar erat varius sem vestibulum, at
tristique nisl dapibus. Morbi hendrerit nisi malesuada, feugiat justo vitae, sagittis orci. Nam quis laoreet quam, a
faucibus risus. Morbi egestas molestie odio quis elementum. Suspendisse iaculis nisi id risus vehicula convallis. Donec
tincidunt congue fringilla.
Aliquam erat volutpat. Sed imperdiet augue sit amet eros rhoncus egestas. Mauris mauris nunc, scelerisque eu dapibus
nec, hendrerit a dolor. Duis vel nisl porttitor, dictum nulla id, molestie lacus. Nulla vehicula placerat justo, vel semper
metus luctus sed. Cras blandit ultrices ipsum sed facilisis. Maecenas varius eros orci, sed mollis arcu finibus eu. Nullam
ut quam ut lorem rutrum cursus non sed massa. Nunc sed sollicitudin orci. Integer libero tellus, iaculis in orci ut, ornare
vehicula ante.
Quisque sit amet venenatis eros. Nulla vulputate pulvinar mauris. Vestibulum pulvinar erat varius sem vestibulum, at
tristique nisl dapibus. Morbi hendrerit nisi malesuada, feugiat justo vitae, sagittis orci. Nam quis laoreet quam, a
faucibus risus. Morbi egestas molestie odio quis elementum. Suspendisse iaculis nisi id risus vehicula convallis. Donec
tincidunt congue fringilla.
Maecenas varius eros orci, sed mollis arcu finibus eu. Nullam ut quam ut lorem rutrum cursus non sed massa. Nunc sed
sollicitudin orci. Integer libero tellus, iaculis in orci ut, ornare vehicula ante.
Official Research Paper
Lorem Ipsum Research Paper TitleLorem Ipsum Sub-Heading
115 West Allegan Suite 480 | Lansing, MI 48933 | crcmich.org pg. 1
12
Quantifying the Level of Gerrymandering in Michigan
or city borders, as much as possible. Most states (42) impose a political boundary requirement on state legislative districts, while 19 states require respecting political boundaries in drawing congressional districts. States may choose to maintain political boundaries for many reasons. Elections are run at the local level; split-ting city and township boundaries in creating a district makes it more burdensome to actually administer an election. In addition, people in a city or a township tend to share common interests with other people from the same city or township. Having one representative for the entirety of the municipality allows the representative to better address the local needs and allows for more accurate representation of the municipality.
On an even larger scale, many states set requirements for districts to not break county lines. While many of the benefits of maintaining city and township lines ap-plies to counties as well, strict county lines can make it difficult to maintain equal population across districts because of the larger populations within counties. To get the best of both worlds, many states that try to maintain county boundaries will allow a certain number of county breaks or only allow for breaks when neces-sary, but with a strong emphasis on maintaining county borders where possible.
Some instances exist where a city extends beyond the borders of a county (for example, while Lansing is primarily in Ingham County, portions of the city extend into Eaton County and Clinton County). This means conserving city and county lines can, in some instances, create contradictory requirements. Each state has its own provisions for how to handle this problem when creating districts.
ContiguityMost states require districts to be contiguous (where you can travel between any two points in the district, without leaving the district). Contiguity is the most
Since Thornburg, the U.S. Supreme Court has added some clarity to Section 2 protections. Specifically, the Court has identified the use of multi-member districts, and the practices of packing and cracking as ways in which district plans have violated the Voting Rights Act.
Section 5 of the Voting Rights Act also has an effect on redistricting. To prevent backsliding of Voting Rights Act improvements, Congress added Section 5, which requires certain states and political sub-divisions to receive preclearance on any and all changes to laws that alter voting eligibility or the process by which vot-ing occurs in the state, which includes the redistricting process.
In 2013, the U.S. Supreme Court ruled that the factors that had been used to determine whether a state or sub-division needed preclearance were too far out of date to be applied fairly.15 This kept the Section 5 restric-tions intact, but voided all criteria which would require a state or locality to undergo Section 5 preclearance.16
While Congress has the ability to set new criteria for automatic review, and some legislation has been pro-posed to do so, there are currently no laws in effect to establish criteria to trigger Section 5 preclearance. Currently, a court order is the only process that can force a locality to seek preclearance. Only three locali-ties are currently required by federal courts to require preclearance (Evergreen, AL; Charles Mix County, SD; and the Village of Port Chester, NY), though a handful of other locations are currently undergoing litigation that could result in new Section 5 preclear-ance requirements.
State-Level RequirementsIn addition to the two federal rules that all states must follow when drawing districts, each state has its own set of rules. Some are intended to preserve geographical features (either natural boundaries or political ones); others attempt to dictate ideal district shapes or at-tempt to keep certain communities within the same district. While not all states rely upon the same set of requirements, many states attend to one or more of these requirements as part of the redistricting process.
Political BoundariesOne of the most common state rules requires district maps to follow political boundaries, such as county
In addition to the two federal rules that all states must follow when drawing districts, each state has its own set of rules.

Lorem ipsum dolor sit amet, consectetur adipiscing elit. Maecenas ultrices mi velit, sit amet malesuada elit venenatis et.
Sed condimentum sodales justo, a molestie tortor mattis ut. Cras ornare rutrum lorem, a auctor sem hendrerit ac.
Quisque auctor eros eu dui pretium condimentum in in leo. Phasellus interdum tellus in elementum maximus. Quisque
ut condimentum nulla. Nunc lorem ligula, vehicula id pretium ut, gravida sit amet nunc.
Nam gravida turpis a nulla vehicula fringilla. Nam a luctus augue, nec ultrices est. Proin a feugiat massa, id vulputate
metus. Mauris id lacinia elit, et lobortis sem. Sed quis diam pulvinar, egestas urna at, mattis odio. Phasellus bibendum
nulla vitae maximus imperdiet. Vestibulum ac quam volutpat, commodo enim id, molestie tortor. Morbi dapibus dapibus
ornare. Pellentesque quis massa tellus. In interdum in lacus nec fermentum. Nullam ullamcorper euismod justo at
dictum. Phasellus aliquet ultrices dolor, vel tempor diam convallis quis. Vestibulum hendrerit dignissim enim nec
dapibus. Integer volutpat congue tincidunt. Vestibulum sed nunc leo.
Morbi sed sapien vitae urna pretium dignissim eu at sapien. Aliquam eu nisl volutpat, commodo mauris sed, pharetra
ante. Nulla lobortis lectus ac sem imperdiet, at fringilla ante commodo. Aliquam sed ullamcorper nisl. Nullam sollicitudin
dolor purus, nec cursus mauris mattis quis. Pellentesque consectetur tellus vel nisi elementum volutpat. Suspendisse
sed dolor sit amet libero tincidunt congue. In egestas libero neque, vel cursus dui blandit vel.
Quisque sit amet venenatis eros. Nulla vulputate pulvinar mauris. Vestibulum pulvinar erat varius sem vestibulum, at
tristique nisl dapibus. Morbi hendrerit nisi malesuada, feugiat justo vitae, sagittis orci. Nam quis laoreet quam, a
faucibus risus. Morbi egestas molestie odio quis elementum. Suspendisse iaculis nisi id risus vehicula convallis. Donec
tincidunt congue fringilla.
Aliquam erat volutpat. Sed imperdiet augue sit amet eros rhoncus egestas. Mauris mauris nunc, scelerisque eu dapibus
nec, hendrerit a dolor. Duis vel nisl porttitor, dictum nulla id, molestie lacus. Nulla vehicula placerat justo, vel semper
metus luctus sed. Cras blandit ultrices ipsum sed facilisis. Maecenas varius eros orci, sed mollis arcu finibus eu. Nullam
ut quam ut lorem rutrum cursus non sed massa. Nunc sed sollicitudin orci. Integer libero tellus, iaculis in orci ut, ornare
vehicula ante.
Quisque sit amet venenatis eros. Nulla vulputate pulvinar mauris. Vestibulum pulvinar erat varius sem vestibulum, at
tristique nisl dapibus. Morbi hendrerit nisi malesuada, feugiat justo vitae, sagittis orci. Nam quis laoreet quam, a
faucibus risus. Morbi egestas molestie odio quis elementum. Suspendisse iaculis nisi id risus vehicula convallis. Donec
tincidunt congue fringilla.
Maecenas varius eros orci, sed mollis arcu finibus eu. Nullam ut quam ut lorem rutrum cursus non sed massa. Nunc sed
sollicitudin orci. Integer libero tellus, iaculis in orci ut, ornare vehicula ante.
Official Research Paper
Lorem Ipsum Research Paper TitleLorem Ipsum Sub-Heading
115 West Allegan Suite 480 | Lansing, MI 48933 | crcmich.org pg. 1
13
Quantifying the Level of Gerrymandering in Michigan
common state redistricting requirement, with 23 states requiring congressional districts be contiguous and 49 states requiring contiguous districts for state legislative chambers.17 For the most part, maintaining contiguous districts helps keep larger communities together, as they are more likely to be facing similar issues.
Two somewhat common situations can bend the rules for what is a contiguous district. The first is water. Riv-ers and lakes can separate landmasses that might be culturally similar, forcing them to be in separate districts. In practice, any location split by a water boundary that is connected via a means of transport (like a bridge) is treated as contiguous. Additionally, islands are considered to be contiguous if they are in a district with the county that they are a part of.
Additionally, non-contiguous political boundaries can force map makers to decide between contiguity and respecting existing city and township boundaries. In some states, it is fairly common for cities to create non-contiguous boundaries when they annex areas. This can make it difficult to create contiguous districts, re-spect political boundaries, and keep a region’s popula-tion equal. Map 5 shows Wisconsin’s 61st state assem-bly district as constructed during the 2000s, where the city of Racine is included in its entirety despite having a large non-contiguous segment that would otherwise be in a separate district. In this instance, Wisconsin’s map makers decided it was more important to keep the city in one district, than to maintain a contiguous district. The 2010 maps reversed this, and the city is currently separated into multiple districts.
This example highlights one of the biggest challenges of the redistricting process: at some level, redistricting criteria will conflict. Because redistricting standards
can come into conflict, one of the challenges that can occur is deciding how to resolve when two different goals of the process are incompatible.
CompactnessAnother geographic limitation that many states include in their redistricting process is the standard of com-pactness. While 37 states have a compact district requirement for the legislature and 18 have similar requirements for congressional districts, what this ac-tually means varies across states, and generally can be interpreted broadly.
A compact district can be defined by the shape of its boundaries, relative geographical positions of populations, overall surface area of the district, or the district’s perimeter. But the criteria used can vary for a number of reasons, even within a single state. Part of the problem is that the common understandings of compact districts tend to conflict with Voting Rights Act, population, and city boundary limitations in ways that makes it difficult to tell when a district is not “compact” enough.
Compact district requirements are intended to keep similar populations together, as well as prevent ger-rymandering by keeping population centers with their region. This is part of the reason that compactness
Contiguity is the most common state redistricting requirement, with 23 states requiring congressional districts be contiguous and 49 states requiring contiguous districts for state legislative chambers.
Map 5 Wisconsin’s 61st Assembly District

Lorem ipsum dolor sit amet, consectetur adipiscing elit. Maecenas ultrices mi velit, sit amet malesuada elit venenatis et.
Sed condimentum sodales justo, a molestie tortor mattis ut. Cras ornare rutrum lorem, a auctor sem hendrerit ac.
Quisque auctor eros eu dui pretium condimentum in in leo. Phasellus interdum tellus in elementum maximus. Quisque
ut condimentum nulla. Nunc lorem ligula, vehicula id pretium ut, gravida sit amet nunc.
Nam gravida turpis a nulla vehicula fringilla. Nam a luctus augue, nec ultrices est. Proin a feugiat massa, id vulputate
metus. Mauris id lacinia elit, et lobortis sem. Sed quis diam pulvinar, egestas urna at, mattis odio. Phasellus bibendum
nulla vitae maximus imperdiet. Vestibulum ac quam volutpat, commodo enim id, molestie tortor. Morbi dapibus dapibus
ornare. Pellentesque quis massa tellus. In interdum in lacus nec fermentum. Nullam ullamcorper euismod justo at
dictum. Phasellus aliquet ultrices dolor, vel tempor diam convallis quis. Vestibulum hendrerit dignissim enim nec
dapibus. Integer volutpat congue tincidunt. Vestibulum sed nunc leo.
Morbi sed sapien vitae urna pretium dignissim eu at sapien. Aliquam eu nisl volutpat, commodo mauris sed, pharetra
ante. Nulla lobortis lectus ac sem imperdiet, at fringilla ante commodo. Aliquam sed ullamcorper nisl. Nullam sollicitudin
dolor purus, nec cursus mauris mattis quis. Pellentesque consectetur tellus vel nisi elementum volutpat. Suspendisse
sed dolor sit amet libero tincidunt congue. In egestas libero neque, vel cursus dui blandit vel.
Quisque sit amet venenatis eros. Nulla vulputate pulvinar mauris. Vestibulum pulvinar erat varius sem vestibulum, at
tristique nisl dapibus. Morbi hendrerit nisi malesuada, feugiat justo vitae, sagittis orci. Nam quis laoreet quam, a
faucibus risus. Morbi egestas molestie odio quis elementum. Suspendisse iaculis nisi id risus vehicula convallis. Donec
tincidunt congue fringilla.
Aliquam erat volutpat. Sed imperdiet augue sit amet eros rhoncus egestas. Mauris mauris nunc, scelerisque eu dapibus
nec, hendrerit a dolor. Duis vel nisl porttitor, dictum nulla id, molestie lacus. Nulla vehicula placerat justo, vel semper
metus luctus sed. Cras blandit ultrices ipsum sed facilisis. Maecenas varius eros orci, sed mollis arcu finibus eu. Nullam
ut quam ut lorem rutrum cursus non sed massa. Nunc sed sollicitudin orci. Integer libero tellus, iaculis in orci ut, ornare
vehicula ante.
Quisque sit amet venenatis eros. Nulla vulputate pulvinar mauris. Vestibulum pulvinar erat varius sem vestibulum, at
tristique nisl dapibus. Morbi hendrerit nisi malesuada, feugiat justo vitae, sagittis orci. Nam quis laoreet quam, a
faucibus risus. Morbi egestas molestie odio quis elementum. Suspendisse iaculis nisi id risus vehicula convallis. Donec
tincidunt congue fringilla.
Maecenas varius eros orci, sed mollis arcu finibus eu. Nullam ut quam ut lorem rutrum cursus non sed massa. Nunc sed
sollicitudin orci. Integer libero tellus, iaculis in orci ut, ornare vehicula ante.
Official Research Paper
Lorem Ipsum Research Paper TitleLorem Ipsum Sub-Heading
115 West Allegan Suite 480 | Lansing, MI 48933 | crcmich.org pg. 1
14
Quantifying the Level of Gerrymandering in Michigan
Mapping Software and Gerrymandering: A Double-Edged SwordFor centuries, redrawing electoral districts was an arduous and time-consuming process for legislatures. Be-fore Geographic Information System (GIS) software was developed (and even before computers), legislatures had to craft districts by hand. Map-makers had to decide which district each census block belonged to, and populations had to be calculated as the maps were drawn. The process took several weeks, as legislators had to figure out what groupings of residents would keep populations close to equal. When dealing with a statewide population in the millions, it was enough of an accomplishment to get districts that followed county boundaries to an extent and had relatively equal populations.
While gerrymandering in these times existed, calculating the electoral effect of a districting scheme took a sig-nificant amount of resources. Voting data had to be cross checked with each districts, numbers crunched, and it took significant effort to calculate what effects possible edits would have; even if they were relatively minor.
As computers have become more widespread, and GIS technology has developed, the redistricting process has become a lot faster. GIS mapping software allows anyone with a computer and software to design maps that meet federal population criteria in a fraction of the time it used to take. Census data, particularly popula-tion size, can be stored into maps at very small levels, allowing map-makers to instantly know the size of each district. These software can also process other data. With voting records available for small geographical areas, it is also possible to instantaneously know the likely partisan effects of a proposed district map.
It is easier than ever for a legislature to gerrymander, as the technology surrounding the process has advanced at a tremendous pace. Software to link spreadsheet data with GIS maps was not developed until the 1990s redistricting process, while the computing power to actually utilize that software has only been around the last two redistricting cycles.1 This means that the impact of any change on the map are known within seconds, rather than hours or days. While these advancements have made drawing maps simpler and has even made it more accessible to the public, they have also increased the risk of gerrymandering.
1 Brace, Kimball. “Technology and Redistricting: A Personal Prospective on the Use of Technology in Redistricting over the past Thirty Years.” The Brookings Institution. https://www.brookings.edu/wp-content/uploads/2012/04/crc_Brace.pdf.

Lorem ipsum dolor sit amet, consectetur adipiscing elit. Maecenas ultrices mi velit, sit amet malesuada elit venenatis et.
Sed condimentum sodales justo, a molestie tortor mattis ut. Cras ornare rutrum lorem, a auctor sem hendrerit ac.
Quisque auctor eros eu dui pretium condimentum in in leo. Phasellus interdum tellus in elementum maximus. Quisque
ut condimentum nulla. Nunc lorem ligula, vehicula id pretium ut, gravida sit amet nunc.
Nam gravida turpis a nulla vehicula fringilla. Nam a luctus augue, nec ultrices est. Proin a feugiat massa, id vulputate
metus. Mauris id lacinia elit, et lobortis sem. Sed quis diam pulvinar, egestas urna at, mattis odio. Phasellus bibendum
nulla vitae maximus imperdiet. Vestibulum ac quam volutpat, commodo enim id, molestie tortor. Morbi dapibus dapibus
ornare. Pellentesque quis massa tellus. In interdum in lacus nec fermentum. Nullam ullamcorper euismod justo at
dictum. Phasellus aliquet ultrices dolor, vel tempor diam convallis quis. Vestibulum hendrerit dignissim enim nec
dapibus. Integer volutpat congue tincidunt. Vestibulum sed nunc leo.
Morbi sed sapien vitae urna pretium dignissim eu at sapien. Aliquam eu nisl volutpat, commodo mauris sed, pharetra
ante. Nulla lobortis lectus ac sem imperdiet, at fringilla ante commodo. Aliquam sed ullamcorper nisl. Nullam sollicitudin
dolor purus, nec cursus mauris mattis quis. Pellentesque consectetur tellus vel nisi elementum volutpat. Suspendisse
sed dolor sit amet libero tincidunt congue. In egestas libero neque, vel cursus dui blandit vel.
Quisque sit amet venenatis eros. Nulla vulputate pulvinar mauris. Vestibulum pulvinar erat varius sem vestibulum, at
tristique nisl dapibus. Morbi hendrerit nisi malesuada, feugiat justo vitae, sagittis orci. Nam quis laoreet quam, a
faucibus risus. Morbi egestas molestie odio quis elementum. Suspendisse iaculis nisi id risus vehicula convallis. Donec
tincidunt congue fringilla.
Aliquam erat volutpat. Sed imperdiet augue sit amet eros rhoncus egestas. Mauris mauris nunc, scelerisque eu dapibus
nec, hendrerit a dolor. Duis vel nisl porttitor, dictum nulla id, molestie lacus. Nulla vehicula placerat justo, vel semper
metus luctus sed. Cras blandit ultrices ipsum sed facilisis. Maecenas varius eros orci, sed mollis arcu finibus eu. Nullam
ut quam ut lorem rutrum cursus non sed massa. Nunc sed sollicitudin orci. Integer libero tellus, iaculis in orci ut, ornare
vehicula ante.
Quisque sit amet venenatis eros. Nulla vulputate pulvinar mauris. Vestibulum pulvinar erat varius sem vestibulum, at
tristique nisl dapibus. Morbi hendrerit nisi malesuada, feugiat justo vitae, sagittis orci. Nam quis laoreet quam, a
faucibus risus. Morbi egestas molestie odio quis elementum. Suspendisse iaculis nisi id risus vehicula convallis. Donec
tincidunt congue fringilla.
Maecenas varius eros orci, sed mollis arcu finibus eu. Nullam ut quam ut lorem rutrum cursus non sed massa. Nunc sed
sollicitudin orci. Integer libero tellus, iaculis in orci ut, ornare vehicula ante.
Official Research Paper
Lorem Ipsum Research Paper TitleLorem Ipsum Sub-Heading
115 West Allegan Suite 480 | Lansing, MI 48933 | crcmich.org pg. 1
15
Quantifying the Level of Gerrymandering in Michigan
This can require the redistricting body to make tough decisions: Who decides when a community is large or cohesive enough to be a community of interest? What is the limit on the type of groups that can be included? Can political ideology be the basis of a ‘community of interest’? How can you determine the rank order of im-portance when district boundaries are inevitably forced to divide one or more of these communities? While the goals of maintaining the voting power of communities of interest is important, ensuring that those communities are well defined is important to achieving those goals.
Other RulesA few other rules have been used by some states, but
are not widely adopted. Arizo-na and Washington encourage competitive districts; while this is not a primary goal for either state, the idea is that increas-ing competition increases the quality of candidates and the accountability of legislators and congressional representa-tives. These standards have been loosely defined; there is no definition in either Wash-ington or Arizona’s laws that outlines when a district would be deemed competitive.
Some states have rules that govern how state legisla-ture maps are drawn. While multi-member districts are outlawed for Congress, some states elect to use multi-member districts. A few, like New Jersey, elect all mem-bers in their lower house from multi-member districts.
The Failures of Current CriteriaWhile these traditional redistricting criteria can limit, to some degree, state legislatures from drawing districts to their own advantage, in practice they have had little effect. In many instances, state requirements are not able to restrict gerrymandering at all. Even among the simple ‘fair’ example in Chart 1 (page 4), there could be an argument that the purple voters on the right side of the square were cracked in the districting process, or that those districts are not compact because the voters are further spread out from their fellow members of their district than they should be.
receives a lot of attention when it comes to claims of partisan and racial gerrymandering, as the shape and size of districts are among the few indicators you can point to when looking solely at a district map. But the wide variety of factors that determine when a district is “compact” and the number of competing requirements that can change the size and shapes of districts make it difficult to use “compactness” as a standard.
Communities of InterestOne criteria that has seen increased use in recent years is the preservation of communities of interest. Currently, 24 states require map makers to consider keeping together communities of interest for legisla-tive districts, while 13 do so for congressional districts. By directing those in charge of redistricting to keep similar population groups together and protect minority groups from be-ing split through the redistricting process, these provisions more accurately prescribe what many other provisions attempt to.
Typically, a community of inter-est will have some commonality among its people that requires attention from the legislative process, and maintaining the community in a legislative or congressional district provides an avenue for that population to address their particular concern. In most instances, these are groups that have a common religious, cultural, social, or economic linkage that are within a relatively compact area. These communities can include areas with high immigrant populations, the region immediately around a large university, or a rural area with a large number of family farms. As long as there is some legitimate policy interest to keep the group together, it can be considered a community of interest.
The large variety of groups that can be considered a community of interest has brought up concern about the vague nature of the term. While there is some ambiguity in determining what exactly a community of interest is, the majority of states use similar defini-tions. Colorado, for example, considers communities of interest as “ethnic, economic, cultural, demographic, trade area and geographic” groups.18
By directing those in charge of redistricting to keep similar population groups together and protect minority groups from being split..., community of interest provisions more ac-curately prescribe what many other provisions attempt to.

Lorem ipsum dolor sit amet, consectetur adipiscing elit. Maecenas ultrices mi velit, sit amet malesuada elit venenatis et.
Sed condimentum sodales justo, a molestie tortor mattis ut. Cras ornare rutrum lorem, a auctor sem hendrerit ac.
Quisque auctor eros eu dui pretium condimentum in in leo. Phasellus interdum tellus in elementum maximus. Quisque
ut condimentum nulla. Nunc lorem ligula, vehicula id pretium ut, gravida sit amet nunc.
Nam gravida turpis a nulla vehicula fringilla. Nam a luctus augue, nec ultrices est. Proin a feugiat massa, id vulputate
metus. Mauris id lacinia elit, et lobortis sem. Sed quis diam pulvinar, egestas urna at, mattis odio. Phasellus bibendum
nulla vitae maximus imperdiet. Vestibulum ac quam volutpat, commodo enim id, molestie tortor. Morbi dapibus dapibus
ornare. Pellentesque quis massa tellus. In interdum in lacus nec fermentum. Nullam ullamcorper euismod justo at
dictum. Phasellus aliquet ultrices dolor, vel tempor diam convallis quis. Vestibulum hendrerit dignissim enim nec
dapibus. Integer volutpat congue tincidunt. Vestibulum sed nunc leo.
Morbi sed sapien vitae urna pretium dignissim eu at sapien. Aliquam eu nisl volutpat, commodo mauris sed, pharetra
ante. Nulla lobortis lectus ac sem imperdiet, at fringilla ante commodo. Aliquam sed ullamcorper nisl. Nullam sollicitudin
dolor purus, nec cursus mauris mattis quis. Pellentesque consectetur tellus vel nisi elementum volutpat. Suspendisse
sed dolor sit amet libero tincidunt congue. In egestas libero neque, vel cursus dui blandit vel.
Quisque sit amet venenatis eros. Nulla vulputate pulvinar mauris. Vestibulum pulvinar erat varius sem vestibulum, at
tristique nisl dapibus. Morbi hendrerit nisi malesuada, feugiat justo vitae, sagittis orci. Nam quis laoreet quam, a
faucibus risus. Morbi egestas molestie odio quis elementum. Suspendisse iaculis nisi id risus vehicula convallis. Donec
tincidunt congue fringilla.
Aliquam erat volutpat. Sed imperdiet augue sit amet eros rhoncus egestas. Mauris mauris nunc, scelerisque eu dapibus
nec, hendrerit a dolor. Duis vel nisl porttitor, dictum nulla id, molestie lacus. Nulla vehicula placerat justo, vel semper
metus luctus sed. Cras blandit ultrices ipsum sed facilisis. Maecenas varius eros orci, sed mollis arcu finibus eu. Nullam
ut quam ut lorem rutrum cursus non sed massa. Nunc sed sollicitudin orci. Integer libero tellus, iaculis in orci ut, ornare
vehicula ante.
Quisque sit amet venenatis eros. Nulla vulputate pulvinar mauris. Vestibulum pulvinar erat varius sem vestibulum, at
tristique nisl dapibus. Morbi hendrerit nisi malesuada, feugiat justo vitae, sagittis orci. Nam quis laoreet quam, a
faucibus risus. Morbi egestas molestie odio quis elementum. Suspendisse iaculis nisi id risus vehicula convallis. Donec
tincidunt congue fringilla.
Maecenas varius eros orci, sed mollis arcu finibus eu. Nullam ut quam ut lorem rutrum cursus non sed massa. Nunc sed
sollicitudin orci. Integer libero tellus, iaculis in orci ut, ornare vehicula ante.
Official Research Paper
Lorem Ipsum Research Paper TitleLorem Ipsum Sub-Heading
115 West Allegan Suite 480 | Lansing, MI 48933 | crcmich.org pg. 1
16
Quantifying the Level of Gerrymandering in Michigan
Michigan’s Unconstitutional Constitutional Provisions Article IV, Section 6 of the 1963 Michigan Constitution creates the Commission on Legislative Apportionment and assigns to it the responsibility of drawing legislative districts. However, when the Commission repeatedly failed to reach agreement on redistricting plans – based on the 1960, 1970, and 1980 censuses – the Michigan Supreme Court assumed responsibility. In doing so in 1982, the Court took things a step further.
Article IV, Section 2 of the 1963 Michigan Constitution includes provisions to apportion legislative districts based on each county’s share of the state’s population and the state’s land area. However, in 1982 the Michigan Supreme Court opined that principle is unconstitutional based on the 1964 U.S. Supreme Court “one person, one vote” rul-ing.1 Because of the non-severability among Sections 2 through 6 of Article IV, the Court ruled that the redistricting provisions of all five sections became null and void with the “one person, one vote” ruling.2 The Court found that both standards and process are “inextricably intertwined” and the Commission cannot survive without redistricting rules.
As the decision left the state without any rules or guidelines for who was to draw the maps or how they were to be drawn, responsibility was turned over to the Michigan Legislature. The court stated that if an agreement was not reached responsibility would go to a special master. After the legislature deadlocked, the court developed a series of guidelines and appointed Bernard Apol special master to develop the state’s district maps. The guidelines that the court directed to be used became known as the Apol standards.3 The Apol standards include:
• Compact and contiguous districts;• A maximum variation of 16.4 percent in state legislative districts;• Maintaining county lines, except to limit population variance;• If a county line needed to be broken, only allow the fewest number of cities and townships to shift dis-
tricts;• If a county is entitled to multiple districts, city and township lines should not be broken except to keep
variance below 16.4 percent;• If the lines must be broken within a county, districts created should have equal populations;• If a city or township is entitled to more than one district, lines must be drawn to achieve maximum com-
pactness within a population range of 98-102 percent.
These standards were used by Bernard Apol to draw the 1980s maps, and the Supreme Court to draw the 1990s maps after the legislature failed to come to an agreement on maps. Prior to the redrawing of the maps after the 2000 census, the legislature passed Public Act (PA) 463 of 1996, the Redistricting Plans Act (covering state House and Senate districts), and PA 221 of 1999, the Congressional Redistricting Act, to codify the Apol standards for legislative and congressional redistricting respectively.
After the maps were drawn in 2001, a legal challenge was brought against the state’s congressional districts, al-leging they violated the Congressional Redistricting Act. The Michigan Supreme Court ultimately ruled that the Congressional Redistricting Act was non-binding as it was an act of statute, thus when the legislature passed PA 115 of 2001 (the law defining the state’s district boundaries), the law functionally overturned the Redistricting Plans Act and the Congressional Redistricting Act.4
As a result, the Redistricting Plans Act, the Congressional Redistricting Act, and any future statutory guidelines on the redistricting process could be altered by the legislature. This means that Michigan has no binding state laws governing redistricting in the state.
1 Reynolds v. Sims, 377 U.S. 533; 84 S. Ct. 1362; 12 L. Ed. 2d 506 (1964).2 413 Mich. 96; 321 NW 2d 565 (1982).3 Apol, Bernard. "Legislative Reapportionment in Michigan." December 16, 1987. annarborchronicle.com/wp-content/up-
loads/2011/02/Apol-history-of-Michigan-reapportionment.pdf.4 LeRoux v. Secretary of State, 640 N.W. 2d 849 (2002).

Lorem ipsum dolor sit amet, consectetur adipiscing elit. Maecenas ultrices mi velit, sit amet malesuada elit venenatis et.
Sed condimentum sodales justo, a molestie tortor mattis ut. Cras ornare rutrum lorem, a auctor sem hendrerit ac.
Quisque auctor eros eu dui pretium condimentum in in leo. Phasellus interdum tellus in elementum maximus. Quisque
ut condimentum nulla. Nunc lorem ligula, vehicula id pretium ut, gravida sit amet nunc.
Nam gravida turpis a nulla vehicula fringilla. Nam a luctus augue, nec ultrices est. Proin a feugiat massa, id vulputate
metus. Mauris id lacinia elit, et lobortis sem. Sed quis diam pulvinar, egestas urna at, mattis odio. Phasellus bibendum
nulla vitae maximus imperdiet. Vestibulum ac quam volutpat, commodo enim id, molestie tortor. Morbi dapibus dapibus
ornare. Pellentesque quis massa tellus. In interdum in lacus nec fermentum. Nullam ullamcorper euismod justo at
dictum. Phasellus aliquet ultrices dolor, vel tempor diam convallis quis. Vestibulum hendrerit dignissim enim nec
dapibus. Integer volutpat congue tincidunt. Vestibulum sed nunc leo.
Morbi sed sapien vitae urna pretium dignissim eu at sapien. Aliquam eu nisl volutpat, commodo mauris sed, pharetra
ante. Nulla lobortis lectus ac sem imperdiet, at fringilla ante commodo. Aliquam sed ullamcorper nisl. Nullam sollicitudin
dolor purus, nec cursus mauris mattis quis. Pellentesque consectetur tellus vel nisi elementum volutpat. Suspendisse
sed dolor sit amet libero tincidunt congue. In egestas libero neque, vel cursus dui blandit vel.
Quisque sit amet venenatis eros. Nulla vulputate pulvinar mauris. Vestibulum pulvinar erat varius sem vestibulum, at
tristique nisl dapibus. Morbi hendrerit nisi malesuada, feugiat justo vitae, sagittis orci. Nam quis laoreet quam, a
faucibus risus. Morbi egestas molestie odio quis elementum. Suspendisse iaculis nisi id risus vehicula convallis. Donec
tincidunt congue fringilla.
Aliquam erat volutpat. Sed imperdiet augue sit amet eros rhoncus egestas. Mauris mauris nunc, scelerisque eu dapibus
nec, hendrerit a dolor. Duis vel nisl porttitor, dictum nulla id, molestie lacus. Nulla vehicula placerat justo, vel semper
metus luctus sed. Cras blandit ultrices ipsum sed facilisis. Maecenas varius eros orci, sed mollis arcu finibus eu. Nullam
ut quam ut lorem rutrum cursus non sed massa. Nunc sed sollicitudin orci. Integer libero tellus, iaculis in orci ut, ornare
vehicula ante.
Quisque sit amet venenatis eros. Nulla vulputate pulvinar mauris. Vestibulum pulvinar erat varius sem vestibulum, at
tristique nisl dapibus. Morbi hendrerit nisi malesuada, feugiat justo vitae, sagittis orci. Nam quis laoreet quam, a
faucibus risus. Morbi egestas molestie odio quis elementum. Suspendisse iaculis nisi id risus vehicula convallis. Donec
tincidunt congue fringilla.
Maecenas varius eros orci, sed mollis arcu finibus eu. Nullam ut quam ut lorem rutrum cursus non sed massa. Nunc sed
sollicitudin orci. Integer libero tellus, iaculis in orci ut, ornare vehicula ante.
Official Research Paper
Lorem Ipsum Research Paper TitleLorem Ipsum Sub-Heading
115 West Allegan Suite 480 | Lansing, MI 48933 | crcmich.org pg. 1
17
Quantifying the Level of Gerrymandering in Michigan
These problems arise from an overly simplified ex-ample; in practice, things get even more difficult to evaluate. Most states are not simple shapes, and their populations are not distributed uniformly throughout. States’ populations are highly concentrated in some areas, and others have significantly lower population density. Wayne County, for example, is home to 18 percent of the Michigan population, despite being only one of 83 counties. As a result, districts cannot always be drawn in a smooth, consistent pattern. In some instances, one city might have several districts, while in another, several counties might have to be combined to form one district. There are legitimate reasons for districts to be more narrow and winding without it be-ing a gerrymander, while compact, geometric districts might be designed to give a party an advantage.
Without some clear, consistent definition of gerryman-dering, claims of gerrymandering can be made on what many would describe as reasonable maps, forcing the courts to be more involved than they would otherwise.
On the other hand, without court intervention, the options for refuting gerrymandered districts are quite limited. As U.S. Supreme Court Justice Anthony Ken-nedy said in his concurring opinion in Vieth v. Jubelirer (2004), “if courts refuse to entertain any claims of par-tisan gerrymandering, the temptation to use partisan favoritism in districting in an unconstitutional manner will grow.” States can adopt constitutional rules alter-ing the redistricting process through ballot initiatives, but outside of that there is little that can be done to overturn an entrenched partisan gerrymander.
Considerations with each different indicator demon-strates the existence of gerrymandering. While these indicators can be used on all maps, implementation of each requires some thought, as there are flaws
(and potential future gerrymandering concerns) with implementing each.
Oddly Shaped DistrictsMany people point to the shape of a specific district or a number of districts to indicate that a gerrymander has oc-curred. Districts with long, bending, squiggly borders are more likely to be considered gerrymandered because they tend not to follow political boundaries, and often invite questioning as to how the districts were conceived. This can be particularly effective anecdotal evidence, as it does not require any form of complex calculations or large datasets; everyone can judge for themselves whether a district looks like it was gerrymandered. While in many cases these borders can be a first indication of whether gerrymandering occurred, there are many different reasons why geometric shapes are not the best barometer for determining a gerrymandered map.
Federal districting requirements occasionally force bizarre looking districts. Communities of interest, especially those protected under the Voting Rights Act, do not always reside entirely within city or county lines; instead, they frequently spill across these lines. Voting Rights Act compliant districts can often give the impression that a gerrymander occurred if the reason-ing behind the district is unknown. The Illinois 4th Con-gressional District (see Map 6), sometimes referred to as the “earmuff” district, is commonly pointed to as one
There are legitimate reasons for districts to be more narrow and winding without it being a gerry-mander, while compact, geometric districts might be designed to give a party an advantage.
Map 6 Illinois 4th Congressional District
Lorem ipsum dolor sit amet, consectetur adipiscing elit. Maecenas ultrices mi velit, sit amet malesuada elit venenatis et.
Sed condimentum sodales justo, a molestie tortor mattis ut. Cras ornare rutrum lorem, a auctor sem hendrerit ac.
Quisque auctor eros eu dui pretium condimentum in in leo. Phasellus interdum tellus in elementum maximus. Quisque
ut condimentum nulla. Nunc lorem ligula, vehicula id pretium ut, gravida sit amet nunc.
Nam gravida turpis a nulla vehicula fringilla. Nam a luctus augue, nec ultrices est. Proin a feugiat massa, id vulputate
metus. Mauris id lacinia elit, et lobortis sem. Sed quis diam pulvinar, egestas urna at, mattis odio. Phasellus bibendum
nulla vitae maximus imperdiet. Vestibulum ac quam volutpat, commodo enim id, molestie tortor. Morbi dapibus dapibus
ornare. Pellentesque quis massa tellus. In interdum in lacus nec fermentum. Nullam ullamcorper euismod justo at
dictum. Phasellus aliquet ultrices dolor, vel tempor diam convallis quis. Vestibulum hendrerit dignissim enim nec
dapibus. Integer volutpat congue tincidunt. Vestibulum sed nunc leo.
Morbi sed sapien vitae urna pretium dignissim eu at sapien. Aliquam eu nisl volutpat, commodo mauris sed, pharetra
ante. Nulla lobortis lectus ac sem imperdiet, at fringilla ante commodo. Aliquam sed ullamcorper nisl. Nullam sollicitudin
dolor purus, nec cursus mauris mattis quis. Pellentesque consectetur tellus vel nisi elementum volutpat. Suspendisse
sed dolor sit amet libero tincidunt congue. In egestas libero neque, vel cursus dui blandit vel.
Quisque sit amet venenatis eros. Nulla vulputate pulvinar mauris. Vestibulum pulvinar erat varius sem vestibulum, at
tristique nisl dapibus. Morbi hendrerit nisi malesuada, feugiat justo vitae, sagittis orci. Nam quis laoreet quam, a
faucibus risus. Morbi egestas molestie odio quis elementum. Suspendisse iaculis nisi id risus vehicula convallis. Donec
tincidunt congue fringilla.
Aliquam erat volutpat. Sed imperdiet augue sit amet eros rhoncus egestas. Mauris mauris nunc, scelerisque eu dapibus
nec, hendrerit a dolor. Duis vel nisl porttitor, dictum nulla id, molestie lacus. Nulla vehicula placerat justo, vel semper
metus luctus sed. Cras blandit ultrices ipsum sed facilisis. Maecenas varius eros orci, sed mollis arcu finibus eu. Nullam
ut quam ut lorem rutrum cursus non sed massa. Nunc sed sollicitudin orci. Integer libero tellus, iaculis in orci ut, ornare
vehicula ante.
Quisque sit amet venenatis eros. Nulla vulputate pulvinar mauris. Vestibulum pulvinar erat varius sem vestibulum, at
tristique nisl dapibus. Morbi hendrerit nisi malesuada, feugiat justo vitae, sagittis orci. Nam quis laoreet quam, a
faucibus risus. Morbi egestas molestie odio quis elementum. Suspendisse iaculis nisi id risus vehicula convallis. Donec
tincidunt congue fringilla.
Maecenas varius eros orci, sed mollis arcu finibus eu. Nullam ut quam ut lorem rutrum cursus non sed massa. Nunc sed
sollicitudin orci. Integer libero tellus, iaculis in orci ut, ornare vehicula ante.
Official Research Paper
Lorem Ipsum Research Paper TitleLorem Ipsum Sub-Heading
115 West Allegan Suite 480 | Lansing, MI 48933 | crcmich.org pg. 1
18
Quantifying the Level of Gerrymandering in Michigan
However, many of the same issues with oddly drawn district borders apply to local government breaks; Vot-ing Rights Act and population requirements, in particu-lar, are difficult to fit into city and county lines. Many times, particularly in larger urban areas, municipal bor-ders and communities do not align perfectly, requiring lines that run from a city into neighboring townships.
Breaks in boundaries are also inevitable. City and county populations are not distributed evenly across the entire state, and districting guidelines can make some cities a “square peg” for a district that needs a “round hole.” If a city has more than a full district worth of citizens, like Detroit, the city must be broken up. Some amount of local boundary breaks is unavoidable. How those
breaks are decided becomes more important. Maps drawn with the same number of city and township breaks can look extremely different, and gerrymandered maps can even have fewer breaks than non-gerrymandered maps. Assuming any district lines that break some city boundaries are gerrymandered can lead to false posi-tives and miss several actual gerrymanders.
A New Approach The traditional redistricting requirements have not aged particularly well, at least in terms of their ability to guard against gerrymandering. While they might seem intuitive and do provide some level of protection from gerrymandering, those requirements historically did very little to outright prevent it. In the current context, when the rise in computer-based mapping software, combined with past election results give map mak-ers immediate knowledge of how the maps will affect electoral outcomes, many states have found a need to impose new methods to counter gerrymandering, while maintaining fidelity to federal Voting Rights Act requirements.
of the most obvious examples of gerrymandering in the country because of its odd shape. However, the district was drawn to preserve a Latino majority district that wraps around a majority black region.19 Maintaining a compact, standard looking district, in this instance, would create a Voting Rights Act compliance concern. Irregular shaped districts can occur very frequently, making it difficult to determine if a district was drawn to pack minority voters or to protect a minority district.
Many other factors can lead to the drawing of bizarre district boundaries. City borders, unlike county bor-ders, usually have erratic boundaries that are not smooth or compact. This is because cities often annex new land as they grow in order to provide citizens with public services. In such instances, maintaining political boundaries can lead to districts that do not resemble normal shapes. And cities with large populations, particularly those large enough to cover the majority of a district (or even several districts) can lead to district shapes that are non-geometric.
On the other hand, it is not always sufficient to say that district maps are drawn fairly because they look clean. With the advancements in map-drawing software over the last few decades, it has become easier to draw maps that can meet multiple goals. Algorithms can be programmed to attend to state guidelines such as creating compact districts, making it difficult to detect a gerrymander by looking at the shape of maps. This was shown when Pennsylvania’s legislature was required to redraw its congressional maps after the Supreme Court of Pennsylvania found that the state’s congressional districts were not compact enough to meet state constitutional standards. The legislature submitted revised maps with an identical partisan advantage, but emphasized the compactness of the districts, leaving a map that did not look gerrymandered but preserved a large partisan advantage.20
Local Government Boundary BreaksSimilar to the presence of oddly shaped districts, more frequent breaks of political boundaries are typically used as a metric to indicate gerrymandering. Because cities tend to be distinct from surrounding rural areas, and voters are more likely to share views with others in their county than voters in other counties, splits in cities and counties can be an indication that gerrymandering has occurred.
With the advancements in map-drawing software, it has become easier to draw maps that can meet multiple goals such as creating compact districts and maintaining partisan advantage.

Lorem ipsum dolor sit amet, consectetur adipiscing elit. Maecenas ultrices mi velit, sit amet malesuada elit venenatis et.
Sed condimentum sodales justo, a molestie tortor mattis ut. Cras ornare rutrum lorem, a auctor sem hendrerit ac.
Quisque auctor eros eu dui pretium condimentum in in leo. Phasellus interdum tellus in elementum maximus. Quisque
ut condimentum nulla. Nunc lorem ligula, vehicula id pretium ut, gravida sit amet nunc.
Nam gravida turpis a nulla vehicula fringilla. Nam a luctus augue, nec ultrices est. Proin a feugiat massa, id vulputate
metus. Mauris id lacinia elit, et lobortis sem. Sed quis diam pulvinar, egestas urna at, mattis odio. Phasellus bibendum
nulla vitae maximus imperdiet. Vestibulum ac quam volutpat, commodo enim id, molestie tortor. Morbi dapibus dapibus
ornare. Pellentesque quis massa tellus. In interdum in lacus nec fermentum. Nullam ullamcorper euismod justo at
dictum. Phasellus aliquet ultrices dolor, vel tempor diam convallis quis. Vestibulum hendrerit dignissim enim nec
dapibus. Integer volutpat congue tincidunt. Vestibulum sed nunc leo.
Morbi sed sapien vitae urna pretium dignissim eu at sapien. Aliquam eu nisl volutpat, commodo mauris sed, pharetra
ante. Nulla lobortis lectus ac sem imperdiet, at fringilla ante commodo. Aliquam sed ullamcorper nisl. Nullam sollicitudin
dolor purus, nec cursus mauris mattis quis. Pellentesque consectetur tellus vel nisi elementum volutpat. Suspendisse
sed dolor sit amet libero tincidunt congue. In egestas libero neque, vel cursus dui blandit vel.
Quisque sit amet venenatis eros. Nulla vulputate pulvinar mauris. Vestibulum pulvinar erat varius sem vestibulum, at
tristique nisl dapibus. Morbi hendrerit nisi malesuada, feugiat justo vitae, sagittis orci. Nam quis laoreet quam, a
faucibus risus. Morbi egestas molestie odio quis elementum. Suspendisse iaculis nisi id risus vehicula convallis. Donec
tincidunt congue fringilla.
Aliquam erat volutpat. Sed imperdiet augue sit amet eros rhoncus egestas. Mauris mauris nunc, scelerisque eu dapibus
nec, hendrerit a dolor. Duis vel nisl porttitor, dictum nulla id, molestie lacus. Nulla vehicula placerat justo, vel semper
metus luctus sed. Cras blandit ultrices ipsum sed facilisis. Maecenas varius eros orci, sed mollis arcu finibus eu. Nullam
ut quam ut lorem rutrum cursus non sed massa. Nunc sed sollicitudin orci. Integer libero tellus, iaculis in orci ut, ornare
vehicula ante.
Quisque sit amet venenatis eros. Nulla vulputate pulvinar mauris. Vestibulum pulvinar erat varius sem vestibulum, at
tristique nisl dapibus. Morbi hendrerit nisi malesuada, feugiat justo vitae, sagittis orci. Nam quis laoreet quam, a
faucibus risus. Morbi egestas molestie odio quis elementum. Suspendisse iaculis nisi id risus vehicula convallis. Donec
tincidunt congue fringilla.
Maecenas varius eros orci, sed mollis arcu finibus eu. Nullam ut quam ut lorem rutrum cursus non sed massa. Nunc sed
sollicitudin orci. Integer libero tellus, iaculis in orci ut, ornare vehicula ante.
Official Research Paper
Lorem Ipsum Research Paper TitleLorem Ipsum Sub-Heading
115 West Allegan Suite 480 | Lansing, MI 48933 | crcmich.org pg. 1
19
Quantifying the Level of Gerrymandering in Michigan
Since 1986, the U.S. Supreme Court has consistently ruled that gerrymandering is a justiciable issue, or a question which a court can exercise its legal authority to resolve. Despite agreeing to the legal status of ger-rymandering, the Court has been hesitant to rule against state-drawn maps. A U.S. Supreme Court challenge has never been successful at overturning a map. In the two primary cases to reach the Court, the justices ultimately ruled that there was not a measure that the Court was willing to stake a decision on. The U.S. Supreme Court tried two additional gerrymandering cases this term; both offered new standards to consider when evaluating a partisan gerrymander.
Establishing a Justiciable Standard: Rejected Methods and Future Possibilities
Prior to 1986, the Supreme Court had maintained distance between itself and partisan gerrymandering claims. While racial gerrymandering claims had led to several maps being overturned, partisan gerrymander-ing claims had not been tried in the courts.
The 1981 redistricting process in Indiana created controversy, as the Republican legislature created a district plan that used multi-member districts to limit the voting power of Democrats in those districts. Democrats brought a case to the federal District Court, Davis v. Bandemer (1986), arguing that the map was politically gerrymandered to disadvantage Democratic candidates, violating the voters’ rights under the Equal Protection Clause.
The U.S. District Court ruled that the district maps were an unconstitutional partisan gerrymander. However, upon challenge in the U.S. Supreme Court, that deci-sion was overturned. Despite the maps being upheld, the majority of justices agreed that gerrymandering claims were justiciable. The problem was that, in this instance, appellees had failed to provide sufficient proof that an unconstitutional partisan gerrymander had occurred.21
This decision set the stage for how courts could resolve partisan gerrymanders. Because the Court in Davis ruled that courts could resolve partisan gerrymandering claims, several cases have been brought to the courts
to find a standard that was deemed acceptable. This decision created a search for the proverbial holy grail of redistricting: finding a standard that the Supreme Court would approve of that could evaluate partisan gerrymandering. Most cases have failed to pass even the district courts. Only a handful of cases have actu-ally been evaluated at the U.S. Supreme Court.
Vieth v. Jubelirer: The Problems with ProportionalityIt took nearly two decades after the U.S. Supreme Court’s Davis opinion for a new test case on partisan gerrymandering to reach the Court. Pennsylvania’s 2001 Congressional redistricting scheme created a controversy that led to the first attempt to create a court standard. The Court chose to hear Vieth v. Jubelirer (2004) after it was dismissed by the U.S. District Court. The lower Court ruled that the plaintiffs had failed to provide a discernable standard to adjudicate claims of gerrymandering.22
The plaintiffs provided two tests to demonstrate that gerrymandering occurred with Pennsylvania’s maps. The first was a simple majority-majority test. This test relies on election outcomes to determine whether the party that receives a majority of votes should re-ceive a majority of seats. The Court rejected this test because non-gerrymandered maps could reasonably lead to this result.
Since 1986, the U.S. Supreme Court has consistently ruled that gerrymandering is a justiciable is-sue. A justiciable issue is one over which a court can exercise its legal authority to resolve.

Lorem ipsum dolor sit amet, consectetur adipiscing elit. Maecenas ultrices mi velit, sit amet malesuada elit venenatis et.
Sed condimentum sodales justo, a molestie tortor mattis ut. Cras ornare rutrum lorem, a auctor sem hendrerit ac.
Quisque auctor eros eu dui pretium condimentum in in leo. Phasellus interdum tellus in elementum maximus. Quisque
ut condimentum nulla. Nunc lorem ligula, vehicula id pretium ut, gravida sit amet nunc.
Nam gravida turpis a nulla vehicula fringilla. Nam a luctus augue, nec ultrices est. Proin a feugiat massa, id vulputate
metus. Mauris id lacinia elit, et lobortis sem. Sed quis diam pulvinar, egestas urna at, mattis odio. Phasellus bibendum
nulla vitae maximus imperdiet. Vestibulum ac quam volutpat, commodo enim id, molestie tortor. Morbi dapibus dapibus
ornare. Pellentesque quis massa tellus. In interdum in lacus nec fermentum. Nullam ullamcorper euismod justo at
dictum. Phasellus aliquet ultrices dolor, vel tempor diam convallis quis. Vestibulum hendrerit dignissim enim nec
dapibus. Integer volutpat congue tincidunt. Vestibulum sed nunc leo.
Morbi sed sapien vitae urna pretium dignissim eu at sapien. Aliquam eu nisl volutpat, commodo mauris sed, pharetra
ante. Nulla lobortis lectus ac sem imperdiet, at fringilla ante commodo. Aliquam sed ullamcorper nisl. Nullam sollicitudin
dolor purus, nec cursus mauris mattis quis. Pellentesque consectetur tellus vel nisi elementum volutpat. Suspendisse
sed dolor sit amet libero tincidunt congue. In egestas libero neque, vel cursus dui blandit vel.
Quisque sit amet venenatis eros. Nulla vulputate pulvinar mauris. Vestibulum pulvinar erat varius sem vestibulum, at
tristique nisl dapibus. Morbi hendrerit nisi malesuada, feugiat justo vitae, sagittis orci. Nam quis laoreet quam, a
faucibus risus. Morbi egestas molestie odio quis elementum. Suspendisse iaculis nisi id risus vehicula convallis. Donec
tincidunt congue fringilla.
Aliquam erat volutpat. Sed imperdiet augue sit amet eros rhoncus egestas. Mauris mauris nunc, scelerisque eu dapibus
nec, hendrerit a dolor. Duis vel nisl porttitor, dictum nulla id, molestie lacus. Nulla vehicula placerat justo, vel semper
metus luctus sed. Cras blandit ultrices ipsum sed facilisis. Maecenas varius eros orci, sed mollis arcu finibus eu. Nullam
ut quam ut lorem rutrum cursus non sed massa. Nunc sed sollicitudin orci. Integer libero tellus, iaculis in orci ut, ornare
vehicula ante.
Quisque sit amet venenatis eros. Nulla vulputate pulvinar mauris. Vestibulum pulvinar erat varius sem vestibulum, at
tristique nisl dapibus. Morbi hendrerit nisi malesuada, feugiat justo vitae, sagittis orci. Nam quis laoreet quam, a
faucibus risus. Morbi egestas molestie odio quis elementum. Suspendisse iaculis nisi id risus vehicula convallis. Donec
tincidunt congue fringilla.
Maecenas varius eros orci, sed mollis arcu finibus eu. Nullam ut quam ut lorem rutrum cursus non sed massa. Nunc sed
sollicitudin orci. Integer libero tellus, iaculis in orci ut, ornare vehicula ante.
Official Research Paper
Lorem Ipsum Research Paper TitleLorem Ipsum Sub-Heading
115 West Allegan Suite 480 | Lansing, MI 48933 | crcmich.org pg. 1
20
Quantifying the Level of Gerrymandering in Michigan
reasonable outcome, as it means the legislature and congressional delegation would closely resemble the overall makeup of the state’s population
The Court determined that this standard suffers the same sort of problems that a majority-majority standard does. One major issue is that, because of the natural sorting of populations (e.g., Democrats are more likely to settle in cities, Republicans in rural areas) it is fairly rare that populations are distributed evenly enough across a state that representatives are elected exactly proportionately based on their districts.
Proportional outcomes are also not statistically likely as larger statewide advantages are gained. As one party increases its vote share in a state, it becomes more difficult to distribute populations in a way that guar-
antees representation for the minority party; if only ten percent of a state is for a minority party, proportional rep-resentation becomes virtually impossible; the voters would likely be spread across the state, making it impossible to draw a map with a majority. Additionally,
differences between candidates and the presence of independent voters make it difficult to determine the proportion of a state that votes for a party regularly, or if certain candidates were weak (or even nonexistent, in the case of uncontested elections) resulting in a temporary vote switch.
Symmetry and LULACIn the U.S. Supreme Court’s rejection of the majority-majority and proportionality standards, Justice Ken-nedy outlined his problems with the measures, and pro-vided guidance for the development of a new measure to evaluate partisan gerrymandering. Justice Kennedy argued that a “model of fair and effective representa-tion” was needed for the Court to intervene. He further argued that without a “clear, manageable and politically neutral standard” to evaluate the constitutional harm of gerrymandering, the Court would leave lower courts to make inconsistent rulings and run the risk of the overreaching or not intervening at all.
While it seems logical that which-ever party receives the most votes should receive the most seats, circumstances may make this unreasonable to enforce in practice.
While it seems logical that whichever party receives the most votes should receive the most seats, circum-stances may make this unreasonable to enforce in practice. Part of this is due to random chance; while it is not particularly likely that a party receiving a minor-ity of the votes wins a majority of seats, it can happen without a partisan gerrymander. In a state with several competitive districts, even a small change in a handful of districts can change the party that controls a majority without changing the overall vote drastically. Addition-ally, just because a party has a majority of votes in one election does not mean that it has a sustainable major-ity. Particularly in a state like Michigan where statewide races are typically within a few percentage points, the sum of votes in every district does not demonstrate that one party has a majority.
The issues the Supreme Court had with the majority-majority test were compounded by the inability of the court to pigeon-hole specific voters. Unlike the Court’s ability to assess racial gerrymandering through widely available demo-graphic data, trying to identify a region’s political makeup based on widely available data is virtually impossible. As stated in the ma-jority opinion of Vieth, “a person’s politics is rarely as readily discernible – and never as permanently discernable – as a person’s race.”23 The court was unwilling to identify voters party affiliation based on voting records because political considerations change; the existence of moderate and independent vot-ers, and the differences between individual candidates across districts all can factor in to a minority party win-ning a majority of seats. Individual candidates can shift a voter’s preferences temporarily, or a more permanent shift can occur, but it is difficult to distinguish between these without several years of data.
The second standard the Supreme Court considered was proportionality, or the idea that the distribution of seats should closely resemble the distribution of votes statewide. This standard was proposed as a means of trying to keep representation resembling the votes actually cast; the theory goes that if 60 percent of the statewide vote was cast for a party, they should have roughly 60 percent of the seats. This seems like a

Lorem ipsum dolor sit amet, consectetur adipiscing elit. Maecenas ultrices mi velit, sit amet malesuada elit venenatis et.
Sed condimentum sodales justo, a molestie tortor mattis ut. Cras ornare rutrum lorem, a auctor sem hendrerit ac.
Quisque auctor eros eu dui pretium condimentum in in leo. Phasellus interdum tellus in elementum maximus. Quisque
ut condimentum nulla. Nunc lorem ligula, vehicula id pretium ut, gravida sit amet nunc.
Nam gravida turpis a nulla vehicula fringilla. Nam a luctus augue, nec ultrices est. Proin a feugiat massa, id vulputate
metus. Mauris id lacinia elit, et lobortis sem. Sed quis diam pulvinar, egestas urna at, mattis odio. Phasellus bibendum
nulla vitae maximus imperdiet. Vestibulum ac quam volutpat, commodo enim id, molestie tortor. Morbi dapibus dapibus
ornare. Pellentesque quis massa tellus. In interdum in lacus nec fermentum. Nullam ullamcorper euismod justo at
dictum. Phasellus aliquet ultrices dolor, vel tempor diam convallis quis. Vestibulum hendrerit dignissim enim nec
dapibus. Integer volutpat congue tincidunt. Vestibulum sed nunc leo.
Morbi sed sapien vitae urna pretium dignissim eu at sapien. Aliquam eu nisl volutpat, commodo mauris sed, pharetra
ante. Nulla lobortis lectus ac sem imperdiet, at fringilla ante commodo. Aliquam sed ullamcorper nisl. Nullam sollicitudin
dolor purus, nec cursus mauris mattis quis. Pellentesque consectetur tellus vel nisi elementum volutpat. Suspendisse
sed dolor sit amet libero tincidunt congue. In egestas libero neque, vel cursus dui blandit vel.
Quisque sit amet venenatis eros. Nulla vulputate pulvinar mauris. Vestibulum pulvinar erat varius sem vestibulum, at
tristique nisl dapibus. Morbi hendrerit nisi malesuada, feugiat justo vitae, sagittis orci. Nam quis laoreet quam, a
faucibus risus. Morbi egestas molestie odio quis elementum. Suspendisse iaculis nisi id risus vehicula convallis. Donec
tincidunt congue fringilla.
Aliquam erat volutpat. Sed imperdiet augue sit amet eros rhoncus egestas. Mauris mauris nunc, scelerisque eu dapibus
nec, hendrerit a dolor. Duis vel nisl porttitor, dictum nulla id, molestie lacus. Nulla vehicula placerat justo, vel semper
metus luctus sed. Cras blandit ultrices ipsum sed facilisis. Maecenas varius eros orci, sed mollis arcu finibus eu. Nullam
ut quam ut lorem rutrum cursus non sed massa. Nunc sed sollicitudin orci. Integer libero tellus, iaculis in orci ut, ornare
vehicula ante.
Quisque sit amet venenatis eros. Nulla vulputate pulvinar mauris. Vestibulum pulvinar erat varius sem vestibulum, at
tristique nisl dapibus. Morbi hendrerit nisi malesuada, feugiat justo vitae, sagittis orci. Nam quis laoreet quam, a
faucibus risus. Morbi egestas molestie odio quis elementum. Suspendisse iaculis nisi id risus vehicula convallis. Donec
tincidunt congue fringilla.
Maecenas varius eros orci, sed mollis arcu finibus eu. Nullam ut quam ut lorem rutrum cursus non sed massa. Nunc sed
sollicitudin orci. Integer libero tellus, iaculis in orci ut, ornare vehicula ante.
Official Research Paper
Lorem Ipsum Research Paper TitleLorem Ipsum Sub-Heading
115 West Allegan Suite 480 | Lansing, MI 48933 | crcmich.org pg. 1
21
Quantifying the Level of Gerrymandering in Michigan
Because four justices argued that the plaintiffs’ case in Vieth was sufficient to overturn Pennsylvania’s maps, Justice Kennedy’s decision has been considered a blueprint to develop a case to overturn gerrymandered maps in the U.S. Supreme Court. Several social sci-entists have focused on creating a metric that was able to overcome the flaws of a proportional standard, while effectively identifying gerrymanders. The first attempt to sway Justice Kennedy occurred in League of United Latin American Citizens (LULAC) v. Perry.
LULAC focused on questions relating to both racial and partisan gerrymandering. The Texas Legislature passed a redistricting plan in 2003 modifying congres-sional maps drawn by a federal judge. The maps were claimed to have been drawn to reduce the influence of minority groups and create a sustainable partisan advantage.
The Supreme Court ruled that some of the state’s dis-tricts violated the Voting Rights Act, but the plaintiffs (like those involved in the Davis and Vieth decisions) failed to provide a justiciable standard to evaluate partisan gerrymandering. In the opinions issued on LULAC, many justices discussed the question of sym-metry, which was posited by an amicus brief submitted by Gary King, director of the Institute for Quantitative Social Science at Harvard University.24 The partisan symmetry standard posits that, rather than proportion-al political results, political parties should experience the same outcome when the same vote totals occur.
This standard attempts to build on the flaws the Su-preme Court had with proportionality as a test for ger-rymandering; rather than expecting a party to achieve representation equal to the population total, the sym-metry standard just requires that if the opposite party received the same vote total as the winning party, that it would have the opportunity to win the same number of seats. Represented graphically, symmetry creates an “S-curve”, where the percentage of the two-party share of votes is presented on one axis and the share of the seats won is presented on the other axis (see Chart 4).
In a symmetric S-curve, each point on the line of out-comes has an equal but opposite result, meaning that if the outcome of the percentage of votes were to flip, the division of seats would flip as well (this is shown with the blue line in Chart 4). The slope of an S-curve will vary by state, some are steeper (smaller increases in
total votes result in more seats), while some are flatter (smaller changes in total votes have minimal effect on the total number of seats). However, in each state, the outcome should be symmetric across a 50-50 split.
When election results deviate from a symmetric S-curve, it indicates partisan bias. These shifts can show that one party has to earn significantly more votes to achieve the same political outcome as the other, which would show a biased S-curve (the tan line represents the S-curve of a disadvantaged party). This would show that, while parties convert votes to seats at similar rates, they are not advantaged equally as one party
wins more seats than the other party would with the same vote share. Even though the tan line maintains the same shape as the blue line, one party has a clear advantage under the tan line. This is typical of areas that have natural geographic advantages for one party and gerrymandered maps.
Unlike the proportionality standard, which focuses solely on the outcome of an election, partisan symmetry focuses on the opportunity voters from a party had to elect candidates of their choosing. By looking at what would have happened under an identical but opposite election result, partisan symmetry tests focus on the constitutional right afforded to citizens through voting; they are not guaranteed a specific outcome, but are guaranteed the right to attempt to elect a candidate of their choosing.
Chart 4 Typical S-Curves for Assessing District Proportionality

Lorem ipsum dolor sit amet, consectetur adipiscing elit. Maecenas ultrices mi velit, sit amet malesuada elit venenatis et.
Sed condimentum sodales justo, a molestie tortor mattis ut. Cras ornare rutrum lorem, a auctor sem hendrerit ac.
Quisque auctor eros eu dui pretium condimentum in in leo. Phasellus interdum tellus in elementum maximus. Quisque
ut condimentum nulla. Nunc lorem ligula, vehicula id pretium ut, gravida sit amet nunc.
Nam gravida turpis a nulla vehicula fringilla. Nam a luctus augue, nec ultrices est. Proin a feugiat massa, id vulputate
metus. Mauris id lacinia elit, et lobortis sem. Sed quis diam pulvinar, egestas urna at, mattis odio. Phasellus bibendum
nulla vitae maximus imperdiet. Vestibulum ac quam volutpat, commodo enim id, molestie tortor. Morbi dapibus dapibus
ornare. Pellentesque quis massa tellus. In interdum in lacus nec fermentum. Nullam ullamcorper euismod justo at
dictum. Phasellus aliquet ultrices dolor, vel tempor diam convallis quis. Vestibulum hendrerit dignissim enim nec
dapibus. Integer volutpat congue tincidunt. Vestibulum sed nunc leo.
Morbi sed sapien vitae urna pretium dignissim eu at sapien. Aliquam eu nisl volutpat, commodo mauris sed, pharetra
ante. Nulla lobortis lectus ac sem imperdiet, at fringilla ante commodo. Aliquam sed ullamcorper nisl. Nullam sollicitudin
dolor purus, nec cursus mauris mattis quis. Pellentesque consectetur tellus vel nisi elementum volutpat. Suspendisse
sed dolor sit amet libero tincidunt congue. In egestas libero neque, vel cursus dui blandit vel.
Quisque sit amet venenatis eros. Nulla vulputate pulvinar mauris. Vestibulum pulvinar erat varius sem vestibulum, at
tristique nisl dapibus. Morbi hendrerit nisi malesuada, feugiat justo vitae, sagittis orci. Nam quis laoreet quam, a
faucibus risus. Morbi egestas molestie odio quis elementum. Suspendisse iaculis nisi id risus vehicula convallis. Donec
tincidunt congue fringilla.
Aliquam erat volutpat. Sed imperdiet augue sit amet eros rhoncus egestas. Mauris mauris nunc, scelerisque eu dapibus
nec, hendrerit a dolor. Duis vel nisl porttitor, dictum nulla id, molestie lacus. Nulla vehicula placerat justo, vel semper
metus luctus sed. Cras blandit ultrices ipsum sed facilisis. Maecenas varius eros orci, sed mollis arcu finibus eu. Nullam
ut quam ut lorem rutrum cursus non sed massa. Nunc sed sollicitudin orci. Integer libero tellus, iaculis in orci ut, ornare
vehicula ante.
Quisque sit amet venenatis eros. Nulla vulputate pulvinar mauris. Vestibulum pulvinar erat varius sem vestibulum, at
tristique nisl dapibus. Morbi hendrerit nisi malesuada, feugiat justo vitae, sagittis orci. Nam quis laoreet quam, a
faucibus risus. Morbi egestas molestie odio quis elementum. Suspendisse iaculis nisi id risus vehicula convallis. Donec
tincidunt congue fringilla.
Maecenas varius eros orci, sed mollis arcu finibus eu. Nullam ut quam ut lorem rutrum cursus non sed massa. Nunc sed
sollicitudin orci. Integer libero tellus, iaculis in orci ut, ornare vehicula ante.
Official Research Paper
Lorem Ipsum Research Paper TitleLorem Ipsum Sub-Heading
115 West Allegan Suite 480 | Lansing, MI 48933 | crcmich.org pg. 1
22
Quantifying the Level of Gerrymandering in Michigan
LULAC and Mid-Decade Redistricting: Concerns for GerrymanderingWhile states are required to update their district maps every decade, nothing in the Constitution, or federal law, prevents states from updating them more frequently. After Davis and Vieth, the Supreme Court heard an additional case on whether Texas’ district maps was an illegal partisan and racial gerrymander in League of United Latin American Citizens (LULAC) v. Perry. One of the questions unique to this case was whether states were allowed to redistrict between censuses. In 2003, Republicans in the state gained unified control of the state legislature, and set out a plan to change maps drawn by the Legislative Redistricting Board and state courts after the legislature failed to pass maps in 2001.
In LULAC, the court ultimately upheld the majority of Texas’ districts. In their ruling, the court was explicit in stating that there were no federal prohibitions on mid-decade redistricting. As with most of redistricting law, this leaves the question of mid-decade redistricting up to each state.1
While many states contain language that ties state redistricting processes to the census cycle, few state constitutions explicitly prohibit mid-decade redistricting for state and congressional districts. Only six state constitutions (Alaska, Arizona, California, Colorado, Connecticut, and New Jersey) explicitly forbid mid-decade redistricting for state legislative and congressional districts. In addition, Delaware has statutory restrictions that would prevent mid-decade redistricting, and 14 states have explicit rules preventing state legislative redistricting mid-decade.2
One of the biggest challenges facing gerrymanders is the instability of gerrymandered maps. To effectively create a majority, the party in control typically has to create slim margins in a significant number of districts. Populations inevitably change over the course of the decade; they can erode a gerrymander, and even cause a sweeping reversal of their effects. This serves as one of the few natural checks on gerrymandering.
Mid-decade redistricting, then, is an erosion of this natural check. With the significant increase in the avail-ability of voter data and the technology to generate partisan maps, mid-decade redistricting has the potential to be easier and more accurate than before. If legislatures decide to re-draw maps more frequently, and maintain control of the governor’s office, they can create a sustainable gerrymander.
In addition to the gerrymandering concerns, mid-decade redistricting has a host of logistical and represen-tational concerns. Changing districts create a significant process burden on election officials, as citizens districts would change much more frequently and voting locations might switch which district they are in with each change. Additionally, citizens who are moved from one district to another might find themselves without effective representation, as their new district might not be represented by their current representative, leading to a situation no one feels responsible for a group of citizens.
Michigan is one of nine states that does not have any constitutional language that can be interpreted as a limitation on mid-decade redistricting. Because Michigan has no constitutional law governing the process, the state legislature is able to reset the rules with a simple majority vote. If and when the state finally does attempt to alter the current constitutional language, it should include an outline of when the legislature is al-lowed to undergo the redistricting process.
1 Syllabus, League of Latin American Citizens v. Perry (2006). 2 Data gathered from: Levitt, Justin. All About Redistricting. redistricting.lls.edu.

Lorem ipsum dolor sit amet, consectetur adipiscing elit. Maecenas ultrices mi velit, sit amet malesuada elit venenatis et.
Sed condimentum sodales justo, a molestie tortor mattis ut. Cras ornare rutrum lorem, a auctor sem hendrerit ac.
Quisque auctor eros eu dui pretium condimentum in in leo. Phasellus interdum tellus in elementum maximus. Quisque
ut condimentum nulla. Nunc lorem ligula, vehicula id pretium ut, gravida sit amet nunc.
Nam gravida turpis a nulla vehicula fringilla. Nam a luctus augue, nec ultrices est. Proin a feugiat massa, id vulputate
metus. Mauris id lacinia elit, et lobortis sem. Sed quis diam pulvinar, egestas urna at, mattis odio. Phasellus bibendum
nulla vitae maximus imperdiet. Vestibulum ac quam volutpat, commodo enim id, molestie tortor. Morbi dapibus dapibus
ornare. Pellentesque quis massa tellus. In interdum in lacus nec fermentum. Nullam ullamcorper euismod justo at
dictum. Phasellus aliquet ultrices dolor, vel tempor diam convallis quis. Vestibulum hendrerit dignissim enim nec
dapibus. Integer volutpat congue tincidunt. Vestibulum sed nunc leo.
Morbi sed sapien vitae urna pretium dignissim eu at sapien. Aliquam eu nisl volutpat, commodo mauris sed, pharetra
ante. Nulla lobortis lectus ac sem imperdiet, at fringilla ante commodo. Aliquam sed ullamcorper nisl. Nullam sollicitudin
dolor purus, nec cursus mauris mattis quis. Pellentesque consectetur tellus vel nisi elementum volutpat. Suspendisse
sed dolor sit amet libero tincidunt congue. In egestas libero neque, vel cursus dui blandit vel.
Quisque sit amet venenatis eros. Nulla vulputate pulvinar mauris. Vestibulum pulvinar erat varius sem vestibulum, at
tristique nisl dapibus. Morbi hendrerit nisi malesuada, feugiat justo vitae, sagittis orci. Nam quis laoreet quam, a
faucibus risus. Morbi egestas molestie odio quis elementum. Suspendisse iaculis nisi id risus vehicula convallis. Donec
tincidunt congue fringilla.
Aliquam erat volutpat. Sed imperdiet augue sit amet eros rhoncus egestas. Mauris mauris nunc, scelerisque eu dapibus
nec, hendrerit a dolor. Duis vel nisl porttitor, dictum nulla id, molestie lacus. Nulla vehicula placerat justo, vel semper
metus luctus sed. Cras blandit ultrices ipsum sed facilisis. Maecenas varius eros orci, sed mollis arcu finibus eu. Nullam
ut quam ut lorem rutrum cursus non sed massa. Nunc sed sollicitudin orci. Integer libero tellus, iaculis in orci ut, ornare
vehicula ante.
Quisque sit amet venenatis eros. Nulla vulputate pulvinar mauris. Vestibulum pulvinar erat varius sem vestibulum, at
tristique nisl dapibus. Morbi hendrerit nisi malesuada, feugiat justo vitae, sagittis orci. Nam quis laoreet quam, a
faucibus risus. Morbi egestas molestie odio quis elementum. Suspendisse iaculis nisi id risus vehicula convallis. Donec
tincidunt congue fringilla.
Maecenas varius eros orci, sed mollis arcu finibus eu. Nullam ut quam ut lorem rutrum cursus non sed massa. Nunc sed
sollicitudin orci. Integer libero tellus, iaculis in orci ut, ornare vehicula ante.
Official Research Paper
Lorem Ipsum Research Paper TitleLorem Ipsum Sub-Heading
115 West Allegan Suite 480 | Lansing, MI 48933 | crcmich.org pg. 1
23
Quantifying the Level of Gerrymandering in Michigan
In November of 2016, the federal District Court from the Western District of Wisconsin overturned the state’s legislative and congressional district plans. This was the first time in more than three decades that a federal court overturned the entirety of a state’s district plan. The district court ordered that the state draw new dis-trict maps, and placed an injunction on use of the maps outlined state law.28 The U.S. Supreme Court stayed the lower court’s decision when it decided to hear the state’s appeal on Gill v. Whitford in 2017.
During the trial, the plaintiffs presented fairly strong evi-dence that Wisconsin’s legislature intended to create as strong a partisan advantage as possible. Excerpts of conversations from assembly members and staff, and Professor Keith Gaddie, a consultant hired by political leadership, were presented. This included a memo written by Gaddie, where he claimed that “[w]e
are not in court this time,” and “we do not need to show that we have cre-ated a fair, balanced, or even a reactive map,” and presented evidence showing the develop-ment of the Wisconsin map to provide as strong of a partisan advantage as possible.
The defendants did not argue the intent of the
maps was to provide a partisan advantage. History has shown intent is not sufficient to have a gerrymander overturned; a justiciable standard is required. Follow-ing the lessons from the LULAC decision, the plaintiffs utilized a new metric to measure gerrymandering called the efficiency gap. The efficiency gap was created by Nicholas Stephanopoulos, a professor at the University of Chicago Law School, and Eric McGhee, a Research Fellow at the Public Policy Institute of California. Us-ing some of the principles of partisan symmetry, they created the efficiency gap to find a possible justiciable standard for evaluating gerrymandering.
The efficiency gap calculates the frequency that a party ‘wastes’ votes. A wasted vote, according to the method, is a vote cast for a party that is not helpful in putting the candidate above 50 percent of the two-
Ultimately, the court did not deem symmetry sufficient in identifying gerrymandering for a few reasons. One of the biggest issues comes from the determination of which voters would switch votes to produce the symmetrical situation. As stated in Justice Kennedy’s opinion:
The existence or degree of asymmetry may in large part depend on conjecture about where possible vote-switchers will reside. Even as-suming a court could choose reliably among different models of shifting voter preferences, we are wary of adopting a constitutional stan-dard that invalidates a map based on unfair results that would occur in a hypothetical state of affairs.25
While several justices noted that there is value in an analysis based on partisan symmetry, some, including Justice Kennedy, were not particularly convinced with partisan symmetry being used as the sole standard because of the reliance on a simulated election. Unless two elections oc-curred with asymmetric results, the partisan sym-metry method required a reliance on scientifically modeled counterfactual cases, rather than actual election data. The Court felt uncomfortable using social science methods to guess what voters would likely switch their votes. This left those challenging gerrymandering to find a new metric.
Gill v. Whitford and the Efficiency GapWisconsin’s State Assembly is considered one of the most gerrymandered maps in the country.26 In 2012, Democrats won a majority of the vote in the State Assembly, yet Republicans won 60 of 99 Assembly seats.27 Because many saw this as an unfair parti-san gerrymander, a group of Democrat voters sued the state, arguing that the legislation that created the state’s districting plan violated First Amendment pro-tections of freedom of political speech and Fourteenth Amendment equal protection rights.
While several justices noted that there is value in an analysis based on partisan symmetry, some were not particularly convinced with partisan symmetry being used as the sole standard because of the reliance on a simulated election.

Lorem ipsum dolor sit amet, consectetur adipiscing elit. Maecenas ultrices mi velit, sit amet malesuada elit venenatis et.
Sed condimentum sodales justo, a molestie tortor mattis ut. Cras ornare rutrum lorem, a auctor sem hendrerit ac.
Quisque auctor eros eu dui pretium condimentum in in leo. Phasellus interdum tellus in elementum maximus. Quisque
ut condimentum nulla. Nunc lorem ligula, vehicula id pretium ut, gravida sit amet nunc.
Nam gravida turpis a nulla vehicula fringilla. Nam a luctus augue, nec ultrices est. Proin a feugiat massa, id vulputate
metus. Mauris id lacinia elit, et lobortis sem. Sed quis diam pulvinar, egestas urna at, mattis odio. Phasellus bibendum
nulla vitae maximus imperdiet. Vestibulum ac quam volutpat, commodo enim id, molestie tortor. Morbi dapibus dapibus
ornare. Pellentesque quis massa tellus. In interdum in lacus nec fermentum. Nullam ullamcorper euismod justo at
dictum. Phasellus aliquet ultrices dolor, vel tempor diam convallis quis. Vestibulum hendrerit dignissim enim nec
dapibus. Integer volutpat congue tincidunt. Vestibulum sed nunc leo.
Morbi sed sapien vitae urna pretium dignissim eu at sapien. Aliquam eu nisl volutpat, commodo mauris sed, pharetra
ante. Nulla lobortis lectus ac sem imperdiet, at fringilla ante commodo. Aliquam sed ullamcorper nisl. Nullam sollicitudin
dolor purus, nec cursus mauris mattis quis. Pellentesque consectetur tellus vel nisi elementum volutpat. Suspendisse
sed dolor sit amet libero tincidunt congue. In egestas libero neque, vel cursus dui blandit vel.
Quisque sit amet venenatis eros. Nulla vulputate pulvinar mauris. Vestibulum pulvinar erat varius sem vestibulum, at
tristique nisl dapibus. Morbi hendrerit nisi malesuada, feugiat justo vitae, sagittis orci. Nam quis laoreet quam, a
faucibus risus. Morbi egestas molestie odio quis elementum. Suspendisse iaculis nisi id risus vehicula convallis. Donec
tincidunt congue fringilla.
Aliquam erat volutpat. Sed imperdiet augue sit amet eros rhoncus egestas. Mauris mauris nunc, scelerisque eu dapibus
nec, hendrerit a dolor. Duis vel nisl porttitor, dictum nulla id, molestie lacus. Nulla vehicula placerat justo, vel semper
metus luctus sed. Cras blandit ultrices ipsum sed facilisis. Maecenas varius eros orci, sed mollis arcu finibus eu. Nullam
ut quam ut lorem rutrum cursus non sed massa. Nunc sed sollicitudin orci. Integer libero tellus, iaculis in orci ut, ornare
vehicula ante.
Quisque sit amet venenatis eros. Nulla vulputate pulvinar mauris. Vestibulum pulvinar erat varius sem vestibulum, at
tristique nisl dapibus. Morbi hendrerit nisi malesuada, feugiat justo vitae, sagittis orci. Nam quis laoreet quam, a
faucibus risus. Morbi egestas molestie odio quis elementum. Suspendisse iaculis nisi id risus vehicula convallis. Donec
tincidunt congue fringilla.
Maecenas varius eros orci, sed mollis arcu finibus eu. Nullam ut quam ut lorem rutrum cursus non sed massa. Nunc sed
sollicitudin orci. Integer libero tellus, iaculis in orci ut, ornare vehicula ante.
Official Research Paper
Lorem Ipsum Research Paper TitleLorem Ipsum Sub-Heading
115 West Allegan Suite 480 | Lansing, MI 48933 | crcmich.org pg. 1
24
Quantifying the Level of Gerrymandering in Michigan
The Efficiency Gap: The Trouble with a Single Metric FocusThere are a lot of considerations to make when implementing the efficiency gap as a practical standard. No single metric to evaluate gerrymandering is likely to be perfect, but it is important to carefully consider the flaws and limitations of a measure before applying it to any analysis. The efficiency gap in particular has a handful of issues that are discussed in depth between the academic literature and the proceedings of Gill.
One of the primary issues is that the efficiency gap, for congressional districts at least, does not treat all states the same. The standard uses a threshold of two congressional districts, rather than a flat number, as the baseline for determining what is gerrymandered. As a result, larger states can have smaller efficiency gap scores register as beyond the threshold, while states with four or fewer congressional districts cannot register an efficiency gap of that size. This can lead the efficiency gap to more frequently mark states with several congressional districts as gerrymanders due to natural causes, while smaller states could exhibit signs of gerrymander-ing and not meet the threshold.
The efficiency gap also has difficulty dealing with extremes. As elections get less competitive overall, the system begins to break down in how well it evaluates the fairness of districts. A hypothetical scheme in a state with a 75 percent majority (plus one person for each district) for one party would be considered most fair if the majority party won every district; and it is impossible to draw a map without the majority party being disadvantaged according to the efficiency gap once they exceed that proportion.
While this can be a concern in theory, in practice most states do not have vote levels to those extremes, and gerrymanders typically concern states with very close vote margins. During the 2016 presidential election, more than 45 states had two-party vote shares fall below this threshold. In addition to this, concerns about gerrymandering are much stronger in states that are less homogenous; in states where statewide vote counts are closer, gerrymandering has a much larger influence on the makeup of the state level.
An additional issue that comes up with the efficiency gap is that it has difficulties dealing with non-homogenous political geographies. Large cities in particular tend to vote for one party more consistently (and typically, they tend to vote for Democrats) compared to more rural areas.1 This would mean that keeping districts entirely within a city could be construed as packing Democrat votes. When at-tempting to follow other common rules for redistricting, such as limiting breaks in political boundaries or maintaining compact districts, map-makers would be stuck between a rock and a hard place. They could either break cities to some extent and have spiraling districts to keep the efficiency gap as close to zero as possible, or they can keep the city together but risk being accused of gerrymandering. Either way, the map-makers would have to break common norms of redistricting or risk their map getting overturned based on the efficiency gap. This is of particular interest for any analysis of Michigan’s maps, as the Detroit metro area provides one of the best examples of natural sorting.
A fourth criticism of the efficiency gap is it ignores that individual votes are cast in a complex environment. Voters are not monolithic entities; even within one election year they can vote for candidates from different parties. Different candidates and change within individual voters inherently affect how votes are cast; the efficiency gap does not treat them as distinct. Critics argue that this means the efficiency gap as a concept does not effectively capture gerrymandering.
A lot of the discussion about the efficiency gap tries to paint it as either a single, all-encompassing measure for gerrymandering in the electoral system or a failure. But all-encompassing statistical measures for any sort of complex system will have flaws, or have trouble dealing with certain outliers. The problem with this is that any attempt to simplify complex systems, like elections, into a single metric will eventually fail under some set of circumstances.
But that should not be reason enough to abandon their use; otherwise the perfect would become the enemy of the good. The courts approaches to other redistricting efforts reflect this. In determining compliance with the one person, one vote principle, the courts have used both total variance and standard deviation, as each measure better tests for different distributions.
The potential for problems in simplifying a complex system do not mean a metric is unusable; to the contrary, the efficiency gap has value in many instances. But setting it as the sole arbiter of gerrymandering could lead to adverse results, particularly if state legislatures design districting plans to exploit potential flaws in the efficiency gap. No single metric is likely to capture all possible gerrymanders; if the efficiency gap, or another single standard were adopted, attempts to gerrymander could be formed around those criteria, creating troubling maps that look somewhat benign. Instead, the efficiency gap should be used as one of several pieces to determine if district maps are illegally gerrymandered.
1 Cohn, Nate and Quactrung Bui. “How the New Math of Gerrymandering Works”. The New York Times. October 3, 2017. www.nytimes.com/interactive/2017/10/03/upshot/how-the-new-math-of-gerrymandering-works-supreme-court.html.

Lorem ipsum dolor sit amet, consectetur adipiscing elit. Maecenas ultrices mi velit, sit amet malesuada elit venenatis et.
Sed condimentum sodales justo, a molestie tortor mattis ut. Cras ornare rutrum lorem, a auctor sem hendrerit ac.
Quisque auctor eros eu dui pretium condimentum in in leo. Phasellus interdum tellus in elementum maximus. Quisque
ut condimentum nulla. Nunc lorem ligula, vehicula id pretium ut, gravida sit amet nunc.
Nam gravida turpis a nulla vehicula fringilla. Nam a luctus augue, nec ultrices est. Proin a feugiat massa, id vulputate
metus. Mauris id lacinia elit, et lobortis sem. Sed quis diam pulvinar, egestas urna at, mattis odio. Phasellus bibendum
nulla vitae maximus imperdiet. Vestibulum ac quam volutpat, commodo enim id, molestie tortor. Morbi dapibus dapibus
ornare. Pellentesque quis massa tellus. In interdum in lacus nec fermentum. Nullam ullamcorper euismod justo at
dictum. Phasellus aliquet ultrices dolor, vel tempor diam convallis quis. Vestibulum hendrerit dignissim enim nec
dapibus. Integer volutpat congue tincidunt. Vestibulum sed nunc leo.
Morbi sed sapien vitae urna pretium dignissim eu at sapien. Aliquam eu nisl volutpat, commodo mauris sed, pharetra
ante. Nulla lobortis lectus ac sem imperdiet, at fringilla ante commodo. Aliquam sed ullamcorper nisl. Nullam sollicitudin
dolor purus, nec cursus mauris mattis quis. Pellentesque consectetur tellus vel nisi elementum volutpat. Suspendisse
sed dolor sit amet libero tincidunt congue. In egestas libero neque, vel cursus dui blandit vel.
Quisque sit amet venenatis eros. Nulla vulputate pulvinar mauris. Vestibulum pulvinar erat varius sem vestibulum, at
tristique nisl dapibus. Morbi hendrerit nisi malesuada, feugiat justo vitae, sagittis orci. Nam quis laoreet quam, a
faucibus risus. Morbi egestas molestie odio quis elementum. Suspendisse iaculis nisi id risus vehicula convallis. Donec
tincidunt congue fringilla.
Aliquam erat volutpat. Sed imperdiet augue sit amet eros rhoncus egestas. Mauris mauris nunc, scelerisque eu dapibus
nec, hendrerit a dolor. Duis vel nisl porttitor, dictum nulla id, molestie lacus. Nulla vehicula placerat justo, vel semper
metus luctus sed. Cras blandit ultrices ipsum sed facilisis. Maecenas varius eros orci, sed mollis arcu finibus eu. Nullam
ut quam ut lorem rutrum cursus non sed massa. Nunc sed sollicitudin orci. Integer libero tellus, iaculis in orci ut, ornare
vehicula ante.
Quisque sit amet venenatis eros. Nulla vulputate pulvinar mauris. Vestibulum pulvinar erat varius sem vestibulum, at
tristique nisl dapibus. Morbi hendrerit nisi malesuada, feugiat justo vitae, sagittis orci. Nam quis laoreet quam, a
faucibus risus. Morbi egestas molestie odio quis elementum. Suspendisse iaculis nisi id risus vehicula convallis. Donec
tincidunt congue fringilla.
Maecenas varius eros orci, sed mollis arcu finibus eu. Nullam ut quam ut lorem rutrum cursus non sed massa. Nunc sed
sollicitudin orci. Integer libero tellus, iaculis in orci ut, ornare vehicula ante.
Official Research Paper
Lorem Ipsum Research Paper TitleLorem Ipsum Sub-Heading
115 West Allegan Suite 480 | Lansing, MI 48933 | crcmich.org pg. 1
25
Quantifying the Level of Gerrymandering in Michigan
Using this measure, the plaintiffs outlined a three-part test to determine if partisan gerrymandering occurred:
1. Establish the existence of intent for partisan gerrymandering;
2. Demonstrate through the use of the efficien-cy gap that the threshold for gerrymandering exceeded seven percent; and
3. If the first two conditions are met, the maps would become presumptively unconstitu-tional, and the state would be given the opportunity to defend the district maps as either necessary for compelling state policy interests, or be a cause of natural political geography.29
The U.S. District Court in Wisconsin ultimately modified this test; instead of focusing on the efficiency gap as the measure of whether an illegal partisan gerrymander occurred, it focused on the idea of entrenchment, or the concept of how sustainable a gerrymander would be across a series of elections (over a period between decennial censuses).
The District Court determined that if there was evidence that a state’s legislative or congressional maps were designed in such a way to ensure one party had the majority, there was sufficient evidence to determine that there was a partisan gerrymander.
In June 2018, the U.S. Supreme Court ruled that the plaintiffs lacked standing in the case. Because the measures used in describing partisan gerrymandering did not show individualized harm for the plaintiffs, but instead demonstrated the burdens placed on political parties, the individuals in the case were deemed to be legally unable to bring the case to the Court. In most cases, this would lead to the outright dismissal of the case; but the Court in this instance chose to send the case back to the District Court to allow the plaintiffs an opportunity to demonstrate that they have proper standing.30
Benisek v. Lamone and the Standing QuestionIn November of 2013, Republican residents of Mary-land filed a claim against the state, arguing the con-gressional district plan violated their First Amendment right of political association. The specific claim in Benisek v. Lamone is that the use of narrow slivers of
party share of votes needed to win an election for a legislative seat. Any vote cast for a losing candidate and any vote cast for a candidate after they receive a majority of the two-party vote share is considered wasted by the metric. Each party’s total wasted votes for an office type (congressional, state house, or state senate) would then be summed and the difference is taken and divided by the total votes cast to create a metric that can be compared across different states and different years.
The idea of a wasted vote, at least in theory, pairs particularly well with the two main methods of a ger-rymander: packing and cracking. Packed districts, with a significant number of votes for the same party, would increase the efficiency gap as the margin of victory increases. Cracked districts exhibit the opposite, with extremely close districts having a large number of votes wasted for the losing party. By including measures that account for packed and cracked districts, the ef-ficiency gap attempts to provide a measure to show if a large number of districts exhibit tendencies of unfair redistricting practices.
If one party wastes significantly more votes than the other, the result is not symmetric. This measure at-tempts to find the same underlying problem the partisan symmetry standard does, but because the efficiency gap uses data from actual elections to determine whether gerrymandering has occurred (as opposed to simulations relied upon with the symmetry standard). The efficiency gap does not rely on hypothetical elec-tion results, which could make it more palatable as a judicial standard in the eyes of the Supreme Court.
The efficiency gap calculates the frequency that a party ‘wastes’ votes. Any vote cast for a losing candidate and any vote cast for a candidate after they receive a ma-jority of the two-party vote share is considered wasted by the metric.

Lorem ipsum dolor sit amet, consectetur adipiscing elit. Maecenas ultrices mi velit, sit amet malesuada elit venenatis et.
Sed condimentum sodales justo, a molestie tortor mattis ut. Cras ornare rutrum lorem, a auctor sem hendrerit ac.
Quisque auctor eros eu dui pretium condimentum in in leo. Phasellus interdum tellus in elementum maximus. Quisque
ut condimentum nulla. Nunc lorem ligula, vehicula id pretium ut, gravida sit amet nunc.
Nam gravida turpis a nulla vehicula fringilla. Nam a luctus augue, nec ultrices est. Proin a feugiat massa, id vulputate
metus. Mauris id lacinia elit, et lobortis sem. Sed quis diam pulvinar, egestas urna at, mattis odio. Phasellus bibendum
nulla vitae maximus imperdiet. Vestibulum ac quam volutpat, commodo enim id, molestie tortor. Morbi dapibus dapibus
ornare. Pellentesque quis massa tellus. In interdum in lacus nec fermentum. Nullam ullamcorper euismod justo at
dictum. Phasellus aliquet ultrices dolor, vel tempor diam convallis quis. Vestibulum hendrerit dignissim enim nec
dapibus. Integer volutpat congue tincidunt. Vestibulum sed nunc leo.
Morbi sed sapien vitae urna pretium dignissim eu at sapien. Aliquam eu nisl volutpat, commodo mauris sed, pharetra
ante. Nulla lobortis lectus ac sem imperdiet, at fringilla ante commodo. Aliquam sed ullamcorper nisl. Nullam sollicitudin
dolor purus, nec cursus mauris mattis quis. Pellentesque consectetur tellus vel nisi elementum volutpat. Suspendisse
sed dolor sit amet libero tincidunt congue. In egestas libero neque, vel cursus dui blandit vel.
Quisque sit amet venenatis eros. Nulla vulputate pulvinar mauris. Vestibulum pulvinar erat varius sem vestibulum, at
tristique nisl dapibus. Morbi hendrerit nisi malesuada, feugiat justo vitae, sagittis orci. Nam quis laoreet quam, a
faucibus risus. Morbi egestas molestie odio quis elementum. Suspendisse iaculis nisi id risus vehicula convallis. Donec
tincidunt congue fringilla.
Aliquam erat volutpat. Sed imperdiet augue sit amet eros rhoncus egestas. Mauris mauris nunc, scelerisque eu dapibus
nec, hendrerit a dolor. Duis vel nisl porttitor, dictum nulla id, molestie lacus. Nulla vehicula placerat justo, vel semper
metus luctus sed. Cras blandit ultrices ipsum sed facilisis. Maecenas varius eros orci, sed mollis arcu finibus eu. Nullam
ut quam ut lorem rutrum cursus non sed massa. Nunc sed sollicitudin orci. Integer libero tellus, iaculis in orci ut, ornare
vehicula ante.
Quisque sit amet venenatis eros. Nulla vulputate pulvinar mauris. Vestibulum pulvinar erat varius sem vestibulum, at
tristique nisl dapibus. Morbi hendrerit nisi malesuada, feugiat justo vitae, sagittis orci. Nam quis laoreet quam, a
faucibus risus. Morbi egestas molestie odio quis elementum. Suspendisse iaculis nisi id risus vehicula convallis. Donec
tincidunt congue fringilla.
Maecenas varius eros orci, sed mollis arcu finibus eu. Nullam ut quam ut lorem rutrum cursus non sed massa. Nunc sed
sollicitudin orci. Integer libero tellus, iaculis in orci ut, ornare vehicula ante.
Official Research Paper
Lorem Ipsum Research Paper TitleLorem Ipsum Sub-Heading
115 West Allegan Suite 480 | Lansing, MI 48933 | crcmich.org pg. 1
26
Quantifying the Level of Gerrymandering in Michigan
land to connect areas in certain congressional districts created de-facto non-contiguous districts.
These districts, the plaintiffs argued, were designed in a way to limit the ability of Republican voters to elect candidates for the 6th district (Map 7), as the demo-graphics of the areas connected by the ribbons are very different. There is more than just suspicion that the Democrats in Maryland intended to flip the district; Governor O’Malley has admitted the goal of the maps was to improve Democrats chances.31
The defense has argued that the gerrymander is ac-ceptable because it more closely resembles the dis-trict’s historic makeup, it followed all state procedures and rules, and it is still a competitive district.32 For decades prior to the 1990s redistricting process, the 6th included the same five counties used in the current version of the district; the last two cycles were outli-ers in that respect. And the district is slightly more competitive; but measures cited by the defense show that the district is still not very competitive. The Cook Partisan Voter Index, a metric cited by the defense that evaluates the likely outcome of districts by using his-torical election data, changed the district from a ‘safe’ Republican seat to a ‘likely’ Democrat seat, which is not considered competitive but could become competitive under some circumstances.
The U.S. District Court opted to stay the trial until Gill was decided, but the plaintiffs appealed that decision to the U.S. Supreme Court. It is fairly atypical for the Supreme Court to hear multiple cases focusing on the same issue at the same time; but the Court chose to hear the appeal.
Benisek did not rely on a measure such as the effi-ciency gap to make a primary case of partisan gerry-mandering. While some statistical measures are used to demonstrate the claims, particularly the output of software designed to simulate thousands of potential district arrangements, the primary focus is on the intent to gerrymander and the resulting changes in the 6th congressional district.33 In many regards, these dif-ferences cause Benisek to deviate significantly from approaches tested in Vieth and LULAC; instead of creating a specific test, the plaintiffs’ case in Benisek relies on totality of circumstance, and would not create a specific precedent for how future courts would oper-ate when considering partisan gerrymandering cases.
The petitioners in Benisek represented a singular congressional district and only argued for the change of a singular district. This is distinct from Gill, where the plaintiffs challenged the entire district map. In that respect, the claims in Benisek more closely resemble racial gerrymandering cases. While Gill was returned
to the district courts due to issues with standing, the structure of Benisek is more likely to effectively serve as a roadmap for future plaintiffs to demonstrate they have proper standing.
In June of 2018, the U.S. Supreme Court affirmed the District Court’s decision refusing to place an injunction on Maryland’s district maps. The U.S. Supreme Court agreed with the lower court’s reasoning that placing an injunction on Maryland’s state maps would need-lessly interfere with the election, particularly given the U.S. Supreme Court had already determined to hear Gill. Similar to the decision in Gill, the U.S. Supreme Court stopped short on deciding the merits of the case – instead, the ruling, in conjunction with the ruling on Gill, allows the District Court to resume proceedings on the merits of the case.34
Rucho v. League of Women Voters, Rucho v. Common CauseA case involving North Carolina’s congressional maps has also garnered national attention. After the Middle District Court of North Carolina ruled the maps created in 2011 were an unconstitutional racial gerrymander, the state created a new set of maps that some claimed were an unconstitutional partisan gerrymander. Sev-eral groups and voters claimed that the new congres-
Map 7 Maryland 6th Congressional District

Lorem ipsum dolor sit amet, consectetur adipiscing elit. Maecenas ultrices mi velit, sit amet malesuada elit venenatis et.
Sed condimentum sodales justo, a molestie tortor mattis ut. Cras ornare rutrum lorem, a auctor sem hendrerit ac.
Quisque auctor eros eu dui pretium condimentum in in leo. Phasellus interdum tellus in elementum maximus. Quisque
ut condimentum nulla. Nunc lorem ligula, vehicula id pretium ut, gravida sit amet nunc.
Nam gravida turpis a nulla vehicula fringilla. Nam a luctus augue, nec ultrices est. Proin a feugiat massa, id vulputate
metus. Mauris id lacinia elit, et lobortis sem. Sed quis diam pulvinar, egestas urna at, mattis odio. Phasellus bibendum
nulla vitae maximus imperdiet. Vestibulum ac quam volutpat, commodo enim id, molestie tortor. Morbi dapibus dapibus
ornare. Pellentesque quis massa tellus. In interdum in lacus nec fermentum. Nullam ullamcorper euismod justo at
dictum. Phasellus aliquet ultrices dolor, vel tempor diam convallis quis. Vestibulum hendrerit dignissim enim nec
dapibus. Integer volutpat congue tincidunt. Vestibulum sed nunc leo.
Morbi sed sapien vitae urna pretium dignissim eu at sapien. Aliquam eu nisl volutpat, commodo mauris sed, pharetra
ante. Nulla lobortis lectus ac sem imperdiet, at fringilla ante commodo. Aliquam sed ullamcorper nisl. Nullam sollicitudin
dolor purus, nec cursus mauris mattis quis. Pellentesque consectetur tellus vel nisi elementum volutpat. Suspendisse
sed dolor sit amet libero tincidunt congue. In egestas libero neque, vel cursus dui blandit vel.
Quisque sit amet venenatis eros. Nulla vulputate pulvinar mauris. Vestibulum pulvinar erat varius sem vestibulum, at
tristique nisl dapibus. Morbi hendrerit nisi malesuada, feugiat justo vitae, sagittis orci. Nam quis laoreet quam, a
faucibus risus. Morbi egestas molestie odio quis elementum. Suspendisse iaculis nisi id risus vehicula convallis. Donec
tincidunt congue fringilla.
Aliquam erat volutpat. Sed imperdiet augue sit amet eros rhoncus egestas. Mauris mauris nunc, scelerisque eu dapibus
nec, hendrerit a dolor. Duis vel nisl porttitor, dictum nulla id, molestie lacus. Nulla vehicula placerat justo, vel semper
metus luctus sed. Cras blandit ultrices ipsum sed facilisis. Maecenas varius eros orci, sed mollis arcu finibus eu. Nullam
ut quam ut lorem rutrum cursus non sed massa. Nunc sed sollicitudin orci. Integer libero tellus, iaculis in orci ut, ornare
vehicula ante.
Quisque sit amet venenatis eros. Nulla vulputate pulvinar mauris. Vestibulum pulvinar erat varius sem vestibulum, at
tristique nisl dapibus. Morbi hendrerit nisi malesuada, feugiat justo vitae, sagittis orci. Nam quis laoreet quam, a
faucibus risus. Morbi egestas molestie odio quis elementum. Suspendisse iaculis nisi id risus vehicula convallis. Donec
tincidunt congue fringilla.
Maecenas varius eros orci, sed mollis arcu finibus eu. Nullam ut quam ut lorem rutrum cursus non sed massa. Nunc sed
sollicitudin orci. Integer libero tellus, iaculis in orci ut, ornare vehicula ante.
Official Research Paper
Lorem Ipsum Research Paper TitleLorem Ipsum Sub-Heading
115 West Allegan Suite 480 | Lansing, MI 48933 | crcmich.org pg. 1
27
Quantifying the Level of Gerrymandering in Michigan
sional district maps were designed to infringe on their right to vote due to their political preference. The case was brought before the U.S. District Court, where the new congressional maps were struck down as a partisan gerrymander.
The plaintiffs primarily relied on mapping algorithms to determine the level of gerrymandering that occurred. Two professors separately created algorithms to ran-domly generate and test thousands of iterations of potential district boundaries, making sure that they followed typical redistricting requirements that were used in North Carolina’s map. Once the maps were created, voter data from the 2012 and 2016 elections were inputted into the new districts to simulate election results with the hypothetical boundaries, and compared to the actual outcome.
North Carolina’s actual congressional districts resulted in a 10-to-3 seat advantage for Republicans in 2012 and 2016. Based on the maps drawn via simulations, this result was an extreme statistical outlier. The simulations found that less than one percent of all plans recreated the 10 to 3 margin or a larger margin for Republicans.
The defendants in the trial did not argue against the claim that they intended to create a gerrymandered map. The legislative committee explicitly tried to cre-ate a map that gave Republicans a 10-to-3 advantage in congressional districts. Instead, they argued that there was not a clear standard to determine what dis-tricts should be thrown out, and that the districts met other redistricting criteria and did not seek the most extreme partisan advantage, making it a legal district-ing scheme.
In early 2018, the Middle District Court of North Caro-lina ruled that the state’s remedial map was an imper-missible partisan gerrymander. While the District Court struck down the map and ordered the state to create new districts prior to the upcoming election, the U.S. Supreme Court vacated the ruling, and remanded the case to the District Court for further consideration in light of the ruling in Gill.
Beyond the Courts: Other Metrics to Evaluate Partisan GerrymanderingWhile the efficiency gap has been at the forefront of Gill, several other metrics have been developed and are being used to evaluate gerrymandering by a variety of researchers. Some of these metrics rely on simi-lar metrics to old tests (such as the ‘S-curve’), while some use statistical tests that focus on how districts deviate from each other to determine if gerrymander-ing occurred.
ResponsivenessOne of the most explanatory measures is the respon-siveness of district schemes. This can also be con-sidered as the slope of the S-curve. While symmetry, the primary measure utilizing the S-curve, measures the location of the curve relative to the origin, respon-siveness measures the slope of the curve. The slope represents the rate of change in seats relative to votes. For example, in a perfectly proportional state, the slope of the s-curve would be 1—it would be a straight line where 60 percent of votes would lead to 60 percent of seats for either party. In most instances the slope is not that clean (thus the ‘S’ shape).
Steeper S-curves indicate a higher level of responsive-ness to the voters; a few votes changing can have a large impact on the statewide makeup. States with steeper S-curves typically have several competitive elections. Flatter S-curves, conversely, have fewer competitive elections. This is typically an indication that there is some gerrymandering to protect incumbents (but not produce partisan bias).
But the slope of the S-curve is not always symmetric. Chart 5 (see page 28) shows a normal S-curve next to a typical gerrymandered curve. In this instance, the black line shows very little relationship to the symmetric curve. Instead of accelerating towards the 50-50 point, a typical gerrymandered vote-to-seat curve stays flat until the party that is suppressed gains a significant
Several other metrics have been developed and are being used to evaluate gerrymandering by a variety of researchers.

Lorem ipsum dolor sit amet, consectetur adipiscing elit. Maecenas ultrices mi velit, sit amet malesuada elit venenatis et.
Sed condimentum sodales justo, a molestie tortor mattis ut. Cras ornare rutrum lorem, a auctor sem hendrerit ac.
Quisque auctor eros eu dui pretium condimentum in in leo. Phasellus interdum tellus in elementum maximus. Quisque
ut condimentum nulla. Nunc lorem ligula, vehicula id pretium ut, gravida sit amet nunc.
Nam gravida turpis a nulla vehicula fringilla. Nam a luctus augue, nec ultrices est. Proin a feugiat massa, id vulputate
metus. Mauris id lacinia elit, et lobortis sem. Sed quis diam pulvinar, egestas urna at, mattis odio. Phasellus bibendum
nulla vitae maximus imperdiet. Vestibulum ac quam volutpat, commodo enim id, molestie tortor. Morbi dapibus dapibus
ornare. Pellentesque quis massa tellus. In interdum in lacus nec fermentum. Nullam ullamcorper euismod justo at
dictum. Phasellus aliquet ultrices dolor, vel tempor diam convallis quis. Vestibulum hendrerit dignissim enim nec
dapibus. Integer volutpat congue tincidunt. Vestibulum sed nunc leo.
Morbi sed sapien vitae urna pretium dignissim eu at sapien. Aliquam eu nisl volutpat, commodo mauris sed, pharetra
ante. Nulla lobortis lectus ac sem imperdiet, at fringilla ante commodo. Aliquam sed ullamcorper nisl. Nullam sollicitudin
dolor purus, nec cursus mauris mattis quis. Pellentesque consectetur tellus vel nisi elementum volutpat. Suspendisse
sed dolor sit amet libero tincidunt congue. In egestas libero neque, vel cursus dui blandit vel.
Quisque sit amet venenatis eros. Nulla vulputate pulvinar mauris. Vestibulum pulvinar erat varius sem vestibulum, at
tristique nisl dapibus. Morbi hendrerit nisi malesuada, feugiat justo vitae, sagittis orci. Nam quis laoreet quam, a
faucibus risus. Morbi egestas molestie odio quis elementum. Suspendisse iaculis nisi id risus vehicula convallis. Donec
tincidunt congue fringilla.
Aliquam erat volutpat. Sed imperdiet augue sit amet eros rhoncus egestas. Mauris mauris nunc, scelerisque eu dapibus
nec, hendrerit a dolor. Duis vel nisl porttitor, dictum nulla id, molestie lacus. Nulla vehicula placerat justo, vel semper
metus luctus sed. Cras blandit ultrices ipsum sed facilisis. Maecenas varius eros orci, sed mollis arcu finibus eu. Nullam
ut quam ut lorem rutrum cursus non sed massa. Nunc sed sollicitudin orci. Integer libero tellus, iaculis in orci ut, ornare
vehicula ante.
Quisque sit amet venenatis eros. Nulla vulputate pulvinar mauris. Vestibulum pulvinar erat varius sem vestibulum, at
tristique nisl dapibus. Morbi hendrerit nisi malesuada, feugiat justo vitae, sagittis orci. Nam quis laoreet quam, a
faucibus risus. Morbi egestas molestie odio quis elementum. Suspendisse iaculis nisi id risus vehicula convallis. Donec
tincidunt congue fringilla.
Maecenas varius eros orci, sed mollis arcu finibus eu. Nullam ut quam ut lorem rutrum cursus non sed massa. Nunc sed
sollicitudin orci. Integer libero tellus, iaculis in orci ut, ornare vehicula ante.
Official Research Paper
Lorem Ipsum Research Paper TitleLorem Ipsum Sub-Heading
115 West Allegan Suite 480 | Lansing, MI 48933 | crcmich.org pg. 1
28
Quantifying the Level of Gerrymandering in Michigan
higher median) indicates that the party had an elec-toral advantage from the redistricting scheme, while a negative result would indicated a party was hindered by the scheme.
The mean-median indicator does an effective job at indicating whether a dataset is skewed. In the majority of districts that can be drawn, the median vote share for a district should be fairly close to the average, as the districts are more likely to be distributed normally (or on a bell curve, with a large number of observations at the average, and observations in each direction be-coming less frequent at an equal pace, see Chart 6).
The mean-median approach does have some flaws. One of the biggest is the measure is unaffected by the total number of seats a party wins. Because electing a candidate is the end goal of a gerrymander, ignor-ing the end result of elections can cause the measure to miss pieces of how a gerrymander operates. The mean-median test also does not do a great job at establishing why the data is skewed; similar to the efficiency gap, this metric fails to delineate between political geography and gerrymandering, as it is un-able to parse the two factors or explain which one is causing the difference.
The T-TestThe t-test is a standard statistical measure used to evaluate the similarity or difference between two groups, and is applicable to detecting gerrymandering. In the context of elections, it determines whether the groups of districts two parties won had relatively equal margins of victory.
majority of the voting population. This both indicates that there is a lack of symmetry and that the respon-siveness for each party is not symmetric.
Because gerrymanders typically rely on packing a small number of districts, the floor for the number of seats the suppressed party can win is typically higher, but it takes significantly more votes to win additional seats. Because the party in control of the redistrict-ing process wins several districts by narrow margins, once the suppressed party wins a larger share of the statewide votes, seats begin to change hands very quickly. The responsiveness of a state’s district maps can be a quick indicator of partisan gerrymandering.35
The Mean-Median TestAnother test that has been discussed with more fre-quency of late is the mean-median test, which is a simple way to determine if a dataset is skewed, or not distributed normally across the average. Instead of focusing on the outcome of results, the mean-median test tries to determine if the typical makeup of districts deviates significantly from the state average. If the median and mean are largely different, there is some indication that districts are organized in a way that their population is very different than the state as a whole.36
To apply this test, the average vote share for a party across the state is subtracted from its vote share in the median district. A positive number (indicating a
Chart 5 Gerrymandered Vote-to-Seat Curve
Chart 6 Example Bell Curve

Lorem ipsum dolor sit amet, consectetur adipiscing elit. Maecenas ultrices mi velit, sit amet malesuada elit venenatis et.
Sed condimentum sodales justo, a molestie tortor mattis ut. Cras ornare rutrum lorem, a auctor sem hendrerit ac.
Quisque auctor eros eu dui pretium condimentum in in leo. Phasellus interdum tellus in elementum maximus. Quisque
ut condimentum nulla. Nunc lorem ligula, vehicula id pretium ut, gravida sit amet nunc.
Nam gravida turpis a nulla vehicula fringilla. Nam a luctus augue, nec ultrices est. Proin a feugiat massa, id vulputate
metus. Mauris id lacinia elit, et lobortis sem. Sed quis diam pulvinar, egestas urna at, mattis odio. Phasellus bibendum
nulla vitae maximus imperdiet. Vestibulum ac quam volutpat, commodo enim id, molestie tortor. Morbi dapibus dapibus
ornare. Pellentesque quis massa tellus. In interdum in lacus nec fermentum. Nullam ullamcorper euismod justo at
dictum. Phasellus aliquet ultrices dolor, vel tempor diam convallis quis. Vestibulum hendrerit dignissim enim nec
dapibus. Integer volutpat congue tincidunt. Vestibulum sed nunc leo.
Morbi sed sapien vitae urna pretium dignissim eu at sapien. Aliquam eu nisl volutpat, commodo mauris sed, pharetra
ante. Nulla lobortis lectus ac sem imperdiet, at fringilla ante commodo. Aliquam sed ullamcorper nisl. Nullam sollicitudin
dolor purus, nec cursus mauris mattis quis. Pellentesque consectetur tellus vel nisi elementum volutpat. Suspendisse
sed dolor sit amet libero tincidunt congue. In egestas libero neque, vel cursus dui blandit vel.
Quisque sit amet venenatis eros. Nulla vulputate pulvinar mauris. Vestibulum pulvinar erat varius sem vestibulum, at
tristique nisl dapibus. Morbi hendrerit nisi malesuada, feugiat justo vitae, sagittis orci. Nam quis laoreet quam, a
faucibus risus. Morbi egestas molestie odio quis elementum. Suspendisse iaculis nisi id risus vehicula convallis. Donec
tincidunt congue fringilla.
Aliquam erat volutpat. Sed imperdiet augue sit amet eros rhoncus egestas. Mauris mauris nunc, scelerisque eu dapibus
nec, hendrerit a dolor. Duis vel nisl porttitor, dictum nulla id, molestie lacus. Nulla vehicula placerat justo, vel semper
metus luctus sed. Cras blandit ultrices ipsum sed facilisis. Maecenas varius eros orci, sed mollis arcu finibus eu. Nullam
ut quam ut lorem rutrum cursus non sed massa. Nunc sed sollicitudin orci. Integer libero tellus, iaculis in orci ut, ornare
vehicula ante.
Quisque sit amet venenatis eros. Nulla vulputate pulvinar mauris. Vestibulum pulvinar erat varius sem vestibulum, at
tristique nisl dapibus. Morbi hendrerit nisi malesuada, feugiat justo vitae, sagittis orci. Nam quis laoreet quam, a
faucibus risus. Morbi egestas molestie odio quis elementum. Suspendisse iaculis nisi id risus vehicula convallis. Donec
tincidunt congue fringilla.
Maecenas varius eros orci, sed mollis arcu finibus eu. Nullam ut quam ut lorem rutrum cursus non sed massa. Nunc sed
sollicitudin orci. Integer libero tellus, iaculis in orci ut, ornare vehicula ante.
Official Research Paper
Lorem Ipsum Research Paper TitleLorem Ipsum Sub-Heading
115 West Allegan Suite 480 | Lansing, MI 48933 | crcmich.org pg. 1
29
Quantifying the Level of Gerrymandering in Michigan
When a map is gerrymandered, one party will win with several large margins (due to packing), and the other will win several districts by smaller margins (cracking). If the two groups are significantly different (meaning these differences have a low probability of occurring via chance), then the t-test indicates that there is a dif-ference in the typical margin of victory between the two parties. This allows the test to identify gerrymandered maps by comparing the districts won by each party.37
While similar to the mean-median test, the t-test fo-cuses on the difference between two parties and is better at pinpointing whether or not an advantage exists. In contrast, the mean-median test looks at the magnitude of the advantage or disad-vantage districts provide for either party. The t-test does have one of the same main problems as the mean-median test, as it is not able to differentiate between ad-vantages based on where people choose to live and those based on how the dis-tricts are drawn.
Simulated MapsAnother method used to predict gerrymandering is the use of simulations to create different iterations of po-tential maps. Because computers are able to generate maps based on specified criteria, political scientists can
determine what the outcome of elections would have been under hundreds of different but possible district schemes. These simulated results can be compared to the actual result to determine if the real map created a result that was strikingly different from the majority of other maps.
Using simulated maps to determine how biased the actual maps are is an important step for demonstrat-ing a gerrymander occurred. Unlike the other tests, simulated maps are able to directly demonstrate that political geography is not responsible for potential ger-
rymandering. By comparing to dozens or hundreds of other maps, it is possible to tell if the result is an outlier relative to other maps of the same state.
The difficulty with testing using simulated maps is the complexity in creating the maps themselves. Unlike the other metrics discussed, maps are not a simple formu-la that you can plug voting re-cords into; an algorithm has to be developed to generate
the maps. Systems can be designed to follow common redistricting criteria, but the algorithm designer has to choose how the system deals with conflicting criteria. This means results can very slightly, though over the course of hundreds of maps the variation will decrease.
While similar to the mean-median test, the t-test focuses on the dif-ference between two parties and is better at pinpointing whether or not an advantage exists. In contrast, the mean-median test looks at the magnitude of the ad-vantage or disadvantage districts provide for either party.

Lorem ipsum dolor sit amet, consectetur adipiscing elit. Maecenas ultrices mi velit, sit amet malesuada elit venenatis et.
Sed condimentum sodales justo, a molestie tortor mattis ut. Cras ornare rutrum lorem, a auctor sem hendrerit ac.
Quisque auctor eros eu dui pretium condimentum in in leo. Phasellus interdum tellus in elementum maximus. Quisque
ut condimentum nulla. Nunc lorem ligula, vehicula id pretium ut, gravida sit amet nunc.
Nam gravida turpis a nulla vehicula fringilla. Nam a luctus augue, nec ultrices est. Proin a feugiat massa, id vulputate
metus. Mauris id lacinia elit, et lobortis sem. Sed quis diam pulvinar, egestas urna at, mattis odio. Phasellus bibendum
nulla vitae maximus imperdiet. Vestibulum ac quam volutpat, commodo enim id, molestie tortor. Morbi dapibus dapibus
ornare. Pellentesque quis massa tellus. In interdum in lacus nec fermentum. Nullam ullamcorper euismod justo at
dictum. Phasellus aliquet ultrices dolor, vel tempor diam convallis quis. Vestibulum hendrerit dignissim enim nec
dapibus. Integer volutpat congue tincidunt. Vestibulum sed nunc leo.
Morbi sed sapien vitae urna pretium dignissim eu at sapien. Aliquam eu nisl volutpat, commodo mauris sed, pharetra
ante. Nulla lobortis lectus ac sem imperdiet, at fringilla ante commodo. Aliquam sed ullamcorper nisl. Nullam sollicitudin
dolor purus, nec cursus mauris mattis quis. Pellentesque consectetur tellus vel nisi elementum volutpat. Suspendisse
sed dolor sit amet libero tincidunt congue. In egestas libero neque, vel cursus dui blandit vel.
Quisque sit amet venenatis eros. Nulla vulputate pulvinar mauris. Vestibulum pulvinar erat varius sem vestibulum, at
tristique nisl dapibus. Morbi hendrerit nisi malesuada, feugiat justo vitae, sagittis orci. Nam quis laoreet quam, a
faucibus risus. Morbi egestas molestie odio quis elementum. Suspendisse iaculis nisi id risus vehicula convallis. Donec
tincidunt congue fringilla.
Aliquam erat volutpat. Sed imperdiet augue sit amet eros rhoncus egestas. Mauris mauris nunc, scelerisque eu dapibus
nec, hendrerit a dolor. Duis vel nisl porttitor, dictum nulla id, molestie lacus. Nulla vehicula placerat justo, vel semper
metus luctus sed. Cras blandit ultrices ipsum sed facilisis. Maecenas varius eros orci, sed mollis arcu finibus eu. Nullam
ut quam ut lorem rutrum cursus non sed massa. Nunc sed sollicitudin orci. Integer libero tellus, iaculis in orci ut, ornare
vehicula ante.
Quisque sit amet venenatis eros. Nulla vulputate pulvinar mauris. Vestibulum pulvinar erat varius sem vestibulum, at
tristique nisl dapibus. Morbi hendrerit nisi malesuada, feugiat justo vitae, sagittis orci. Nam quis laoreet quam, a
faucibus risus. Morbi egestas molestie odio quis elementum. Suspendisse iaculis nisi id risus vehicula convallis. Donec
tincidunt congue fringilla.
Maecenas varius eros orci, sed mollis arcu finibus eu. Nullam ut quam ut lorem rutrum cursus non sed massa. Nunc sed
sollicitudin orci. Integer libero tellus, iaculis in orci ut, ornare vehicula ante.
Official Research Paper
Lorem Ipsum Research Paper TitleLorem Ipsum Sub-Heading
115 West Allegan Suite 480 | Lansing, MI 48933 | crcmich.org pg. 1
30
Quantifying the Level of Gerrymandering in Michigan
Map 9 Michigan House District 76
Assessing Gerrymandering in MichiganMichigan’s current congressional districts would not seem to satisfy compactness principles, particularly in Southeastern Michigan (see Map 8). Several districts are long and narrow, such as District 5. The divisions in many counties also leave a question as to compact districts, as both Oakland and Wayne County are split into four districts, with only one of Wayne County’s districts entirely within the county. All of the represen-tatives for Oakland County represent part of at least one other county as well.
There are also numerous locations where you can move north, south, east, or west, cross district lines multiple times, and reenter the same district you were in before. One of the most glaring examples of this is in District 11 (the pale green district in Southeastern Michigan), where you can travel in a straight line east from one point in the district, cross into District 14 (the neighboring orange district), then into District 9 (the grey district), back into District 11, then back into District 9 again, and finally end up in District 11 one last time, yet you would never leave Oakland County. There are multiple other locations where a similar interaction occurs on the 2011 maps, while it does not occur in either the 1991 or 2001 map.
Multiple state legislative districts are claimed to be gerrymandered. House District 76 and Senate District 8 are examples where districts fail to meet traditional compactness standards. House District 76 (Map 9) wraps around the city of Grand Rapids; it covers a majority of the perimeter of the city, but in certain ar-eas the district is extremely narrow. It is argued that it resembles the original Massachusetts gerrymander as it wraps around an entire city, taking only small portions of the surrounding area. Senate District 8 (Map 10) covers a large portion of Macomb County. But at issue is how much of the county it interacts with; the district touches all four of the counties sides, and contains two opposite corners.
Map 8 Michigan Congressional Districts 2012-Present
Map 10 Senate District 8 and Macomb County
Lorem ipsum dolor sit amet, consectetur adipiscing elit. Maecenas ultrices mi velit, sit amet malesuada elit venenatis et.
Sed condimentum sodales justo, a molestie tortor mattis ut. Cras ornare rutrum lorem, a auctor sem hendrerit ac.
Quisque auctor eros eu dui pretium condimentum in in leo. Phasellus interdum tellus in elementum maximus. Quisque
ut condimentum nulla. Nunc lorem ligula, vehicula id pretium ut, gravida sit amet nunc.
Nam gravida turpis a nulla vehicula fringilla. Nam a luctus augue, nec ultrices est. Proin a feugiat massa, id vulputate
metus. Mauris id lacinia elit, et lobortis sem. Sed quis diam pulvinar, egestas urna at, mattis odio. Phasellus bibendum
nulla vitae maximus imperdiet. Vestibulum ac quam volutpat, commodo enim id, molestie tortor. Morbi dapibus dapibus
ornare. Pellentesque quis massa tellus. In interdum in lacus nec fermentum. Nullam ullamcorper euismod justo at
dictum. Phasellus aliquet ultrices dolor, vel tempor diam convallis quis. Vestibulum hendrerit dignissim enim nec
dapibus. Integer volutpat congue tincidunt. Vestibulum sed nunc leo.
Morbi sed sapien vitae urna pretium dignissim eu at sapien. Aliquam eu nisl volutpat, commodo mauris sed, pharetra
ante. Nulla lobortis lectus ac sem imperdiet, at fringilla ante commodo. Aliquam sed ullamcorper nisl. Nullam sollicitudin
dolor purus, nec cursus mauris mattis quis. Pellentesque consectetur tellus vel nisi elementum volutpat. Suspendisse
sed dolor sit amet libero tincidunt congue. In egestas libero neque, vel cursus dui blandit vel.
Quisque sit amet venenatis eros. Nulla vulputate pulvinar mauris. Vestibulum pulvinar erat varius sem vestibulum, at
tristique nisl dapibus. Morbi hendrerit nisi malesuada, feugiat justo vitae, sagittis orci. Nam quis laoreet quam, a
faucibus risus. Morbi egestas molestie odio quis elementum. Suspendisse iaculis nisi id risus vehicula convallis. Donec
tincidunt congue fringilla.
Aliquam erat volutpat. Sed imperdiet augue sit amet eros rhoncus egestas. Mauris mauris nunc, scelerisque eu dapibus
nec, hendrerit a dolor. Duis vel nisl porttitor, dictum nulla id, molestie lacus. Nulla vehicula placerat justo, vel semper
metus luctus sed. Cras blandit ultrices ipsum sed facilisis. Maecenas varius eros orci, sed mollis arcu finibus eu. Nullam
ut quam ut lorem rutrum cursus non sed massa. Nunc sed sollicitudin orci. Integer libero tellus, iaculis in orci ut, ornare
vehicula ante.
Quisque sit amet venenatis eros. Nulla vulputate pulvinar mauris. Vestibulum pulvinar erat varius sem vestibulum, at
tristique nisl dapibus. Morbi hendrerit nisi malesuada, feugiat justo vitae, sagittis orci. Nam quis laoreet quam, a
faucibus risus. Morbi egestas molestie odio quis elementum. Suspendisse iaculis nisi id risus vehicula convallis. Donec
tincidunt congue fringilla.
Maecenas varius eros orci, sed mollis arcu finibus eu. Nullam ut quam ut lorem rutrum cursus non sed massa. Nunc sed
sollicitudin orci. Integer libero tellus, iaculis in orci ut, ornare vehicula ante.
Official Research Paper
Lorem Ipsum Research Paper TitleLorem Ipsum Sub-Heading
115 West Allegan Suite 480 | Lansing, MI 48933 | crcmich.org pg. 1
31
Quantifying the Level of Gerrymandering in Michigan
But oddly shaped districts are not enough to demon-strate gerrymandering. As discussed earlier, maintain-ing compliance with the Voting Rights Act, a particular concern for districts in the Detroit area, can lead to dif-ficult choices on how boundaries look. More evidence is needed beyond the shape of the districts.
Efficiency GapMichigan’s legislative and congressional districts exhibit extreme values with the efficiency gap, which is suggestive of gerrymandering. In Stephanopou-los and McGhee’s original analysis based on 2012 election results, Michigan was one of seven states where congressional districts exceeded the proposed acceptable level,b and one of 13 states where state house districts exceeded the recommended maximum efficiency gap.38 Michigan was one of only four states (along with Florida, North Carolina, and Ohio) where both legislative and congressional maps were graded as extreme.
It is plausible that part of Michigan’s large efficiency gap is due to a natural sorting of its population. When a large population in a compact area tend to vote a similar way, districts in that region tend to be naturally packed. This can make it difficult to draw maps that do not produce an artificial advantage. As a result, cities like Detroit, which tends to lean heavily Democratic, can create a natural bias against a party. Some have argued that data that shows an advantage for Repub-licans in the state is due to this natural sorting. There is some truth to these concerns, but the efficiency gap for recent elections, (see Table 2, see page 32), shows that natural sorting is likely not the sole cause of Michigan’s large efficiency gap (in addition to evidence from simulated maps, discussed below).39
b It is important to note that, in the original analysis by Stepha-nopoulos and McGhee, they classified Michigan’s congres-sional maps as extreme, but not necessarily persistent. In essence, with only one elections worth of data at the time of writing, there was not enough evidence at the time to con-clude Michigan’s efficiency gap could not reach 0 in the ten year period through natural fluctuation. Since that writing, a report published by the Brennan Center has concluded, us-ing election results through the 2016 election, that Michigan’s congressional districts have demonstrated a persistent parti-san bias. That study can be found here: https://www.politico.com/f/?id=0000015c-11a2-d46a-a3ff-9da240e10002.
For the last 20 years of elections held under each map (State House, State Senate, and Congressional), Table 2 has an efficiency gap number for each type of elec-tion calculated using Secretary of State voter data. In the table, a negative number indicates an advantage for Democrats, and a positive number indicates an advantage for Republicans. The larger the result of the efficiency gap, the larger bias that is produced.
A map that produces no partisan bias from year to year is extremely unlikely; small fluctuations occur fairly of-ten, particularly for Congressional districts which have less than 20 seats up for competitive elections each year. Additionally, the political climate can influence the outcome; in years where one party exhibits stron-ger than typical turnout, the efficiency gap does show some variation. The original creators of the efficiency gap recommended any score above an absolute value of 8 would signal partisan bias beyond variability for state legislative districts (so in the table above, anything below -8 and above 8).
For congressional districts, any score that would rep-resent two districts worth of votes would be considered extreme gerrymandering. This would represent about 12.5 percent for the maps for the 1990s, 13.3 for 2000s, and 14.3 for 2010s. The efficiency gap is calculated this way so the metric can be compared across states in terms of effect on the U.S. House.
The efficiency gap shows that in most years for the state under each of the two most recent maps, Re-publicans have had a significant electoral advantage. The efficiency gap does follow electoral trends to an extent; in years Republicans fared better at the polls nationally (such as 2004 and 2010), the efficiency gap numbers were lower. This is due to a higher proportion of the swing vote or higher turnout in those years, in-creasing Republican advantages, and few seats flipped from one party to another. In years where Democrats did better nationally, the efficiency gap increased sig-nificantly, as more Democrats were showing up to the polls, while few seats were changed from one party to another.
The 2006 election, which shows a large increase in the efficiency gap for the Congressional and State Senate map, demonstrates this particularly well. Democrats

Lorem ipsum dolor sit amet, consectetur adipiscing elit. Maecenas ultrices mi velit, sit amet malesuada elit venenatis et.
Sed condimentum sodales justo, a molestie tortor mattis ut. Cras ornare rutrum lorem, a auctor sem hendrerit ac.
Quisque auctor eros eu dui pretium condimentum in in leo. Phasellus interdum tellus in elementum maximus. Quisque
ut condimentum nulla. Nunc lorem ligula, vehicula id pretium ut, gravida sit amet nunc.
Nam gravida turpis a nulla vehicula fringilla. Nam a luctus augue, nec ultrices est. Proin a feugiat massa, id vulputate
metus. Mauris id lacinia elit, et lobortis sem. Sed quis diam pulvinar, egestas urna at, mattis odio. Phasellus bibendum
nulla vitae maximus imperdiet. Vestibulum ac quam volutpat, commodo enim id, molestie tortor. Morbi dapibus dapibus
ornare. Pellentesque quis massa tellus. In interdum in lacus nec fermentum. Nullam ullamcorper euismod justo at
dictum. Phasellus aliquet ultrices dolor, vel tempor diam convallis quis. Vestibulum hendrerit dignissim enim nec
dapibus. Integer volutpat congue tincidunt. Vestibulum sed nunc leo.
Morbi sed sapien vitae urna pretium dignissim eu at sapien. Aliquam eu nisl volutpat, commodo mauris sed, pharetra
ante. Nulla lobortis lectus ac sem imperdiet, at fringilla ante commodo. Aliquam sed ullamcorper nisl. Nullam sollicitudin
dolor purus, nec cursus mauris mattis quis. Pellentesque consectetur tellus vel nisi elementum volutpat. Suspendisse
sed dolor sit amet libero tincidunt congue. In egestas libero neque, vel cursus dui blandit vel.
Quisque sit amet venenatis eros. Nulla vulputate pulvinar mauris. Vestibulum pulvinar erat varius sem vestibulum, at
tristique nisl dapibus. Morbi hendrerit nisi malesuada, feugiat justo vitae, sagittis orci. Nam quis laoreet quam, a
faucibus risus. Morbi egestas molestie odio quis elementum. Suspendisse iaculis nisi id risus vehicula convallis. Donec
tincidunt congue fringilla.
Aliquam erat volutpat. Sed imperdiet augue sit amet eros rhoncus egestas. Mauris mauris nunc, scelerisque eu dapibus
nec, hendrerit a dolor. Duis vel nisl porttitor, dictum nulla id, molestie lacus. Nulla vehicula placerat justo, vel semper
metus luctus sed. Cras blandit ultrices ipsum sed facilisis. Maecenas varius eros orci, sed mollis arcu finibus eu. Nullam
ut quam ut lorem rutrum cursus non sed massa. Nunc sed sollicitudin orci. Integer libero tellus, iaculis in orci ut, ornare
vehicula ante.
Quisque sit amet venenatis eros. Nulla vulputate pulvinar mauris. Vestibulum pulvinar erat varius sem vestibulum, at
tristique nisl dapibus. Morbi hendrerit nisi malesuada, feugiat justo vitae, sagittis orci. Nam quis laoreet quam, a
faucibus risus. Morbi egestas molestie odio quis elementum. Suspendisse iaculis nisi id risus vehicula convallis. Donec
tincidunt congue fringilla.
Maecenas varius eros orci, sed mollis arcu finibus eu. Nullam ut quam ut lorem rutrum cursus non sed massa. Nunc sed
sollicitudin orci. Integer libero tellus, iaculis in orci ut, ornare vehicula ante.
Official Research Paper
Lorem Ipsum Research Paper TitleLorem Ipsum Sub-Heading
115 West Allegan Suite 480 | Lansing, MI 48933 | crcmich.org pg. 1
32
Quantifying the Level of Gerrymandering in Michigan
nationally flipped five U.S. Senate seats, 31 U.S. House seats, and six governorships, as part of an extremely large swing year. Yet, despite the fact that more than 54 percent of the two-party vote share was cast for Democratic candidates (when the previous year Re-publicans received a majority of state Senate votes), Republicans maintained control of the state Senate with 22 of 38 seats, losing only one seat they previ-ously controlled. This was in part due to competitive races. Of the eight races within a 10 percent margin, seven were won by Republicans (all eight seats were previously held by Republicans). Despite a net 10 point swing in the polls from 2002 to 2006, Democrats gained just a singular additional seat. An eight point swing in the other direction (2010 relative to 2002 data) Republicans gained an additional four seats. This indi-cates that the large efficiency gap number shown for 2006 lines up with a potential asymmetry in the maps.
While the State House did change control during the decade (Republicans were in control until 2006, and regained control in 2010), the efficiency gap shows extremely high results for the first year the majority changed. In state house elections, Democrats state-wide won about 54 percent of the two party vote, yet won 56 of 110 seats (a two vote majority).
The data also shows another strong indicator that maps were gerrymandered; in years immediately after the implementation of the district maps drawn in 2011, the efficiency gap values see sizable increases. The congressional efficiency gap, while elevated under the maps issued in 2001, was at 5.6 in 2010. It more
than tripled in 2012, the first election using the current maps, to 20.4 percent. That is about three districts worth of wasted votes cast for Democrats more than wasted votes cast for Republicans. The level has de-clined slightly over the elections since, but was still at a margin larger than two seats, at 14.6, in 2016. The persistent increase in the efficiency gap for congres-sional districts in the most recent cycle casts significant doubt on the theory that Michigan’s efficiency gap is due to a natural sorting issue.
It is important to note that Michigan lost a congressional seat in the apportionment process for the 2000 maps and the 2010 maps. This forced some level of change in the state, as each redistricting process had to find a way to draw the same state into fewer districts. This means that some of the change in efficiency gap levels for congressional districts when maps changed could be attributed to the loss of a seat.
State house districts do not have the limitation of los-ing a seat, and also exhibit an increased efficiency gap when maps change. The two largest single-year efficiency gaps over the last 10 house election cycles occurred in 2012 and 2014, at 14 and 13.3 respectively, and the results from 2016 were in line with early 2000s levels. Because partisan gerrymanders are inherently unstable (see Box 5), an efficiency gap registering that high in the middle of the decade does provide another indicator of gerrymandering.
The state senate maps are a little more difficult to judge. Because Michigan’s state senate elections are
Table 2 Michigan’s Efficiency Gap for Congressional and Legislative Districts, 1998-2016
1998 2000 2002 2004 2006 2008 2010 2012 2014 2016Congress -9.7 6.6 15.2 11.5 23.5 8.0 5.6 19.7 17.6 14.6MI House 8.1 11.9 11.0 9.7 11.6 8.2 5.8 13.6 13.3 10.1MI Senate 9.6 10.2 18.5 14.7 22.6
*See Appendix A for a discussion of the effects on the efficiency gap values of uncontested elections.
Note: The efficiency gap calculates the frequency that a party ‘wastes’ votes. A wasted vote, according to the method, is a vote cast for a party that is not helpful in putting the candidate past 50 percent of the two-party share of votes. Any vote cast for a losing candidate, and any vote cast for a candidate after they receive a majority of the two-party vote share, is considered wasted by the metric. Each party’s total wasted votes for an office type (congressional, state house, or state senate) would then be summed and the difference is taken and divided by the total votes cast to create a metric that can be compared across different states and years. The original creators of the efficiency gap recommended any score above an absolute value of eight would signal partisan bias beyond variability for state leg-islative districts, and any value beyond the equivalent of two seats worth of votes for congressional districts, would signify partisan bias.
Source: Michigan Secretary of State voting data, Citizens Research Council calculations.

Lorem ipsum dolor sit amet, consectetur adipiscing elit. Maecenas ultrices mi velit, sit amet malesuada elit venenatis et.
Sed condimentum sodales justo, a molestie tortor mattis ut. Cras ornare rutrum lorem, a auctor sem hendrerit ac.
Quisque auctor eros eu dui pretium condimentum in in leo. Phasellus interdum tellus in elementum maximus. Quisque
ut condimentum nulla. Nunc lorem ligula, vehicula id pretium ut, gravida sit amet nunc.
Nam gravida turpis a nulla vehicula fringilla. Nam a luctus augue, nec ultrices est. Proin a feugiat massa, id vulputate
metus. Mauris id lacinia elit, et lobortis sem. Sed quis diam pulvinar, egestas urna at, mattis odio. Phasellus bibendum
nulla vitae maximus imperdiet. Vestibulum ac quam volutpat, commodo enim id, molestie tortor. Morbi dapibus dapibus
ornare. Pellentesque quis massa tellus. In interdum in lacus nec fermentum. Nullam ullamcorper euismod justo at
dictum. Phasellus aliquet ultrices dolor, vel tempor diam convallis quis. Vestibulum hendrerit dignissim enim nec
dapibus. Integer volutpat congue tincidunt. Vestibulum sed nunc leo.
Morbi sed sapien vitae urna pretium dignissim eu at sapien. Aliquam eu nisl volutpat, commodo mauris sed, pharetra
ante. Nulla lobortis lectus ac sem imperdiet, at fringilla ante commodo. Aliquam sed ullamcorper nisl. Nullam sollicitudin
dolor purus, nec cursus mauris mattis quis. Pellentesque consectetur tellus vel nisi elementum volutpat. Suspendisse
sed dolor sit amet libero tincidunt congue. In egestas libero neque, vel cursus dui blandit vel.
Quisque sit amet venenatis eros. Nulla vulputate pulvinar mauris. Vestibulum pulvinar erat varius sem vestibulum, at
tristique nisl dapibus. Morbi hendrerit nisi malesuada, feugiat justo vitae, sagittis orci. Nam quis laoreet quam, a
faucibus risus. Morbi egestas molestie odio quis elementum. Suspendisse iaculis nisi id risus vehicula convallis. Donec
tincidunt congue fringilla.
Aliquam erat volutpat. Sed imperdiet augue sit amet eros rhoncus egestas. Mauris mauris nunc, scelerisque eu dapibus
nec, hendrerit a dolor. Duis vel nisl porttitor, dictum nulla id, molestie lacus. Nulla vehicula placerat justo, vel semper
metus luctus sed. Cras blandit ultrices ipsum sed facilisis. Maecenas varius eros orci, sed mollis arcu finibus eu. Nullam
ut quam ut lorem rutrum cursus non sed massa. Nunc sed sollicitudin orci. Integer libero tellus, iaculis in orci ut, ornare
vehicula ante.
Quisque sit amet venenatis eros. Nulla vulputate pulvinar mauris. Vestibulum pulvinar erat varius sem vestibulum, at
tristique nisl dapibus. Morbi hendrerit nisi malesuada, feugiat justo vitae, sagittis orci. Nam quis laoreet quam, a
faucibus risus. Morbi egestas molestie odio quis elementum. Suspendisse iaculis nisi id risus vehicula convallis. Donec
tincidunt congue fringilla.
Maecenas varius eros orci, sed mollis arcu finibus eu. Nullam ut quam ut lorem rutrum cursus non sed massa. Nunc sed
sollicitudin orci. Integer libero tellus, iaculis in orci ut, ornare vehicula ante.
Official Research Paper
Lorem Ipsum Research Paper TitleLorem Ipsum Sub-Heading
115 West Allegan Suite 480 | Lansing, MI 48933 | crcmich.org pg. 1
33
Quantifying the Level of Gerrymandering in Michigan
held every four years, data on these maps is available half as often as it is for house races. With 2014 being the only senate election held under the current maps (as of this writing), there is less data for state senate elections than state house or congressional district maps. That being said, 2014 showed an increase in the efficiency gap of almost eight points, and given trends in other districts, there is reason to believe at least some gerrymandering is present in the state sen-ate districts as well.
While this data shows extreme levels of partisan gerrymandering, there is also merit to considering Michigan’s political geography. Michigan’s demo-graphics likely create a level of partisan advantage for Republicans in the state, but the data in Table 2 shows that measures like the efficiency gap tend to increase drastically the first few years after new district maps are in effect. This is an indication that political geography might not be a factor, as the efficiency gap increases with a change in the maps, while the political geography of the state stays mostly the same.
Mean-Median TestOther measures, like the mean-median indicator, show similar trends. Across the nation, the average for non-skewed states (or states without severe partisan disadvantage) in 2012 was a 1.9 percent advantage for Republicans, according to an analysis by Samuel Wang, a professor at Princeton. Michigan is one of five states whose most recent district maps were graded
as skewed based on the measure.40 Table 3 shows Michigan’s mean-median scores from the last 20 years of elections, and the trend in mean-median skew shows similar issues to the efficiency gap.
A negative mean-median score means the party’s median vote share in the type of district was lower than its average, indicating that the party was at a disadvantage, as it had more districts with a lower share of voters than would be expected. A positive score indicates the median was higher than the mean, indicating that the party did better in a larger number of districts than expected by statewide votes cast.
Under the two most recent district maps drawn, Re-publicans have consistently had an advantage in the distribution of their voters, while Democrats have been consistently disadvantaged by the layout of their voters. The skew shown was stronger in the early elections under the 2001 maps, with the difference between the mean and median for both parties at more than 10 per-cent for congressional candidates, with an advantage for Republicans and disadvantage for Democrats.
The changes in the mean-median values across map cycles (for congressional districts from 2000 to 2002, and in all districts from 2010 to 2012), in particular, demonstrate large increases in skew when a new map is introduced. This indicates that in the first year each set of district maps was implemented, districts showed much stronger signs of gerrymandering than they did at the end of the previous map cycle. As discussed with
Table 3 Michigan’s Mean-Median Difference for Congressional and Legislative Districts, 1998-2016
1998 2000 2002 2004 2006 2008 2010 2012 2014 2016
CongressRepublicans -5.0 -4.0 12.4 10.3 10.1 3.9 1.6 6.3 7.4 7.8Democrats 5.1 4.4 -12.0 -10.2 -9.8 -5.0 -5.4 -6.9 -8.4 -7.8
MI HouseRepublicans 4.1 7.4 5.9 6.0 5.3 0.4 4.0 6.9 5.4 5.9Democrats -5.0 -7.3 -6.4 -5.2 -4.6 0.4 -3.5 -6.5 -6.1 -5.6
MI SenateRepublicans 7.7 5.6 7.0 3.3 7.5Democrats -6.7 -5.3 -7.5 -8.6 -6.8
Note: The mean-median test is a simple way to determine if a dataset is skewed, or not distributed normally across the average. To apply this test, the average vote share for a party across the state is subtracted from its vote share in the median district. A positive number (indicating a higher median) is evidence that the party had an electoral advantage from the redistricting scheme, while a nega-tive result would indicate a party was hindered by the scheme.
Source: Michigan Secretary of State voting data, Citizens Research Council calculations.

Lorem ipsum dolor sit amet, consectetur adipiscing elit. Maecenas ultrices mi velit, sit amet malesuada elit venenatis et.
Sed condimentum sodales justo, a molestie tortor mattis ut. Cras ornare rutrum lorem, a auctor sem hendrerit ac.
Quisque auctor eros eu dui pretium condimentum in in leo. Phasellus interdum tellus in elementum maximus. Quisque
ut condimentum nulla. Nunc lorem ligula, vehicula id pretium ut, gravida sit amet nunc.
Nam gravida turpis a nulla vehicula fringilla. Nam a luctus augue, nec ultrices est. Proin a feugiat massa, id vulputate
metus. Mauris id lacinia elit, et lobortis sem. Sed quis diam pulvinar, egestas urna at, mattis odio. Phasellus bibendum
nulla vitae maximus imperdiet. Vestibulum ac quam volutpat, commodo enim id, molestie tortor. Morbi dapibus dapibus
ornare. Pellentesque quis massa tellus. In interdum in lacus nec fermentum. Nullam ullamcorper euismod justo at
dictum. Phasellus aliquet ultrices dolor, vel tempor diam convallis quis. Vestibulum hendrerit dignissim enim nec
dapibus. Integer volutpat congue tincidunt. Vestibulum sed nunc leo.
Morbi sed sapien vitae urna pretium dignissim eu at sapien. Aliquam eu nisl volutpat, commodo mauris sed, pharetra
ante. Nulla lobortis lectus ac sem imperdiet, at fringilla ante commodo. Aliquam sed ullamcorper nisl. Nullam sollicitudin
dolor purus, nec cursus mauris mattis quis. Pellentesque consectetur tellus vel nisi elementum volutpat. Suspendisse
sed dolor sit amet libero tincidunt congue. In egestas libero neque, vel cursus dui blandit vel.
Quisque sit amet venenatis eros. Nulla vulputate pulvinar mauris. Vestibulum pulvinar erat varius sem vestibulum, at
tristique nisl dapibus. Morbi hendrerit nisi malesuada, feugiat justo vitae, sagittis orci. Nam quis laoreet quam, a
faucibus risus. Morbi egestas molestie odio quis elementum. Suspendisse iaculis nisi id risus vehicula convallis. Donec
tincidunt congue fringilla.
Aliquam erat volutpat. Sed imperdiet augue sit amet eros rhoncus egestas. Mauris mauris nunc, scelerisque eu dapibus
nec, hendrerit a dolor. Duis vel nisl porttitor, dictum nulla id, molestie lacus. Nulla vehicula placerat justo, vel semper
metus luctus sed. Cras blandit ultrices ipsum sed facilisis. Maecenas varius eros orci, sed mollis arcu finibus eu. Nullam
ut quam ut lorem rutrum cursus non sed massa. Nunc sed sollicitudin orci. Integer libero tellus, iaculis in orci ut, ornare
vehicula ante.
Quisque sit amet venenatis eros. Nulla vulputate pulvinar mauris. Vestibulum pulvinar erat varius sem vestibulum, at
tristique nisl dapibus. Morbi hendrerit nisi malesuada, feugiat justo vitae, sagittis orci. Nam quis laoreet quam, a
faucibus risus. Morbi egestas molestie odio quis elementum. Suspendisse iaculis nisi id risus vehicula convallis. Donec
tincidunt congue fringilla.
Maecenas varius eros orci, sed mollis arcu finibus eu. Nullam ut quam ut lorem rutrum cursus non sed massa. Nunc sed
sollicitudin orci. Integer libero tellus, iaculis in orci ut, ornare vehicula ante.
Official Research Paper
Lorem Ipsum Research Paper TitleLorem Ipsum Sub-Heading
115 West Allegan Suite 480 | Lansing, MI 48933 | crcmich.org pg. 1
34
Quantifying the Level of Gerrymandering in Michigan
the efficiency gap, this in particular calls into question claims that the map is biased solely based on political geography, as the state’s distribution in population is unlikely to shift to that level between election cycles. Some of that variance can be due to changes in the political climate and strong or weak candidates in some districts, but those changes are unlikely to be responsible for that large of a change (particularly for the congressional maps).
T-TestThe t-test is the final metric used to analyze Michigan electoral districts (see Table 4). The number shown is the p-value, or the probability of obtaining a set of voting results at least as extreme as the one observed if there were no differences between the two sets of districts (those won by Republicans and those won by Democrats).
If the two parties are treated the same in the redistrict-ing process, the margin of victories for each party would come from the same bell curve (see Chart 5, page 28), as the results should be randomly generated from equal footing. No matter how many districts each party wins, the average percentage of votes each receives in districts they win should be relatively close to each other (i.e. both parties should have some close wins and some landslide wins) because the districts should be drawn independent of partisan bias. If one party has all landslide wins, and the other party has all close wins, there might be evidence that something inten-tional (whether it was gerrymandering or populations self-sorting) caused those groupings to occur.
The t-test tries to calculate the probability that the dif-ference in each parties’ margin of victory would occur randomly. The test looks at the group averages and standard deviations (a number that quantifies how much a group varies internally) to determine the prob-ability that the election results were based on a random occurrence. The lower the number is, the less likely it is that the differences in margin of victory occurred by random chance. Any results below .05, or a 5 percent chance of the difference occurring randomly from the same group, is considered to be statistically significant evidence that there is a difference.
The t-test shows that, in all but a handful of instances, there is a statistically significant difference between the groups of districts won by each party. For Congressio-nal races, the first three elections after each map was implemented resulted in a biased outcome according to the t-test. The only outlier of the group was 2010, where the t-test had a higher result (meaning that the groups won by each party most closely resembled each other) than any other year; this was due to a handful of close elections, with Democrats winning two competitive districts and winning two districts with 80 percent of the vote, while Republicans had one win in a competitive district and one in a district with more than 70 percent of the vote.
The t-test showed that state House results showed a difference between Democrat and Republican results in all elections, and a difference in Senate results for all elections after the 1998 election.
Table 4 Michigan’s T-Test Results
1998 2000 2002 2004 2006 2008 2010 2012 2014 2016Congress 0.195 0.060 0.004 0.005 0.000 0.055 0.394 0.002 0.005 0.009MI House 0.000 0.000 0.000 0.000 0.000 0.000 0.037 0.000 0.000 0.000MI Senate 0.069 0.019 0.000 0.006 0.000
Note: The T-Test is a statistical method to determine if two groups are likely to be assigned randomly from the same population. Districts are split based on the winning party, and given a value equal to the winner’s vote share. The test then determines the probability that the two groups of districts are statistically similar, or if they are distinct groups. Any results below .05, or 5 percent chance of the difference occurring randomly from the same group, is considered to be statistically significant evidence that the two populations are distinct.
Source: Michigan Secretary of State voting data, Citizens Research Council calculations.

Lorem ipsum dolor sit amet, consectetur adipiscing elit. Maecenas ultrices mi velit, sit amet malesuada elit venenatis et.
Sed condimentum sodales justo, a molestie tortor mattis ut. Cras ornare rutrum lorem, a auctor sem hendrerit ac.
Quisque auctor eros eu dui pretium condimentum in in leo. Phasellus interdum tellus in elementum maximus. Quisque
ut condimentum nulla. Nunc lorem ligula, vehicula id pretium ut, gravida sit amet nunc.
Nam gravida turpis a nulla vehicula fringilla. Nam a luctus augue, nec ultrices est. Proin a feugiat massa, id vulputate
metus. Mauris id lacinia elit, et lobortis sem. Sed quis diam pulvinar, egestas urna at, mattis odio. Phasellus bibendum
nulla vitae maximus imperdiet. Vestibulum ac quam volutpat, commodo enim id, molestie tortor. Morbi dapibus dapibus
ornare. Pellentesque quis massa tellus. In interdum in lacus nec fermentum. Nullam ullamcorper euismod justo at
dictum. Phasellus aliquet ultrices dolor, vel tempor diam convallis quis. Vestibulum hendrerit dignissim enim nec
dapibus. Integer volutpat congue tincidunt. Vestibulum sed nunc leo.
Morbi sed sapien vitae urna pretium dignissim eu at sapien. Aliquam eu nisl volutpat, commodo mauris sed, pharetra
ante. Nulla lobortis lectus ac sem imperdiet, at fringilla ante commodo. Aliquam sed ullamcorper nisl. Nullam sollicitudin
dolor purus, nec cursus mauris mattis quis. Pellentesque consectetur tellus vel nisi elementum volutpat. Suspendisse
sed dolor sit amet libero tincidunt congue. In egestas libero neque, vel cursus dui blandit vel.
Quisque sit amet venenatis eros. Nulla vulputate pulvinar mauris. Vestibulum pulvinar erat varius sem vestibulum, at
tristique nisl dapibus. Morbi hendrerit nisi malesuada, feugiat justo vitae, sagittis orci. Nam quis laoreet quam, a
faucibus risus. Morbi egestas molestie odio quis elementum. Suspendisse iaculis nisi id risus vehicula convallis. Donec
tincidunt congue fringilla.
Aliquam erat volutpat. Sed imperdiet augue sit amet eros rhoncus egestas. Mauris mauris nunc, scelerisque eu dapibus
nec, hendrerit a dolor. Duis vel nisl porttitor, dictum nulla id, molestie lacus. Nulla vehicula placerat justo, vel semper
metus luctus sed. Cras blandit ultrices ipsum sed facilisis. Maecenas varius eros orci, sed mollis arcu finibus eu. Nullam
ut quam ut lorem rutrum cursus non sed massa. Nunc sed sollicitudin orci. Integer libero tellus, iaculis in orci ut, ornare
vehicula ante.
Quisque sit amet venenatis eros. Nulla vulputate pulvinar mauris. Vestibulum pulvinar erat varius sem vestibulum, at
tristique nisl dapibus. Morbi hendrerit nisi malesuada, feugiat justo vitae, sagittis orci. Nam quis laoreet quam, a
faucibus risus. Morbi egestas molestie odio quis elementum. Suspendisse iaculis nisi id risus vehicula convallis. Donec
tincidunt congue fringilla.
Maecenas varius eros orci, sed mollis arcu finibus eu. Nullam ut quam ut lorem rutrum cursus non sed massa. Nunc sed
sollicitudin orci. Integer libero tellus, iaculis in orci ut, ornare vehicula ante.
Official Research Paper
Lorem Ipsum Research Paper TitleLorem Ipsum Sub-Heading
115 West Allegan Suite 480 | Lansing, MI 48933 | crcmich.org pg. 1
35
Quantifying the Level of Gerrymandering in Michigan
All three metrics show increased indications of gerry-mandering when the 2011 districts were implemented, and moderate increases in the level of gerrymandering when the maps drawn in 2001 were implemented.
Simulated MappingWhile each of these tests serve as an indicator, the metrics are unable to separate natural causes of pack-ing and cracking (particularly the natural sorting of voters) from intentional gerrymandering. This makes comparing actual results to simulated maps a particu-larly important method for determining whether partisan gerrymandering is present in a map, as comparing actual results to simulated maps directly accounts for the distribution of the population. While this level of analysis is beyond the scope of this paper, some social scientists have looked into the issue.
Jowei Chen, a professor at the University of Michigan, and David Cottrell, a professor at Dartmouth, created an algorithm to simulate 200 maps for each state with more than one congressional district. The algorithm was designed to draw compact, contiguous districts of equal population, which maintained the current require-ments for redistricting most states impose except for the use of local boundaries. Using data from the 2008 presidential election, the researchers simulated the outcome of each district created with the mapping al-gorithm, then compared those districts with the current maps. The results showed that Michigan had a slight to moderate bias in favor of Republican candidates.41 This would indicate that, while some of Michigan’s bias may be explained by political geography, there are other factors beyond political geography that could have influenced the maps.
ConclusionThe U.S. Supreme Court’s rulings in Gill and Benisek leave the question of how courts will treat gerrymander-ing cases in the future open. While the Court delayed ruling on the merits of either case, it is likely that the Court will have to address partisan gerrymandering claims in the near future. But the Court is not the only place this discussion will be had.
How to manage partisan gerrymandering is something that Michigan citizens in will likely have to decide.
Because Michigan’s redistricting laws were voided in the 1980s, the legislature and governor are only bound by federal rules. While each statistical measure has potential flaws and limitations, the efficiency gap, mean-median test, t-test, and simulations of alterna-tive maps for the state of Michigan all indicate that the state has experienced at least a moderate level of gerrymandering over the last two cycles.

Lorem ipsum dolor sit amet, consectetur adipiscing elit. Maecenas ultrices mi velit, sit amet malesuada elit venenatis et.
Sed condimentum sodales justo, a molestie tortor mattis ut. Cras ornare rutrum lorem, a auctor sem hendrerit ac.
Quisque auctor eros eu dui pretium condimentum in in leo. Phasellus interdum tellus in elementum maximus. Quisque
ut condimentum nulla. Nunc lorem ligula, vehicula id pretium ut, gravida sit amet nunc.
Nam gravida turpis a nulla vehicula fringilla. Nam a luctus augue, nec ultrices est. Proin a feugiat massa, id vulputate
metus. Mauris id lacinia elit, et lobortis sem. Sed quis diam pulvinar, egestas urna at, mattis odio. Phasellus bibendum
nulla vitae maximus imperdiet. Vestibulum ac quam volutpat, commodo enim id, molestie tortor. Morbi dapibus dapibus
ornare. Pellentesque quis massa tellus. In interdum in lacus nec fermentum. Nullam ullamcorper euismod justo at
dictum. Phasellus aliquet ultrices dolor, vel tempor diam convallis quis. Vestibulum hendrerit dignissim enim nec
dapibus. Integer volutpat congue tincidunt. Vestibulum sed nunc leo.
Morbi sed sapien vitae urna pretium dignissim eu at sapien. Aliquam eu nisl volutpat, commodo mauris sed, pharetra
ante. Nulla lobortis lectus ac sem imperdiet, at fringilla ante commodo. Aliquam sed ullamcorper nisl. Nullam sollicitudin
dolor purus, nec cursus mauris mattis quis. Pellentesque consectetur tellus vel nisi elementum volutpat. Suspendisse
sed dolor sit amet libero tincidunt congue. In egestas libero neque, vel cursus dui blandit vel.
Quisque sit amet venenatis eros. Nulla vulputate pulvinar mauris. Vestibulum pulvinar erat varius sem vestibulum, at
tristique nisl dapibus. Morbi hendrerit nisi malesuada, feugiat justo vitae, sagittis orci. Nam quis laoreet quam, a
faucibus risus. Morbi egestas molestie odio quis elementum. Suspendisse iaculis nisi id risus vehicula convallis. Donec
tincidunt congue fringilla.
Aliquam erat volutpat. Sed imperdiet augue sit amet eros rhoncus egestas. Mauris mauris nunc, scelerisque eu dapibus
nec, hendrerit a dolor. Duis vel nisl porttitor, dictum nulla id, molestie lacus. Nulla vehicula placerat justo, vel semper
metus luctus sed. Cras blandit ultrices ipsum sed facilisis. Maecenas varius eros orci, sed mollis arcu finibus eu. Nullam
ut quam ut lorem rutrum cursus non sed massa. Nunc sed sollicitudin orci. Integer libero tellus, iaculis in orci ut, ornare
vehicula ante.
Quisque sit amet venenatis eros. Nulla vulputate pulvinar mauris. Vestibulum pulvinar erat varius sem vestibulum, at
tristique nisl dapibus. Morbi hendrerit nisi malesuada, feugiat justo vitae, sagittis orci. Nam quis laoreet quam, a
faucibus risus. Morbi egestas molestie odio quis elementum. Suspendisse iaculis nisi id risus vehicula convallis. Donec
tincidunt congue fringilla.
Maecenas varius eros orci, sed mollis arcu finibus eu. Nullam ut quam ut lorem rutrum cursus non sed massa. Nunc sed
sollicitudin orci. Integer libero tellus, iaculis in orci ut, ornare vehicula ante.
Official Research Paper
Lorem Ipsum Research Paper TitleLorem Ipsum Sub-Heading
115 West Allegan Suite 480 | Lansing, MI 48933 | crcmich.org pg. 1
36
Quantifying the Level of Gerrymandering in Michigan
Endnotes1 Frankel, Matthew. “U.S. Congress: Gerrymandering is the Problem”. The Brookings Institution. June 15, 2010. https://www.brookings.edu/blog/up-front/2010/06/15/u-s-congress-gerrymandering-is-the-problem/.
2 DeSilver, Drew. "Turnout Was High in the 2016 Primary Season, but Just Short of 2008 Record." Pew Research Center. June 10, 2016. www.pewresearch.org/fact-tank/2016/06/10/turnout-was-high-in-the-2016-primary-season-but-just-short-of-2008-record/.
3 Kamarck, Elaine, Alexander Podkul, and Nick Zeppos. "Political Polarization and Voters in the 2016 Congressio-nal Primaries." Center for Effective Public Management at Brookings. January 2017. www.brookings.edu/wp-content/uploads/2017/01/primaries-paper-ii.pdf.
4 McCarty, Nolan. “Hate our polarized politics? Why you can’t blame gerrymandering.” The Washington Post. October 26, 2012. https://www.washingtonpost.com/opinions/hate-our-polarized-politics-why-you-cant-blame-gerrymandering/2012/10/26/c2794552-1d80-11e2-9cd5-b55c38388962_story.html?noredirect=on&utm_term=.0bfb94de7d24.
5 Pew Research Center. “Public Trust in Government: 1958-2017”. December 14, 2017. http://www.people-press.org/2017/12/14/public-trust-in-government-1958-2017/.
6 Engstrom, Erik J. Partisan Gerrymandering and the Construction of American Democracy. Ann Arbor: University of Michigan Press, 2016.
7 Jung, Joseph. "Divided and Conquered: Los Angeles Koreatown and the Inadequacies of Voting Law." Asian American Law Journal 24 (2017). scholarship.law.berkeley.edu/cgi/viewcontent.cgi?article=1227&context=aalj.
8 Baker v. Carr, 369 U.S. 186 (1962); Wesberry v. Sand-ers, 376 U.S. 1 (1964); Reynolds v. Sims, 377 U.S. 533 (1964).
9 Wesberry v. Sanders, 376 U.S. 1 (1964).
10 Kirkpatrick v. Preisler, 394 U.S. 526 (1969).
11 Mahan v. Howell, 410 U.S. 315 (1973).
12 Kosterlitz, Mary J. "Thornbug v. Gingles: The Supreme Court's New Test for Analyzing Minority Vote Dilution." Catholic University Law Review, Winter 1987, 36, no. 2. scholarship.law.edu/cgi/viewcontent.cgi?article=1961&context=lawreview.
13 Shelby County v. Holder, 570 U.S. 2 (2013).
14 "Jurisdictions Previously Covered By Section 5." The United States Department of Justice. August 6, 2015. www.justice.gov/crt/jurisdictions-previously-covered-section-5.
15 Levitt, Justin. "Where Are the Lines Drawn?" All About Redistricting. redistricting.lls.edu/where-state.php.
16 "Redistricting/Reapportionment." Colorado. www.colorado.gov/pacific/cga-redistrict/redistrictingreapportionment#What are the criterias the commission must use for redistricting the state legislative districts.
17 Levine, Sam. "It's Not As Easy As You Think To Spot A Gerrymandered Map." The Huffington Post. February 16, 2018. www.huffingtonpost.com/entry/gerrymandering-strange-maps_us_5a848498e4b0ab6daf454f1e.
18 Ingraham, Christopher. "Here's How Pennsylvania Democrats' Congressional Map Proposal Stacks up against the Current Republican Ones." The Washington Post. February 15, 2018. www.washingtonpost.com/news/wonk/wp/2018/02/15/heres-how-pennsylvania-democrats-congressional-map-proposal-stacks-up-against-the-current-republican-ones/?utm_term=.483b37801ea1.
19 Davis v. Bandemer, 478 U.S. 109 (1986).
20 Vieth v. Jubelirer, 541 U.S. 267 (2004).
21 Justice Scalia’s Opinion, Vieth v. Jumelirer (2004).
22 Amicus Brief in Support of Neither Party, submitted by Gary King, Bernard Grofman, Andrew Gelman, and Jona-than Katz, League of Latin American Citizens v. Perry (2006).
23 Justice Kennedy’s Opinion, League of Latin American Citizens v. Perry (2006).
24 Dorff, Lindsay. "Many Experts Recognize Wisconsin as the Most Gerrymandered State in the Country." The North-western. May 26, 2017. www.thenorthwestern.com/story/opinion/columnists/2017/05/26/many-experts-recognize-wisconsin-most-gerrymandered-state-country/348440001/.
25 "Gill v. Whitford." The Brennan Center for Justice at New York University School of Law. January 24, 2018. www.brennancenter.org/legal-work/whitford-v-gill.
26 District Court for the Western District of Wisconsin Remedial Opinion, Whitford v. Gill (2016).

Lorem ipsum dolor sit amet, consectetur adipiscing elit. Maecenas ultrices mi velit, sit amet malesuada elit venenatis et.
Sed condimentum sodales justo, a molestie tortor mattis ut. Cras ornare rutrum lorem, a auctor sem hendrerit ac.
Quisque auctor eros eu dui pretium condimentum in in leo. Phasellus interdum tellus in elementum maximus. Quisque
ut condimentum nulla. Nunc lorem ligula, vehicula id pretium ut, gravida sit amet nunc.
Nam gravida turpis a nulla vehicula fringilla. Nam a luctus augue, nec ultrices est. Proin a feugiat massa, id vulputate
metus. Mauris id lacinia elit, et lobortis sem. Sed quis diam pulvinar, egestas urna at, mattis odio. Phasellus bibendum
nulla vitae maximus imperdiet. Vestibulum ac quam volutpat, commodo enim id, molestie tortor. Morbi dapibus dapibus
ornare. Pellentesque quis massa tellus. In interdum in lacus nec fermentum. Nullam ullamcorper euismod justo at
dictum. Phasellus aliquet ultrices dolor, vel tempor diam convallis quis. Vestibulum hendrerit dignissim enim nec
dapibus. Integer volutpat congue tincidunt. Vestibulum sed nunc leo.
Morbi sed sapien vitae urna pretium dignissim eu at sapien. Aliquam eu nisl volutpat, commodo mauris sed, pharetra
ante. Nulla lobortis lectus ac sem imperdiet, at fringilla ante commodo. Aliquam sed ullamcorper nisl. Nullam sollicitudin
dolor purus, nec cursus mauris mattis quis. Pellentesque consectetur tellus vel nisi elementum volutpat. Suspendisse
sed dolor sit amet libero tincidunt congue. In egestas libero neque, vel cursus dui blandit vel.
Quisque sit amet venenatis eros. Nulla vulputate pulvinar mauris. Vestibulum pulvinar erat varius sem vestibulum, at
tristique nisl dapibus. Morbi hendrerit nisi malesuada, feugiat justo vitae, sagittis orci. Nam quis laoreet quam, a
faucibus risus. Morbi egestas molestie odio quis elementum. Suspendisse iaculis nisi id risus vehicula convallis. Donec
tincidunt congue fringilla.
Aliquam erat volutpat. Sed imperdiet augue sit amet eros rhoncus egestas. Mauris mauris nunc, scelerisque eu dapibus
nec, hendrerit a dolor. Duis vel nisl porttitor, dictum nulla id, molestie lacus. Nulla vehicula placerat justo, vel semper
metus luctus sed. Cras blandit ultrices ipsum sed facilisis. Maecenas varius eros orci, sed mollis arcu finibus eu. Nullam
ut quam ut lorem rutrum cursus non sed massa. Nunc sed sollicitudin orci. Integer libero tellus, iaculis in orci ut, ornare
vehicula ante.
Quisque sit amet venenatis eros. Nulla vulputate pulvinar mauris. Vestibulum pulvinar erat varius sem vestibulum, at
tristique nisl dapibus. Morbi hendrerit nisi malesuada, feugiat justo vitae, sagittis orci. Nam quis laoreet quam, a
faucibus risus. Morbi egestas molestie odio quis elementum. Suspendisse iaculis nisi id risus vehicula convallis. Donec
tincidunt congue fringilla.
Maecenas varius eros orci, sed mollis arcu finibus eu. Nullam ut quam ut lorem rutrum cursus non sed massa. Nunc sed
sollicitudin orci. Integer libero tellus, iaculis in orci ut, ornare vehicula ante.
Official Research Paper
Lorem Ipsum Research Paper TitleLorem Ipsum Sub-Heading
115 West Allegan Suite 480 | Lansing, MI 48933 | crcmich.org pg. 1
37
Quantifying the Level of Gerrymandering in Michigan
27 District Court for the Western District of Wisconsin Opinion, Whitford v. Gill (2016).
28 Gill v. Whitford, 585 U.S. ____ (2018).
29 O’Malley, Martin. "I Added a Democrat to Congress but I Hope Supreme Court Ends Partisan Gerrymandering: O'Malley." USA Today. March 29, 2018. www.usatoday.com/story/opinion/2018/03/29/supreme-court-should-end-parti-san-gerrymandering-martin-omalley-column/467349002/.
30 Brief of the Appellees, Benisek v. Lamone.
31 2nd Amended Complaint to the District Court of Mary-land, Benisek v. Lamone.
32 Benisek v. Lamone, 585 U.S. ____ (2018).
33 Royden, Laura, Michael Li, and Yurij Rudensky. “Ex-treme Gerrymandering & The 2018 Midterm”. The Brennan Center for Justice at New York School of Law. 2018. https://www.brennancenter.org/sites/default/files/publications/Ex-treme%20Gerrymandering%204.24.18.pdf
34 Royden, Laura and Michael Li. “Extreme Maps”. The Brennan Center for Justice at New York University School of Law. 2017. https://www.politico.com/f/?id=0000015c-11a2-d46a-a3ff-9da240e10002
35 Wang, Sam et al. “Wondering how the tests work?” The Princeton Gerrymandering Project. http://gerrymander.princeton.edu/info/.
36 Stephanopoulos, Nicholas, and Eric McGhee. "Parti-san Gerrymandering and the Efficiency Gap." University of Chicago Law Review 82 (October 2014). chicagounbound.uchicago.edu/cgi/viewcontent.cgi?referer=&httpsredir=1&referer=&httpsredir=1&article=1946&context=public_law_and_legal_theory.
37 “Previous Election Information”. Michigan Secretary of State. https://www.michigan.gov/sos/0,4670,7-127-1633_8722---,00.html.
38 Wang, Samuel S.-H. "Three Tests for Practical Evalu-ation of Partisan Gerrymandering." Stanford Law Review 68 (June 2016). www.stanfordlawreview.org/wp-content/uploads/sites/3/2016/06/3_-_Wang_-_Stan._L._Rev.pdf.
39 Chen, Jowei and David Cottrell. “Evaluating partisan gains from Congressional gerrymandering: Using computer simulations to estimate the effect of gerrymandering in the U.S. House.” Electoral Studies 44 (2016) 239-340. http://www-personal.umich.edu/~jowei/gerrymandering.pdf.
Lorem ipsum dolor sit amet, consectetur adipiscing elit. Maecenas ultrices mi velit, sit amet malesuada elit venenatis et.
Sed condimentum sodales justo, a molestie tortor mattis ut. Cras ornare rutrum lorem, a auctor sem hendrerit ac.
Quisque auctor eros eu dui pretium condimentum in in leo. Phasellus interdum tellus in elementum maximus. Quisque
ut condimentum nulla. Nunc lorem ligula, vehicula id pretium ut, gravida sit amet nunc.
Nam gravida turpis a nulla vehicula fringilla. Nam a luctus augue, nec ultrices est. Proin a feugiat massa, id vulputate
metus. Mauris id lacinia elit, et lobortis sem. Sed quis diam pulvinar, egestas urna at, mattis odio. Phasellus bibendum
nulla vitae maximus imperdiet. Vestibulum ac quam volutpat, commodo enim id, molestie tortor. Morbi dapibus dapibus
ornare. Pellentesque quis massa tellus. In interdum in lacus nec fermentum. Nullam ullamcorper euismod justo at
dictum. Phasellus aliquet ultrices dolor, vel tempor diam convallis quis. Vestibulum hendrerit dignissim enim nec
dapibus. Integer volutpat congue tincidunt. Vestibulum sed nunc leo.
Morbi sed sapien vitae urna pretium dignissim eu at sapien. Aliquam eu nisl volutpat, commodo mauris sed, pharetra
ante. Nulla lobortis lectus ac sem imperdiet, at fringilla ante commodo. Aliquam sed ullamcorper nisl. Nullam sollicitudin
dolor purus, nec cursus mauris mattis quis. Pellentesque consectetur tellus vel nisi elementum volutpat. Suspendisse
sed dolor sit amet libero tincidunt congue. In egestas libero neque, vel cursus dui blandit vel.
Quisque sit amet venenatis eros. Nulla vulputate pulvinar mauris. Vestibulum pulvinar erat varius sem vestibulum, at
tristique nisl dapibus. Morbi hendrerit nisi malesuada, feugiat justo vitae, sagittis orci. Nam quis laoreet quam, a
faucibus risus. Morbi egestas molestie odio quis elementum. Suspendisse iaculis nisi id risus vehicula convallis. Donec
tincidunt congue fringilla.
Aliquam erat volutpat. Sed imperdiet augue sit amet eros rhoncus egestas. Mauris mauris nunc, scelerisque eu dapibus
nec, hendrerit a dolor. Duis vel nisl porttitor, dictum nulla id, molestie lacus. Nulla vehicula placerat justo, vel semper
metus luctus sed. Cras blandit ultrices ipsum sed facilisis. Maecenas varius eros orci, sed mollis arcu finibus eu. Nullam
ut quam ut lorem rutrum cursus non sed massa. Nunc sed sollicitudin orci. Integer libero tellus, iaculis in orci ut, ornare
vehicula ante.
Quisque sit amet venenatis eros. Nulla vulputate pulvinar mauris. Vestibulum pulvinar erat varius sem vestibulum, at
tristique nisl dapibus. Morbi hendrerit nisi malesuada, feugiat justo vitae, sagittis orci. Nam quis laoreet quam, a
faucibus risus. Morbi egestas molestie odio quis elementum. Suspendisse iaculis nisi id risus vehicula convallis. Donec
tincidunt congue fringilla.
Maecenas varius eros orci, sed mollis arcu finibus eu. Nullam ut quam ut lorem rutrum cursus non sed massa. Nunc sed
sollicitudin orci. Integer libero tellus, iaculis in orci ut, ornare vehicula ante.
Official Research Paper
Lorem Ipsum Research Paper TitleLorem Ipsum Sub-Heading
115 West Allegan Suite 480 | Lansing, MI 48933 | crcmich.org pg. 1
38
Quantifying the Level of Gerrymandering in Michigan
Appendix A Uncontested Elections and Calculating Measures
In most circumstances, a district is uncontested because it is not very competitive. An uncontested district, then, could typically have a large effect on the efficiency gap. There are two effects that can occur, however: because opposition party voters are not counted (or counted voting for the only candidate in the race), uncontested races can over-inflate the number of votes wasted by the winning candidate’s party, and the lack of competition can reduce turnout from that candidates party, causing an underestimate of the wasted votes for the winning party.
Because there are relatively few congressional seats in Michigan (currently 14 seats), uncontested races can have an outsized impact for congressional elec-tions relative to Michigan House of Representative elections (110 seats). Both the uncontested seats in each of the 2002 and 2006 elections were won by the Democratic Party. In 2002, both districts saw the lowest turnout across all congressional elections held that year. In 2006, the two districts experienced the lowest and the third-lowest voter turnout across all elections held. Across all elections held during the 2000s (using the 2002 congressional maps), the 13th Michigan Congressional District (uncontested in both 2002 and 2006) was consistently one of the districts with the lowest turnout. The other two districts that went uncontested (the Michigan 5th Congressional District in 2002 and the Michigan 15th in 2006) experienced voter turnout much closer in line with the statewide median the rest of the decade. As a result, it is likely that the efficiency gap reported slightly inflates the ef-ficiency gap. In either year, the interpretation would not change; congressional districts in the state would be considered gerrymandered under the test.
State House seats are less likely to produce individual variation in the calculated efficiency gap, as there are 110 seats, reducing the impact of single outliers. In virtually all years, uncontested elections have virtually no effect on the efficiency gap. However, the 2008 election serves as an outlier to this general trend. In that year, there is a 2.5 point gap between estimates using all elections (contested and uncontested) and only using the results from contested elections. That year, nine seats that were won by candidates of the
Uncontested elections pose a unique challenge when calculating many metrics used to identify the pres-ence of gerrymandering. When a district is packed with voters from one party, the general election can be a forgone conclusion, occasionally to the point where one of the two major parties does not even run a candidate. When an election goes uncontested, thousands of potential votes for a party are not cast. This can materially affect measures like the efficiency gap. Similarly, uncontested election results can influ-ence the calculation of statewide average and variance metrics, which are used to calculate the mean-median score and t-test, respectively.
Typically, when conducting these tests, political scien-tists would impute, or estimate, the outcome of each election using an algorithm that considered data from several years’ worth of elections to create a proxy val-ues in place of the actual uncontested election results. These imputed values are used in the calculations. These projections, while helpful, can alter the output of statistical methods depending on assumptions that are made, and are relatively inaccessible to create for most citizens. Because of this limitation, this report uses publicly-available data provided from the Michigan Secretary of State to calculate the metrics presented. But it is important to understand what impact those uncontested elections could have on the tests when interpreting each test.
Specifically, for the elections data used in this report, four congressional seats (two each in the 2002 and 2006) and 20 seats in the state House of Represen-tatives (across several years) went uncontested at various elections. How does this affect the results of the various tests?
The Efficiency Gap
When a party does not run a candidate in a district, that party receives no votes for a given election. This means that, based on the underlying rationale of the efficiency gap, the party wasted no votes. On the other hand, the winning party wasted just under half of the total votes cast in the uncontested election. This mathematical result does not reflect the reality of the district scheme.

Lorem ipsum dolor sit amet, consectetur adipiscing elit. Maecenas ultrices mi velit, sit amet malesuada elit venenatis et.
Sed condimentum sodales justo, a molestie tortor mattis ut. Cras ornare rutrum lorem, a auctor sem hendrerit ac.
Quisque auctor eros eu dui pretium condimentum in in leo. Phasellus interdum tellus in elementum maximus. Quisque
ut condimentum nulla. Nunc lorem ligula, vehicula id pretium ut, gravida sit amet nunc.
Nam gravida turpis a nulla vehicula fringilla. Nam a luctus augue, nec ultrices est. Proin a feugiat massa, id vulputate
metus. Mauris id lacinia elit, et lobortis sem. Sed quis diam pulvinar, egestas urna at, mattis odio. Phasellus bibendum
nulla vitae maximus imperdiet. Vestibulum ac quam volutpat, commodo enim id, molestie tortor. Morbi dapibus dapibus
ornare. Pellentesque quis massa tellus. In interdum in lacus nec fermentum. Nullam ullamcorper euismod justo at
dictum. Phasellus aliquet ultrices dolor, vel tempor diam convallis quis. Vestibulum hendrerit dignissim enim nec
dapibus. Integer volutpat congue tincidunt. Vestibulum sed nunc leo.
Morbi sed sapien vitae urna pretium dignissim eu at sapien. Aliquam eu nisl volutpat, commodo mauris sed, pharetra
ante. Nulla lobortis lectus ac sem imperdiet, at fringilla ante commodo. Aliquam sed ullamcorper nisl. Nullam sollicitudin
dolor purus, nec cursus mauris mattis quis. Pellentesque consectetur tellus vel nisi elementum volutpat. Suspendisse
sed dolor sit amet libero tincidunt congue. In egestas libero neque, vel cursus dui blandit vel.
Quisque sit amet venenatis eros. Nulla vulputate pulvinar mauris. Vestibulum pulvinar erat varius sem vestibulum, at
tristique nisl dapibus. Morbi hendrerit nisi malesuada, feugiat justo vitae, sagittis orci. Nam quis laoreet quam, a
faucibus risus. Morbi egestas molestie odio quis elementum. Suspendisse iaculis nisi id risus vehicula convallis. Donec
tincidunt congue fringilla.
Aliquam erat volutpat. Sed imperdiet augue sit amet eros rhoncus egestas. Mauris mauris nunc, scelerisque eu dapibus
nec, hendrerit a dolor. Duis vel nisl porttitor, dictum nulla id, molestie lacus. Nulla vehicula placerat justo, vel semper
metus luctus sed. Cras blandit ultrices ipsum sed facilisis. Maecenas varius eros orci, sed mollis arcu finibus eu. Nullam
ut quam ut lorem rutrum cursus non sed massa. Nunc sed sollicitudin orci. Integer libero tellus, iaculis in orci ut, ornare
vehicula ante.
Quisque sit amet venenatis eros. Nulla vulputate pulvinar mauris. Vestibulum pulvinar erat varius sem vestibulum, at
tristique nisl dapibus. Morbi hendrerit nisi malesuada, feugiat justo vitae, sagittis orci. Nam quis laoreet quam, a
faucibus risus. Morbi egestas molestie odio quis elementum. Suspendisse iaculis nisi id risus vehicula convallis. Donec
tincidunt congue fringilla.
Maecenas varius eros orci, sed mollis arcu finibus eu. Nullam ut quam ut lorem rutrum cursus non sed massa. Nunc sed
sollicitudin orci. Integer libero tellus, iaculis in orci ut, ornare vehicula ante.
Official Research Paper
Lorem Ipsum Research Paper TitleLorem Ipsum Sub-Heading
115 West Allegan Suite 480 | Lansing, MI 48933 | crcmich.org pg. 1
39
Quantifying the Level of Gerrymandering in Michigan
Democrat Party went uncontested (while no seats won by candidates of the Republican Party went uncontested). Similar to the congressional elections in 2002 and 2006, these races typically saw lower overall turnout than other races, though it was typical for the rest of the decade. The use of uncontested races in 2008 over-estimates the efficiency gap for the Michigan House of Representatives. Given the results from the efficiency gap calculation, it is questionable whether the maps for 2008 would be deemed a ger-rymandered. However, it should be pointed out that given the efficiency gap calculations for previous years’ elections using the same maps, there is evidence of a gerrymander.
Mean-Median Test
Unlike with the efficiency gap, in the mean-median analysis the concern is on vote share, not total votes. As a result, it is more important to include more extreme values, as excluding them is likely to more strongly underestimate a district than including the district in the first place. Using uncontested races in calculation will cause the average to be overestimated (if the party won an uncontested election) or underestimated (if the party did not contest an election) as a result.
As a result, at least for U.S. House elections held in 2002 and 2006, the estimates provided are likely slightly to moderately exaggerated (in the range of about three percentage points), as the median would be unchanged for the final result, but the mean would decrease for the Democrat number and increase for Republicans. In both years, estimating the values as lopsided (but not uncontested) wins would still result in mean-median differences that would demonstrate evidence of a gerrymander.
For state House elections, assuming realistic margins of victory would signal that the Democratic Party had a slight advantage in the 2008 elections (where nine elections went uncontested), though the results would not be considered a likely gerrymander. For all other results for state House elections, the estimates would be unlikely to change to any meaningful degree.
T-Test
Unlike the efficiency gap and the mean-median test, uncontested elections actually weaken the explanatory power of the t-test. Because an uncontested election results in an extreme value (close to 100 percent of the vote share, as write-ins and 3rd party candidates still run occasionally), the standard deviation (the measure of variance used in the test) increases significantly. With a higher variance, the explanatory value of the difference decreases, which increases the probability the difference was due to just random chance. This inflates the resulting p-value of the statistic, indicating an increased likelihood that they could come from the same set. In turn, the increased variance adds bias no matter the real outcome of a hypothetical challenged election, unless a 100 percent vote share is closer to the group average than the true hypothetical result (but in each case presented, it would not be).
While uncontested elections can have an outsized impact on metrics like the efficiency gap and the mean-median test, over the last 20 years in Michigan there have been few uncontested races for meaning-ful change to occur based on these measures in most instances, and when a change did occur, the directional interpretation of those tests did not change.

YES! I want to help fill Michigan’s Fact Tank and support sound public policy in Michigan!
NAME ________________________________________________________________ ADDRESS ________________________________________________________________ EMAIL / PHONE _______________________________________________________
• I wish to make a one-time, tax-deductible gift of: $ __________
• I wish to pledge a total of $ __________ with an initial payment of $ __________ .
• I would like my contribution to support: _____ Annual Fund _____ Endowment
• Please mark my gift:
Anonymous In Honor Of: __________________________________
In Memory Of: __________________________________
• Gift will be matched by: ____________________________________________________
Or donate online at www.crcmich.org/donate
A Fact Tank Cannot Run on FumesDo you find this report useful and want to support analysis that will lead to better policy decisions and better government in Michigan? Your support of Citizens Research Council of Michigan will help us to continue providing policy makers and citizens the trusted, unbiased, high-quality public policy research Michigan needs.
You can learn more about the organization at www.crcmich.org/about. If you found the contents of this report useful and wish to help fill the fact tank so we can carry on our mission, please visit www.crcmich.org/donate or fill out the form below and send it to:
Citizens Research Council of Michigan38777 Six Mile Road, Suite 208Livonia, MI 48152-3974