Quantifying the Excess Heat Available for District Heating ...
17
Project No: IEE/13/650 Quantifying the Excess Heat Available for District Heating in Europe Work Package 2 Background Report 7
Transcript of Quantifying the Excess Heat Available for District Heating ...

Project No: IEE/13/650
Quantifying the Excess Heat Available for
District Heating in Europe
Work Package 2
Background Report 7
Page 2
Authors: Urban Persson
Contact: Halmstad University
S-301 18 Halmstad, Sweden
T: +46 0 3516 7405
E-mail: [email protected]
Web: www.hh.se/english
© 2015
Deliverable No. D 2.2: Public Document.
The STRATEGO project (Multi-level actions for enhanced Heating & Cooling
plans) is supported by the Intelligent Energy Europe Programme. The sole
responsibility for the content of this document lies with the authors. It does not
necessarily reflect the opinion of the funding authorities. The funding authorities
are not responsible for any use that may be made of the information contained
therein.
STRATEGO Website: http://stratego-project.eu Heat Roadmap Europe Website: http://www.heatroadmap.eu
Online Maps: http://maps.heatroadmap.eu

Page 3
Contents
Section Description Page
1 Background ......................................................................................................... 4
2 Method ................................................................................................................ 5
3 Data .................................................................................................................... 7
4 Results ................................................................................................................ 8
5 Conclusions .......................................................................................................11
References .........................................................................................................12
Appendix ............................................................................................................14

Page 4
1 Background
In terms of quantifying the excess heat available for district heating systems, the approach within the Stratego project is to assess these availabilities on facility level and aggregate found volumes to regional and national levels for planning and modelling purposes. Since explicit information on excess heat from unique thermal power generation plants and fuel transformation processes in industrial activities are principally unavailable in international energy statistics, and very seldom quantified and reported in general, this task poses a methodological challenge for the project. The chosen approach to meet this challenge, which corresponds to that developed and used in the Heat Roadmap Europe project (HRE, 2014), rests on the idea to use publicly available carbon dioxide emission data on facility level in combination with a reversed calculation sequence to establish primary energy inputs and anticipated excess heat volumes from considered activities.
The purpose of quantifying excess heat available for district heating systems in this context is two-fold and aims to illustrate the vast European potential of the long neglected and often disregarded domestic resource of excess heat. First, determining the geographical locations of considered activities is pre-conditional for any regional or national assessments of future heat synergy collaborations, where increased shares of current excess heat available from these plants and activities are to be recovered and distributed in district heating networks. Second, quantification of annual excess heat volumes available from these plants is essential to provide an idea of the magnitude and extent by which these assets may be utilised to replace current heat supply to meet building heat demands.
It should be underlined that anticipated annual excess heat volumes in the following represent maximal levels of rejected secondary heat from the considered activities, levels that due to a multitude of reasons (e.g. thermo-dynamical, geographical, infrastructural, and seasonal) very well may prove difficult to realise fully in unique heat recovery projects. For the local projects within the Stratego project, as well as for any local heat synergy collaboration in future Europe, it is recommended to carry out detailed assessments of available excess heat from any plausible source. Such detailed assessments should ideally be based on actual energy and thermo-dynamical data (temperature levels, state-of-matter etc.), include sensitivity analyses, and as well address organisational aspects such as collaboration agreements with mutually beneficial allocation of synergy benefits to all involved parties.
Page 5
2 Method
The methodological approach used to quantify excess heat available for district heating systems in this report is mainly based on the use of publicly available carbon dioxide emission data from the European Pollutant Release and Transfer Register (E-PRTR) (EEA, 2013a), energy statistics from the International Energy Agency (IEA, 2012) and a reversed calculation sequence. The approach has previously been partly documented in (Connolly et al., 2014; Connolly et al., 2013; Connolly et al., 2012), as well as in (Persson, 2015), and with full detail in (Persson et al., 2014). The most significant steps in this methodology can be summoned according to the following key bullets:
Retrieve geographical coordinates and annual carbon dioxide emissions on facility level from the E-PRTR dataset
Establish characteristic carbon dioxide emission factors, per Member State and per main activity sector, by use of IEA energy statistics on fuel use and standard carbon dioxide emission factors (See Appendix, Table 6 and Table 5, respectively)
Calculate primary energy supply on facility level based on annual carbon dioxide emissions and characteristic carbon dioxide emission factors
Apply default recovery efficiencies (see Table 1) to calculated primary energy supplies to assess theoretically available annual excess heat volumes on facility level
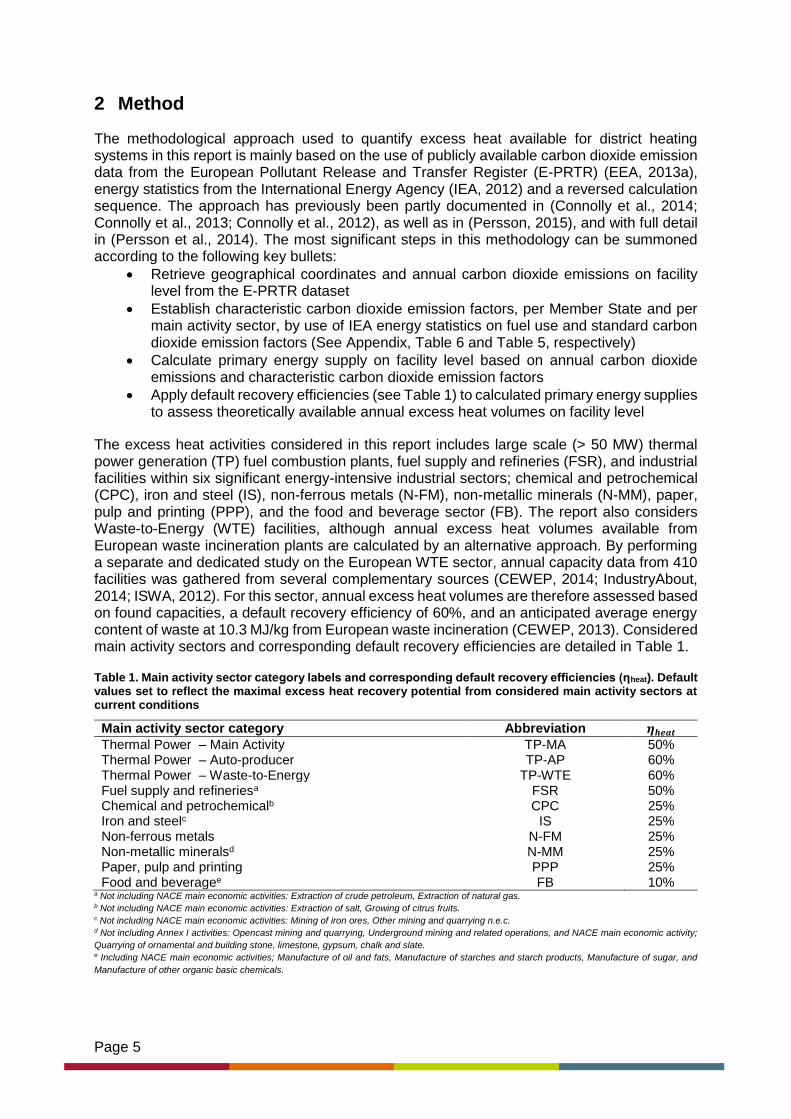
The excess heat activities considered in this report includes large scale (> 50 MW) thermal power generation (TP) fuel combustion plants, fuel supply and refineries (FSR), and industrial facilities within six significant energy-intensive industrial sectors; chemical and petrochemical (CPC), iron and steel (IS), non-ferrous metals (N-FM), non-metallic minerals (N-MM), paper, pulp and printing (PPP), and the food and beverage sector (FB). The report also considers Waste-to-Energy (WTE) facilities, although annual excess heat volumes available from European waste incineration plants are calculated by an alternative approach. By performing a separate and dedicated study on the European WTE sector, annual capacity data from 410 facilities was gathered from several complementary sources (CEWEP, 2014; IndustryAbout, 2014; ISWA, 2012). For this sector, annual excess heat volumes are therefore assessed based on found capacities, a default recovery efficiency of 60%, and an anticipated average energy content of waste at 10.3 MJ/kg from European waste incineration (CEWEP, 2013). Considered main activity sectors and corresponding default recovery efficiencies are detailed in Table 1.
Table 1. Main activity sector category labels and corresponding default recovery efficiencies (ηheat). Default values set to reflect the maximal excess heat recovery potential from considered main activity sectors at current conditions
Main activity sector category Abbreviation 𝜼𝒉𝒆𝒂𝒕 Thermal Power – Main Activity TP-MA 50% Thermal Power – Auto-producer TP-AP 60% Thermal Power – Waste-to-Energy TP-WTE 60% Fuel supply and refineriesa FSR 50% Chemical and petrochemicalb CPC 25% Iron and steelc IS 25% Non-ferrous metals N-FM 25% Non-metallic mineralsd N-MM 25% Paper, pulp and printing PPP 25% Food and beveragee FB 10%
a Not including NACE main economic activities: Extraction of crude petroleum, Extraction of natural gas. b Not including NACE main economic activities: Extraction of salt, Growing of citrus fruits. c Not including NACE main economic activities: Mining of iron ores, Other mining and quarrying n.e.c. d Not including Annex I activities: Opencast mining and quarrying, Underground mining and related operations, and NACE main economic activity;
Quarrying of ornamental and building stone, limestone, gypsum, chalk and slate. e Including NACE main economic activities; Manufacture of oil and fats, Manufacture of starches and starch products, Manufacture of sugar, and
Manufacture of other organic basic chemicals.
Page 6
Fuel input to thermal power generation in both power-only and cogeneration facilities are compiled with respect to main activity (MA) and autoproducer (AP) facilities. By excluding nuclear energy in the assessment, which is motivated partly since there is a generally weak interest for recovery of nuclear excess heat today, an additional excess heat volume of approximately 6.7 EJ rejected from European nuclear facilities (operating at average total conversion efficiencies of 33%) is neglected here. According to (IEA, 2012), only 5.0 PJ, from a total primary energy supply of 10.0 EJ, was recovered as usable heat during the year 2010, which reflects very low utilisation levels at current. Additionally, several other plausible sources for excess heat recovery, such as sewages, exhaust air ventilation shafts, and server stations, are omitted in this assessment focusing on energy and industry sectors. See for example (Ebrahimi et al., 2014, 2015) for investigations on the use of excess heat from server stations, and (CEC, 1982; McKenna and Norman, 2010; Morandin et al., 2014; Persson and Werner, 2012; Rattner and Garimella, 2011; Swithenbank et al., 2013) for some general references on excess heat recovery from energy and industry sector activities in district heating systems.
The total annual carbon dioxide emission volume from considered excess heat activities amounts to 2.02 billion metric tonnes (see Table 2), which by validation (comparison to corresponding main activity sectors greenhouse gas emissions sent by countries to the UNFCCC (EEA, 2013c) and to verified 2010 EU ETS data reported through the Community Independent Transaction Log (CITL) (EEA, 2013b)), proved reasonable. Although not fully compatible, since UNFCCC main activity sector data includes all sub-sectors and EU ETS data includes combustion installations with rated thermal inputs > 20 MW, both sources indicate European carbon dioxide emission volumes of about 2.2 billion tons from stationary combustion in given sectors for 2010.
All gathered data, carbon dioxide emissions, energy statistics, and geographical coordinates, are assembled in a relational database to allow systematic calculations, where after spatial representation of each considered facility and the creation of continental and national maps are managed and performed within the ArcMap 10.1 GIS interface (ESRI, 2014). In this Background Report, these maps are withheld at a continental scale, while national maps for five Stratego countries are presented in the Country Reports.
Page 7
3 Data
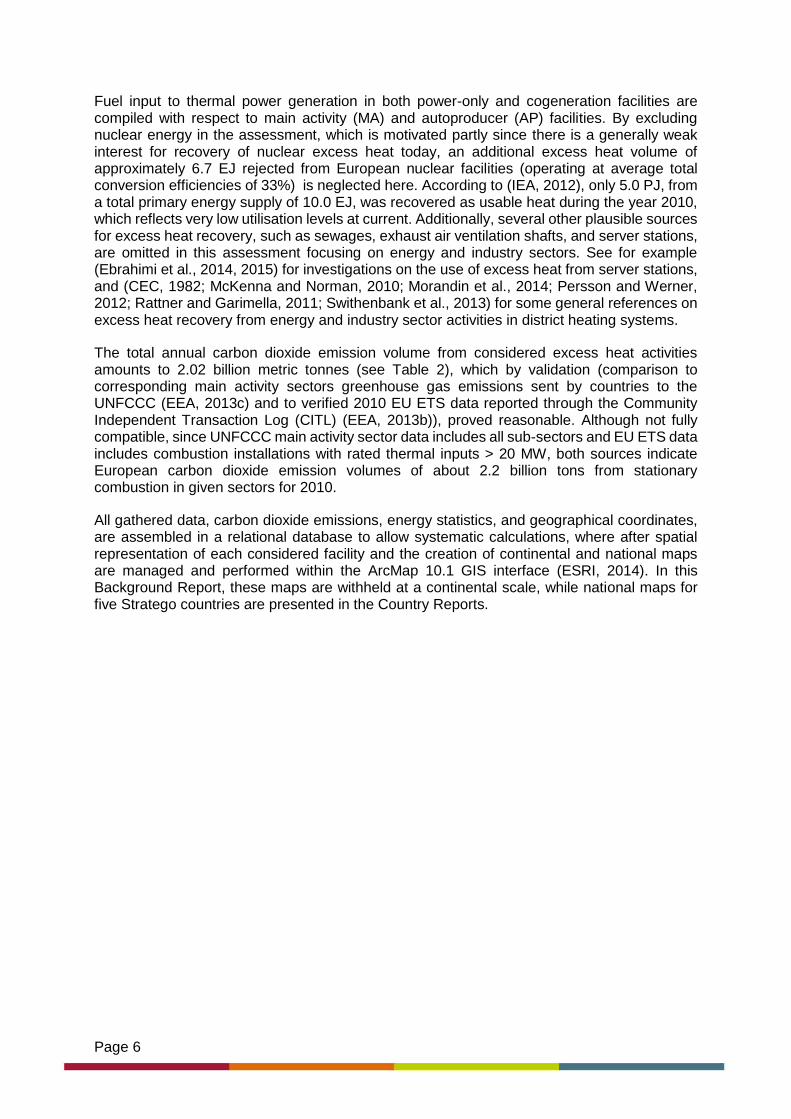
The E-PRTR dataset includes annual facility reports on land, water, and air emissions, and is publicly available through the European Environmental Agency (EEA). In this data compilation, general, sectorial, and quantitative (emissions) information on European energy and industry sector facilities are stored together with e.g. geographical coordinates, which enables spatial determination of each emitting site. For the purpose in this report, study facilities were retrieved from the dataset by structured query language (SQL) selection on carbon dioxide emissions to air and mainly for the year 2010. Since Croatia, the 28th European Union Member State since July 1, 2013, is not included in the used version of the E-PRTR dataset, corresponding information on carbon dioxide emissions from Croatian energy and industry sector activities were gathered mainly from the European Union Transaction Log (EC, 2014) and from some national reports on fuel use. As detailed in Table 2, the assessments in this report are hereby based on carbon dioxide emissions from 2712 facilities in all.
Table 2. Count of energy and industry sector facilities extracted from the E-EPRTR dataset and additional sources, with reported annual carbon dioxide emissions aggregated to national level, mainly for 2010
Member State
Count of facilities [n] CO2 [Mt] Count of
TP facilities Count of
WTE facilities Count of
Industrial facilities
AT 59 33 22 10 27 BE 97 55 28 16 53 BG 34 33 20 - 14 CY 5 5 3 - 2 CZ 76 73 45 3 28 DE 485 497 175 84 226 DK 55 22 17 30 8 EE 9 14 7 - 2 EL 39 61 22 - 17 ES 230 120 99 10 121 FI 89 61 52 3 34 FR 333 119 57 126 150 HR 57 9 10 - 47 HU 42 22 24 2 16 IE 21 16 13 1 7 IT 311 196 130 52 129 LT 8 6 5 - 3 LU 7 2 1 1 5 LV 3 1 1 - 2 MT 2 2 2 - - NL 99 90 42 13 44 PL 155 195 94 1 60 PT 40 28 14 2 24 RO 68 48 33 - 35 SE 123 51 41 28 54 SI 8 7 3 1 4 SK 32 21 14 1 17 UK 225 236 106 26 93
EU28 Total 2712 2024 1080 410 1222
Excess heat activities in industrial sectors dominate the selection and are present in all Member states, with the exception of the Republic of Malta (MT) if considering WTE facilities as a special branch of thermal power generation. Nineteen Member States currently have waste incineration plants in operation, while dedicated thermal power generation plants are present in all Member States.
Page 8
4 Results
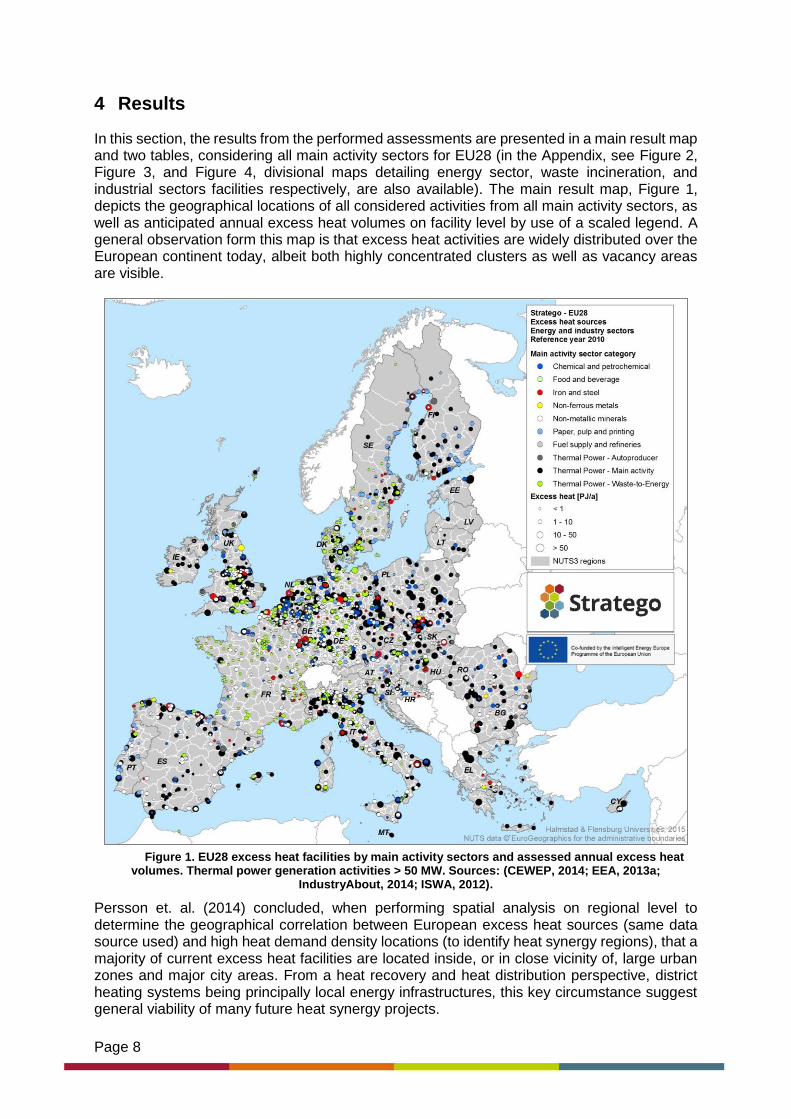
In this section, the results from the performed assessments are presented in a main result map and two tables, considering all main activity sectors for EU28 (in the Appendix, see Figure 2, Figure 3, and Figure 4, divisional maps detailing energy sector, waste incineration, and industrial sectors facilities respectively, are also available). The main result map, Figure 1, depicts the geographical locations of all considered activities from all main activity sectors, as well as anticipated annual excess heat volumes on facility level by use of a scaled legend. A general observation form this map is that excess heat activities are widely distributed over the European continent today, albeit both highly concentrated clusters as well as vacancy areas are visible.
Figure 1. EU28 excess heat facilities by main activity sectors and assessed annual excess heat volumes. Thermal power generation activities > 50 MW. Sources: (CEWEP, 2014; EEA, 2013a;
IndustryAbout, 2014; ISWA, 2012).
Persson et. al. (2014) concluded, when performing spatial analysis on regional level to determine the geographical correlation between European excess heat sources (same data source used) and high heat demand density locations (to identify heat synergy regions), that a majority of current excess heat facilities are located inside, or in close vicinity of, large urban zones and major city areas. From a heat recovery and heat distribution perspective, district heating systems being principally local energy infrastructures, this key circumstance suggest general viability of many future heat synergy projects.
Page 9
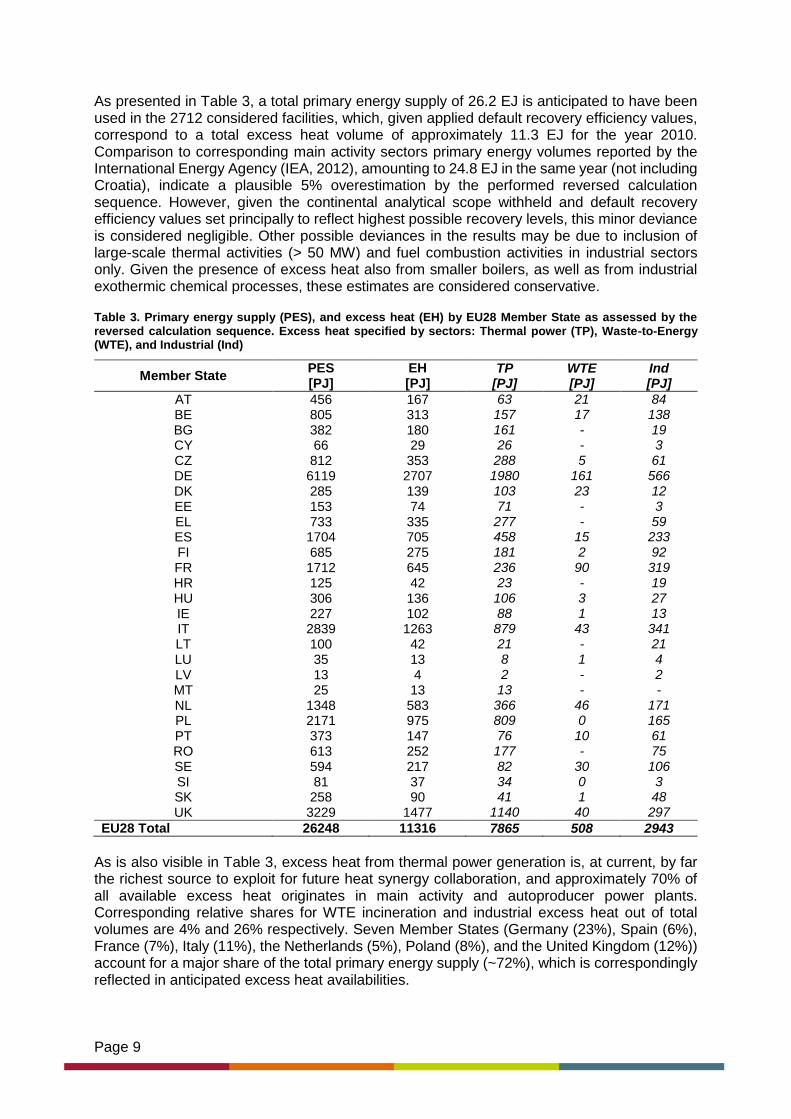
As presented in Table 3, a total primary energy supply of 26.2 EJ is anticipated to have been used in the 2712 considered facilities, which, given applied default recovery efficiency values, correspond to a total excess heat volume of approximately 11.3 EJ for the year 2010. Comparison to corresponding main activity sectors primary energy volumes reported by the International Energy Agency (IEA, 2012), amounting to 24.8 EJ in the same year (not including Croatia), indicate a plausible 5% overestimation by the performed reversed calculation sequence. However, given the continental analytical scope withheld and default recovery efficiency values set principally to reflect highest possible recovery levels, this minor deviance is considered negligible. Other possible deviances in the results may be due to inclusion of large-scale thermal activities (> 50 MW) and fuel combustion activities in industrial sectors only. Given the presence of excess heat also from smaller boilers, as well as from industrial exothermic chemical processes, these estimates are considered conservative.
Table 3. Primary energy supply (PES), and excess heat (EH) by EU28 Member State as assessed by the reversed calculation sequence. Excess heat specified by sectors: Thermal power (TP), Waste-to-Energy (WTE), and Industrial (Ind)
Member State PES [PJ]
EH [PJ]
TP [PJ]
WTE [PJ]
Ind [PJ]
AT 456 167 63 21 84 BE 805 313 157 17 138 BG 382 180 161 - 19 CY 66 29 26 - 3 CZ 812 353 288 5 61 DE 6119 2707 1980 161 566 DK 285 139 103 23 12 EE 153 74 71 - 3 EL 733 335 277 - 59 ES 1704 705 458 15 233
FI 685 275 181 2 92 FR 1712 645 236 90 319 HR 125 42 23 - 19 HU 306 136 106 3 27 IE 227 102 88 1 13 IT 2839 1263 879 43 341 LT 100 42 21 - 21 LU 35 13 8 1 4 LV 13 4 2 - 2 MT 25 13 13 - - NL 1348 583 366 46 171 PL 2171 975 809 0 165 PT 373 147 76 10 61 RO 613 252 177 - 75
SE 594 217 82 30 106 SI 81 37 34 0 3 SK 258 90 41 1 48 UK 3229 1477 1140 40 297
EU28 Total 26248 11316 7865 508 2943
As is also visible in Table 3, excess heat from thermal power generation is, at current, by far the richest source to exploit for future heat synergy collaboration, and approximately 70% of all available excess heat originates in main activity and autoproducer power plants. Corresponding relative shares for WTE incineration and industrial excess heat out of total volumes are 4% and 26% respectively. Seven Member States (Germany (23%), Spain (6%), France (7%), Italy (11%), the Netherlands (5%), Poland (8%), and the United Kingdom (12%)) account for a major share of the total primary energy supply (~72%), which is correspondingly reflected in anticipated excess heat availabilities.

Page 10
From a sectorial perspective, i.e. by main activity sectors, as presented in Table 4, it is clear that main activity thermal power generation plants account for a majority of both total excess heat volumes (68%) as well as thermal power generation main activity sector volumes (91%). Among industrial main activity sectors, fuel supply and refineries (however depicted together with energy sector facilities in Figure 2) represent highest annual excess heat availabilities (9% of the total excess heat volume and 36% of total industrial sectors volumes), while Non-metallic minerals facilities account for 5% of the total excess heat volume and 20% of total industrial sectors volumes.
Table 4. Total count of facilities, annual carbon dioxide emissions, primary energy supply (PES), and excess heat (EH) by main activity sector as assessed by the reversed calculation sequence
Main activity sector Count of
facilities [n] CO2 [Mt]
PES [PJ]
EH [PJ]
Chemical and petrochemical 242 123 1868 467 Food and beverage 59 9 145 14 Fuel supply and refineries 116 155 2118 1059 Iron and steel 144 166 2101 525 Non-ferrous metals 35 13 204 51 Non-metallic minerals 454 173 2398 600 Paper, pulp and printing 172 79 908 227 Thermal Power Generation - AP 82 28 354 212 Thermal Power Generation - MA 998 1257 15305 7653 Thermal Power Generation - WTE 410 21 847 508
EU28 Total 2712 2024 26248 11316

Page 11
5 Conclusions
The major conclusions from these Stratego estimations to quantify the excess heat sources available for district heating systems are that:
1. Publicly available carbon dioxide emission data on facility level (e.g. from the European Pollutant Release and Transfer Register (E-PRTR)) may be used in combination with energy statistics and a reversed calculation sequence to assess annual volumes of rejected excess heat from fuel combustion processes in European energy and industry sector facilities
2. Default recovery efficiencies, set here to reveal maximal volumes of rejected secondary heat, may in local heat synergy projects be altered, reduced, and used to characterise viable and realistic excess heat recovery levels
3. For the local projects within Stratego, as well as for local heat synergy collaboration in general, it is recommended to retrieve actual and detailed data on energy and thermo-dynamical properties (temperature levels, state-of-matter etc.) of excess heat to be recovered from considered activities
4. Local heat synergy projects should address also organisational aspects such as collaboration agreements, where mutually beneficial allocation of synergy benefits to all involved parties is a key priority
5. Approximately 26.2 EJ of primary energy was supplied to 2712 considered energy and industry sector facilities in EU28 during the year 2010. A total excess heat volume of 11.3 EJ is anticipated to have been rejected from these activities during this year
6. Excess heat activities in industrial sectors dominate the selection in terms of number of facilities, while main activity thermal power generation plants constitute the major share of annual excess heat volumes. Nineteen EU28 Member States currently have waste incineration plants in operation
7. Seven Member States (Germany, Spain, France, Italy, the Netherlands, Poland, and the United Kingdom) account for 72% of the total primary energy supply, which is correspondingly reflected in anticipated excess heat availabilities.
Page 12
References
CEC, 1982. Energy - Waste heat from industry for district heating, EUR 8116, Directorate-General Energy, Commission of the European Communities. Luxembourg.
CEWEP, 2013. CEWEP Energy Report III (Status 2007-2010): Results of Specific Data for Energy, R1 Plant Efficiency Factor and NCV of 314 European Waste-to-Energy (WtE) Plants. December 2012, Confederation of European Waste-to-Energy Plants. Würzburg/Brussels.
CEWEP, 2014. Country Reports: 2010 Country Report on Waste Management, Confederation of European Waste-to-Energy Plants. Available at: (http://www.cewep.eu/information/data/subdir/442._Country_Report_on_Waste_Management.html).
Connolly, D., Lund, H., Mathiesen, B.V., Werner, S., Möller, B., Persson, U., Boermans, T., Trier, D., Østergaard, P.A., Nielsen, S., 2014. Heat Roadmap Europe: Combining district heating with heat savings to decarbonise the EU energy system. Energy Policy 65, 475-489.
Connolly, D., Vad Mathiesen, B., Alberg Östergaard, P., Möller, B., Nielsen, S., Lund, H., Persson, U., Werner, S., Grözinger, J., Boermans, T., Bosquet, M., Trier, D., 2013. Heat Roadmap Europe 2050 - Second pre-study for EU27. Euroheat & Power, Brussels. Available at: (http://www.euroheat.org/Heat-Roadmap-Europe-165.aspx).
Connolly, D., Vad Mathiesen, B., Alberg Östergaard, P., Möller, B., Nielsen, S., Lund, H., Persson, U., Werner, S., Nilsson, D., Trier, D., 2012. Heat Roadmap Europe 2050 - First pre-study for EU27. Euroheat & Power, Brussels. Available at: (http://www.euroheat.org/Heat-Roadmap-Europe-165.aspx).
Ebrahimi, K., Jones, G.F., Fleischer, A.S., 2014. A review of data center cooling technology, operating conditions and the corresponding low-grade waste heat recovery opportunities. Renewable and Sustainable Energy Reviews 31, 622-638.
Ebrahimi, K., Jones, G.F., Fleischer, A.S., 2015. Thermo-economic analysis of steady state waste heat recovery in data centers using absorption refrigeration. Applied Energy 139, 384-397.
EC, 2014. Climate Action: European Union Transaction Log. Overall ETS Period information. Second Commitment Period 2013, Croatia. European Commission, Brussels. Available at (2015-01-15): (http://ec.europa.eu/environment/ets/welcome.do?languageCode=en).
EEA, 2013a. The European Pollutant Release and Transfer Register (E-PRTR). Downloaded data category (2013-07-08): eprtr_v4.2_mdb.zip. European Environment Agency. Available at: (http://www.eea.europa.eu/data-and-maps/data/member-states-reporting-art-7-under-the-european-pollutant-release-and-transfer-register-e-prtr-regulation-5).
EEA, 2013b. European Union Emissions Trading System (EU ETS) data from CITL. Downloaded data category (2013-02-27): CITL_v11_csv.zip. European Environment Agency. Available at: (http://www.eea.europa.eu/data-and-maps/data/european-union-emissions-trading-scheme-eu-ets-data-from-citl-5).
EEA, 2013c. National emissions reported to the UNFCCC and to the EU Greenhouse Gas Monitoring Mechanism. Downloaded data category (2013-07-08): UNFCCC_v14_mdb.zip. European Environment Agency. Available at: (http://www.eea.europa.eu/data-and-maps/data/national-emissions-reported-to-the-unfccc-and-to-the-eu-greenhouse-gas-monitoring-mechanism-7).
ESRI, 2014. Understanding our world, Environmental Systems Research Institute Inc. Available at: (http://www.esri.com/).
Page 13
HRE, 2014. Heat Roadmap Europe - A low-carbon heating and cooling strategy for Europe, Web page available at (2014-10-29): (http://www.heatroadmap.eu/).
IEA, 2012. Energy Balances of OECD and Non-OECD Countries for 2010 (2012 Edition). Summary Energy Balances. International Energy Agency, Paris.
IndustryAbout, 2014. IndustryAbout: World industrial information, Available at: (http://industryabout.com/).
IPCC, 2006. 2006 IPCC Guidelines for National Greenhouse Gas Inventories, Prepared by the National Greenhouse Gas Inventories Programme, Eggleston H.S., Buendia L., Miwa K., Ngara T. and Tanabe K. Published: IGES, Japan.
ISWA, 2012. Waste-to-Energy: State-of-the-Art-Report, Statistics, 6th Edition, August 2012., International Solid Waste Association.
McKenna, R.C., Norman, J.B., 2010. Spatial modelling of industrial heat loads and recovery potentials in the UK. Energy Policy 38, 5878-5891.
Morandin, M., Hackl, R., Harvey, S., 2014. Economic feasibility of district heating delivery from industrial excess heat: A case study of a Swedish petrochemical cluster. Energy 65, 209-220.
Persson, U., 2015. District heating in future Europe: Modelling expansion potentials and mapping heat synergy regions, Dissertation Thesis. Series Nr: 3769. Energy and Environment. Chalmers University of Technology, Göteborg.
Persson, U., Möller, B., Werner, S., 2014. Heat Roadmap Europe: Identifying strategic heat synergy regions. Energy Policy 74, 663-681.
Persson, U., Werner, S., 2012. District heating in sequential energy supply. Applied Energy 95, 123-131.
Rattner, A.S., Garimella, S., 2011. Energy harvesting, reuse and upgrade to reduce primary energy usage in the USA. Energy 36, 6172-6183.
Swithenbank, J., Finney, K.N., Chen, Q., Yang, Y.B., Nolan, A., Sharifi, V.N., 2013. Waste heat usage. Appl. Therm. Eng. 60, 430-440.
Page 14
Appendix
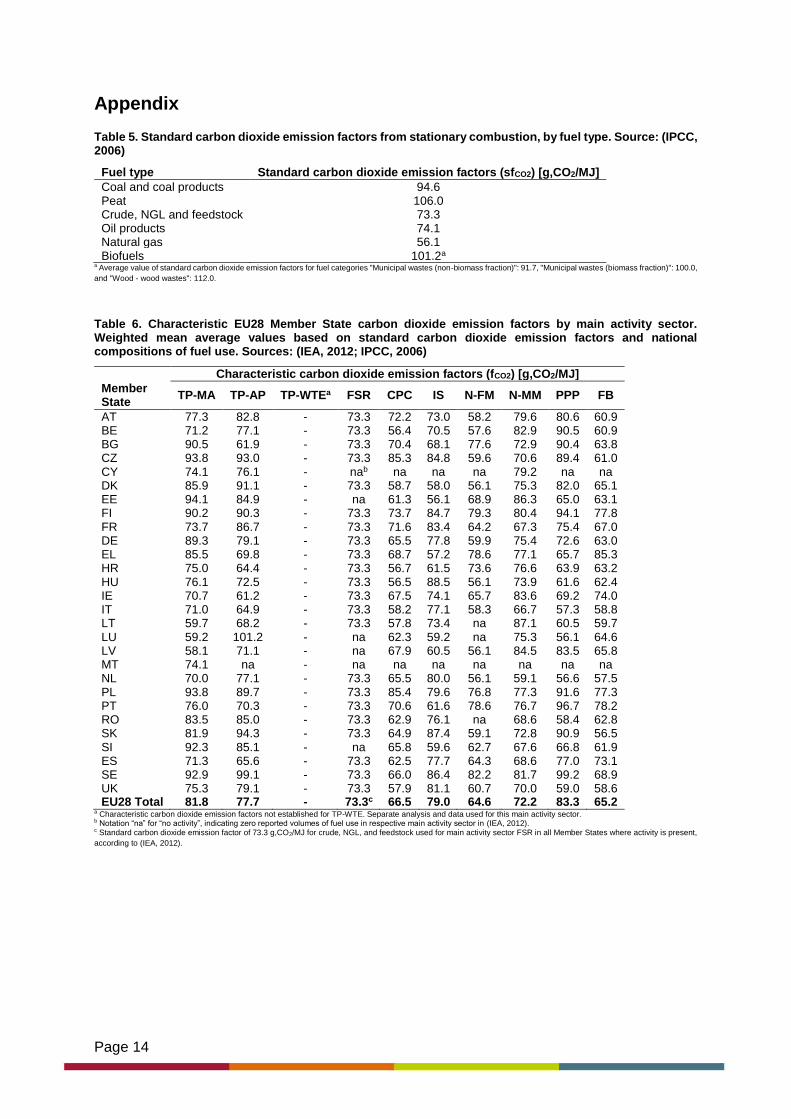
Table 5. Standard carbon dioxide emission factors from stationary combustion, by fuel type. Source: (IPCC, 2006)
Fuel type Standard carbon dioxide emission factors (sfCO2) [g,CO2/MJ]
Coal and coal products 94.6 Peat 106.0 Crude, NGL and feedstock 73.3 Oil products 74.1 Natural gas 56.1 Biofuels 101.2a
a Average value of standard carbon dioxide emission factors for fuel categories "Municipal wastes (non-biomass fraction)": 91.7, "Municipal wastes (biomass fraction)": 100.0,
and "Wood - wood wastes": 112.0.
Table 6. Characteristic EU28 Member State carbon dioxide emission factors by main activity sector. Weighted mean average values based on standard carbon dioxide emission factors and national compositions of fuel use. Sources: (IEA, 2012; IPCC, 2006)
Characteristic carbon dioxide emission factors (fCO2) [g,CO2/MJ]
Member State
TP-MA TP-AP TP-WTEa FSR CPC IS N-FM N-MM PPP FB
AT 77.3 82.8 - 73.3 72.2 73.0 58.2 79.6 80.6 60.9 BE 71.2 77.1 - 73.3 56.4 70.5 57.6 82.9 90.5 60.9 BG 90.5 61.9 - 73.3 70.4 68.1 77.6 72.9 90.4 63.8 CZ 93.8 93.0 - 73.3 85.3 84.8 59.6 70.6 89.4 61.0 CY 74.1 76.1 - nab na na na 79.2 na na DK 85.9 91.1 - 73.3 58.7 58.0 56.1 75.3 82.0 65.1 EE 94.1 84.9 - na 61.3 56.1 68.9 86.3 65.0 63.1 FI 90.2 90.3 - 73.3 73.7 84.7 79.3 80.4 94.1 77.8 FR 73.7 86.7 - 73.3 71.6 83.4 64.2 67.3 75.4 67.0 DE 89.3 79.1 - 73.3 65.5 77.8 59.9 75.4 72.6 63.0 EL 85.5 69.8 - 73.3 68.7 57.2 78.6 77.1 65.7 85.3 HR 75.0 64.4 - 73.3 56.7 61.5 73.6 76.6 63.9 63.2 HU 76.1 72.5 - 73.3 56.5 88.5 56.1 73.9 61.6 62.4 IE 70.7 61.2 - 73.3 67.5 74.1 65.7 83.6 69.2 74.0 IT 71.0 64.9 - 73.3 58.2 77.1 58.3 66.7 57.3 58.8 LT 59.7 68.2 - 73.3 57.8 73.4 na 87.1 60.5 59.7 LU 59.2 101.2 - na 62.3 59.2 na 75.3 56.1 64.6 LV 58.1 71.1 - na 67.9 60.5 56.1 84.5 83.5 65.8 MT 74.1 na - na na na na na na na NL 70.0 77.1 - 73.3 65.5 80.0 56.1 59.1 56.6 57.5 PL 93.8 89.7 - 73.3 85.4 79.6 76.8 77.3 91.6 77.3 PT 76.0 70.3 - 73.3 70.6 61.6 78.6 76.7 96.7 78.2 RO 83.5 85.0 - 73.3 62.9 76.1 na 68.6 58.4 62.8 SK 81.9 94.3 - 73.3 64.9 87.4 59.1 72.8 90.9 56.5 SI 92.3 85.1 - na 65.8 59.6 62.7 67.6 66.8 61.9 ES 71.3 65.6 - 73.3 62.5 77.7 64.3 68.6 77.0 73.1 SE 92.9 99.1 - 73.3 66.0 86.4 82.2 81.7 99.2 68.9 UK 75.3 79.1 - 73.3 57.9 81.1 60.7 70.0 59.0 58.6 EU28 Total 81.8 77.7 - 73.3c 66.5 79.0 64.6 72.2 83.3 65.2
a Characteristic carbon dioxide emission factors not established for TP-WTE. Separate analysis and data used for this main activity sector. b Notation “na” for “no activity”, indicating zero reported volumes of fuel use in respective main activity sector in (IEA, 2012). c Standard carbon dioxide emission factor of 73.3 g,CO2/MJ for crude, NGL, and feedstock used for main activity sector FSR in all Member States where activity is present,
according to (IEA, 2012).
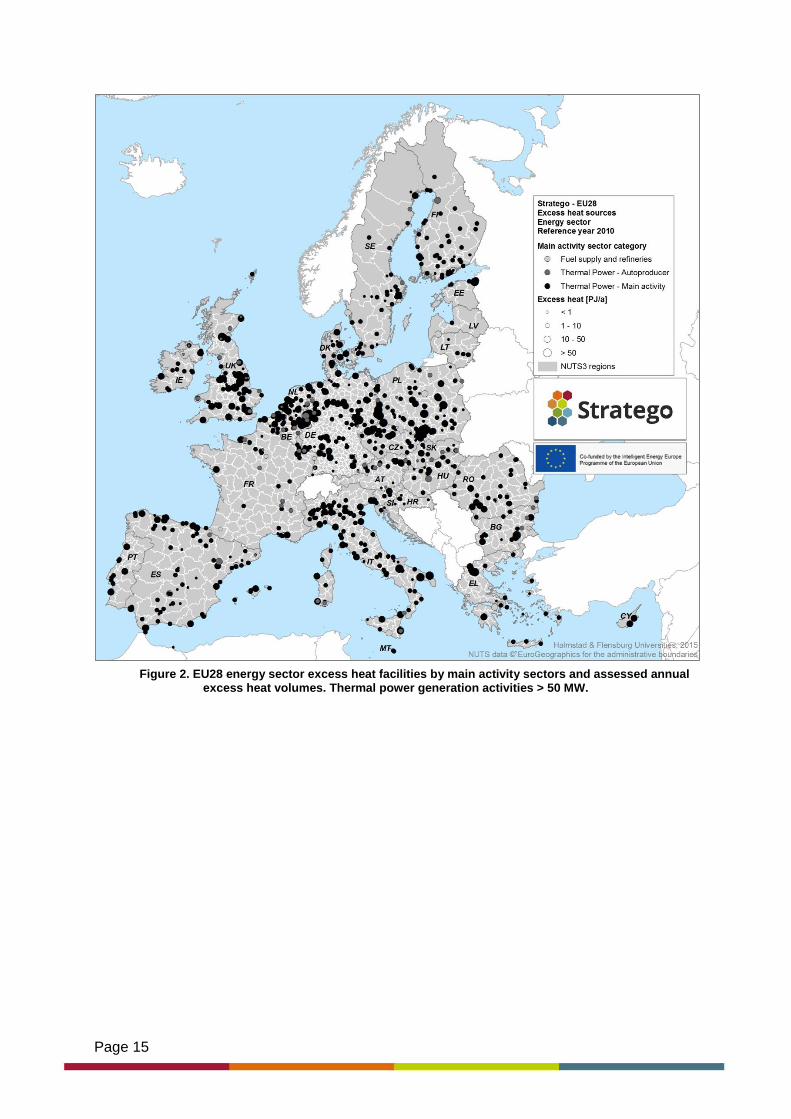
Page 15
Figure 2. EU28 energy sector excess heat facilities by main activity sectors and assessed annual excess heat volumes. Thermal power generation activities > 50 MW.

Page 16
Figure 3. EU28 waste incineration excess heat facilities by main activity sector and assessed annual excess heat volumes.
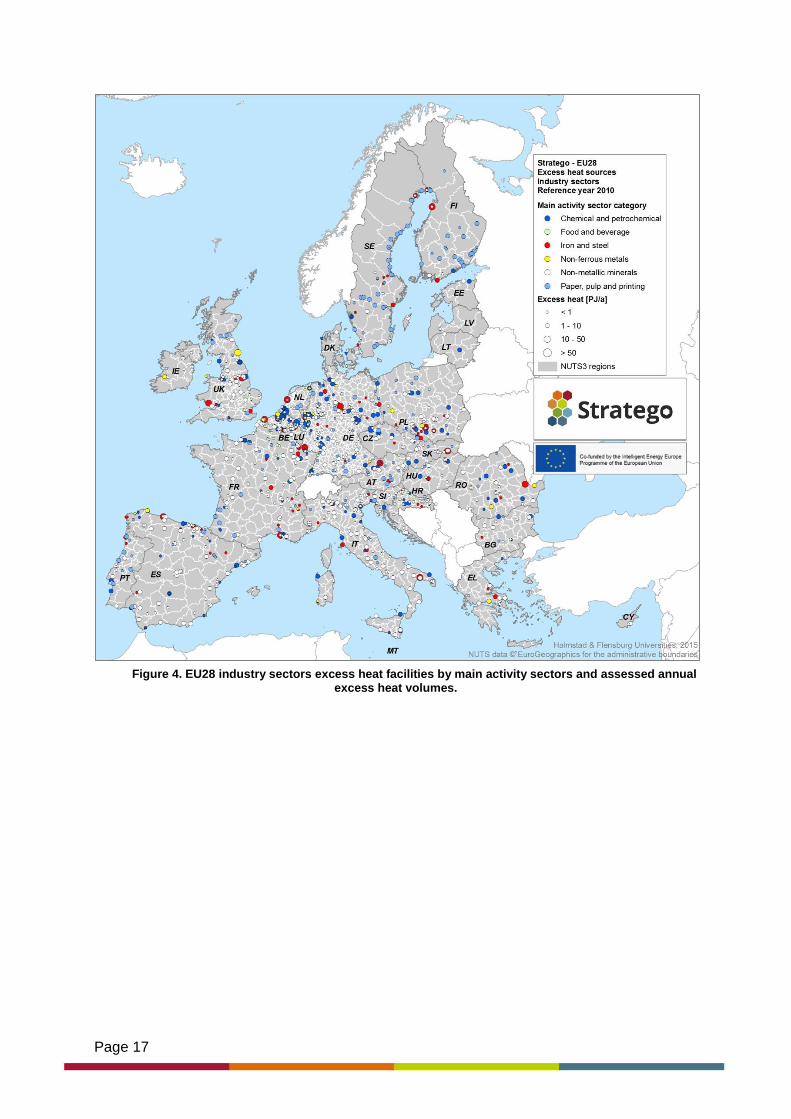
Page 17
Figure 4. EU28 industry sectors excess heat facilities by main activity sectors and assessed annual excess heat volumes.


![Large-scale solar district heating plants in Danish smart ......113 [41] 2assessed the performance of a district heating systems with 1002 m solar collector field, 114 industry excess](https://static.fdocuments.us/doc/165x107/6030216f60da735c6a6e89a0/large-scale-solar-district-heating-plants-in-danish-smart-113-41-2assessed.jpg)