QUANTIFYING THE DIVERSITY AND ACTIVITY OF … -Eint Kyi.pdf · particle-attached microorganisms,...
81
QUANTIFYING THE DIVERSITY AND ACTIVITY OF MICROBES CATALYZING PARTICLE DECOMPOSITION IN OPEN OCEAN A THESIS SUBMITTED TO THE GRADUATE DIVISION OF THE UNIVERSITY OF HAWAI’I AT MÃNOA IN PARTIAL FULFILLMENT OF THE REQUIREMENTS FOR THE DEGREE OF MASTER OF SCIENCE IN OCEANOGRAPHY May 2018 Eint M. Kyi Thesis Committee: Matthew J. Church, Chairman David M. Karl Edward F. DeLong
Transcript of QUANTIFYING THE DIVERSITY AND ACTIVITY OF … -Eint Kyi.pdf · particle-attached microorganisms,...

QUANTIFYING THE DIVERSITY AND ACTIVITY OF MICROBES CATALYZING PARTICLE DECOMPOSITION
IN OPEN OCEAN
A THESIS SUBMITTED TO THE GRADUATE DIVISION OF THE UNIVERSITY OF HAWAI’I AT MÃNOA IN PARTIAL FULFILLMENT OF THE
REQUIREMENTS FOR THE DEGREE OF
MASTER OF SCIENCE
IN
OCEANOGRAPHY
May 2018
Eint M. Kyi
Thesis Committee: Matthew J. Church, Chairman
David M. Karl Edward F. DeLong

ii
© Copyright 2018 Eint M. Kyi
All rights reserved.

iii
We certify that we have read this thesis and that, in our opinion, it is satisfactory in scope and
quality as a thesis for the degree of Master of Science in Oceanography.
THESIS COMMITTEE
CHAIR ADVISOR
iv
ACKNOWLEDGEMENTS
This work would not have been possible without the assistance of many people and
organizations. I would like to first acknowledge my advisor Dr. Matthew J. Church, for his
unwavering support, as well as for bringing me to UH Manoa to join his lab. It has been a
privilege and an education to have him as my mentor. I am also indebted to my committee
members, Dr. David Karl and Dr. Edward DeLong for their support, encouragement, and insight
with my thesis. I am also very grateful to Dr. Markus Lindh for his patience and his consistent
help with my data, along with Alexa Nelson, for her guidance and support with my experiments.
I also thank Dr. Donn Viviani, Dr. Daniela Böttjer and Brenner Wai for all their help in my time of
need.
This work would not have been possible without the assistance and fellowship of the personnel
of the Hawai’i Ocean Time-series (HOT) program. I am deeply grateful to the physical
oceanography team on these cruises, Blake Watkins and Tara Clemente for their help with the
net trap deployments and recoveries.
Lastly, I would like to acknowledge the organizations that have financially supported my
research: Center for Microbial Oceanography: Research and Education (CMORE), Simons
Collaboration on Ocean Processes and Ecology (SCOPE), National Science Foundation (NSF),
and the Department of Oceanography at UH Manoa.
v
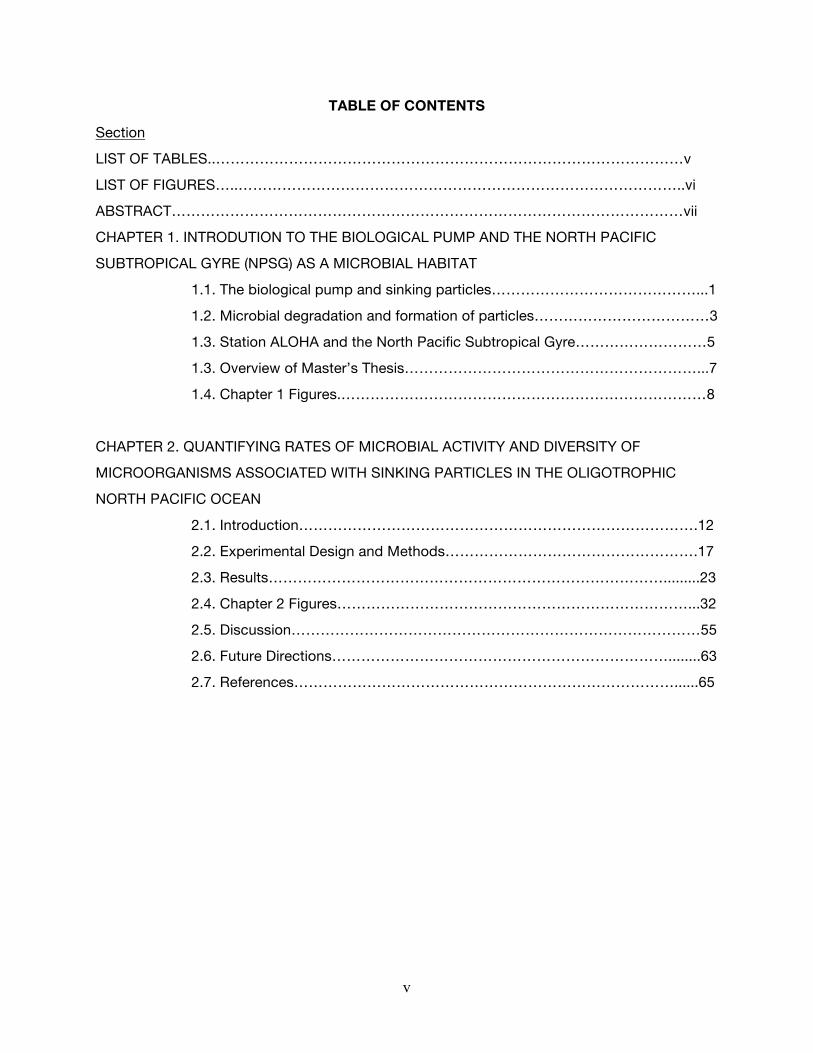
TABLE OF CONTENTS
Section LIST OF TABLES..……………………………………………………………………………………v LIST OF FIGURES…..………………………………………………………………………………..vi ABSTRACT……………………………………………………………………………………………vii CHAPTER 1. INTRODUTION TO THE BIOLOGICAL PUMP AND THE NORTH PACIFIC SUBTROPICAL GYRE (NPSG) AS A MICROBIAL HABITAT 1.1. The biological pump and sinking particles……………………………………...1
1.2. Microbial degradation and formation of particles………………………………3 1.3. Station ALOHA and the North Pacific Subtropical Gyre………………………5 1.3. Overview of Master’s Thesis……………………………………………………...7 1.4. Chapter 1 Figures.…………………………………………………………………8 CHAPTER 2. QUANTIFYING RATES OF MICROBIAL ACTIVITY AND DIVERSITY OF MICROORGANISMS ASSOCIATED WITH SINKING PARTICLES IN THE OLIGOTROPHIC NORTH PACIFIC OCEAN
2.1. Introduction……………………………………………………………………….12 2.2. Experimental Design and Methods…………………………………………….17 2.3. Results……………………………………………………………………….........23 2.4. Chapter 2 Figures………………………………………………………………...32
2.5. Discussion…………………………………………………………………………55 2.6. Future Directions……………………………………………………………........63
2.7. References……………………………………………………………………......65

vi
LIST OF TABLES
Chapter 2
Table 1. Total organic carbon (TOC) and particulate carbon (PC) concentrations……………….32 2. Picoplankton cell abundances…………………………….………………………………….33 3. Size fractionated rates of bacterial production……………………………………………..34 4. Size fractionated rates of carbon fixation……………………………………………………36 5. Relative abundances of top 10 taxa………………………………………………………….38 6. PERMANOVA results of all cruises…………………………….……………………………..41
vii
LIST OF FIGURES
Chapter 1
Figure 1. NASA SeaWIFs ocean color of the NPSG……….………………………………….………..8 2. Time-series of primary production and particle flux at Station ALOHA…………………...9 3. Vertical attenuation of particulate carbon flux at Station ALOHA………. ……….………10 4. Conceptual view of the biological pump at Station ALOHA…………….…..…………….11
Chapter 2
Figure 1. Rates of bacterial production during particle enrichment experiments………………….42 2. Rates of cell normalized bacterial production………………………………………………43 3. Rates of carbon fixation during particle enrichment experiments……..…………………44 4. Rates of cell normalized carbon fixation…………………………………………………….45 5. Box plot depicting Shannon diversity from during particle enrichment experiments ….46 6. Box plot depicting Pielou’s evenness from during particle enrichment experiments ....47 7. Box plot depicting number of OTUs grouped by filter size……….……………………….48 8. Relative abundances of major taxa from experiments conducted during August,
2016……………………………………………………………………………………………...49 9. Relative abundances of major taxa from experiments conducted during March,
2017……………………………………………………………………………………………...50 10. Relative abundances of major taxa from experiments conducted during March,
2017……………………………………………………………………………………………...51 11. Relative abundances of major taxa from experiments conducted during April, 2017....52 12. Relative abundances of major taxa from experiments conducted during April, 2017….53 13. Non-metric multidimensional scaling of operational taxonomic units (OTUs) ………….54
viii
ABSTRACT
Sinking particles are a primary mechanism for transport of material and energy from the upper
ocean to the deep sea, and hence they are a key component of the ocean’s biological carbon
pump. These particles are frequently colonized by microorganisms that catalyze their
decomposition. In this thesis, I conducted a series of experiments aimed at quantifying
microbial productivity (including both filter size-fractionated rates of bacterial production and
inorganic carbon fixation) associated with sinking particles at Station ALOHA (22° 45’N, 158°
00’W) in the North Pacific Subtropical Gyre (NPSG). In addition, I examined the composition of
microorganisms associated with various filter size-fractions from these experiments based on
amplifying and sequencing 16S ribosomal (rRNA) genes. Results from these experiments
revealed that the addition of particles significantly increased rates of bacterial production
across all filter size fractions (except in the 2-20 µm filter fraction during April, 2017 (HOT 292),
relative to unamended controls. In contrast, rates of carbon fixation generally did not increase
significantly in any of the filter size fractions, aside from 0.2-2 µm filter size fraction from March
2017 (KOK 1703-2) and 2-20 µm filter size fractions from 3 single experiments conducted in
August, 2016 (HOT 286), and March, 2017 (KOK 1703-1, KOK 1703-2) at 175 m. Sequencing of
amplified 16S rRNA genes revealed that both treatment and filter size fractions independently
had significant effects on the bacterial taxonomic composition. In particular, the composition of
microorganisms associated with the smallest filter size fraction (0.2 µm) in the unamended
controls were typically dominated by members of the Thaumarchaea, Alphaproteobacteria,
Actinobacteria, and Cyanobacteria, while the larger filter fractions (2 µm and 20 µm) in the
controls were generally dominated by members of the Planctomycetes, Flavobacteria,
Bacteroidetes, and Gammaproteobacteria. In the particle-enriched treatments, the
composition of 16S rRNA genes in the 0.2 µm filter size fraction were similar to this filter

ix
fraction in the unamended controls. However, the larger filter size fractions were enriched in
members of the Alphaproteobacteria, Gammaproteobacteria, and Bacteroidetes. In general,
particle-enriched treatments were observed to be dominated by heterotrophic copiotrophs,
further evidenced by the significant increase in bacterial production rates.
1
CHAPTER 1. INTRODUCTION TO THE BIOLOGICAL PUMP AND THE NORTH PACIFIC
SUBTROPICAL (NPSG) AS A MICROBIAL HABITAT
1.1 The biological pump and sinking particles
Ocean ecosystems comprise some of the largest habitats on Earth. These ecosystems play a
globally important role in the cycling of numerous elements, catalyzed in large part through the
metabolic activities of marine microorganisms. Microorganisms, defined here as organisms <3
µm in diameter, constitute the majority of biomass in these ecosystems, and through their
growth and collective metabolism these organisms largely regulate fluxes of bioelements in the
sea.
Photosynthetically-fueled fixation of carbon dioxide (CO2) is the primary source of organic
matter to the open ocean. Subsequent consumption of this organic material by diverse
microorganisms fuels rapid turnover of elements. Hence, solar energy has a major impact on
the biological structure of the ocean. As a result, the ocean water column is often classified
into discrete realms that include the sunlit region of the epipelagic zone (typically <150 m in the
open sea), underlain by the mesopelagic (150-1000 m), and bathypelagic (1000-5000 m)
waters. Each of these zones harbors distinct assemblages of organisms with accompanying
differences in metabolisms and turnover of chemicals.
The biological pump describes the collective set of processes involved in maintaining vertical
gradients of dissolved inorganic carbon (DIC) in the ocean. The pump includes several key
processes that occur in different regions of the water column. In the epipelagic zone, DIC and
nutrients are fixed into organic matter via the activities of photosynthetic organisms.
Photosynthetic production of cellular material undergoes a complex series of transformations,
2
many modulated by food web dynamics, that result in rapid consumption and remineralization
of recently fixed carbon (C). However, a small fraction of upper ocean production is vertically
transported out of the surface ocean via the downward movement of particulate organic matter
(POM; Figure 3), and through convective mixing of dissolved organic matter (DOM; Buessler et
al. 2007; Carlson et al., 1994). The gravitationally settling of POM from the surface ocean fuels
the energetic and nutritional demands of organisms in the meso- and bathypelagic waters,
resulting in intensive remineralization of this material (Martin et al., 1987; Hoffert and Volk
1985). Throughout the open ocean, microbial metabolism largely regulates the strength of the
biological pump, making microbes key regulators of the pump’s influence on air-sea CO2
exchange.
The major processes affecting the magnitude of the flux of sinking particles include enzymatic
or abiotic solubilization of particles, mechanical or biological aggregation, respiration by
particle-attached microorganisms, and degradation due to zooplankton feeding and fecal pellet
repackaging of material (Alldredge et al. 1990; Buesseler and Boyd 2009; Collins et al., 2015;
Herndl and Reinthaler 2013). POM consists of a variety of materials, including live and dead
organisms, zooplankton carcasses, organic debris and fecal pellets. Although particle size
varies with both environmental and ecological conditions, it is hypothesized that smaller
particles generally have slower sinking speeds than larger particles, as predicted by Stokes
Law (Fowler and Knauer 1986). Although the importance of large particles (>100 µm) in
transporting carbon to the deep ocean has been observed in multiple ocean environments
(Asper and Smith 2003; Guidi et al., 2009; Jackson et al., 2005), fast sinking may not be
required for small particles to contribute significantly to carbon export (McDonnell and
Buesseler 2010). Small pico-plankton have been suggested to contribute more to oceanic
carbon export than has been historically recognized (Richardson and Jackson 2007). Small
3
particles may be transported to depth at relatively high rates due to particle density or physical
mixing. For example, in the Mediterranean Sea, the subarctic Pacific, and subtropical North
Pacific and Atlantic, approximately 50% of the carbon flux has been attributed to particles
sinking less than 100 m per day (Durkin et al., 2015; Trull et al., 2008). Sinking particles can be
transformed into smaller suspended particles or into dissolved materials as part of the
remineralization process (Cassar et al., 2015); alternatively, repackaging or particulate material
(for example via zooplankton grazing and fecal pellet formation) can transform particles into
larger aggregates (Steinberg et al. 2008). Such aggregates have historically been studied using
visual observations (for example via SCUBA divers), and through various optical and camera
systems (Bochdansky et al., 2013; Bishop 2009).
1.2 Microbial Degradation and Formation of Sinking Particles
Sinking particles can be inhabited by high densities of attached and metabolically active
microbes due to being more enriched in reduced organic and inorganic substrates than the
surrounding water (Rieck et al., 2015). Such bacterial colonization appears important to both
the formation and decomposition of POM aggregates. However, the contribution of attached
bacteria to total bacterial activity is highly variable and depends in part on the concentration of
attached bacteria and on the quantity and the quality of the suspended particles (Ghiglione et
al., 2009). Several studies have shown that particle-attached bacteria are phylogenetically
different from the free-living bacteria in the water column, not only in oceanic systems (DeLong
et al., 1993; Acinas et al.,1999), but also in estuaries (Bidle and Fletcher 1995) and in coastal
lagoons (LaMontagne and Holden 2003). Furthermore, sequencing of polymerase chain
reaction (PCR) amplified 16S rRNA genes suggests greater diversity of bacteria on particles
compared to the free-living bacteria, with microbial community structure varying among
discrete particle size fractions (Ganesh et al. 2014; Ortega-Retuerta et al., 2013; Rieck et al.,
4
2015; Smith et al., 2013). In particular, members of the Bacteroidetes, Planctomycetes, and
Betaproteobacteria are often enriched in larger particle size fractions, while
Alphaproteobacteria, Cyanobacteria, and additional members of the Gammaproteobacteria
more consistently enriched in suspended, smaller particles (Allen et al., 2012; Kellogg and
Deming, 2009). Rieck et al. (2015) observed that changes in environmental variables can further
affect bacterial diversity on particles; in this study, bacterial richness was greater during the
fall/winter than in summer in the Baltic surface waters. Moreover, various studies indicate that
a large fraction (~40-70%) of marine bacteria attached to particles can demonstrate motility
and chemotactic behavior (Grossart et al., 2003; Blackburn et al., 1998). In addition, hydrolytic
enzyme activities of attached bacteria may help liberate DOM from the particles, thereby
attracting other chemotactic bacteria (Long and Azam, 2001).
There is also growing evidence demonstrating the direct significance of biotic mechanisms in
the formation and degradation of POM aggregates. Research into the formation of aggregates
suggests that the formation of POM may be catalyzed by living microorganisms. In a series of
experiments aimed at understanding mechanisms underlying POM aggregation, treatments
where samples were poisoned or bacteria were removed by filtration did not form aggregates,
while those containing bacteria did form aggregates (Biddanda 1985). In addition, as
zooplankton actively graze, POM can be repackaged from small particles into larger fecal
pellets (Wilson et al. 2008). Moreover, discarded mucus feeding webs from net-feeding
organisms can cause POM to aggregate. Bacteria and phytoplankton have also been shown to
secrete large amounts of mucopolysaccharides, or transparent exopolymer particles (TEP),
which further control the formation of POM aggregates (Alldredge et al., 1993; Passow and
Alldredge 1994). TEP can be produced by diatoms during exponential growth or stationary

5
phase and has been shown to positively correlate with phytoplankton biomass (Kiorboe and
Hansen 1993; Logan et al., 1995).
In contrast, zooplankton feeding strategies and bacterial colonization of POM can also degrade
POM aggregates. Zooplankton grazing reduces the total amount of POM in the water column
and shifts its occurrence from large, fast-sinking aggregates to smaller aggregates (Dilling and
Alldredge 2000). Bacterial hydrolysis can also play a major role in particle decomposition. Upon
colonization, bacteria solubilize particles and polymers with hydrolytic extracellular enzymes
such as proteases and polysaccharides (Smith et al. 1992). These microbial processes,
coupled with chemical dissolution of minerals, physical degradation of POM, and
advection/diffusion of pore fluids lead to the degradation of POM aggregates.
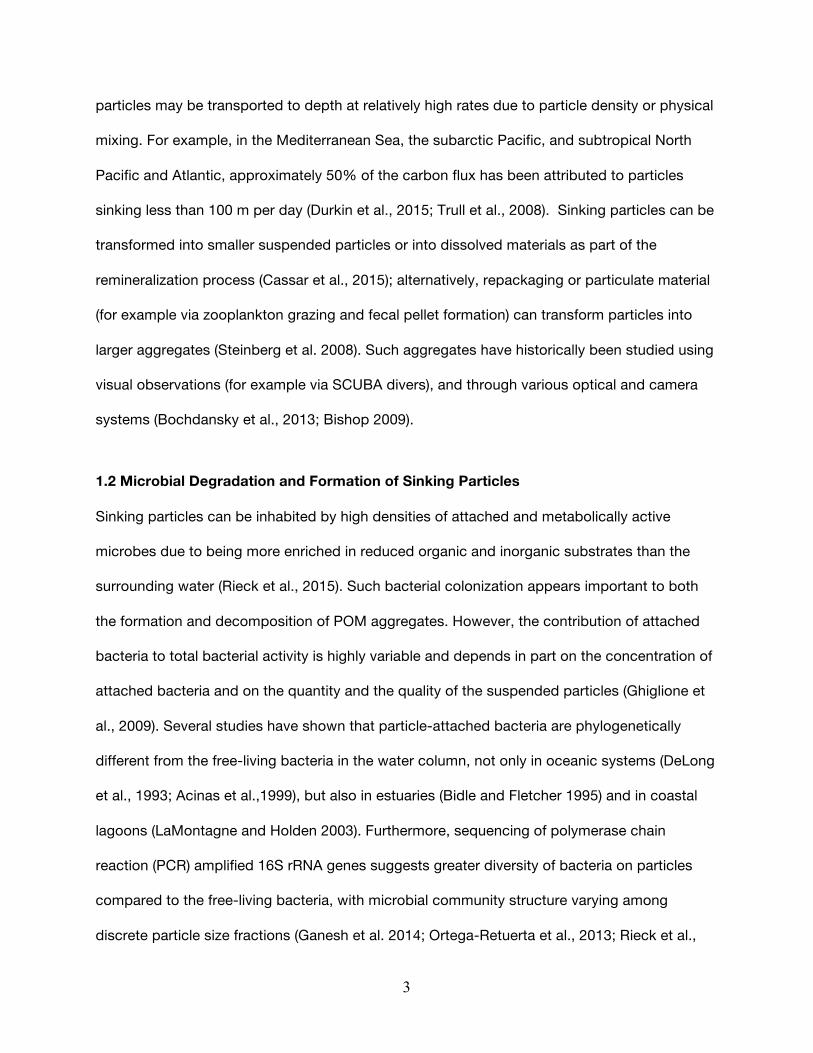
1.3 Station ALOHA and the North Pacific Subtropical Gyre
The North Pacific Subtropical Gyre (NPSG) is one of the largest continuous ecosystems on
Earth, covering ~2 x 10⁷ km2 (Sverdrup et al., 1946). The upper ocean of the NPSG is
characterized by low concentrations of nutrients and low plankton biomass. The oligotrophic
condition of the epipelagic waters derives from thermal stratification of the upper ocean,
persistently high solar radiation, and rapid plankton consumption of nutrients (Karl and Church
2017). In 1988, the Hawaii Ocean Time-series (HOT) program established the field sampling
site Station ALOHA (A Long-Term Oligotrophic Habitat Assessment, 22.75°N, 158°W), located
in the deep ocean (~4,800 m depth), approximately 100 kilometers north of the Hawaiian Island
O’ahu (Figure 1). HOT program sampling at Station ALOHA has provided time-series
measurements to characterize seasonal to inter-annual scale changes in physical,
biogeochemical, and ecological dynamics in the NPSG. Moreover, the HOT measurements
provide insight into microbial community dynamics in this region of the world’s oceans.

6
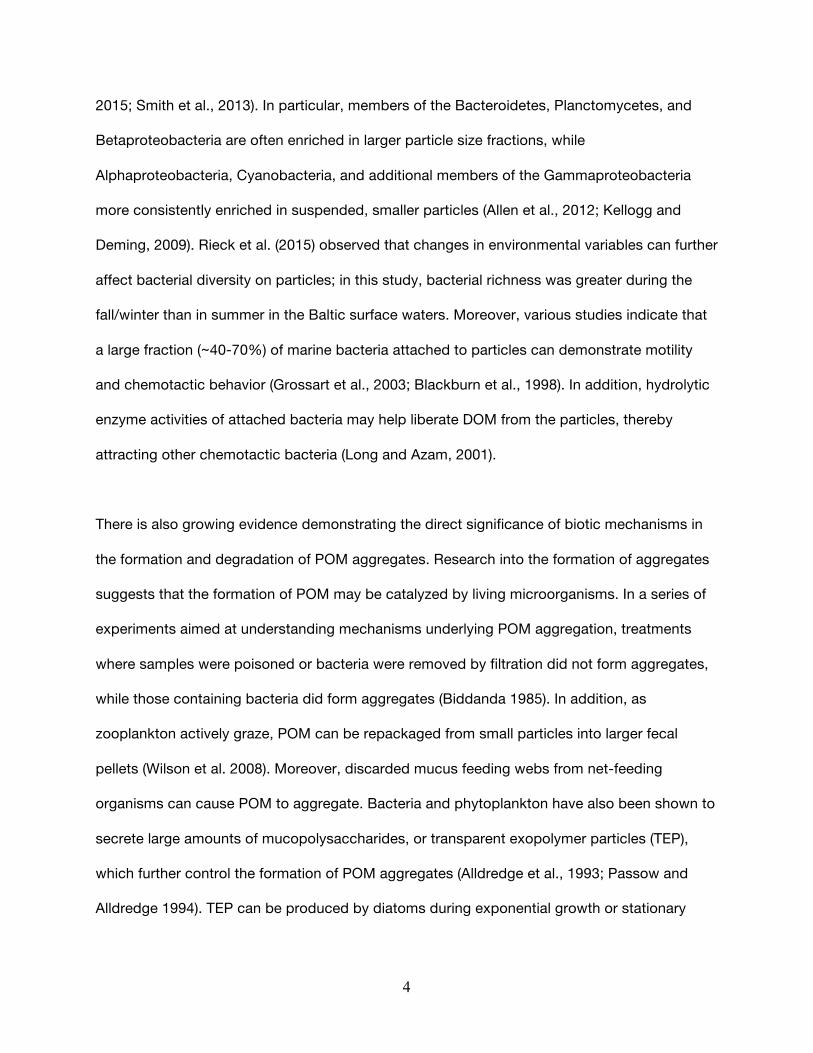
Measurements of primary production, as estimated from 14C-bicarbonate assimilation, reveal
organic matter production (0-175 m) ranges between 32.0 to 52.5 mmol C m-2 d-1, with rates
typically ~2 fold greater in the summer (Karl and Church 2017). The particle size distribution at
Station ALOHA follows a power law function, with the concentration of particles rapidly
decreasing with increasing particle size (Barone et al. 2015; White et al., 2015). Moreover, this
distribution is affected by seasonal changes, with particles in the size range of 5 to 30 µm
becoming more abundant during summer months (White et al., 2015). Downward sinking
particle flux, measured using sediment traps at 150 m, ranges between 0.83 to 5 mmol m-2 d-1,
with rates typically slightly elevated during the summer (Figure 2). POM flux attenuates rapidly
with depth; as particles sink through the water column, they undergo decomposition, resulting
in decreases in sinking flux with depth. Based on the sediment trap collections of sinking
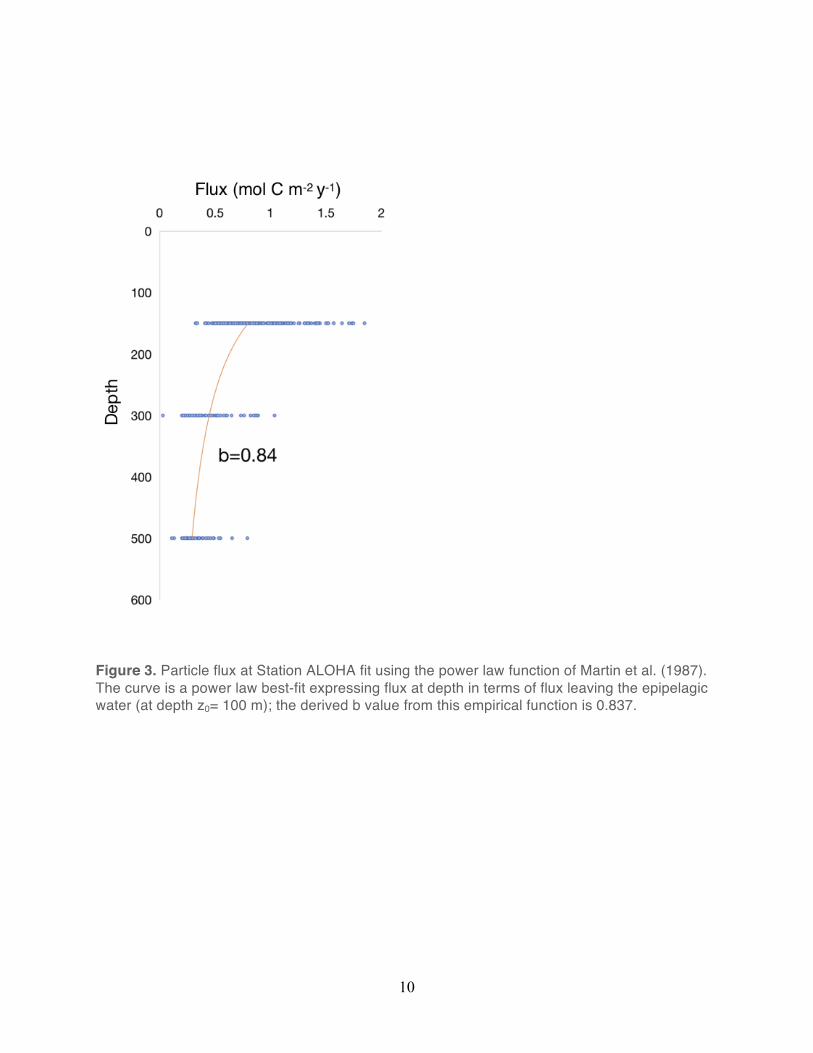
particles in the North Pacific, Martin et al. (1987) modeled the vertical change in particle flux
using an empirically derived power-law function:
Fz= F100 (z/100)-b
where Fz is the sinking flux at depth Z, F100 is the measured flux at a 100 m depth horizon, and
b describes the rate of attenuation of the downward flux. For the Martin et al. (1987) dataset,
the derived value of b was 0.86, with flux decreasing by more than an order of magnitude
between 100 and 1000 m depth. Subsequent work at Station ALOHA, using neutrally buoyant
sediment traps modified this b value to 1.3 (Buesseler et al. 2007). Based on HOT program
measurements of particle flux at Station ALOHA, Karl et al. (1996) derived a b value of 0.82
(Figure 3).
Despite relatively little seasonality in upper ocean productivity and material export, sediment
traps located in the lower mesopelagic and bathypelagic waters at Station ALOHA reveal
predictable and large seasonal fluctuations in the downward export of sinking particles. In

7
particular, more than 30% of the annual particle export to the deep sea occurs during a
relatively short period (~20 days) in mid-to-late summer (Karl et al. 2012). This rapid pulse of
material to the seabed appears linked to transitions in upper ocean plankton community
structure, with relatively large diatoms and nitrogen-fixing microorganisms comprising an
increased proportion of the exported particles (Figure 4).
1.3. Overview of Master’s Thesis
My Master’s thesis sought to investigate microbial activities and diversity associated with
sinking particles collected from the upper waters of the mesopelagic zone at Station ALOHA.
Samples were collected using a net trap particle collector (Peterson et al., 2005) deployed at
the top of the mesopelagic waters (175 m) to passively collect sinking particles, and these
particles were used for subsequent experiments to quantify rates of heterotrophic bacterial
production (based on 3H-leucine incorporation) and carbon fixation (based on assimilation of
14C-bicarbonate) at 175 m. In addition, samples were collected from these experiments to
examine potential changes in microbial diversity (through PCR amplification and sequencing of
16S rRNA genes). Samples for quantifying rates of activity and diversity were size fractionated
(0.2, 2.0 and 20 μm size fractions) for insight into microbial dynamics associated with differing
particle sizes.
8
1.4. Chapter 1 Figures
Figure 1. NASA Goddard Space Flight Center’s SeaWIFS ocean color view of NPSG (red circle) and location of Station ALOHA (red star).
9
Figure 2. 14C-primary production rates (in black) and particle flux export (in red) at 150 m depth horizon at Station ALOHA from 1989-2015 (mmol C m-2 day-1) (http://hahana.soest.hawaii.edu/hot/hot-dogs)
10
Figure 3. Particle flux at Station ALOHA fit using the power law function of Martin et al. (1987). The curve is a power law best-fit expressing flux at depth in terms of flux leaving the epipelagic water (at depth z0= 100 m); the derived b value from this empirical function is 0.837.

11
Figure 4. Conceptual view of the functioning of the biological pump in the NPSG. Previous work at Station ALOHA suggests two major 'states' of the biological pump: (i) steady-state flux where slowly sinking POM undergoes intensive remineralization in the epipelagic and mesopelagic waters, largely fueled by activities of small picoplankton, and (ii) transient-bloom flux, which is modified each summer, where larger microorganisms, including diatoms and diazotrophs become increasingly important components of organic matter export to the deep sea (Karl et al., 2012).
12
CHAPTER 2. QUANTIFYING RATES OF MICROBIAL ACTIVITY AND DIVERSITY OF
MICROORGANISMS ASSOCIATED WITH SINKING PARTICLES IN THE OLIGOTROPHIC
NORTH PACIFIC OCEAN
2.1. Introduction
Sinking particulate organic matter (POM) is a conduit for matter and energy transport from the
surface to the interior waters of the ocean, and represents a major mechanism controlling
ocean carbon transfer across the air-sea interface (Buesseler et al., 2007; Longhurst and
Harrison 1989; Martin et al., 1987; McCave 1975; Sarmiento et al., 1988; Volk and Hoffert
1985). POM is an operationally defined term, typical including particles ranging from submicron
(typically >0.2 μm) to 100s of µm in size. Sinking POM provides unique, ecological niches for
microorganisms, and cell densities and activities of microorganisms attached to POM can be
orders of magnitude greater than in the surrounding seawater (Smith et al., 1992; Grossart et
al., 2003; Caron et al., 1986; Grossart and Simon 1998). POM can be highly enriched in
reduced compounds compared to seawater, providing a source of both energy and nutrition
necessary to fuel microbial growth (Martin et al., 1987; Karl et al.,1984; Shanks and Trent
1979).
Marine microbes play a critical role in determining the magnitude and variability associated
with POM export from the upper ocean to the deep sea. Through their collective metabolism,
microbes control organic matter production in the upper ocean, and regulate subsequent
decomposition of this organic material with concomitant remineralization of nutrients (Arrigo
2005; Karl 2002). Microbes that colonize sinking POM are believed to play a large role in
elemental recycling. Particle-associated microbes are known to utilize hydrolytic enzymes that
can be bound to the cell surface or within the cell to solubilize POM into DOM and other

13
dissolved inorganic constituents (Smith et al., 1992). During the colonization and processing of
POM aggregates, complex successional changes can occur among the types of microbes
inhabiting the POM over timescales ranging from hours to days (Alldredge and Silver, 1988).
Such successional changes in the microbial community may significantly alter the chemical
and biological properties of the colonized aggregates (Alldredge and Silver, 1988), including
chemical dissolution of minerals (Bidle and Azam 1999), physical degradation of organic
material, and progressive enrichment of C relative to nitrogen (N) and phosphorus (P) (Smith et
al., 1992). Through remineralization, a substantial amount of nonliving/detrital POM is
decomposed through the metabolic activities of heterotrophs, transforming particles into
dissolved organic matter (DOM) and resulting in production of inorganic forms of C, N, and P.
There is currently little known about the specific mechanisms underlying microbial degradation
of POM, how such processes may vary in time or locale, or depend on the nature of the source
material. Moreover, rates of microbially-mediated particle decomposition and the specific
types of microbes involved in remineralization have received relatively little attention. Various
studies suggest POM can be degraded by microbial processes on timescales of hours to days
(Ploug and Grossart 2000). Rates of remineralization are often inferred based on depth
distributions of major remineralized bi-products (i.e. major nutrients and inorganic carbon);
however, there are fewer direct measurements of rates of microbial metabolism associated
with sinking particles coupled with the specific types of microbes involved in particle
remineralization in the open ocean.
Isotopic and genomic approaches to the study of microorganisms have provided insight into
the diversity of metabolic strategies utilized by ocean plankton for growth, including modes of
acquiring C (organic vs. inorganic) and sources of energy supporting microbial growth in the

14
deep sea. Metagenomic and single-cell genomic studies have identified abundant
chemoheterotrophic (relying on organic matter as both a source of C and energy) and
chemoautotrophic (those that utilize inorganic substrates for energy and CO2 as a carbon
source). Bacteria and Archaea in the deep sea (DeLong et al., 2006; Giovannoni, 2017; Iverson
et al., 2012; Orsi et al., 2015; Swan et al., 2011). For example, throughout the mesopelagic
waters, abundant members of the Thaumarchaea appear capable of chemoautotrophic growth,
fixing CO2 and oxidizing ammonia (and urea) for energy (Karner et al., 2001; Könneke et al.,
2014; Middelburg 2011). To date, however, there has been comparatively little work done to
assess the relative contribution of these different metabolic strategies.
Measurements of microbial activity are not straightforward; for example, there are a number of
important limitations inherent to conventional measures of cellular production. For example,
14C-bicarbonate assimilation is a commonly used tracer of carbon fixation; however, this
approach includes carbon fixed by obligate and facultative chemoautotrophs, as well as
contributions from obligate and facultative chemoheterotrophs via anaplerotic reaction
pathways. During anaplerotic reactions, carboxylase enzymes supply intermediate metabolites
to the tricarboxylic acid (TCA) cycle via the fixation of CO2 (Erb 2011). These intermediate
metabolites can serve as precursors for various biosynthetic reactions (for example amino acid
synthesis; Gottschalk 1986; Yakimov et al., 2014). Estimates of the contribution of anaplerotic
carbon fixation to biomass production suggest this pathway supplies 5-6% of the total
biomass production by heterotrophic microbes (Boschker et al., 2014; Romanenko et al.,
1972). However, other studies have revealed that the proportion of carbon supplied by this
pathway depends on microbial growth rates (Li 1982), the types of carbon substrates utilized to
support heterotrophic production (Overbeck and Daley 1973), and may vary depending on
specific physiologies of the microorganisms (Palovaara et al. 2014). There are also a number of
15
important limitations underlying commonly utilized measurements of bacterial production. For
example, use of 3H-leucine and 3H-thymidine as measures of bacterial production both require
appropriate carbon conversion factors to convert from measured rates of nucleoside or amino
acid incorporation to carbon-based production. There has been relatively little work to
constrain such conversion factors for the mesopelagic waters (Herndl and Reinthaler 2013;
Baltar et al. 2010). Moreover, intracellular dilution remains largely unknown for these methods;
for example, use of 3H-leucine incorporation as a measure of protein production assumes that
the de novo synthesis pathways have been suppressed; however, the extent of intracellular
dilution of the radiolabeled leucine remains largely unknown (Kirchman et al., 1985; Simon and
Azam 1992).
At Station ALOHA, temporal and vertical variability in rates of microbial production and
metabolism have been assessed using various methodologies (e.g. Church et al., 2006; Ferron
et al., 2015; Jones et al., 1996; Karl et al., 1996; Martinez-Garcia and Karl 2015; Letelier et al.,
1996; Williams et al., 2004; Viviani and Church 2017). Moreover, a number of studies have
described time- and depth-dependent changes in microbial community structure at Station
ALOHA (DeLong et al., 2006; Brown et al., 2009; Bryant et al., 2016). Such studies indicate
diverse groups of planktonic Archaea and Bacteria are resident members of this ecosystem.
Members of both the Marine Group I and II Archaea demonstrate vertical differences in
distributions and abundances (Karner et al., 2001); similarly, members of the Alpha-, Beta-, and
Gamma-Proteobacteria, Verrucomicrobia, Actinobacteria, Chloroflexi, Planctomycetes,
Acidobacteria and Firmicutes also demonstrate depth-dependent patterns in relative
abundance (Brown et al., 2009; DeLong et al., 2006; Fontanez et al., 2015).

16
In addition to vertical and time-varying changes in microorganism growth, metabolism,
abundance, and composition, a number of studies indicate that microorganisms attached to
particles can be taxonomically distinct from free-living bacteria (DeLong et al., 1993; DeLong et
al., 2006; Fontanez et al., 2015). A recent study by Fontanez et al. (2015) used comparative
metagenomics to assess the differences in particle-associated microbial taxa using particle
interceptor traps (PITs) deployed at Station ALOHA. The study utilized PITs containing a
preservative RNALater (saturated ammoniums sulfate), so-called poisoned traps and
preservative-free traps where growth was presumed to continue in the presence of a seawater
solution with brine to increase the density to 1.05 g/mL (high salinity, live traps). These authors
found bacterial members of the Bacteroidetes, Flavobacteriales, Oceanospirillales,
Alteromonadales, Moritella and Pseudoalteromonas dominated the “live” sediment traps, while
Marinobacter, Planctomycetes, and the genus Vibrio related to the class
Gammaproteobacteria were enriched in the poisoned traps (Fontanez et al., 2015; Pelve et al,
2017).
Direct measurements of rates of microbial activity associated with sinking particles in the
NPSG are limited. Although research has been conducted on the microbial assemblages
attached to sinking particles (Fontanez et al., 2015; DeLong et al., 2006), little is known about
the relationship between these microbial assemblages and their metabolic activities, or how
they vary among particles of differing sizes. The focus of this thesis was to investigate the
types of microbes and rates of productivity associated with sinking particles collected in the
upper mesopelagic waters at Station ALOHA. I examined how rates of productivity and the
taxonomic affiliation of microorganisms varied among different filter-based size fractions in a
series of experiments where seawater was amended with sinking particulate material. The two
main objectives of the project were to determine rates of microbial production (both

17
heterotrophic and autotrophic), and to identify potential changes in microbial taxa associated
with various particle size fractions.
2.2. Experimental Design and Methods
Field-based experiments were conducted aboard the R/V Ka`imikai-O-Kanaloa (KOK) on HOT
cruises in August 2016 (HOT 286), March 2017 (HOT 291), and April 2017 (HOT 292); an
additional two experiments were conducted on a research cruise as part of the Simons
Collaboration on Ocean Processes and Ecology (SCOPE) in March 2017. Sinking particulate
matter was collected using a 1-m diameter net trap (Peterson et al., 2005) deployed at 175 m
for 24 hours. Particles collected during the deployment period were initially divided using a
Folsom plankton splitter, and the splits containing sinking particles were subsequently
screened through a 335 μm mesh to remove large zooplankton. These splits were then further
divided into ten 100 mL aliquots using a McLane Wet Sample Divider, and 300 mL of the
particle-amended splits were added to triplicate 10 L carboys containing whole seawater (175
m). Triplicate controls (no particle amendments) consisted of 10 L carboys filled with whole
seawater from the same depth. Carboys were subsampled at the beginning of each experiment
for subsequent measurements of microbial activity and diversity.
3H-leucine incorporation: To quantify rates of heterotrophic bacterial production, the
incorporation of 3H-leucine into protein was measured (Kirchman et al., 1985). For these
incubations, carboys (particle amended and controls) were subsampled into 40 mL
polycarbonate centrifuge tubes. Each tube was amended with 20 nM 3H-leucine and samples
were incubated at in situ temperatures in the dark for 3-4 hours in the dark. To terminate the
incubations, samples were filtered onto 25 mm diameter polycarbonate filters of varying pore
sizes (0.2, 2, 20 μm), providing size fraction-specific rates. After filtering, each filter was rinsed

18
with 5% trichloroacetic acid (TCA), followed by 80% ethanol. Filters were dried and stored in
glass scintillation vials at -20°C. In the shore-based laboratory,10 mL of PerkinElmer
UltimaGold™ scintillation cocktail was added to each scintillation vial containing the filters and
radioactivity on each filter was measured by liquid scintillation counting (Perkin Elmer Tri-Carb
2800TR). Rates of bacterial production (nmol C L-1 day-1) were derived from the measured 3H-
leucine incorporation using a conversion factor of 1.5 kg C per mol leucine incorporated
(Kirchman, 2001).
14C bicarbonate assimilation: To quantify rates of carbon fixation, rates of 14C-bicarbonate
assimilation into plankton biomass were measured. For these incubations, the particle
amended and control carboys were subsampled into 40 mL polycarbonate centrifuge tubes
and each tube was amended with ~0.05 MBq/mL (final activity) 14C-bicarbonate. Samples were
incubated for 24 hours at in situ temperature in the dark. At the end of the incubation period,
samples were filter size-fractionated using the same types of filters used for 3H-leucine
measurements. The total amount of radioactivity added to each sample was determined by
adding a 25 µL subsample to a 20 mL scintillation vial containing 500 µL ß-phenylethylamine.
The remaining sample volume was filtered and filters were stored in 20 mL glass scintillation
vials and frozen (-20°C) until processing. In the laboratory, filters were acidified with 1 mL of 2N
hydrochloric acid and allowed to vent, uncapped for 24 hours in a fume hood. After
acidification, 10 mL of PerkinElmer UltimaGold™ scintillation cocktail was added to scintillation
vials containing the filters, and the resulting radioactivity was quantified by liquid scintillation
counting (Perkin Elmer Tri-Carb 2800TR). Carbon assimilation rates were calculated as follows:
C assimilation =
!"#$%&'&()*
,"#$%&'&(!-.&/#"#/0/%#1#%2
)*,-.&/#"#/0/%#1#%2
×[567]×9.;<
=>?@ABC
19
Where [DIC] is the concentration of dissolved inorganic carbon at 175 m during the June 2016
cruise as measured by the HOT program (2034 μmol C L-1), and 1.06 is the 14C/12C isotopic
fractionation factor (Steeman-Nielsen, 1952) and 24 hours is the incubation time.
Collection and extraction of DNA: Carboys (particle amended and controls) were subsampled
to collect samples for subsequent extraction of DNA from plankton biomass. A total of 3 L of
seawater was subsampled from each carboy, and 1 L each was filtered onto 25 mm diameter
0.2, 2, and 20 μm pore size polycarbonate filters, respectively, using a peristaltic pump. Filters
were placed into 2 mL microcentrifuge tubes containing 400 μL of lysis buffer AP1 (Qiagen
DNeasy Plant Mini Kit) and 0.2 g of 100 µm zirconium beads, immediately flash frozen in liquid
nitrogen, and stored at -80°C until processed.
In the laboratory, DNA was extracted following a modified version of the Qiagen DNeasy Plant
Mini Kit as described in Paerl et al. (2008). Plankton cells concentrated onto filters were
subjected to a freeze/thaw cycle in lysis buffer (Buffer AP1; 10 mM Tris-HCl, 1 mM EDTA, 0.1%
(v/v) sodium dodecyl sulfate, 0.1M NaCl), then physically disrupted via bead beating for 2
minutes. Following the bead beating step, 45 μL of proteinase K was added to microcentrifuge
tubes, and samples were incubated in a hybridization oven at 55°C for 1 hr, vortexing every 15
minutes to homogenize. Following this incubation, 4 μL RNase A was added to each
microcentrifuge tube and samples were incubated at 65°C for 10 minutes. To precipitate
protein and polysaccharides, 130 μL of buffer P3 (Qiagen) was added to each sample and
samples were centrifuged at 13,000 g for 1 min. Supernatants were removed and applied to a
QIAshredder Mini Spin Column; the spin columns were centrifuged for an additional 2 minutes.
DNA was further purified by the addition of 750 μL of buffer AW (Qiagen) to each spin column,

20
followed by centrifugation for 1 minute. An additional wash step with buffer A2 (containing
ethanol) was applied and columns were centrifuged again to completely dry the spin column.
Spin columns were transferred to a sterile 1.5 mL microcentrifuge tubes, and DNA was eluted
through two sequential additions of 100 μL buffer AE (Qiagen). An extraction blank (a Supor
filter with no sample added) was processed alongside samples. Extracted DNA concentrations
were determined fluorometrically using the Quant-iT DNA High-sensitivity assay kit (Invitrogen,
Carlsbad, CA, USA). DNA extracts were stored at -80°C for subsequent analyses.
Polymerase chain reaction amplification of SSU rRNA genes: 16S rRNA genes were amplified
from DNA extracts to evaluate microorganism diversity associated with the various particle
fractions. The PCR protocol followed a modification of those described in the Earth
Microbiome Project (http://www.earthmicrobiome.org/emp-standard-protocols/16s/), using the
primers 515F and 926R, targeting the V4-V5 hypervariable regions of the 16S rRNA gene
(Parada et al., 2016; Walters et al., 2015). The primer set was designed to target small subunit
rRNA genes from Bacteria, Archaea, and also Eukaryotes (Parada et al., 2016). The forward
primer sequence was: 515F (5’-GTG YCA GCM GCC GCG GGTAA- 3’), and included a 5’
Illumina adaptor, the unique Golay barcode, and a forward primer pad and forward primer
linker. The reverse primer was: 926R (5’-GGA CTACNV GGG TWT CTA AT-3’), and included a
reverse complement to the 3’ Illumina adaptor, a reverse primer pad, and a reverse primer
linker.
All the samples and filter blanks were PCR amplified in triplicate, together with a PCR blank (no
template control) as a quality check. The PCR master mix for each sample consisted of: 9 µL
PCR-grade water, 12 µL 2X Platinum Hot Start PCR Master Mix, 1 μL forward primer (10 μM
stock concentration), 1 μL reverse primer (10 μM stock concentration), and 2 μL template DNA

21
for a total volume of 25 μL. The cycling conditions were as follows: 3 minutes initial
denaturation at 94°C, followed by 35 cycles of denaturation at 94°C for 45 seconds, annealing
at 55°C for 60 seconds, and elongation at 72°C for 90 seconds; followed by a final 10 minute
extension at 72°C.
The triplicates of the PCR reactions were pooled into a single volume of 75 μL and the pooled
amplicons were visualized on a 1.5% agarose gel. Amplicons were purified using the E.Z.N.A.
Spin column cleaning kit (Omega Bio-tek). This purification step was performed twice, using
elution buffer of 50 μL the first time and 40 μL for the second time. The amplicons were
quantified with Qubit 2.0 high sensitivity DNA Assay Kit. The pooled triplicates were then
further pooled with all other reactions into a single, sterile tube, normalizing to 240 ng per
sample. A subsample (6 µL) of the total pooled library was visualized on a 1.5% agarose gel to
confirm quality of the pooled library. The pooled library was paired-end sequenced on a MiSeq
System (Illumina) at the Hawai’i Institute for Marine Biology (HIMB) genetics core facility.
Returned sequences were then processed using a bioinformatics pipeline run through the R
environment as described in Lindh et al. (2015). Paired-ends of the fastq files were merged,
with up to 5 mismatches allowed, using a SLURM job in the UPARSE bioinformatic pipeline
(Lindh et al. 2015). The merged sequences were then quality filtered to allow 2 expected errors
per read with a minimum length of 300 base pairs. The sequences were then concatenated into
one file. Singletons below a threshold of 10 occurrences per sequence were deleted in the
sorting step. A table of operational taxonomic units (OTUs) was generated with all sequences
clustered at a 99% cutoff (Edgar 2013). An OTU is an operational definition used to classify
clusters of organisms, based on DNA sequence similarity. A total of 32,200 OTUs were
generated and these OTUs were uploaded and compared 1000 OTUs at a time to the
22
SILVA/SINA database (https://www.arb-silva.de/aligner/). The minimum identity of the query
sequence was set to 90%; sequences below 70% identity were rejected and the resulting
taxonomy established the final OTU table.
All statistics were performed using the software R. Each OTU was grouped based on
their taxonomic affiliation (Eukaroyta, Bacteria, Archaea). Chloroplast sequences (10%
of the total) were removed prior to further analyses. All the 16S reads were subsampled
to n= 5000 to eliminate rare reads. These subsampled reads were then normalized to
the total reads. Major taxonomic groups by phyla were recorded for both 16S and 18S
rRNA genes based on SILVA/SINA taxonomy. For each cruise, the triplicate
experimental replicates for each filter size were averaged prior to statistical analyses.
Alpha (Shannon index, species richness) and beta (Bray-Curtis distance) diversity
analyses were performed on the resulting OTUs. From the normalized reads, the top
100 abundant OTUs and their taxonomies were examined. The taxa were then grouped
by filter size and experimental treatment to determine the abundance of taxa unique to
the experiments. Various measures of sequence diversity were calculated, including:
Shannon [H′] diversity, and Pielou’s Evenness [J] indices. The Shannon Index [H′] was
utilized to quantify a-diversity of controls and particle-enriched treatments. The
Shannon index (H′) was calculated as:
DE = − HIJ
IK9
log HI
where HI = Ni/N, the number of individual OTUs, i, divided by the total number of individuals in
the sample (N); and S is the total number of OTUs (richness) so that HI = 1PIK9 . Hence, this
index accounts for both OTU richness (total number of unique OTUs) and evenness (the
23
relative abundances of each OTU). Samples were binned by filter size and the resulting
Shannon index was calculated using R. Evenness of the community was also estimated based
on the relative abundances of distinct OTUs. The evenness of a community was estimated
using Pielou’s evenness index (J’):
J’= QERST J
where H’ is derived from the Shannon Index and S is the number of unique OTUs
(species richness). The value of J’ is constrained between 0 and 1, with 1 representing
complete evenness of a community. Samples were binned by filter size and evenness
and richness were calculated and examined across the controls and particle-enriched
treatments by filter size. OTU diversity was then compared across the treatment
conditions by filter size. In addition, the Chao1 index was used to estimate b-diversity.
This index measures the similarity (or dissimilarity) in OTU composition between
samples. The Chao1 index uses nonparametric methods or estimating the size and
richness of unique OTUs (Hughes et al., 2001). Chao 1 estimates total species richness
as:
U7?V@9 = U@WC + Y9=
2Y=
where Sobs is the number of observed species, n1 is the number of singletons (OTUs
captured once), and n2 is the number of doubletons (OTUs captured twice). Bray-Curtis
dissimilarity matrixes, and permutational analysis of variance (PERMANOVA) were

24
calculated with the R package ‘vegan.’ For estimation of significant differences between
filter sizes and treatment conditions, an unpaired t-test was performed in R.
Picoplankton abundances by flow-cytometry: Samples (2 mL) from each carboy were collected
at the beginning of each experiment for subsequent enumeration of picoplankton abundances
by flow cytometry. Seawater was fixed with 2% (final concentration) electron microscopy grade
paraformaldehyde in 2 mL cryovials, flash-frozen in liquid nitrogen, and stored in -80°C. In the
laboratory, samples were stained with SybrGreen (40X final concentration) and picoplankton
abundances were analyzed on an Attune Acoustic Focusing flow cytometer (Applied
Biosystems).
Determination of total organic carbon (TOC): Carboys were subsampled for subsequent
determinations of total organic carbon (TOC) concentrations at the beginning of each
experiment. One hundred and twenty-five mL of water was collected from each carboy in acid-
cleaned high-density polyethylene bottles. The samples were then frozen and stored at -20°C.
Samples were analyzed by high temperature combustion on a Shimadzu TOC-V by the Carlson
Microbial Oceanography Laboratory at the University of California at Santa Barbara.
Determination of particulate carbon and nitrogen concentrations: Carboys were subsampled at
the beginning of each experiment for determination of particulate carbon and nitrogen
concentrations. A total of 2-4 L of seawater was subsampled and filtered onto a combusted
glass fiber filters (Whatman GF/F) using positive pressure filtration. Filters were placed in sterile
Petri dishes on combusted foil squares and frozen at -20°C. In the laboratory, filters were
analyzed for carbon and nitrogen content by high temperature combustion using an Exeter CE-
440 Elemental Analyzer.
25
2.3. Results
Total organic carbon enrichment in particle-amended treatments: Fluxes of sinking particulate
carbon (PC) into the mesopelagic waters (measured at 150 m) at Station ALOHA between 1989
and 2015 ranged from 0.9 to 4.7 mmol C m-2 day-1, with fluxes typically elevated (1.5 to 4.7
mmol C m-2 day-1) between May and August. Experiments for this study were conducted in the
months of March, April, and August; based on HOT program sampling at Station ALOHA, PC
fluxes for these months average 2.4 ± 0.8 mmol C m-2 day-1, 2.5 ± 0.6 mmol C m-2 day-1, and
2.8 ± 0.7 mmol C m-2 day-1, respectively. Measurements of TOC and PC concentrations in the
particle-enriched treatments and controls provided insight into changes in organic carbon
deriving from the addition of particles. On average, the addition of particles increased
concentrations of TOC by 4.5 ± 0.99 µmol C L-1 relative to the controls). Concentrations of TOC
in the controls ranged 56-65 µmol C L-1 (Table 1), consistent with HOT program measurements
of TOC at 175 m, while TOC concentrations in the particle-enriched treatments ranged
between 60 and 70 µmol C L-1 (Table 1). No TOC samples were measured from the experiment
conducted in August, 2016 (HOT 286); however, concentrations of PC in the particle-enriched
treatments averaged 5.2 ± 0.4 µmol C L-1, similar to PC concentrations (4.9 ± 1.2 µmol C L-1) in
the unamended controls (Table 1).
Cell abundances: Flow cytometric determinations revealed that non-pigmented picoplankton
abundances (hereafter termed bacteria) were generally consistent across the five different
sampling occasions for both the unamended controls and particle-enriched treatments (Table
2). On average, cell abundances in the particle-enriched treatments were 13-36% greater than
in the controls (Table 2). However, these relatively small differences likely do not include
bacterial cells attached to particles as the flow cytometric methods utilized for this study likely
excluded particles larger than ~10 µm in diameter.

26
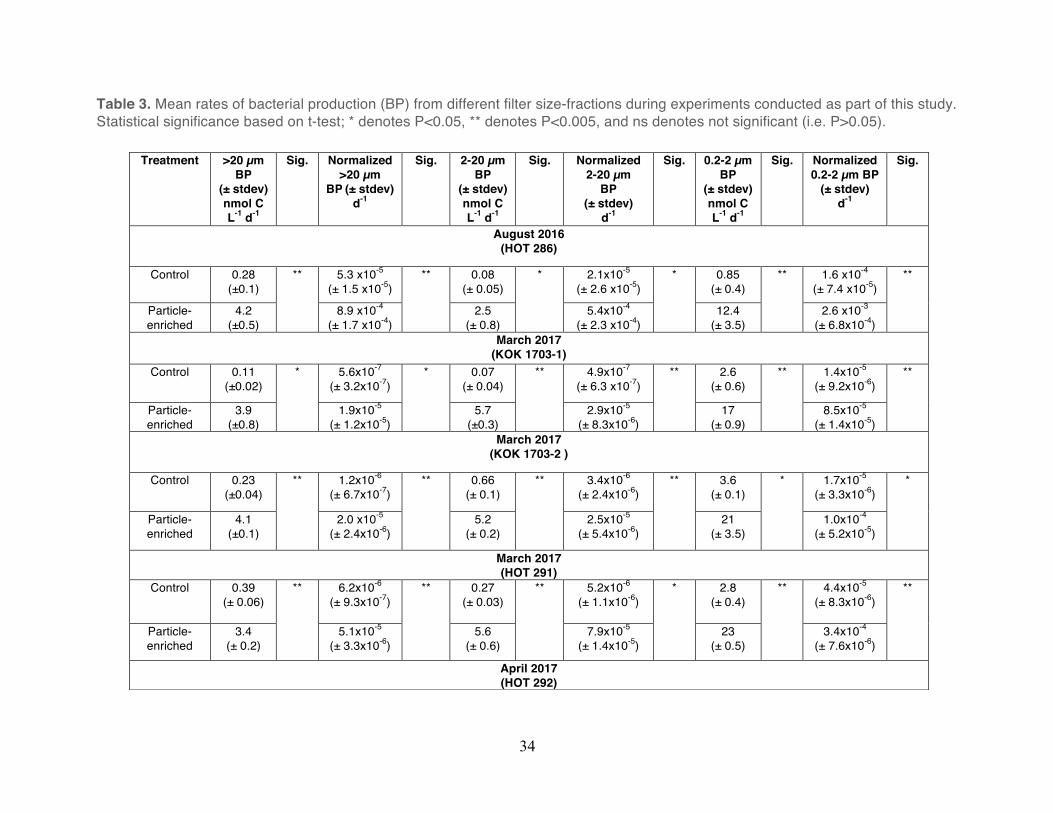
Particle-associated microbial production: Rates of bacterial production (based on incorporation
of 3H-leucine) and carbon-fixation (based on assimilation of 14C-bicarbonate) were measured in
both the controls and particle-enriched treatments. Samples were serially filtered, not
sequentially, so rates specific to each size fraction were determined by difference. In all
experiments, except 2-20 µm filter size fraction from April, 2017 (HOT 292), the presence of
particles significantly increased rates of bacterial production in all three filter size fractions (0.2-
2 µm, 2-20 µm, >20 µm; unpaired t-test, P<0.05, 0.05, 0.05, respectively; Table 3). Rates of
bacterial production in the particle-enriched fractions ranged between 12 and 23 nmol C L-1
day-1, 2.4 and 5.7 nmol C L-1day-1, and 3.4 and 4.2 nmol C L-1 day-1 in the 0.2-2 µm, 2-20 µm,
and >20 µm factions, respectively (Figure 1, Table 3). In comparison, rates of bacterial
production in the controls ranged 0.6 to 4.2 nmol C L-1 day-1, 0.07 to 0.6 nmol C L-1 day-1, and
0.1 to 0.8 nmol C L-1 day-1 among these filter size fractions (Figure 1, Table 3). Relative to the
controls, the largest increases in bacterial production in the particle-enriched treatments were
observed in the 2-20 µm size fractions; rates of bacterial production were 9 to 18-fold greater
in this size fraction in the particle-enriched treatments relative to the controls. The particle-
enriched treatments also increased rates of bacterial production in the 0.2-2 µm and >20 µm
fractions by 5 to 8- fold and 4 to 16-fold, respectively, relative to the controls.
Rates of bacterial production were normalized to TOC concentrations measured from each
experiment (Table 3). TOC concentrations were only measured for experiments conducted on
cruises March, 2017 (KOK 1703-1, KOK 1703-2), March, 2017 (HOT 291), and April, 2017 (HOT
292); thus, bacterial production rates for the experiment conducted in August, 2016 (HOT 286)
were normalized to PC concentrations. The resulting normalized rates of bacterial production
were then compared among filter fractions and treatment conditions within each experiment.
Normalized rates of bacterial production in the particle-enriched treatments were significantly

27
greater for all filter size fractions for all experiments except the 2-20 µm filter size fraction
during April, 2017 (HOT 292; unpaired t-test, P>0.05). Relative to the controls, the largest
increases in the normalized rates in the particle-enriched treatments were observed in the 2-20
µm size fractions (Table 3).
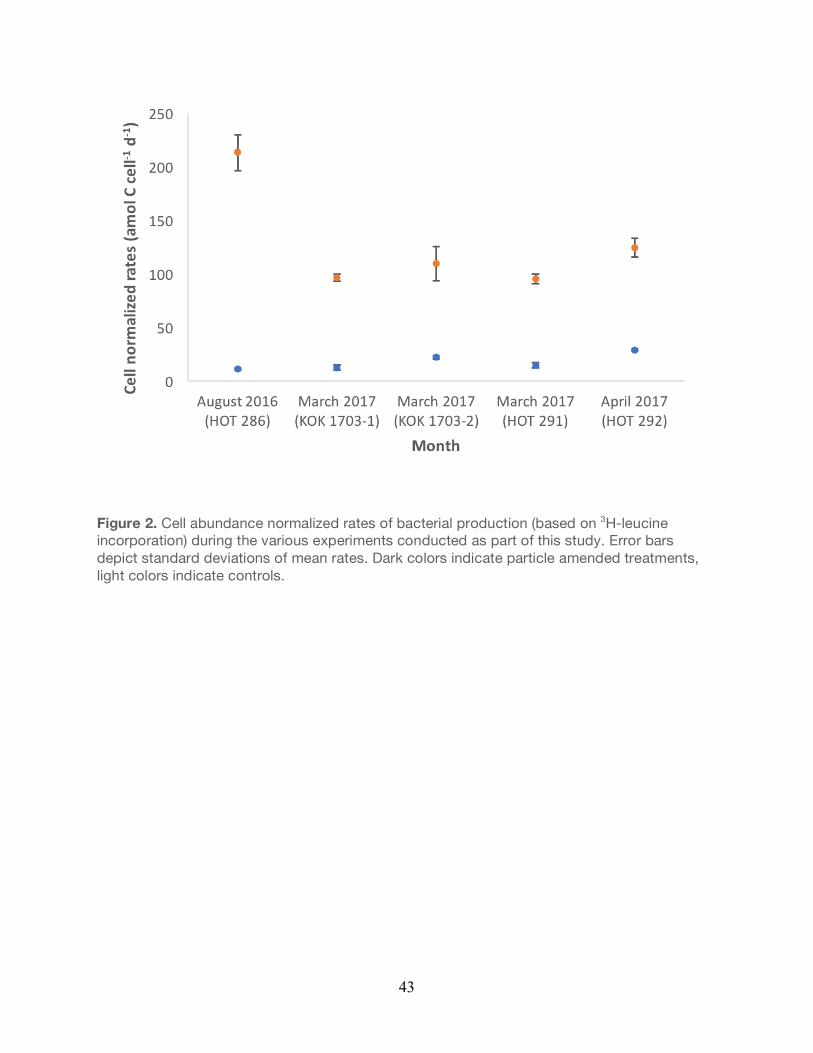
Rates of bacterial production (cumulative rates, inclusive of all size fractions) were further
normalized to flow cytometric cell abundances determined for each experiment (Figure 2). Cell
normalized rates of bacterial production in the particle-enriched treatments were significantly
greater than unamended controls for all cruises (Unpaired t-test, P<0.05). Moreover, cell-
normalized rates of bacterial production in the unamended controls varied 2.5-fold over all
experiments, while cell normalized rates in the particle amended treatments varied 2.2-fold
over the course of all experiments.
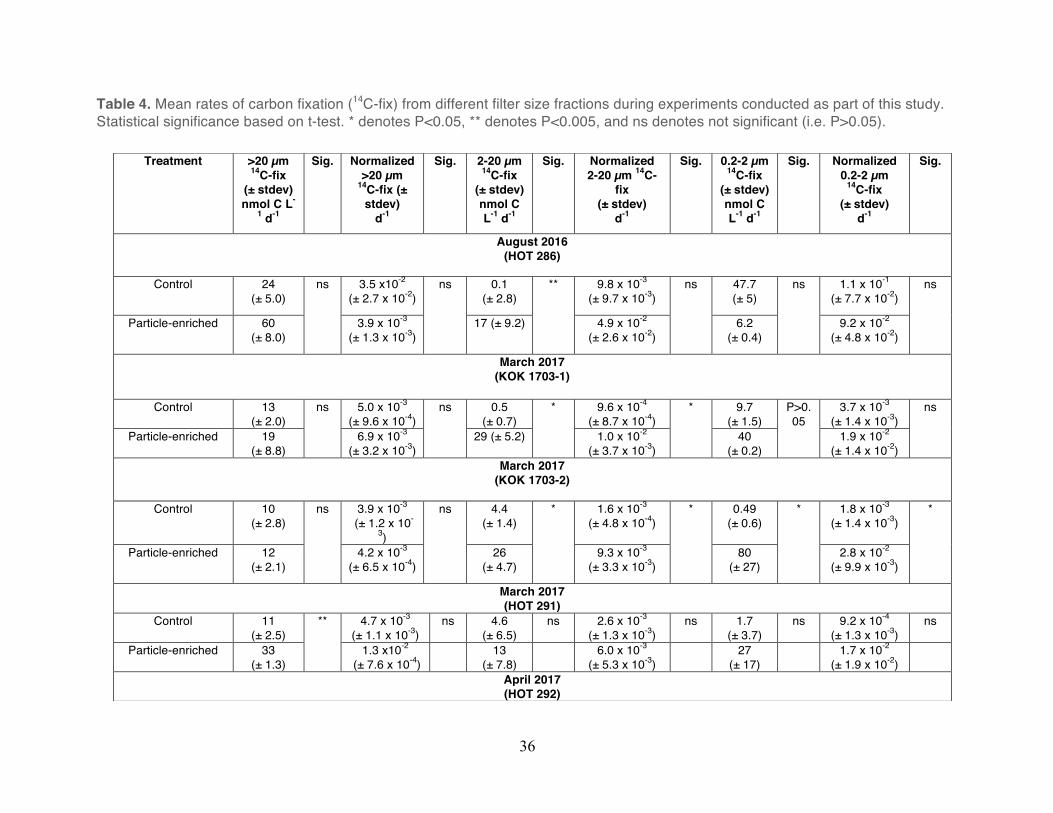
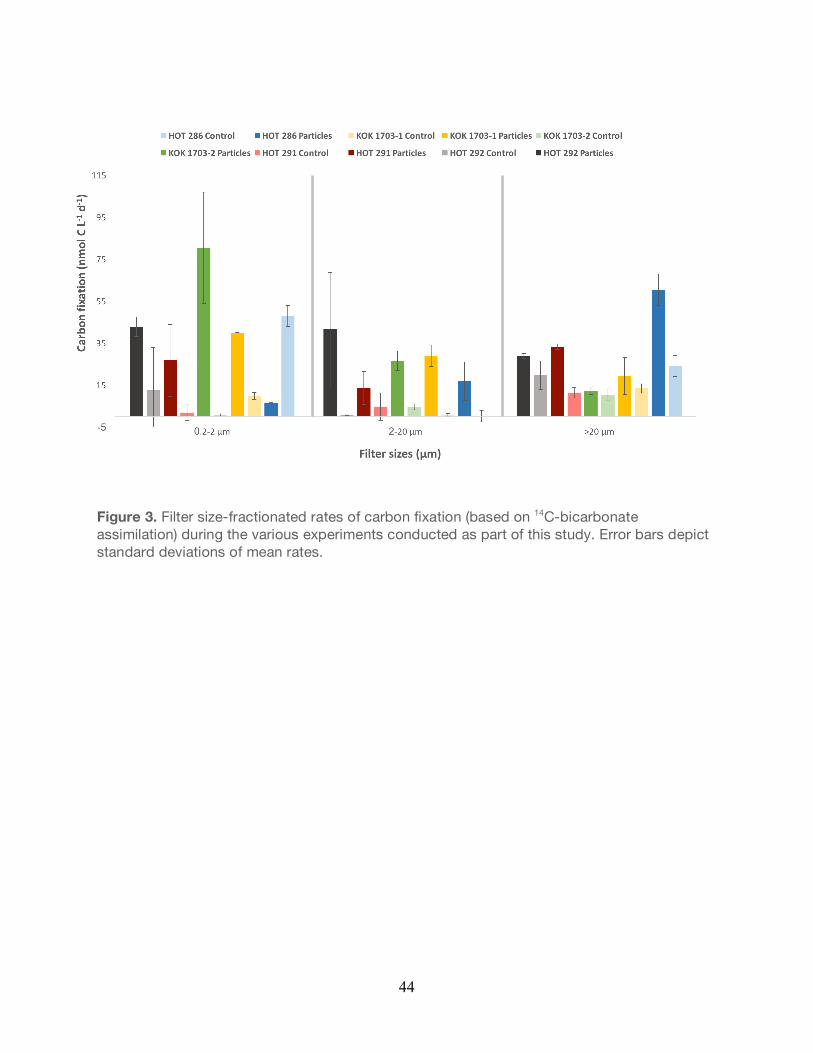
Rates of carbon fixation in all experiments were generally elevated, but not significantly
different in the particle-enriched treatments relative to the unamended controls (Unpaired t-
test, P>0.05; Figure 3). In some instances, for specific filter fractions, rates of carbon fixation
were significantly greater in the particle-enriched treatments. For example, in the larger filter
size fractions during experiments conducted in March 2017 (KOK 1703-1, KOK 1703-2), rates
of carbon fixation in the treatments were significantly greater than the controls (Unpaired t-test,
P<0.05; Table 4). However, the relatively high variability observed in the rates of carbon fixation
in the triplicate carboys typically resulted in no significant differences in rates in the particle-
enriched treatments relative to the controls (Unpaired t-test, P>0.05; Table 4). Rates of carbon
fixation in the particle-enriched fractions varied from 6.2 to 80 nmol C L-1 day-1, 16 to 41 nmol C
L-1 day-1, and 12 to 60 nmol C L-1 day-1 in the 0.2-2 µm, 2-20 µm, and >20 µm factions,
respectively (Figure 3). In comparison, rates of carbon fixation in the unamended controls

28
ranged from 0.5 to 47 nmol C L-1 day-1, 0.1 to 4.6 nmol C L-1 day-1, and 10 to 24 nmol C L-1 day-1
among these filter size fractions.
Rates of carbon fixation were also normalized to total TOC concentrations measured from
each experiment except for the experiment conducted in August, 2016 (HOT 286) which was
normalized to concentrations of PC. The resulting normalized rates were compared within each
experiment across filter size and treatment. Similar to the results observed based on the non-
normalized rates, the relatively high variability in rates of carbon fixation among the triplicate
carboys resulted in no consistent size or treatment-specific differences (Unpaired t-test,
P>0.05; Table 4). On average, relative to the unamended controls, the largest increases in the
normalized rates in the particle-enriched treatments were observed in the 2-20 µm size
fractions when compared within each experiment (Table 4).
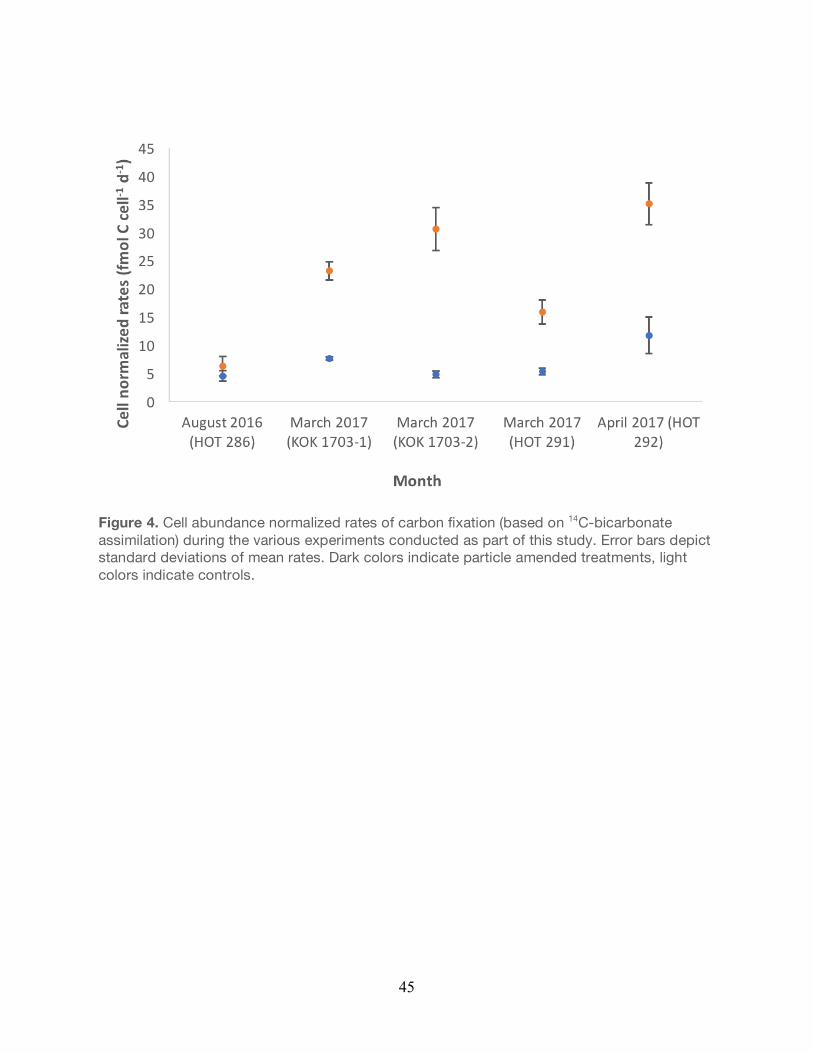
Rates of carbon fixation were also normalized to flow cytometric cell abundances from each
experiment (Figure 4). Apart from KOK 1703-1 (P<0.05) and KOK 1703-2 (P<0.05), there were
no significant differences in the normalized rates of carbon fixation between unamended
controls and particle-enriched treatments (Unpaired t-test, P>0.05; Figure 4). Moreover, cell-
normalized rates of bacterial production in the unamended controls varied 2.6-fold over the all
experiments, while cell normalized rates in the particle amended treatments varied 5.8-fold
over the course of all experiments.
Analyses of rRNA gene sequences
In total, 879,566 sequences were taxonomically identified as rRNA genes. From these
sequences, a total of 77% were identified as 16S rRNA genes and 23% were classified as 18S
rRNA genes. From among the16S rRNA genes, 94.8% were phylogenetically placed among the
29
Bacteria and 5.2% were affiliated with Archaea. Binning of sequences into OTUs resulted in
1,584 “Unclassified” OTUs, defined as having an identity <70% to phylogenetically
characterized taxa. Based on comparison to the SILVA/SINA database, the 16S rRNA OTUs
clustered into 13 major phyla including: Actinobacteria, Bacteroidetes, Chloroflexi,
Cyanobacteria, Deinococcus-Thermus, Eukaryarchaeota, Firmucutes, Marinimicrobia,
Nitrospinae, Proteobacteria, Planctomycetes, SBR1093, and Thaumarchaeota.
Relative abundances of 16S rRNA OTUs were analyzed by treatment and filter size fraction. For
the particle-enriched treatments a total of 10,704 OTUs were identified; with 4524, 3465, and
2715 OTUs, distributed among the 0.2 µm, 2 µm, 20 µm filter size fractions, respectively. In
contrast, the unamended controls contained a total of 14,957 unique OTUs, with the 0.2 µm, 2
µm, 20 µm filter fractions containing 5694, 5340, and 3923 of these OTUs, respectively. A
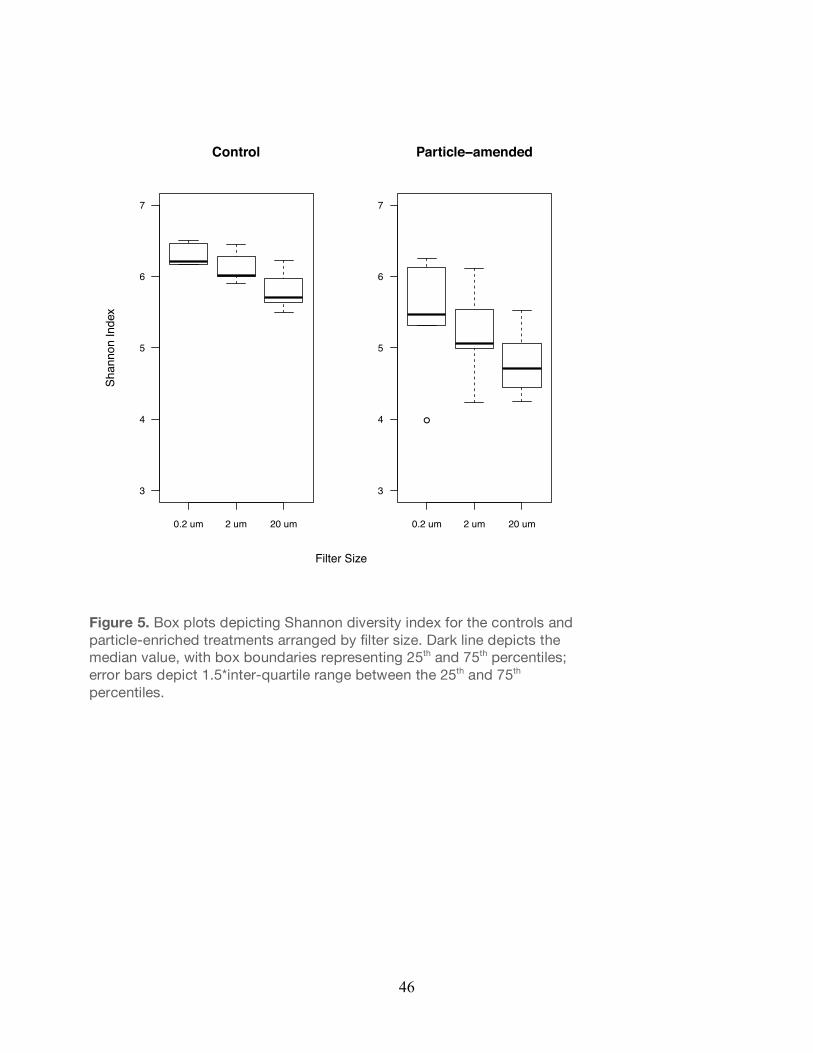
comparison of the control and particle-enriched treatments demonstrated that a-diversity was
significantly lower in the particle-enriched treatments across all filter sizes (Unpaired t-test,
P<0.05; Figure 5) relative to the controls. Similarly, the Pielou’s evenness (J’) index revealed
that the evenness of the community across all filter sizes was significantly lower in the particle-
enriched treatments relative to the controls (Unpaired t-test, P<0.05; Figure 6). For both the
controls and particle-enriched treatments, OTU richness, as measured by the total number of
OTUs, was greater in the 0.2 µm filter size fraction than among the larger filter sizes (Figure 7).
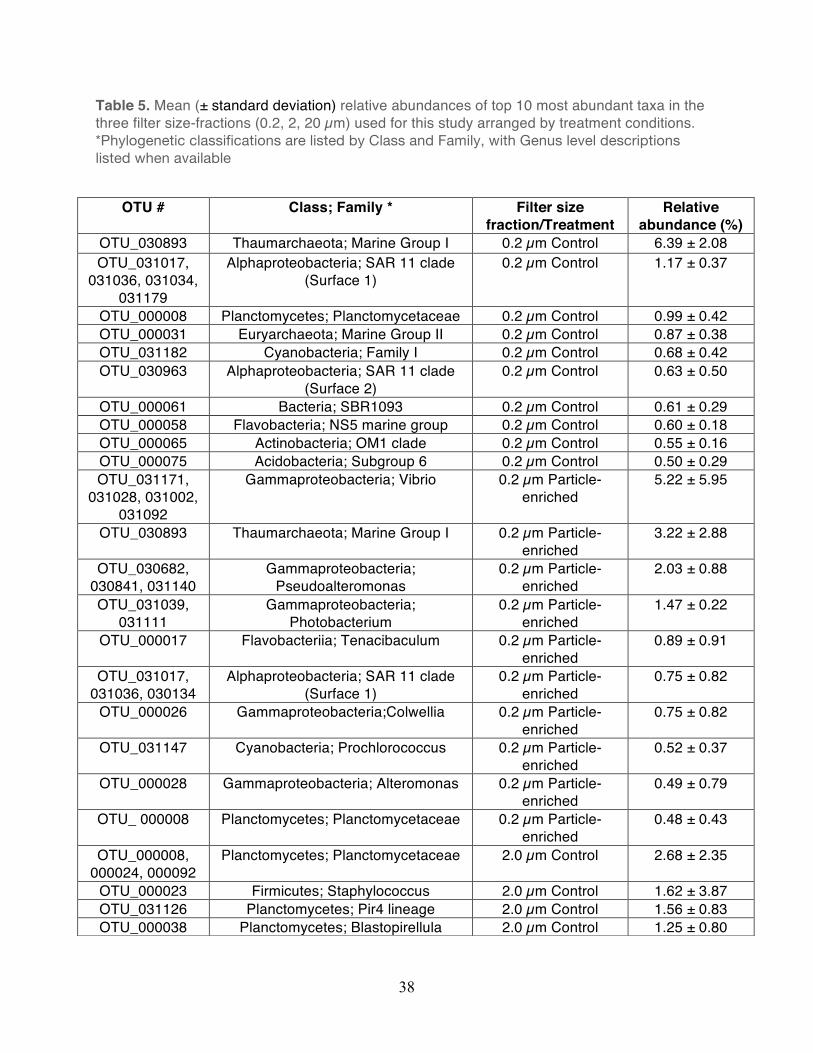
The bacterial taxa observed within the small size fraction (0.2 µm) in the unamended controls
were generally similar to taxa previously observed in the water column at Station ALOHA. For
example, members of the Alphaproteobacteria, Thaumarchaea, and Cyanobacteria (e.g.
Prochlorococcus) were generally elevated in relative abundance in both the controls and
particle-enriched treatments (Figures 8-12, Table 5). In addition, members of the

30
Alphaproteobacteria (e.g. SAR11), Actinobacteria, and Cyanobacteria were also frequent
contributors to this small filter size fraction in both the controls and the particle-enriched
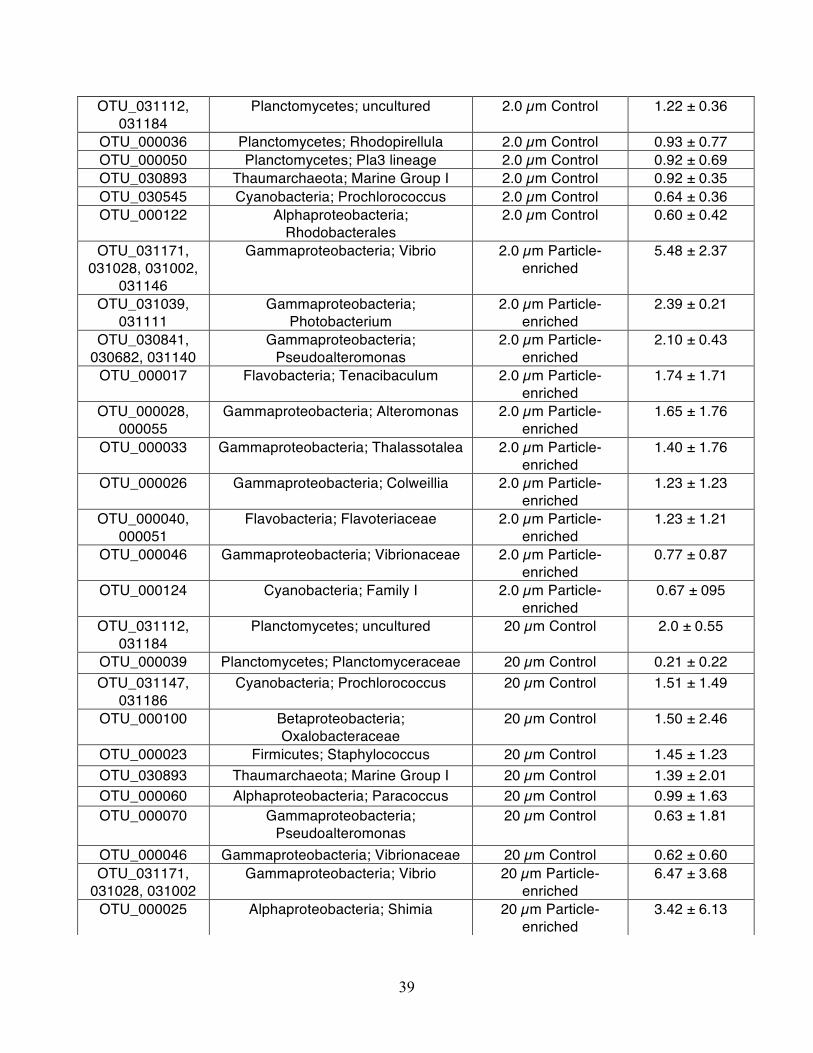
treatments (Figures 8-12). In the larger filter sizes (i.e. 2.0 µm and 20 µm) OTUs clustering
among the Planctomycetes, Bacteroidetes, and Gammaproteobacteria increased in relative
abundance (Figures 8-12) in both the controls and treatments. However, relative abundances
of specific Gammaproteobacteria (e.g. Vibrio and Alteromonadales), Alphaproteobacteria (e.g.
Rhodobacterales), and Bacteroidetes (Flavobacteria) taxa tended to be elevated in the particle-
enriched treatments across all filter size fractions, but particularly among the larger filter sizes
(Figure 8-12, Table 5). It is also important to note that though the larger filter size fractions (2.0
µm and 20 µm) contain some members of the Gammaproteobacteria and Bacteroidetes, which
are presumed to be heterotrophic copiotrophs, the specific types of these taxa differ on the
OTU-level.
Non-metric multidimensional scaling (NMDS) was used to examine the influence of filter size
and treatment conditions (particle-enriched vs controls) on the relative abundances of OTUs.
NMDS grouping analysis revealed that OTU structure varied as a function of both filter size
fraction and the particle treatment (Figure 13). Permutational analysis of variance
(PERMANOVA) was used to calculate how various factors (particle treatment, filter size, cruise
date) influenced the taxonomic composition of OTUs. Results from these analyses indicated
that treatment-specific differences (controls vs particle-enrichment) accounted for ~24% of the
variability in bacterial taxa composition, differences in taxa among filter size accounted for
~20% of this variability, while taxonomic changes between the different cruises accounted for
~19% of the variance. When each experiment was examined separately, PERMANOVA
analysis revealed that both treatment and filter size fractions individually were significant
controls on the observed OTU compositional changes (Table 6). The variation between

31
treatment conditions and between the filter size fractions were significant drivers of observed
variation in b-diversity. Furthermore, interactions between the particle-enriched treatment
conditions and filter size fractions were significant controls on variation in b-diversity. When
accounting for both factors (treatment condition and filter size), both treatment conditions and
filter size fractions, individually, were significant controls on observed variation in b-diversity
(Table 6).

32
2.4. Tables and Figures
Table 1. Mean concentrations of total organic carbon (TOC) and particulate carbon (PC) in control and particle-enriched treatments for all experiments conducted as part of this study.
Cruise Treatment (averaged across replicates)
TOC (µmol C/L) PC (µmol C/L)
August, 2016
(HOT 286)
Control N/A 5.2 ± 0.4
Particle-enriched N/A 4.9 ± 0.8
March, 2017
(KOK 1703-1)
Control 63.4 ± 0.4 1.2 ± 0.3
Particle-enriched 66.4 ± 0.7 10.5 ± 6.1
March, 2017
(KOK 1703-2)
Control 63.9 ± 0.8 1.1 ± 0.1
Particle-enriched 68.3 ± 0.8 5.9 ± 3.6
March, 2017
(HOT 291)
Control 57.2 ± 0.7 3.3 ± 2.1
Particle-enriched 62.9 ± 0.8 8.3 ± 0.4
April, 2017
(HOT 292)
Control 57.0 ± 0.7 1.0 ± 0.01
Particle-enriched 61.7 ± 0.5 8.7 ± 0.8

33
Table 2. Average picoplankton cell abundances in the various experiments. Percent difference calculated as: (Particle-enriched/Control) *100.
Control (cells/mL)
Particle-enriched (cells/mL)
Percent Difference (%)
HOT 286 August 2016
2.40 x 10⁵
± 6.91 x 10³ 3.78 x 10⁵
± 3.4 x 10⁴ 37
KOK 1703-1 March 2017
2.22 x 10⁵
± 9.82 x 10³ 2.75 x 10⁵
± 1.89 x 10⁴ 19
KOK 1703-2 March 2017
2.07 x 10⁵
± 1.20 x 10⁴ 2.85 x 10⁵
± 2.64 x 10⁴ 27
HOT 291
March 2017 2.37 x 10⁵
± 9.26 x 10³ 3.35 x 10⁵
± 1.79 x 10⁴ 29
HOT 292 April 2017
2.01 x 10⁵
± 4.22 x 10² 2.33 x 10⁵
± 8.48 x 10³ 14
34
Table 3. Mean rates of bacterial production (BP) from different filter size-fractions during experiments conducted as part of this study. Statistical significance based on t-test; * denotes P<0.05, ** denotes P<0.005, and ns denotes not significant (i.e. P>0.05).
Treatment >20 µm BP
(± stdev) nmol C L-1 d-1
Sig. Normalized >20 µm
BP (± stdev) d-1
Sig. 2-20 µm BP
(± stdev) nmol C L-1 d-1
Sig. Normalized 2-20 µm
BP
(± stdev) d-1
Sig. 0.2-2 µm BP
(± stdev) nmol C L-1 d-1
Sig. Normalized 0.2-2 µm BP
(± stdev) d-1
Sig.
August 2016 (HOT 286)
Control 0.28 (±0.1)
** 5.3 x10⁻⁵ (± 1.5 x10⁻⁵)
** 0.08 (± 0.05)
* 2.1x10-5 (± 2.6 x10-5)
* 0.85 (± 0.4)
** 1.6 x10⁻⁴ (± 7.4 x10⁻⁵)
**
Particle-enriched
4.2 (±0.5)
8.9 x10⁻⁴ (± 1.7 x10⁻⁴)
2.5 (± 0.8)
5.4x10⁻⁴ (± 2.3 x10⁻⁴)
12.4 (± 3.5)
2.6 x10⁻³ (± 6.8x10⁻⁴)
March 2017 (KOK 1703-1)
Control 0.11 (±0.02)
* 5.6x10-7 (± 3.2x10-7)
* 0.07 (± 0.04)
** 4.9x10⁻⁷ (± 6.3 x10⁻⁷)
** 2.6 (± 0.6)
** 1.4x10⁻⁵ (± 9.2x10⁻⁶)
**
Particle-enriched
3.9 (±0.8)
1.9x10⁻⁵ (± 1.2x10⁻⁵)
5.7 (±0.3)
2.9x10⁻⁵ (± 8.3x10⁻⁶)
17 (± 0.9)
8.5x10⁻⁵ (± 1.4x10⁻⁵)
March 2017 (KOK 1703-2 )
Control 0.23 (±0.04)
** 1.2x10⁻⁶ (± 6.7x10⁻⁷)
** 0.66 (± 0.1)
** 3.4x10⁻⁶ (± 2.4x10⁻⁶)
** 3.6 (± 0.1)
* 1.7x10-5 (± 3.3x10⁻⁶)
*
Particle-enriched
4.1 (±0.1)
2.0 x10⁻⁵ (± 2.4x10⁻⁶)
5.2 (± 0.2)
2.5x10⁻⁵ (± 5.4x10⁻⁶)
21 (± 3.5)
1.0x10⁻⁴ (± 5.2x10⁻⁵)
March 2017 (HOT 291)
Control 0.39 (± 0.06)
** 6.2x10⁻⁶ (± 9.3x10⁻⁷)
** 0.27 (± 0.03)
** 5.2x10⁻⁶ (± 1.1x10-6)
* 2.8 (± 0.4)
** 4.4x10⁻⁵ (± 8.3x10⁻⁶)
**
Particle-enriched
3.4 (± 0.2)
5.1x10⁻⁵ (± 3.3x10⁻⁶)
5.6 (± 0.6)
7.9x10⁻⁵ (± 1.4x10⁻⁵)
23 (± 0.5)
3.4x10⁻⁴ (± 7.6x10⁻⁶)
April 2017 (HOT 292)

35
Control 0.88 (± 0.04)
** 1.4x10⁻⁵ (± 5.6x10⁻⁷)
** 0.64 (± 0.05)
ns 8.7x10⁻⁶ (± 8.0x10⁻⁷)
ns 4.2 (± 0.1)
** 6.2x10⁻⁵ (± 2.2x10⁻⁶)
**
Particle-enriched
3.9 (± 0.3)
1.9x10⁻⁵ (± 3.9x10⁻⁷)
3.3 (± 0.3)
1.6x10⁻⁵ (± 8.5x10⁻⁶)
22 (± 1.7)
1.1x10⁻⁴ (± 2.5x10⁻⁵)
36
Table 4. Mean rates of carbon fixation (14C-fix) from different filter size fractions during experiments conducted as part of this study. Statistical significance based on t-test. * denotes P<0.05, ** denotes P<0.005, and ns denotes not significant (i.e. P>0.05).
Treatment
>20 µm 14C-fix
(± stdev) nmol C L-
1 d-1
Sig. Normalized >20 µm
14C-fix (± stdev)
d-1
Sig. 2-20 µm 14C-fix
(± stdev) nmol C L-1 d-1
Sig. Normalized 2-20 µm 14C-
fix (± stdev)
d-1
Sig. 0.2-2 µm 14C-fix
(± stdev) nmol C L-1 d-1
Sig. Normalized 0.2-2 µm
14C-fix (± stdev)
d-1
Sig.
August 2016 (HOT 286)
Control 24 (± 5.0)
ns 3.5 x10⁻² (± 2.7 x 10⁻²)
ns 0.1 (± 2.8)
** 9.8 x 10⁻³ (± 9.7 x 10⁻³)
ns 47.7 (± 5)
ns 1.1 x 10⁻¹ (± 7.7 x 10⁻²)
ns
Particle-enriched 60 (± 8.0)
3.9 x 10⁻³ (± 1.3 x 10⁻³)
17 (± 9.2) 4.9 x 10⁻² (± 2.6 x 10⁻²)
6.2 (± 0.4)
9.2 x 10⁻² (± 4.8 x 10⁻²)
March 2017 (KOK 1703-1)
Control 13 (± 2.0)
ns 5.0 x 10⁻³ (± 9.6 x 10⁻⁴)
ns 0.5 (± 0.7)
* 9.6 x 10-4 (± 8.7 x 10-4)
* 9.7 (± 1.5)
P>0.05
3.7 x 10⁻³ (± 1.4 x 10⁻³)
ns
Particle-enriched 19 (± 8.8)
6.9 x 10⁻³ (± 3.2 x 10⁻³)
29 (± 5.2) 1.0 x 10⁻² (± 3.7 x 10⁻³)
40 (± 0.2)
1.9 x 10⁻² (± 1.4 x 10⁻²)
March 2017 (KOK 1703-2)
Control 10 (± 2.8)
ns 3.9 x 10⁻³
(± 1.2 x 10-
3)
ns 4.4 (± 1.4)
* 1.6 x 10-3 (± 4.8 x 10-4)
* 0.49 (± 0.6)
* 1.8 x 10-3 (± 1.4 x 10⁻³)
*
Particle-enriched 12 (± 2.1)
4.2 x 10⁻³ (± 6.5 x 10⁻⁴)
26 (± 4.7)
9.3 x 10⁻³ (± 3.3 x 10⁻³)
80 (± 27)
2.8 x 10⁻² (± 9.9 x 10⁻³)
March 2017 (HOT 291)
Control 11 (± 2.5)
** 4.7 x 10⁻³ (± 1.1 x 10⁻³)
ns 4.6 (± 6.5)
ns 2.6 x 10⁻³ (± 1.3 x 10⁻³)
ns 1.7 (± 3.7)
ns 9.2 x 10⁻⁴ (± 1.3 x 10⁻³)
ns
Particle-enriched 33 (± 1.3)
1.3 x10⁻²
(± 7.6 x 10⁻⁴) 13
(± 7.8) 6.0 x 10⁻³
(± 5.3 x 10⁻³) 27
(± 17) 1.7 x 10⁻²
(± 1.9 x 10⁻²)
April 2017 (HOT 292)

37
Control 20 (± 6.8)
ns 8.2 x 10⁻³ (± 2.9 x 10⁻³)
ns 0.62 (± 0.1)
ns 13.4 x 10⁻⁴ (± 1.9 x 10⁻⁴)
ns 13 (± 20)
ns 6.2 x 10⁻³ (± 9.4 x 10⁻³)
ns
Particle-enriched 29 (±1.0)
1.1 x 10⁻² (± 9.9 x 10⁻⁵)
41 (± 27)
1.6 x 10⁻² (± 1.1 x 10⁻²)
43 (± 4.8)
1.6 x 10⁻² (± 7.7 x 10⁻³)
38
Table 5. Mean (± standard deviation) relative abundances of top 10 most abundant taxa in the three filter size-fractions (0.2, 2, 20 µm) used for this study arranged by treatment conditions. *Phylogenetic classifications are listed by Class and Family, with Genus level descriptions listed when available
OTU # Class; Family * Filter size fraction/Treatment
Relative abundance (%)
OTU_030893 Thaumarchaeota; Marine Group I 0.2 µm Control 6.39 ± 2.08 OTU_031017,
031036, 031034, 031179
Alphaproteobacteria; SAR 11 clade (Surface 1)
0.2 µm Control 1.17 ± 0.37
OTU_000008 Planctomycetes; Planctomycetaceae 0.2 µm Control 0.99 ± 0.42 OTU_000031 Euryarchaeota; Marine Group II 0.2 µm Control 0.87 ± 0.38 OTU_031182 Cyanobacteria; Family I 0.2 µm Control 0.68 ± 0.42 OTU_030963 Alphaproteobacteria; SAR 11 clade
(Surface 2) 0.2 µm Control 0.63 ± 0.50
OTU_000061 Bacteria; SBR1093 0.2 µm Control 0.61 ± 0.29 OTU_000058 Flavobacteria; NS5 marine group 0.2 µm Control 0.60 ± 0.18 OTU_000065 Actinobacteria; OM1 clade 0.2 µm Control 0.55 ± 0.16 OTU_000075 Acidobacteria; Subgroup 6 0.2 µm Control 0.50 ± 0.29 OTU_031171,
031028, 031002, 031092
Gammaproteobacteria; Vibrio 0.2 µm Particle-enriched
5.22 ± 5.95
OTU_030893 Thaumarchaeota; Marine Group I 0.2 µm Particle-enriched
3.22 ± 2.88
OTU_030682, 030841, 031140
Gammaproteobacteria; Pseudoalteromonas
0.2 µm Particle-enriched
2.03 ± 0.88
OTU_031039, 031111
Gammaproteobacteria; Photobacterium
0.2 µm Particle-enriched
1.47 ± 0.22
OTU_000017 Flavobacteriia; Tenacibaculum 0.2 µm Particle-enriched
0.89 ± 0.91
OTU_031017, 031036, 030134
Alphaproteobacteria; SAR 11 clade (Surface 1)
0.2 µm Particle-enriched
0.75 ± 0.82
OTU_000026 Gammaproteobacteria;Colwellia 0.2 µm Particle-enriched
0.75 ± 0.82
OTU_031147 Cyanobacteria; Prochlorococcus 0.2 µm Particle-enriched
0.52 ± 0.37
OTU_000028 Gammaproteobacteria; Alteromonas 0.2 µm Particle-enriched
0.49 ± 0.79
OTU_ 000008 Planctomycetes; Planctomycetaceae 0.2 µm Particle-enriched
0.48 ± 0.43
OTU_000008, 000024, 000092
Planctomycetes; Planctomycetaceae 2.0 µm Control 2.68 ± 2.35
OTU_000023 Firmicutes; Staphylococcus 2.0 µm Control 1.62 ± 3.87 OTU_031126 Planctomycetes; Pir4 lineage 2.0 µm Control 1.56 ± 0.83 OTU_000038 Planctomycetes; Blastopirellula 2.0 µm Control 1.25 ± 0.80
39
OTU_031112, 031184
Planctomycetes; uncultured 2.0 µm Control 1.22 ± 0.36
OTU_000036 Planctomycetes; Rhodopirellula 2.0 µm Control 0.93 ± 0.77 OTU_000050 Planctomycetes; Pla3 lineage 2.0 µm Control 0.92 ± 0.69 OTU_030893 Thaumarchaeota; Marine Group I 2.0 µm Control 0.92 ± 0.35 OTU_030545 Cyanobacteria; Prochlorococcus 2.0 µm Control 0.64 ± 0.36 OTU_000122 Alphaproteobacteria;
Rhodobacterales 2.0 µm Control 0.60 ± 0.42
OTU_031171, 031028, 031002,
031146
Gammaproteobacteria; Vibrio 2.0 µm Particle-enriched
5.48 ± 2.37
OTU_031039, 031111
Gammaproteobacteria; Photobacterium
2.0 µm Particle-enriched
2.39 ± 0.21
OTU_030841, 030682, 031140
Gammaproteobacteria; Pseudoalteromonas
2.0 µm Particle-enriched
2.10 ± 0.43
OTU_000017 Flavobacteria; Tenacibaculum 2.0 µm Particle-enriched
1.74 ± 1.71
OTU_000028, 000055
Gammaproteobacteria; Alteromonas 2.0 µm Particle-enriched
1.65 ± 1.76
OTU_000033 Gammaproteobacteria; Thalassotalea 2.0 µm Particle-enriched
1.40 ± 1.76
OTU_000026 Gammaproteobacteria; Colweillia 2.0 µm Particle-enriched
1.23 ± 1.23
OTU_000040, 000051
Flavobacteria; Flavoteriaceae 2.0 µm Particle-enriched
1.23 ± 1.21
OTU_000046 Gammaproteobacteria; Vibrionaceae 2.0 µm Particle-enriched
0.77 ± 0.87
OTU_000124 Cyanobacteria; Family I 2.0 µm Particle-enriched
0.67 ± 095
OTU_031112, 031184
Planctomycetes; uncultured 20 µm Control 2.0 ± 0.55
OTU_000039 Planctomycetes; Planctomyceraceae 20 µm Control 0.21 ± 0.22 OTU_031147,
031186 Cyanobacteria; Prochlorococcus 20 µm Control 1.51 ± 1.49
OTU_000100 Betaproteobacteria; Oxalobacteraceae
20 µm Control 1.50 ± 2.46
OTU_000023 Firmicutes; Staphylococcus 20 µm Control 1.45 ± 1.23 OTU_030893 Thaumarchaeota; Marine Group I 20 µm Control 1.39 ± 2.01 OTU_000060 Alphaproteobacteria; Paracoccus 20 µm Control 0.99 ± 1.63 OTU_000070 Gammaproteobacteria;
Pseudoalteromonas 20 µm Control 0.63 ± 1.81
OTU_000046 Gammaproteobacteria; Vibrionaceae 20 µm Control 0.62 ± 0.60 OTU_031171,
031028, 031002 Gammaproteobacteria; Vibrio 20 µm Particle-
enriched 6.47 ± 3.68
OTU_000025 Alphaproteobacteria; Shimia 20 µm Particle-enriched
3.42 ± 6.13

40
OTU_031140, 030682, 030841
Gammaproteobacteria; Pseudoalteromonas
20 µm Particle-enriched
2.71 ± 0.73
OTU_000017 Flavobacteria; Tenacibaculum 20 µm Particle-enriched
2.45 ± 1.2
OTU_031039, 031111
Gammaproteobacteria; Photobacterium
20 µm Particle-enriched
2.27 ± 0.311
OTU_000026 Gammaproteobacteria; Colwellia 20 µm Particle-enriched
1.82 ± 1.69
OTU_000033 Gammaproteobacteria; Thalassotalea 20 µm Particle-enriched
1.73 ± 2.0
OTU_000028 Gammaproteobacteria; Alteromonas 20 µm Particle-enriched
1.42 ± 1.56
OTU_000102 Alphaproteobacteria; Thalassobius 20 µm Particle-enriched
1.11 ± 2.23
OTU_000113 Gammaproteobacteria; Oleiphilus 20 µm Particle-enriched
1.02 ± 1.97

41
Table 6. Permutational analysis of variance (PERMANOVA) describing whether variation in b-diversity (Bray-Curtis distances of 16S rRNA gene OTUs) is explained by experimental treatment compared to control irrespective of variation in taxonomic composition between filter size fractions and vice versa. Interactions between factors tested are indicated with “x”. Degrees of freedom for all tests are 3 and number of samples was 18. All tests of individual factors were significant (p<0.001), i.e. within each experiment the variation between treatment compared to control and between filter size fractions significantly explained the observed variation in beta-diversity.
Cruise Factor Analyzed p-value HOT 286 Treatment x Filter <0.007
Filter x Treatment <0.002 KOK 1703-1 Treatment x Filter <0.02
Filter x Treatment <0.017 KOK 1703-2 Treatment x Filter <0.026
Filter x Treatment <0.038 HOT 291 Treatment x Filter <0.007
Filter x Treatment <0.004 HOT 292 Treatment x Filter <0.018
Filter x Treatment <0.003

42
Figure 1. Filter size-fractionated rates of bacterial production (based on 3H-leucine incorporation) during the various experiments conducted as part of this study. Error bars depict standard deviations of mean rates.
43
Figure 2. Cell abundance normalized rates of bacterial production (based on 3H-leucine incorporation) during the various experiments conducted as part of this study. Error bars depict standard deviations of mean rates. Dark colors indicate particle amended treatments, light colors indicate controls.
44
Figure 3. Filter size-fractionated rates of carbon fixation (based on 14C-bicarbonate assimilation) during the various experiments conducted as part of this study. Error bars depict standard deviations of mean rates.
45
Figure 4. Cell abundance normalized rates of carbon fixation (based on 14C-bicarbonate assimilation) during the various experiments conducted as part of this study. Error bars depict standard deviations of mean rates. Dark colors indicate particle amended treatments, light colors indicate controls.
46
0.2 um 2 um 20 um
3
4
5
6
7
Control
●
0.2 um 2 um 20 um
3
4
5
6
7
Particle−amended
Filter Size
Shan
non
Inde
x
Figure 5. Box plots depicting Shannon diversity index for the controls and particle-enriched treatments arranged by filter size. Dark line depicts the median value, with box boundaries representing 25th and 75th percentiles; error bars depict 1.5*inter-quartile range between the 25th and 75th percentiles.
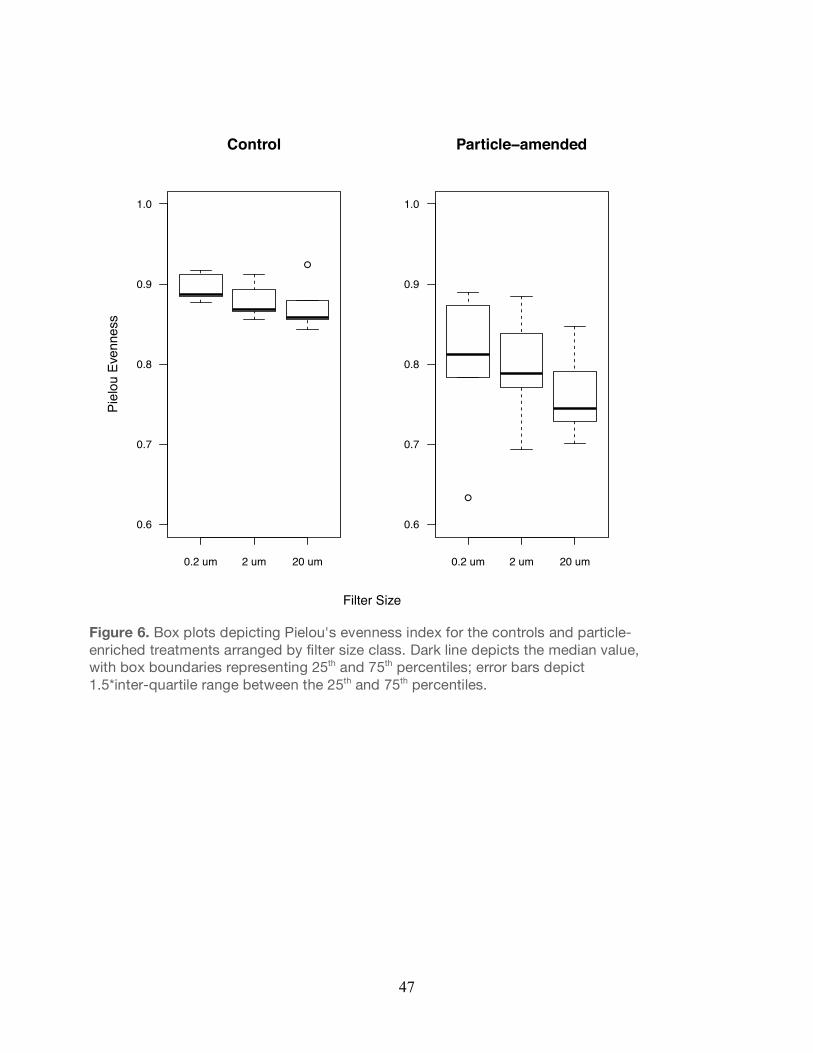
47
●
0.2 um 2 um 20 um
0.6
0.7
0.8
0.9
1.0
Control
●
0.2 um 2 um 20 um
0.6
0.7
0.8
0.9
1.0
Particle−amended
Filter Size
Piel
ou E
venn
ess
Figure 6. Box plots depicting Pielou's evenness index for the controls and particle-enriched treatments arranged by filter size class. Dark line depicts the median value, with box boundaries representing 25th and 75th percentiles; error bars depict 1.5*inter-quartile range between the 25th and 75th percentiles.

48
Figure 7. Box plots depicting number of OTUs arranged by filter size; dark line depicts the median value, with box boundaries representing 25th and 75th percentiles; error bars depict 1.5*inter-quartile range between the 25th and 75th percentiles.

49
Figure 8. Average relative abundances of major 16S rRNA gene taxa among differing filter size classes from experiments conducted in August, 2016 (HOT 286).
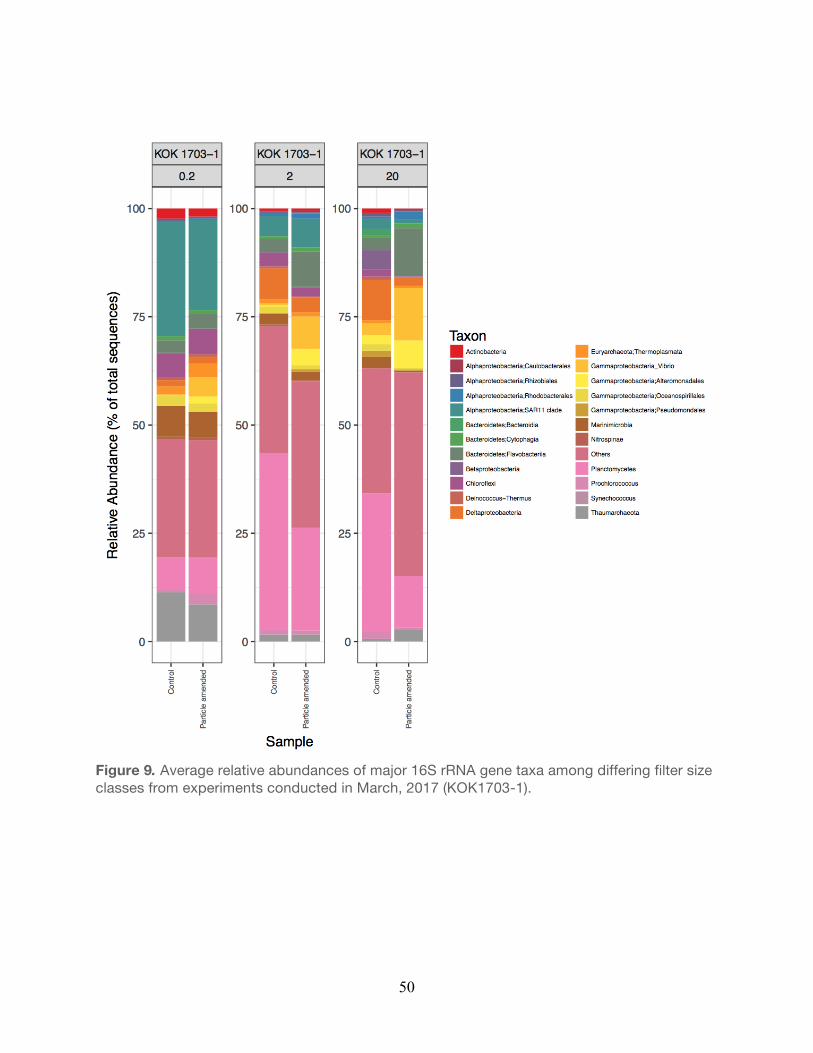
50
Figure 9. Average relative abundances of major 16S rRNA gene taxa among differing filter size classes from experiments conducted in March, 2017 (KOK1703-1).
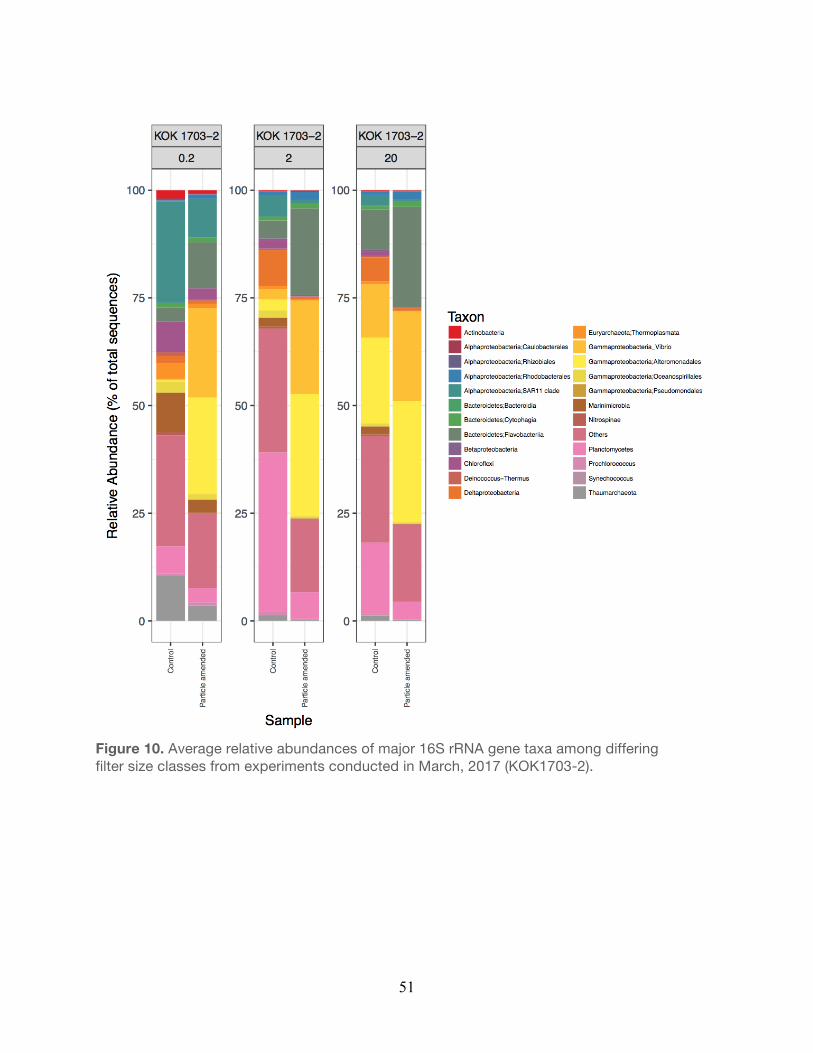
51
Figure 10. Average relative abundances of major 16S rRNA gene taxa among differing filter size classes from experiments conducted in March, 2017 (KOK1703-2).
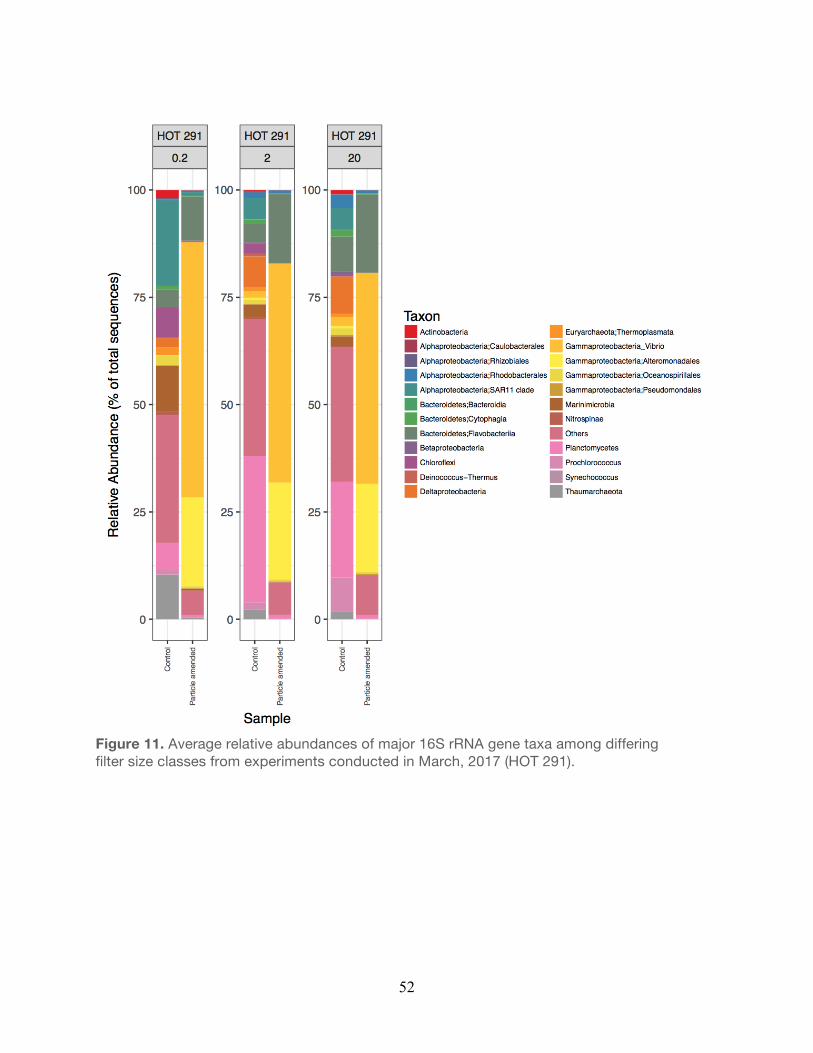
52
Figure 11. Average relative abundances of major 16S rRNA gene taxa among differing filter size classes from experiments conducted in March, 2017 (HOT 291).
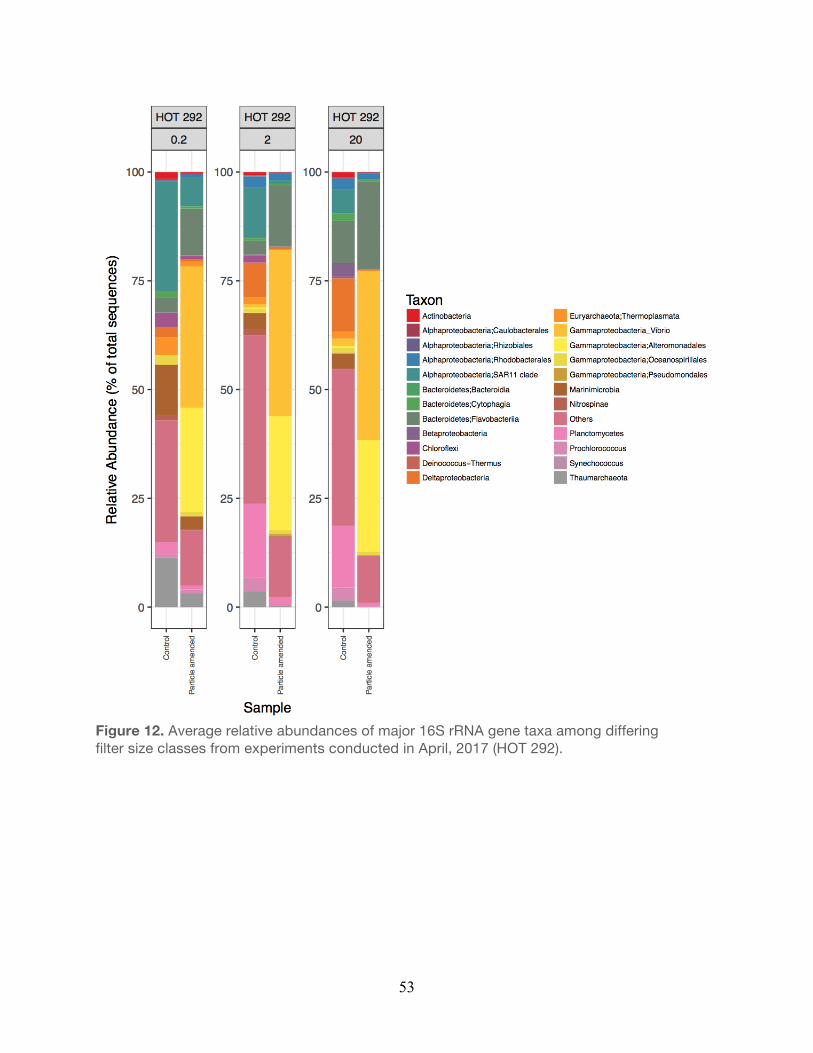
53
Figure 12. Average relative abundances of major 16S rRNA gene taxa among differing filter size classes from experiments conducted in April, 2017 (HOT 292).
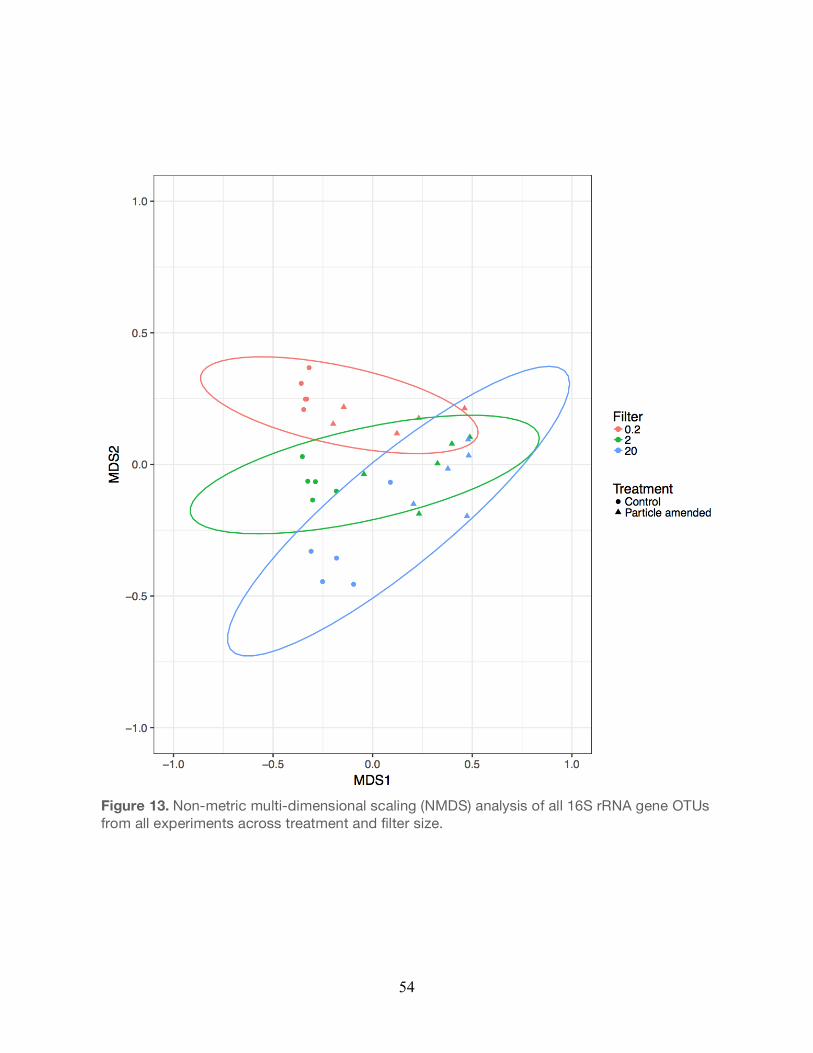
54
Figure 13. Non-metric multi-dimensional scaling (NMDS) analysis of all 16S rRNA gene OTUs from all experiments across treatment and filter size.

55
2.5. Discussion
Sinking POM is a major source of energy and material transfer between the upper ocean and
the deeper interior waters of the sea (Martin et al. 1987). Moreover, sinking particles can
constitute an important habitat for marine bacteria (Grossart 2010); to date however, relatively
few studies have characterized the types of microbes and rates of microbial production
associated with sinking POM. Moreover, while there is a consensus that sinking particles often
represent hotspots for microbial activity in the ocean, variability associated with microbial
activities on sinking particles remains largely unknown.
The current study was designed to evaluate microbial activities (based on measurements of
bacterial production and carbon fixation) on differing size classes of particles in a series of
experiments where sinking particles were added to whole seawater and results compared to
unamended seawater controls. In general, normalized rates of bacterial production in the 2-20
µm filter size class demonstrated the largest relative response in the particle-enriched
treatments compared to the controls. This filter size class presumably includes particle-
attached microbes and relatively large free-living microorganisms (for example relatively large
cyanobacteria). In contrast, the 0.2-2 µm size class would include both free-living and particle-
attached microbes and >20 µm filter size would be expected to contain mostly particle-
attached microbial communities, colonial microorganisms, or perhaps microbes retained on
larger filters due to clogging during the filtration process. Such results suggest that rates of
bacterial production associated with relatively small sinking particles can be rapid at Station
ALOHA. To date, there is limited information on the particle size structure of sinking particles at
Station ALOHA making it difficult to assess whether particles in this size range are important
contributors to downward carbon flux. Previously analyses of suspended particle size

56
structure has revealed that particles <20 µm are major contributors to the suspended particle
concentrations (Barone et al. 2015; White et al. 2015).
In general, the normalized rates of bacterial production in the particle-enriched treatments
averaged across all cruises were 7-, 22-, and 15- fold greater than the controls for 0.2-2 µm, 2-
20 µm and >20 µm filter sizes, respectively. Thus, the addition of particles significantly
stimulated bacterial production, especially in 2-20 µm filter size fraction. Cell abundances were
generally similar among the particle-enriched and controls (varying <35%), suggesting the
elevated rates of bacterial production were likely driven by increases in bacterial growth rather
than differences in bacterial biomass associated with sinking particles. When rates of bacterial
production and carbon fixation were normalized to cell abundances, significant differences
between particle-enriched and controls were observed in rates of bacterial production across all
experiments, but only on two occasions (March 2017: KOK 1703-1 and KOK 1703-3) for carbon
fixation. Such results suggest the enriched sources of energy and nutrients afforded by sinking
particles provided a habitat conducive to bacteria growth.
Despite the increase in rates of bacterial production following the addition of sinking particles,
rates of carbon fixation did not demonstrate consistent stimulation to particle amendments.
Although the normalized rates of carbon fixation in the particle-enriched treatments were (on
average) 6-, 14-, and 2- fold greater than the controls for 0.2-2 µm, 2-20 µm and >20 µm filter
sizes, respectively, the resulting rates were not significantly different. Rates of carbon fixation
in this region of the upper mesopelagic zone are likely driven in large part by the activities of
chemoautotrophic Archaea and Bacteria. Since chemoautotrophs derive energy from the
oxidation of inorganic compounds, the addition of organic-rich particles might not immediately
stimulate rates of carbon fixation; hence, over the short time scales of these experiment (<24

57
hours) chemoautotrophic microorganisms may not have responded to the addition of particles.
Moreover, amplification and sequencing of 16S rRNA genes revealed low relative abundances
of known chemoautotrophs across the three different filter size fractions in the particle-
enriched filter fractions. Some of the most abundant of the known chemoautotrophs were
members of the Thaumarchaea and Nitrospinae, and these taxa were in low relative
abundances in the particle-enriched treatments. In contrast, the large responses in rates of
bacterial production in response to the particle treatments, particularly in the larger filter size
fractions, is consistent with observed differences in relative abundances of presumed
chemoheterotrophs in these treatments. In particular, members of the Gammaproteobacteria,
Planctomycetes, and Flavobacteria were highly represented in the particle treatments; such
microorganisms have previously been shown to respond rapidly to the availability of organic
matter, consistent with a heterotrophic lifestyle.
In addition to examining rates of microbial production associated with differing filter size
classes, I also analyzed the relative abundances and taxonomic diversity of microorganisms in
these experiments. Taxonomic diversity of prokaryote assemblages (based on 16S rRNA gene
sequence analyses) differed among the filter size classes in both the controls and in the
particle-enriched treatments. In the particle-enriched treatments, dominant taxa included OTUs
clustering among Gammaproteobacteria (e.g. Vibrio, Altermonadales), Flavobacteria, and
Planctomycetes. Such taxa have previously been reported to grow rapidly in nutrient-enriched
marine habitats including associated with suspended or sinking particles (Rieck et al., 2015;
Ortega-Retuerta et al., 2013; Teske et al., 2011). Notably, dominant taxa associated with the
smallest filter size fraction (0.2-2 µm) in the particle enriched treatments included various
copiotrophic taxa such as members of the Gammaproteobacteria, Planctomycetes, and
Flavobacteria. Intriguingly, the smallest filter size class in the particle-enriched treatments also
58
included taxa (e.g. Thaumarchaea and Prochlorococcus) identical to those retrieved in the
small filter size fractions from the unamended controls. Such observations likely reflect the
presence of these organisms as “free-living” members of the water into which the particles
were amended. The larger size fractions in particle-enriched treatments were highly enriched in
presumed copiotrophic members of the Gammaproteobacteria and Flavobacteria. These
organisms appear specialized for growth under nutrient-enriched conditions, including
demonstrating rapid growth rates and generally containing larger genomes (and hence
expanded genetic potential) than the oligotrophic organisms most prevalent in seawater (Koch
2001; Lauro et al. 2009).
Major taxa observed in the smallest filter size class in the unamended controls included
commonly retrieved oligotrophic members of the prokaryote assemblage, including
Thaumarchaea, Alphaproteobacteria (e.g. SAR 11 clade), Cyanobacteria (Prochlorococcus)
Actinobacteria, and Marinimicrobia. Previous studies on these taxa are consistent with these
organisms generally having small cell sizes and being well-adapted to the low nutrient
conditions that predominate at Station ALOHA (DeLong et al., 1993; Fontanez et al., 2015;
Pelve et al., 2017). In contrast, taxa in the larger size fractions of the unamended controls
tended to be dominated by members of the Planctomycetes and Gammaproteobacteria, but
often different families of these bacteria than observed in the particle enriched treatments. Such
findings may suggest organisms contained in these phyla demonstrate diverse physiologies,
and/or reflect that these organisms are living attached to suspended or slowly sinking particles
in whole seawater.
Results from my particle enrichment experiments indicate that the types of microorganisms
associated with sinking particles differ from those commonly observed in low nutrient marine

59
habitats. Moreover, these results are consistent with previous studies that have found that
particle-attached microorganisms are distinct from those considered ‘free-living’, suggesting
members of these taxa are poised to rapidly colonize organic-enriched particles in this
otherwise oligotrophic habitat (DeLong et al., 1993, Fontanez et al., 2015; Smith et al.,2013;
Rieck et al., 2013). Gammaproteobacteria have been identified in high-nutrient marine
sediments and waters (Teske et al., 2011; Franco et al., 2017) and a number of studies indicate
that members of marine Gammaproteobacteria, specifically those belonging to the orders
Vibrionales and Alteromonas, are copiotrophs, adapted to growth under nutrient-replete
conditions (Lauro et al. 2009; Cho and Giovannoni 2004). The predominance of these
organisms with sinking particles suggests such taxa may utilize particles as sources of
nutrients in an otherwise nutrient-depleted water column.
I also utilized various statistical analyses to examine the diversity (both richness and evenness)
of prokaryotic taxa retrieved from these experiments. The derived estimates of OTU richness
(total number of OTUs) and evenness (Pielou’s index) suggested reduced prokaryote diversity
in the particle-enriched treatments relative to the controls. Consistent with these results, the
derived Shannon H indices (inclusive of richness and evenness) also indicated the addition of
particles significantly reduced the diversity of microbial assemblages relative to the controls.
Moreover, these indices of diversity were also greatest in the smallest (0.2-2 µm) filter size
fraction, regardless of treatment conditions. A previous study by Rieck et al. (2015) collected
surface samples from the Baltic Sea at three stations with varying salinities: marine,
mesohaline and oligohaline. Results from their study indicated that OTU richness and evenness
were both significantly greater in the particle-associated fraction. Similarly, a study by Ortega-
Retuerta et al., (2013) in the Arctic Ocean also found that particle-associated prokaryotes
generally showed higher diversity (Shannon, Simpson and Chao indices) than free-living

60
prokaryote assemblages. In contrast, in the Laptev Sea, Kellogg and Deming (2009) found that
both small, suspended particles and large aggregates had lower prokaryote diversity (Shannon
H) than free-living prokaryote assemblages. Hence, although sinking POM has been described
as a “hotspot” for microbial activity and abundance (Rieck et al., 2015; Ortega-Retuerta et al.,
2013, Smith et al., 2013), results from my study suggest sinking particles from Station ALOHA
generally maintain lower prokaryote diversity than the surrounding seawater. Such results
presumably reflect the rapid colonization of nutrient-enriched particle “hotspots” by rarer,
copiotrophic microorganisms in an otherwise oligotrophic habitat.
Interestingly, in both the particle-amended treatments and controls, microbial diversity (both
OTU richness and evenness) decreased with larger filter size classes. This trend was most
apparent in the particle-enriched treatments. In the particle-enriched treatments, the total
number of unique OTUs in the 0.2 µm, 2 µm, and >20 µm filter fractions decreased with
increasing filter size. There have only been a handful of studies examining bacterial diversity
from size-fractionated plankton samples in the ocean. A recent study by Mestre et al. (2017) in
the Mediterranean Sea examined bacterial diversity across 6 sequentially-filtered size fractions:
0.2-0.8, 0.8-3.0, 3.0-5.0, 5.0-10, 10-20, and 20-200 µm. This study found that bacterial
diversity (Shannon H) increased in the larger filter size-fractions, with the greatest diversity
observed in the 20-200 µm fraction and the lowest diversity observed in the 0.2-0.8 µm
fraction. These authors conclude that larger particles provide additional habitable niches to
support microorganism growth, thereby promoting greater diversity. Although the results from
this study appear to contradict those of my study, there are several important differences in the
experimental design of these studies. For example, I did not serially filter samples for
subsequent analyses of 16S rRNA genes, unlike the Mestre et al. (2017) study. In my study,
those OTUs captured in the larger size fractions should also be present in the smaller size
61
fraction (i.e. the 2 µm and 20 µm OTUs would be retained by the 0.2 µm filter), while the serial
filtration used in the Mestre et al. (2017) study would selectively remove larger cells with each
filter size class. Moreover, the Mestre et al. (2017) study focused on the near-surface waters of
the oligotrophic Mediterranean Sea, sampling bacterial taxa associated with suspended
particles, where the particle assemblage presumably includes live cells and non-sinking
detritus. In contrast, the focus of the current study was in the dimly-lit waters of the upper
mesopelagic waters (175 m) and examined microorganisms associated with sinking particulate
matter.
I also utilized NMDS analyses to examine the clustering of taxa by both filter size and
treatment. Similar to the results of Mestre et al. (2017), samples from my experiments formed
statistically robust clusters separated by filter size fractions. The results from these analyses
also indicated that both treatment and filter size were important factors controlling the resulting
taxa composition. Interestingly, targeted PERMANOVA analyses for each experiment
highlighted that prokaryotic taxonomic composition varied with both treatment (particle-
enriched versus control) and filter size class. Specifically, when controlling for treatment, the
observed taxonomic composition demonstrated significant differences among the various filter
size fractions. Moreover, when controlling for filter size fraction, the observed taxonomic
composition was significantly related to treatment (particle-enriched or unamended controls).
Thus, both treatment conditions and filter size fractions independently have significant effects
on the bacterial taxonomic composition.
Conclusions and Future Directions
In this thesis, I examined the physiological activities and diversity of microorganisms
associated with sinking particles at Station ALOHA. Through use of particle-enrichment

62
experiments and subsequent size separation of rates of bacterial production and carbon
fixation together with assessment of prokaryote assemblage composition, my research
provided new insights into microbial decomposition of sinking particles at Station ALOHA.
Findings from this work demonstrated that the addition of particles significantly stimulated
rates of bacterial production relative to whole seawater controls. Most notably, rates of
bacterial production in the 2-20 µm size fraction were 9-18-fold greater in the particle-
amended treatments relative to the controls. In contrast, rates of carbon fixation, presumably
catalyzed by the activities of chemoautotrophic and heterotrophic (via anaplerotic
pathways) prokaryotes, were in general not significantly different in the particle-enriched
treatments relative to controls. Consistent with this finding, assessment of prokaryote
assemblages by amplification and sequencing of 16S rRNA genes revealed that the particle-
enriched treatments were dominated by microorganisms typically considered heterotrophic
copiotrophs. Hence, the lack of consistent stimulation in carbon fixation in these treatments
may reflect the ability of these heterotrophic copiotrophs to outcompete slower growing
chemoautotrophs on organic-rich particles. Though some of these copiotrophs (e.g. members
of the Gammaproteobacteria) were also found in the larger size fractions of the unamended
controls, the specific OTUs were distinct from those associated with the particle-enriched
treatments.
The findings of this thesis also offer new insights into the biological dynamics of the sinking
particles at Station ALOHA. These results may provide baseline understanding of the types of
microorganisms and microbial activities associated with sinking POM in oligotrophic ocean
ecosystems. Such results may open new doors to future research and highlight several
outstanding questions. For example, it remains unclear how microbial interactions may vary
with changes in particle size that have been hypothesized to occur seasonally at Station
63
ALOHA (Karl et al. 2012). Moreover, it would be interesting to have conducted longer
incubations (perhaps even weeks in duration) to elucidate possible microbial succession over
time as resources available from the particles diminish. I also expect that further investigation
into the identification, categorization, and quantitative description of sinking particles would be
useful for understanding the factors that influence sinking speeds and microbial colonization of
these particles.

64
References
Acinas, S.G., Antón, J., and Rodríguez-Valera, F. (1999). Diversity of free-living and attached
bacteria in offshore western Mediterranean waters as depicted by analysis of genes encoding 16S rRNA. Appl. Environ. Microbiol. 65: 514–522.
Alldredge, A.L., and Silver, M.W. (1988). Characteristics, dynamics, and significance of marine snow. Prog. Oceanogr. 20: 41-82.
Alldredge, A.L., Granata, T.C., Gotschalk, C.C., and Dickey, T.D. (1990). The physical
strength of marine snow and its implications for particle disaggregation in the ocean. Limnol. Oceanogr. 35: 1415-1428.
Alldredge, A.L., Passow, U., and Logan, B.E. (1993). The abundance and significance of a class of large, transparent organic particles in the ocean. Deep-Sea Res. I 40: 1131-1140.
Allen, L. Z., Allen, E.E., Badger, J.H., McCrow, J.P., Paulsen, I.T., and Elbourne, L.D.
(2012). Influence of nutrients and currents on the genomic composition of microbes across an upwelling mosaic. ISME J. 6, 1403-1414. doi:10.1038/ismej.2011.201.
Arrigo, K.R. (2005). Marine microorganisms and global nutrient cycles. Nature 437: 349-
355. Asper, V.L., and Smith Jr., W.O. (2003). Abundance, distribution and sinking rates of
aggregates in the Ross Sea, Antarctica. Deep-Sea Res. I. 50: 131-150. Baltar, F., J. Arístegui, J. M. Gasol, and G. J. Herndl (2010). Prokaryotic carbon utilization in the
dark ocean: growth efficiency, leucine-to-carbon conversion factors, and their relation. Aquat. Microb. Ecol. 60: 227–232, doi:10.3354/ame01422.
Barone, B., Bidigare, R.R., Church, M.J., Karl, D.M., Letelier, R.M., and White, A.E.
(2015). Particle distributions and dynamics in the euphotic zone of the North Pacific Subtropical Gyre. J. Geophys. Res. Oceans. doi:10.1002/2015JC010774
Biddanda, B.A.(1985). Microbial synthesis of macro-particulate matter. Mar. Ecol. Prog.
Ser. 20: 241-251.
Bidle, K.D., and Fletcher, M. (1995). Comparison of free-living and particle-associated bacterial communities in the Chesapeake Bay by stable low-molecular-weight RNA analysis. Appl. Environ. Microbiol. 61: 944–952.
Bidle, K.D., and Azam, F. (1999). Accelerated dissolution of diatom silica by marine bacterial
assemblages. Nature 397: 508-512. Bishop, J. K.B. (2009). Autonomous observations of the ocean biological carbon pump.
Oceanogr. 22: 182-193.

65
Blackburn, N., T. Fenchel, and J. Mitchell. (1998). Microscale nutrient patches in planktonic
habitats shown by chemotactic bacteria. Science 282:2254-2256. Bochdansky, A.B., Jericho, M.H., and Herndl, G.J. (2013). Development and deployment of a
point-source digital inline holographic microscope for the study of plankton and particles to a depth of 6000 m. Limnol. Oceanogr. Methods 1: 28-40.
Boschker, H.T.S., Vasquez-Cardenas, D., Bolhuis, H., Moerdijk-Poortvliet, T.W.C., and
Moodley, L., (2014). Chemoautotrophic carbon fixation rates and active bacterial communities in intertidal marine sediments. PLoS One 9, .doi:10.1371/journal.pone.0101443.
Bryant, J.A., Aylward, F.O., Eppley, J.M., Karl, D.M., Church, M.J., and DeLong, E.F.
(2016). Wind and sunlight shape microbial diversity in surface waters of the North Pacific Subtropical Gyre. ISME J. 10: 1308-1322.
Brown, M.V., Philip, G.K., Bunge, J.A., Smith, M.C., Bissett, A., Lauro, F.M., Fuhrman, J.A., and Donachie, S.P. (2009). Microbial community structure in the North Pacific Ocean. ISME J. 3: 1374-1386.
Buesseler, K.O., Antia, A.N., Chen, M., Fowler, S.W., Gardner, W.D., Gustafsson, O., Harada, K., Michaels, A.F., Rutgers van der Loeff, M., Sarin, M., Steinberg, D.K., and Trull, T. (2007). An assessment of the use of sediment traps for estimating upper ocean particles fluxes. J. Mar. Res. 65: 345-416.
Buesseler, K.O., and Boyd, P.W. (2009). Shedding light on processes that control particle export and flux attenuation in the twilight zone of the open ocean. Limnol. Oceanogr. 54: 1210-1232.
Carlson, C.A., Ducklow, H.W., Michaels, A.F. (1994). Annual flux of dissolved organic carbon
from the euphoric zone in the northwestern Sargasso Sea. Nature 371: 405. Caron, D.A., Davis, P.G., Madin, L.P., and Sieburth, J.M. (1986). Enrichment of
microbial populations in macro aggregates (marine snow) from surface waters of the North Atlantic. J. Mar. Res. 44: 543-565.
Cassar, N., Wright, S.W., Thomson, P.G., Trull, T.W., Westwood, K.J., Salas, M.D., Davidson, A., Pearce, I., Davies, D.M., and Matear, R.J. (2015). The relation of mixed-layer net community production to phytoplankton community composition in the Southern Ocean. Glob. Biogeochem. Cycles 29: 446-462.
Cho, J.C., and Giovannoni, S.J. (2004). Cultivation and growth characteristics of a diverse group of oligotrophic marine Gammaproteobacteria. Appl. Environ. Microbiol 70: 432-40.
Church, M.J., H.W. Ducklow, R.M. Letelier, and D.M. Karl. (2006). Temporal dynamics
in photoheterotrophic picoplankton productivity in the subtropical North Pacific Ocean. Aquat. Microb. Ecol. 45: 41-53.

66
Collins, J.R., Edwards, B.R., Thamatrakoln, K., Ossolinski, J.E., DiTullio, G.R., Bidle,
K.D., Doney, S.C., and Van Mooy, B.A.S. (2015). The multiple fates of sinking particles in the North Atlantic Ocean. Glob. Biogeochem. Cycles 29: 1471-1494.
Crespo B. G., Pommier T., Fernández Gómez B., and Pedrós Alió C. (2013). Taxonomic composition of the particle-attached and free-living bacterial assemblages in the Northwest Mediterranean Sea analyzed by pyrosequencing of the 16S rRNA. Microbiol. Open 2: 541–552.
Delong, E.F., Franks, D.G., and Alldredge, A.L. (1993). Phylogenetic diversity of
aggregate-attached vs. free-living marine bacterial assemblages. Limnol. Oceanogr. 38: 924-934.
DeLong, E. F., Preston, C.M., Mincer, T., Rich, V., Hallam, S.J., Frigaard, N.U., Martinez,
A., Sullivan, M.B., Edwards, R., Brito, B.R., Chisholm, S.W., and Karl, D.M. (2006). Community genomics among stratified microbial assemblages in the ocean’s interior. Science 311: 496-503.
Dilling, L., and Alldredge, A.L. (2000) Fragmentation of marine snow by swimming
macrozooplankton: A new process impacting carbon cycling in the sea. Deep-Sea Res. I 47: 1227-1245.
Durkin, C.A., Estapa, M.L., and Buesseler, K.O.(2015). Observations of carbon export by small sinking particles in the upper mesopelagic. Mar. Chem. 175: 72-81.
Edgar, R.C. (2013). UPARSE: Highly accurate OTU sequences from microbial amplicon reads. Nature Methods 10: 996-8. doi: 10.1038/nmeth.2604.
Erb, T. (2011). Carboxylases in natural and synthetic microbial pathways. Appl. Environ. Microbiol. 77: 8466–847.
Ferron, S., Wilson, S.T., Martinez-Garciz, S., Quay, P.D., and Karl, D.M. (2015).
Metabolic balance in the mixed layer of the oligotrophic North Pacific Ocean from diel changes in O2/Ar saturation ratios. Geophys. Res. Lett. 42.
Fontanez, K.M., Eppley, J.M., Samo, T.J., Karl, D.M., and DeLong, E.F. (2015). Microbial
community structure and function on sinking particles in the North Pacific Subtropical Gyre. Front. Microbiol. 6. 1-14.
Fowler, S.W., and Knauer, D.A. (1986). The role of large particles in the transport of elements and organic components through the ocean water column. Prog. Oceanogr. 16: 147-194.
Franco, D.C., Signori, C.N., Duarte, R.T.D., Nakayama, C.R., Campos, L.S., and
Pellizari, V.H. (2017) High Prevalence of Gammaproteobacteria in the Sediments of Admiralty Bay and North Bransfield Basin, Northwestern Antarctic Peninsula. Front. Microbiol. 8:153. doi: 10.3389/fmicb.2017.00153.
67
Ganesh, S., Parris, D. J., DeLong, E.F., and Stewart, F. J. (2014). Metagenomic analysis of size-fractionated picoplankton in marine oxygen minimum zone. ISME J. 8, 187-211. doi: 10.1038/ismej.2013.144.
Ghiglion, J.F., Conan, P., and Pujo-Paym, M. (2009). Diversity of total and active free-living vs. particle-attached bacteria in the eutrophic zone of the NW Mediterranean Sea. FEMS Microbiol. Lett. 299: 9–21.
Giovannoni, S. J. (2017). SAR11 Bacteria: The most abundant plankton in the oceans. Ann. Rev. Mar. Sci. 9: 231–255.
Gottschalk, G. (1986). Bacterial Metabolism. Springer, 2nd ed. Grossart, H.P., and Simon, M. (1998). Bacterial colonization and microbial
decomposition of limnetic organic aggregates (lake snow). Aquat. Microbiol. Ecol. 15:127–140.
Grossart, H.P, Kiorboe, T., Tang, K., and Plout, H. (2003). Bacterial colonization of particles: Growth and interactions. Appl. Environ. Microbiol. 69: 3500-3509.
Grossart, H.P. (2010). Ecologial consequences of bacterioplankton lifestyles: changes in concepts are needed. Environ. Microbiol. Rep.2, 706-714.
Guidi, L., Stemmann, L., Jackson, G.A., Ibanez, F., Claustre, H., Legendre, L., Picheral, M., and Grosky, G. (2009). Effects of phytoplankton community on production, size, and export of large aggregates: a world-ocean analysis. Limnol. Oceanogr. 54: 1951-1963.
Herndl, G.J., and Reinthaler, T. (2013). Microbial control of the dark end of the biological pump. Nat. Geosci. 6 (9): 718-724. doi:10.1038/ngeo1921.
Hoffert, M. I. and Volk, T. (1985). Ocean carbon pumps: analysis of relative strengths
and efficiencies in ocean-driven atmospheric CO2 changes. The Carbon Cycle and Atmospheric CO: Natural Variations Archean to Present (eds E.T. Sundquist and W.S. Broecker). American Geophysical Union, Washington, D.C. doi: 10.1029/GM032p0099.
Hughes, J.B., Hellmann, J.J., Ricketts, T.H., and Bohannan, B.J.M. (2001). Counting the uncountable: statistics approaches to estimating microbial diversity. Appl. Environ. Microbiol. 67: 4399-4406. doi:10.1128/AEM.67.10.4399-4406.2001.
Iverson, V., Morris, R. M., Frazar, C. D., Berthiaume C. T., Morales R. L., and Armbrust
E. V. (2012). Untangling genomes from metagenomes: revealing an uncultured class of marine Euryarchaeota. Science 335: 587–590. 10.1126/science.1212665
Jackson, G.A., Waite, A.M., and Boyd, P. (2005). Role of algal aggregation in vertical carbon
export during SOIREE and in other low biomass environments. Geophys. Res. Lett. 32: L13607.
68
Jones, D. R., D. M. Karl and E. A. Laws. (1996). Growth rates and production of heterotrophic bacteria and phytoplankton in the North Pacific subtropical gyre. Deep-Sea Res. I 43(10): 1567-1580.
Karl, D.M., Knauer, G.A., Martin, J.H., and Ward, B.B. (1984). Bacterial
chemolithotrophy in the ocean is associated with sinking particles. Nature 309: 54-56.
Karl, D.M., Christian, F.R., Dore, J.E., Hebel, D.V., Letelier, R.M., Tupas, L.M., and Winn, C.D. (1996). Seasonal and interannual variability in primary production and particle flux at Station ALOHA. Deep-Sea Res. II 43: 539-568.
Karl, D.M. (2002). Nutrient dynamics in the deep blue sea. Trends Microbiol. 9: 410-418. Karl, D. M., Church, M. J. Dore, Letelier, R. M., and Mahaffey, C. (2012). Predictable and
efficient carbon sequestration in the North Pacific Ocean supported by symbiotic nitrogen fixation. Proc. Nat. Acad. Sci. USA. 109: 1842-1849.
Karl, D. M. and Church, M. J. (2017). Ecosystem structure and dynamics in the North Pacific
Subtropical Gyre: New views of an old ocean. Ecosystems 20: 433-457, doi: 10.1007/s10021-017-0117-0.
Karner, M.B., DeLong, E.F., and Karl, D.M. (2001). Archaeal dominance in the
mesopelagic zone of the Pacific Ocean. Nature 409: 507-510. Kelogg C.T.E., Deming, J.W. (2009). Comparison of free-living, suspended particle, and
aggregate-associated bacterial and archaeal communities in the Laptev Sea. Aquat. Microbiol. Ecol. 57: 1-18.
Kirchman, D.L., K’nees, E., and Hodson, R. (1985). Leucine incorporation and its
potential as a measure of protein synthesis by bacteria in natural aquatic waters. Appl. Environ. Microbiol. 49: 599-607.
Kirchman, D.L. (2001). Limitation of bacterial growth by dissolved organic matter in the subarctic
Pacific. Mar. Ecol. Prog. Ser.: 47-54. Kiorboe, T., and Hansen, J.L.S. (1993). Phytoplankton aggregate formation:
observations of patterns and mechanisms of cell sticking and the significance of exopolymer material. J. Plank. Res. 15: 993-1018.
Koch, A.L. (2001). Oligotrophs versus copiotrophs. Bioessays 23: 657.61. Könneke, M., Schubert, D. M., Brown, P.C., Hügler, M., Standfest, S., Schwander, T., Schada
von Borzyskowski, L., Erb, T. J., Stahl, D. A., and Berg, I. A. (2014). Ammonia-oxidizing archaea use the most energy-efficient aerobic pathway for CO2 fixation. Proc. Nat. Acad. Sci. USA. 111: 8239-8244.
LaMontagne, M.G., and Holden, P.A. (2003). Comparison of free-living and particle-associated
bacterial communities in a coastal lagoon. Microbiol. Ecol. 46: 228–237.
69
Lauro, F.M., McDougald, D., Thomas, T., Williams, T.J., Egan, S., Rice, S., Demaere, M.Z.,
Ting, L., Ertan, H., Johnson, J., Ferriera, S., Lapidus, A., Anderson, I., Kyrpides, N., Munk, C.A., Detter, C., Han, C.S., Brown, M.V., Robb, F.T., Kjelleberg, S., and Cavicchioli, R. (2009). The genomic basis of trophic strategy in marine bacteria. Proc. Nat. Acad. Sci. USA. 106 (37): 15527-33. doi: 10.1073/pnas.0903507106.
Letelier, R. M., Dore, J., Winn, C. D., and Karl, D. M. (1996). Seasonal and interannual
variations in autotrophic carbon assimilation at Station ALOHA. Deep-Sea Res., Part II, 43: 467 – 490.
Li, W.K.W. (1982). Estimating heterotrophic bacterial productivity by inorganic
radiocarbon uptake: importance of establishing time courses of uptake. Mar. Ecol. Prog. Ser. 8: 167-172.
Lindh, M. V., Figueroa, D., Sjostedt J., Baltar F., Ludin, D., Andersson, A., Legrand, C.,
and Pinhassi, J. (2015). Transplant experiments uncover Baltic Sea basin-specific responses in bacterioplankton community composition and metabolic activities. Front. Microbiol. 6. doi: 10.3389/fmicb.2015.00223.
Logan, B.E., Passow, U., Alldredge, A., Grossart, H.P., and Simon, M. (1995). Rapid formation and sedimentation of large aggregates is predictable from coagulation rates (half-lives) of transparent exopolymer particles (TEP). Deep-Sea Res. II. 42: 203-214.
Longhurst, A. R., and Harrison, G.W. (1989). The biological pump: Profiles of plankton
production and consumption in the upper ocean. Prog. Oceanogr. 22: 47-123.
Long, R., and Azam, F. (2001) Antagonistic interactions among marine pelagic bacteria. Appl. Environ. Microbiol. 67: 4975-4983.
Martin, J.H., Knauer, G.A., Karl, D.M., and Broenkow, W.W. (1987) VERTEX: Carbon
cycling in the Northeast Pacific. Deep-Sea Res. I 34: 267-285.
Martinez-Garcia, S., Karl, D.M. (2015). Microbial respiration in the euphotic zone at Station ALOHA. Limnol. Oceanogr. 60: 1039-1050.
McCave, I.N. (1975). Vertical flux of particles in the ocean. Deep-Sea Res. 22: 491-502.
McDonnell, A.M.P., and Buesseler, K.O. (2010). Variability in the average sinking
velocity of marine particles. Limnol. Oceanogr. 55(5): 2085-2096. doi: 10.4319/Lo.2010.55.5.2085.
Mestre, M., Borull, E., Sala, M.M., and Gasol, J.M. (2017). Patterns of bacterial diversity in the marine planktonic particulate matter continuum. ISME J. 11: 999-1010. doi:10.1038/ismej.2016.166.
Middelburg, J.J. (2011). Chemoautotrophy in the ocean. Geophys. Res. Lett. 38. DOI:
10.1029/2011GL049725.

70
Orsi, W.D., Smith, J.M., Wilcox, H.M., Swalwell, J.E., Carini, P., Worden, A.Z., and
Santoro, A.E. (2015). Ecophysiology of uncultivated marine euryarchaea is linked to particulate organic matter. ISME J. 9: 1747-1763.
Ortega-Retuerta, E., Joux, F., Jeffrey, W.H., and Ghiglione, J.F. (2013). Spatial variability of particle-attached and free-living bacterial diversity in surface waters from the Mackenzie River to the Beaufort Sea (Canadian Arctic). Biogeosciences 10: 2747–2759. doi: 10.5194/bg-10-2747-2013.
Overbeck, J., and Daley, R. J. (1973). Modern methods in the study of microbial
ecology. Bulletins from the Ecological Research Committee/NFR. No. 17:342-344.
Palovaara, J., Akram N., Baltar, F., Bunse, C., Forsberg, J., Pedros-Alio, C., Gonzalez, J.M.,
and Pinhassi, J. (2014). Stimulation of growth by proteorhodopsin phototrophy involves regulation of central metabolic pathways in marine planktonic bacteria. Proc. Nat. Acad. Sci. USA. 111: E3650-8. doi: 10.1073/pnas.1402617111.
Passow, U., and Alldredge, A.L. (1994). Distribtion, size and bacterial colonization of
transparent expolymer particles (TEP) in the ocean. Mar. Ecol. Prog. Ser 113.: 185-198.
Parada, A.E., Needham, D.M., and Fuhrman, J.A. 2016. Every base matters: assessing small
subunit rRNA primers for marine microbiomes with mock communities, time series and global field samples. Environ. Microbiol. 18: 1403-1414.
Peterson, M.L., Wakeham, S.G., Lee, C., Askea, M.A., and Miquel, J.C. (2005). Novel techniques for collection of sinking particles in the ocean and determining their settling rates. Limnol. Oceanogr.: Methods 3: 520-532.
Paerl, H.W., Moisander, P.H., Zehr, J.P. (2008). Effects of inorganic nitrogen on taxa-specific
cyanobacterial growth and nifH expression in a subtropical estuary. Limnol. Oceanogr. 53 (6): 2519-2532.
Pelve, E., Fontanez, K.M., and DeLong, E.F. (2017). Bacterial succession on sinking particles in
the ocean’s interior. Front. Microbiol. doi: https://doi.org/10.3389/fmicb.2017.02269 Ploug, H., and Grossart, G.P. (2000). Bacterial growth and grazing on diatom
aggregates: Respiratory carbon turnover as a function of aggregate size and sinking velocity. Limnol. Oceanogr. 45:1467-1475.
Richardson, T.L., and Jackson, G.A. (2007). Small phytoplankton and carbon export from the surface ocean. Science 315: 838-840. Rieck, A., Herlemann, D.P.R., Jurgens, K., and Grossart, H.P. (2015). Particle-
associated differ from free-living bacteria in surface waters of the Baltic Sea. Front. Microbiol. 6: 1297.

71
Romanenko, V. I., Overbeck, J., Sorokin, Y. I. (1972). Estimation of production of heterotrophic bacteria using 14C. In: Sorokin, Y. I., Kadota, H. (eds.) Techniques for the assessment of microbial production and decomposition in fresh water. IBP Handbook No. 23. Blackwell, Oxford, pp. 82-85.
Sarmiento, J.L., Herbert, T.D., and Toggweiler, J.R. (1988). Causes of anoxia in the world ocean. Glob. Biogeochem. Cycles 2: 115-128. Shanks, A.L., and Trent, J.D. (1979) Marine snow-microscale nutrient patches. Limnol.
Oceanogr. 24: 850-854. Simon, M., and Azam, F. (1992). Protein content and protein synthesis rates of planktonic marine bacteria. Mar. Ecol. Prog. Ser. 51: 201-213. Smith, D.C., Simon, M., Alldredge, A.L., and Azam, F. (1992). Intense hydrolytic enzyme
activity on marine aggregates and implications for rapid particle dissolution. Nature 359: 139-142.
Smith M. W., Zeigler Allen L., Allen A. E., Herfort L., and Simon H. M. (2013). Contrasting
genomic properties of free-living and particle-attached microbial assemblages within a coastal ecosystem. Front. Microbiol. 4:120. 10.3389/fmicb.2013.00120
Steeman-Nielsen, E. 1952. The use of radioactive carbon (14C) for measuring organic
production in the sea. J. du Conseil 18, 117-140. Steinberg, D.K., Van Mooy, B.A.S., Buesseler, K.O., Boyd, P.W., Kobari, T., and Karl, D.M.
(2008). Bacterial vs. zooplankton control of sinking particle flux in the ocean’s twilight zone. Limnol. Oceanogr. 53: 1327-1338. doi: 10.4319/lo.2008.53.4.1327.
Sverdrup, H.U., Johnson, M.W., and Fleming, R.H. (1946). The Oceans. Prentice-Hall,
Englewood Cliffs, N.J., 1087 pp. Swan, B.K., Martinez-Garcia, M., Preston, C.M., Sczyrba, A., Woke, T., Lamy, D., Reinthaler,
T., Poulton, N.J., Masland, E.D., Gomez, M.L., Sieracki, M.E., DeLong, E.F., Herald, G.J., Stepanauskas, R. (2011). Potential for chemolithoautotrophy among ubiquitous bacteria lineages in the dark ocean. Science 333: 296-300. doi: 10.1126/science.1203690.
Teske, A., Durbin, A., Ziervogel, K., Cox, C., Arnosti, C. (2011). Microbial community
composition and function in permanently cold seawater and sediments from an arctic fjord of Svalbard. Appl. Environ. Microbio. 77: 2008-18. doi: 10.1128/AEM.01507-10.
Trull, T., and Ebersbach, F. (2008). Sinking particle properties from polyacrylamide gels
during the Kerguelen Ocean and Plateau compared Study (KEOPS): Zooplankton control of carbon export in an area of persistent natural iron inputs in the Southern Ocean. Limnol. Oceanogr. 53: 212-224.
Viviani, D.A., and Church, M.J. (2017). Decoupling between bacterial production and
72
primary production over multiple time scales in the North Pacific. Deep-Sea Res. I 121: 132-142.
Walters, W., Hyde, E.R., Berg-Lyons, D., Ackermann, G., Humphrey, G., Parada, A.,
Gilbert, J.A., Jansson, J.K., Caporaso, J.G., Fuhrman, J.A., Apprill, A., and Knight, R. (2016). Improved bacterial 16S rRNA gene (V4 and V4-5) and fungal internal transcribed spacer marker gene primers for microbial community surveys. mSystems 1. doi:10.1128/mSystems.00009-15.
White, A.E., Letelier, R.M., Whitmire, A.L., Barone, B., Bidigare, R.R., Church, M.J., and Karl, D.M. (2015). Phenology of particle size distribution and primary productivity in the North Pacific Subtropical Gyre. J. Geophys. Res. Oceans 120: 7381-7399.
Williams, P.J.B., Morris, P.J., and Karl, D.M. (2004). Net community production and
metabolic balance at the oligotrophic ocean site, station ALOHA. Deep-Sea Res. I 51:1563-1578.
Wilson, S.E., Steinberg, D.K., and Buesseler, K.O. (2008). Changes in fecal pellet characteristics with depth as indicators of zooplankton repackaging of particles in the mesopelagic zone of the subtropical and subarctic North Pacific Ocean. Deep-Sea. Res. II 55: 1636-1647.
Yakimov, M.M., La Cono, V., Smedile, F., Crisafi, F., Arcadi E., Leonardi, M., Decembrini, F., Catalfamo, M., Bargiela, R., Ferrer, M., Golyshin, P.N., and Giuliano, L., (2014). Heterotrophic bicarbonate assimilation is the main process of de novo organic carbon synthesis in hadal zone of the Helennic Trench, the deepest part of Mediterranean Sea. Environ. Microbiol. Rep 6: 709-722.