Quantifying the actual benefits of large scale seawater desalination
19
Quantifying the actual benefits of large scale seawater desalination in Israel A. Tenne*, D. Hoffman** and E. Levi** * Israel Water Authority **ADAN Technical & Economic Services Ltd. Abstract Israel's master plan for integrating large-scale seawater desalination plants within the national water supply system, which was prepared in 1997, sought not only to minimize the costs of these additional water sources, inter alia through plant siting, economies of scale and maximizing utilization of existing infrastructures, but also to maximize their benefits. Some of the benefits, particularly those resulting from higher product water quality requirements, justified, on a cost-benefit ratio basis, corresponding slight increases in desalinated water production costs. Today, at the end of 2011, desalinated seawater is being supplied continuously and reliably into the national and regional water grids from three large plants, Ashkelon, Palmachim and Hadera, at a rate of about 300 million m 3 /year. This quantity represents about 42% of all current potable water inputs into these grids (other inputs are groundwater and Sea of Galilee water). In three years, by the end of 2014, two additional large plants, at Soreq A and Ashdod, and an expanded Palmachim plant will be producing an additional 300 million m 3 /year. The paper revisits the benefits foreseen in the original desalination master plan, quantifies them on the basis of actual data accumulated over the past year and some new studies on the economic effects of water shortages and water supply quality, compares them with past expectations, and projects them to 2014, when about 80% of grid supplied water will be desalinated seawater. 1. Introduction About a hundred years ago, Oscar Wilde coined the definition of a person "who knows the price of everything, but the value of nothing". He most certainly was not referring to any engineer who is accustomed to preparing techno-economic evaluations of engineering projects. Such a professional, today, would be cognizant of and utilize not only Good Engineering Practice and cost accounting, but also Value Engineering and cost-benefit analyses. If the project would be a national-scale utility project, his planning and evaluation would include also consideration of socio-political benefits and environmental impacts. These considerations, as they related to the Desalination Master Plan ("DMP") prepared by ADAN Technical & Economic Services Ltd. ("ADAN") for the Israel Water Authority's ("IWA") Desalination Department in 1997, and, specifically, to the capacity, location and product water quality of the three
Transcript of Quantifying the actual benefits of large scale seawater desalination

Quantifying the actual benefits of large scale seawater desalination in Israel
A. Tenne*, D. Hoffman** and E. Levi**
* Israel Water Authority **ADAN Technical & Economic Services Ltd.
Abstract
Israel's master plan for integrating large-scale seawater desalination plants within the national water supply system, which was prepared in 1997, sought not only to minimize the costs of these additional water sources, inter alia through plant siting, economies of scale and maximizing utilization of existing infrastructures, but also to maximize their benefits. Some of the benefits, particularly those resulting from higher product water quality requirements, justified, on a cost-benefit ratio basis, corresponding slight increases in desalinated water production costs. Today, at the end of 2011, desalinated seawater is being supplied continuously and reliably into the national and regional water grids from three large plants, Ashkelon, Palmachim and Hadera, at a rate of about 300 million m3/year. This quantity represents about 42% of all current potable water inputs into these grids (other inputs are groundwater and Sea of Galilee water). In three years, by the end of 2014, two additional large plants, at Soreq A and Ashdod, and an expanded Palmachim plant will be producing an additional 300 million m3/year. The paper revisits the benefits foreseen in the original desalination master plan, quantifies them on the basis of actual data accumulated over the past year and some new studies on the economic effects of water shortages and water supply quality, compares them with past expectations, and projects them to 2014, when about 80% of grid supplied water will be desalinated seawater.
1. Introduction
About a hundred years ago, Oscar Wilde coined the definition of a person "who knows the price of everything, but the value of nothing". He most certainly was not referring to any engineer who is accustomed to preparing techno-economic evaluations of engineering projects. Such a professional, today, would be cognizant of and utilize not only Good Engineering Practice and cost accounting, but also Value Engineering and cost-benefit analyses. If the project would be a national-scale utility project, his planning and evaluation would include also consideration of socio-political benefits and environmental impacts. These considerations, as they related to the Desalination Master Plan ("DMP") prepared by ADAN Technical & Economic Services Ltd. ("ADAN") for the Israel Water Authority's ("IWA") Desalination Department in 1997, and, specifically, to the capacity, location and product water quality of the three

- 2 - large-scale seawater desalination plants currently operating in Israel, Ashkelon, Palmachim and Hadera, as well as the two plants currently under construction, Soreq A and Ashdod, and the two plants which are foreseen to be installed by 2020, Western Galilee and Soreq B, were presented and discussed previously, in the 2007 EDS conference in Haldiki, Greece. [1] The costs analyses were driven by the wish to minimize total investments, which included not only the investments in the plants themselves, through economies of scale and utilization of existing infrastructures, but also in the investments in the downstream infrastructures that would be required to continuously absorb the desalinated water, i.e. store and deliver it to the regional and/or national water system in a manner that will allow the plants to operate at the highest possible annual utilization factor (thereby maximizing annual production and minimizing the capital recovery component of the desalinated water cost). The benefits analyses were driven by the wish to maximize the value of the benefits which would be derived from the desalinated water, both quantity-wise and quality-wise. Quantity-wise, the introduction of the new sources of desalinated water into the national water grid was expected to:
• increase the reliability of the water supply to all consumer sectors; • avoid curtailing economic activities due to water shortages, thereby
increasing GDP; • enable reducing water withdrawals from the country's overdrawn
natural storage bodies of potable water, the Sea of Galilee and the two main aquifers, to avoid their further degradation by saline water intrusion (some of it irreversibly) and, eventually, raising their levels to hydrologically safe values. (It should be remembered also that each m3 of potable water consumed by domestic and industrial consumers generates also 0.6-0.7 m3 of wastewater, which in Israel is treated and reused, mostly for agricultural and landscaping irrigation.)
Quality-wise, the blending of the high-quality desalinated water with lower- grade natural water within the water supply system, and the direction of the blend, preferentially, to the users who stand to gain most from improvements in their water supply quality - households and industry - were expected to:
• reduce water supply hardness, thereby a) lowering scaling rates of
domestic and industrial water heaters, equipment, appliances and piping, b) reducing the consumption of detergents and scale-cleaning chemicals, and c) improving the quality of laundering and dishwashing;

- 3 -
• lower the chloride and sodium concentrations in the reused municipal wastewater, thereby a) reducing required irrigation rates, b) improving crop productivity and c) reducing soil damage.
In fact, the issue of what is the optimal desalinated water quality that should be mandated and/or promoted through incentives to the desalination plant owners and operators, and the costs associated with deriving this quality, compared to the costs for deriving water that just meets minimal drinking water quality requirements, were examined thoroughly by the IWA and its consultants, ADAN. [1] [2] [3] The objective of this paper is to revisit the Desalination Master Plan's expected benefits and compare them with the current, actual benefits, on the basis of data accumulated over the past year and new in depth calculations of the effects of water shortage and water supply quality performed within a recent study by one of the authors [4], as well as with the benefits projected for 2014, when the expanded Palmachim, Soreq A and Ashdod plants will come on line. Whereas these figures may be applicable only to Israel's specific water supply system, which is fed by groundwater that is extremely hard and is becoming increasingly saline and polluted due to agricultural and industrial activity over the main aquifers, they may be relevant also to other regional and/or national integrated water systems which plan to install large-scale seawater desalination plants. We understand that the groundwater in our neighbor, Jordan, which is contemplating now the implementation of its own large-scale seawater desalination program, is also extremely hard and saline. Also, since the imposition of stricter water quality requirements by the IWA was contested by some experts in Israel, who preferred to minimize water costs and ignore water quality benefits, it is hoped that the figures in this paper will satisfy these critics.
2. Desalination Master Plan Expectations
The quantification of the benefits to be accrued from the introduction of desalinated seawater into the national water grid within the original Desalination Master Plan assumed that the amounts and quality of this input would be sufficient to a) completely close the gap between supply and demand, b) soften all the water supplied to domestic and industrial consumers and c) reduce chloride and sodium concentrations in the treated municipal wastewater that is reused for irrigation to acceptable levels. As we shall see in the following Section 3, currently, with the Ashkelon, Palmachim and Hadera plants online, supplying about only 42% of the potable water inputs to the national grid, or about 21% of total potable water

- 4 -
supply throughout the country, all the quality related benefits have not yet been achieved. However, as shown in Section 4, by 2014, when about 80% of the water supplied by the national grid will be desalinated seawater, these benefits, as foreseen in the DMP, will be approached. Added capacity benefits The benefits from closing the gap between supply and demand with desalinated seawater were estimated in the DMP on the basis of the incomes generated by the least profitable economic activity that was not curtailed due to water shortages. The least profitable water consuming economic activity was agriculture, and, within agriculture, the least profitable crops. [1] [2] The estimated benefit, which was about 0.45 NIS/m3, or about 12 US¢/m3 (at 3.7 NIS = 1 US$), was deemed conservative, since it was based on historic agricultural water usage figures. Due to increased irrigation efficiency, i.e. lower water usage per irrigated area, and the shift to higher value crops, it was assumed that the benefit will be at least double the above figure, or about 0.90 NIS/m3 or 24 US¢/m3. As noted in Section 3 below, after the DMP was prepared, additional, in depth studies were made, to quantify the economic effects of curtailing water to Israeli agriculture. These showed that the benefits to the farmers and the national economy from the increased availability of water, due to large scale seawater desalination, will be even higher. [5] [6] Water quality benefits To understand the importance of these benefits, it should be explained that the average hardness of the natural water supplied through the Israeli national grid prior to the introduction of desalinated water was 250-350 ppm as CaCO3. Normally, water is classified as "soft" when its hardness is below 60 ppm as CaCO3, as "moderately hard" when its hardness is 61-120 ppm as CaCO3, as "hard" when its hardness is 121-180 ppm as CaCO3, and as "very hard" when its hardness is above 181 ppm as CaCO3. With water supplies ranging typically between 250 and 350 ppm as CaCO3, and in some population centers, during certain periods of the year, exceeding even 600 ppm as CaCO3, all the known problems associated with such extremely hard water have been experienced by Israeli households and industry. Israeli industry solved this problem, at a cost, by softening as much as 30% of its water consumption, initially through ion exchangers and, today (due to the Ministry of Environmental Protection's prohibition on disposing ion

- 5 - exchangers' spent regeneration solutions to the sewers), through industrial-scale reverse osmosis plants. The households, however, have suffered greatly from the scaling of their water heaters and piping (see Figures 1 and 2 for typical damage to these) and from higher consumption of detergents. Many households use, also at a cost, small commercially-available softeners for the water used for drinking, cooking, dishwashers and laundry machines, but their water heaters, both solar and electric driven, must be replaced periodically.
Figure 1 – a scaled domestic electric water heater element
Figure 2 – a scaled household water pipe
Some magnitude of the related costs can be obtained when we consider that the average lifetime of a solar water heater panel in Israel, due to its scaling up, is about six years. According to the claims of the heaters' manufacturers, where soft water is heated (for example in some European countries) their lifetime expectancy is 15 years. About 110,000 solar water heaters are replaced each year in Israel, at a cost of about NIS 2,000 per heating panel, i.e. a total annual expenditure of NIS 220 million (about US$ 60 million). Extending the lifetime of the panels by even six more years, by softening the water supplied to Israeli households would half this expenditure. All in all, the benefits foreseen within the DMP for reducing the hardness of water supplies to domestic and industrial consumers were 0.17-0.50 NIS/m3, or 5-15 US¢/m3 of desalinated water, depending on local water hardness and the desalinated water to natural water blend ratio.

- 6 - It is interesting to note that the magnitude of the benefits to municipal consumers from the softening of their water supply, as perceived in the USA, is much higher. According to a study published by the US Bureau of Reclamation, the costs of water softening, through nanofiltration (NF) plants, in some US cities and towns (mostly in Florida) ranged, depending on plant size, between 40 and 50 US¢/m3, or about 1.5-1.85 NIS/m3. In some of these cities and town there were other benefits, such as the removal of color, trihalomethanes (THM) and other contaminants, but the fact is that these cities and towns were ready to pay such sums for softening their water. [7] To maximize the benefits from softening the Israeli water supplies, the desalinated seawater would have to be preferentially blended with the water supplied specifically to domestic and industrial consumers. This will lower also the water's chloride and sodium concentrations, since their concentrations in the desalinated water (as mandated and encouraged through price incentives by the IWA) is extremely low (see Table 3 and Section 3). As a result, the chloride and sodium concentrations in the wastewater generated by the households and industry will be correspondingly lower. It is this wastewater, after suitable treatment (tertiary treatment and even Soil-Aquifer Treatment, SAT), which is being reused by agriculture. The benefits foreseen in the DMP for the agricultural sector from this higher quality wastewater, and, to the extent that desalinated water is also blended within potable water supplies that are used for irrigation, from the higher quality of this water, were valued at 0.08-0.18 NIS/m3, or 2-5 US¢/m3. Other benefits Other benefits foreseen in the DMP relate to energy cost savings: 1. Savings due to reduced pumping of Sea of Galilee water through the
National Carrier southward, to the main Israeli population centers. Most of Israel's main population centers are located along the Mediterranean coast, not far from the large seawater desalination plants' sites that were selected within the DMP (see Figure 3). These population centers were, specifically, the DMP's preferred destinations for the desalinated seawater. With most desalination plant capacity installed south of Hadera, the National Carrier was expected to become, from Hadera south, more a desalinated water carrier (over short distances to the population centers) than a Sea of Galilee water carrier.
2. Savings in pumping energy requirements due to lower pressure drops in all piping systems. Currently (as shown in Figure 2) household and industrial pipes' cross-section areas are reduced by scale formations on the inner surfaces, requiring higher supply pressures.
3. Savings in heating elements energy requirements. Today (as shown in Figure 1), unless softening devices are installed, the heating elements

- 7 -
of electric water heaters, dishwashers and laundry machines in Israeli households become insulated by thick scale, requiring longer heating times and larger energy inputs.
The energy cost savings from all the above were estimated in the DMP to be 0.15-0.25 NIS/m3, or 4-7 US¢/m3.
Figure 3 – Population centers and DMP planned seawater desalination plants
Population centers
Planned desalination plants
All in all, the DMP estimated the benefits to the national economy from all the large seawater desalination plants to average 0.85-1.50 NIS/m3, or 23-39 US¢/m3. With expected desalinated water costs ranging between 2.2 to 2.7 NIS/m3, or 55-75 US¢/m3, it was assumed that these benefits will reduce the impact of this higher cost new water source on the national economy by about 50%.
Hadera
Ashdod
Soreq
Ashkelon
National Water Carrier (NWC)
Sea of Galilee Haifa
Jerusalem
Tel Aviv
Gaza
Shomrat
Palmachim
Hadera
Netanya
Ashdod
Ashkelon
Acre
Nazareth
Herzeliya
Rishon Lezion
Rehovot
Krayot
Rishon Lezion
Petach Tiqva

- 8 -
3. Benefits to date
Added capacity benefits The need for and the importance of providing large additional quantities of water to the national water system are demonstrated clearly from the Israeli Hydrological Service's rainfall and stored water statistics for the past six years, 2005-1011. [8] These are summarized in Table 1.
Table 1 – Summary of rainfall and changes in water system stored capacity
Rainy
Season Year Rainfall as % of
multi-year average Water system's natural
storage recharge – million m
3
Change in water system stored capacity - million
m3
2005-2006 89 1,185 (142) 2006-2007 82 1,180 (217) 2007-2008 70 979 (372) 2008-2009 89 946 (209) 2009-2010 96 1,188 100 2010-2011 94 95 Ave/Total 87 1,095 (745)
The second column in Table 1 shows a 10-15% decrease in annual rainfall over the past six years, resulting (together with the effected water withdrawal rates) in a 745 million m3 drop in the national water system's stored capacity (mostly in the Sea of Galilee, but also in the Mountain Aquifer). As a result of this deficit, all the hydrological "Red Lines" (the minimal water levels, beyond which water quality is impaired) in the Sea of Galilee and the main aquifers are currently breached. The consequence is a continuous worsening of their water quality due to saline water intrusions from both the sea and inland brackish underground bodies of water and, due to the inland penetration of the Coastal Aquifer's interface with the Mediterranean Sea, also a loss of some of its storage capacity (the Coastal Aquifer serves as Israel's main multi-year storage capacity). The Israeli Hydrological Service weather and rainfall forecast models predict a continued decrease in precipitation, especially in the north of the country, estimated at another 10% over the next twenty years. [8] The contribution to date of the existing seawater desalination plants to reducing the gap between supply and demand and to the avoidance of an even further lowering of all the natural storage bodies' water levels is demonstrated in the figures supplied by the IWA's Regulation Division and shown in Table 2. [9]

- 9 -
Table 2 – Potable water consumption by consumer sectors and desalination plants' percentage of total supply
Year Potable water supply – million m
3 (% of total supply) Desalinated seawater
Domestic Industry Agriculture Total million m3 % of total supply
2005 715 (53%) 85 (6%) 548 (41%) 1,348 20 1.5 2006 737 (55%) 84 (6%) 519 (39%) 1,340 100 7.5 2007 767 (54%) 90 (6%) 551 (39%) 1,408 123 8.7 2008 759 (57%) 88 (6%) 491 (37%) 1,338 142 10.6 2009 684 (59%) 81 (7%) 403 (34%) 1,168 148 12.7 2010 689 (55%) 95 (7%) 476 (38%) 1.260 264 20.9 Total 797
It is seen that starting from 2009, the curtailment of allocations to the agricultural sector and an effective public relations campaign to save water, combined with a sharp increase in water prices to all sectors, reduced annual water consumptions by about 11% (from an annual average of about 1,360 million m3 to about 1,215 million m3). Domestic water consumption dropped by about 10% and agricultural sector consumption by about 16% (Note: part of this agricultural drop is due also to the increased availability and use of treated municipal wastewater – a total of 414 million m3 in 2010, up from 341 million m3 in 2005). Desalinated seawater contributed a growing share of this annual consumption – increasing from 7.5 % in 2006, when only the Ashkelon plant was functioning, to about 21 % in 2010, when all three plants were operated under instructions from the government's Water Desalination Administration (the "WDA") at their maximal outputs (Ashkelon - 117 million m3 , Palmachim – 42 million m3, and Hadera -105 million m3). Had it not been for the almost 800 million m3 of desalinated seawater introduced into the national water system, the drain on all natural water storage bodies would have increased to 1,545 million m3, leading to a further lowering of water levels and the breaching of their "black lines" (the minimal water levels, beyond which the damage to water quality is irreversible). In fact, as seen from the last column in Table 1, it was possible, due to these inputs, to reverse the trend over years 2005 to 2009, and, during the last two years on record, 2009-2011, to even increase the water system's stored capacity, i.e. raise the water levels. Nevertheless, even though increasing quantities of treated wastewater were made available to it, at preferential prices, agricultural activity was curtailed over the past six years due to water shortage. The economic consequences of these curtailed activities can be estimated from a study performed by the Hebrew University's Agricultural Faculty. [5] According to this study, the "shadow price" for Israeli agriculture of one m3 of water (defined as "the maximum price that management is willing to pay for

- 10 -
an extra unit of a given limited resource") is about 2.6 NIS/m3. However, this value is a bit high, since it pertains to the average of all agricultural crops grown in Israel. In fact, the crops that no doubt were affected by the curtailment of water allotments to farmers were, as assumed in the DMP and noted above in Section 2, those crops whose shadow prices are lowest, i.e. the value of the crop produced per m3 of water is lowest. Another study, conducted for the IWA by the University of Haifa and the Hebrew University in Jerusalem, provides a tool for identifying exactly which crops and which regions in the country (25 defined regions) would be affected by curtailments of supply to the agricultural sector. The study generated a model, based on production functions of yields for alternative crops (45 crops) as a function of water quantity and salinity, and examined the effects that the prices of each of the four types (and qualities) of water available to this sector - potable, high quality Soil Aquifer Treated (SAT) municipal wastewater, tertiary treated municipal wastewater and slightly brackish water – would have on their demand. It then ran several simulations for predicting agricultural activity, farmers' profitability and other variables, such as land usage and choice of irrigation systems, as a function of various prices and establishing their sensitivities. [6] The study showed that agricultural water use could and should be limited not by lower IWA allotments, but by reducing demand through pricing. Another study that is relevant to understanding the consequences of water shortages to agriculture showed that beyond a certain point (a lower allotment to agriculture) worse damage than loss of product would be suffered by farmers, due to the forced drying out of groves and orchards. This damage was calculated by the study to range from 3.64 NIS/m3 to 8.0 NIS/m3, and, obviously, this would be the range of prices that farmers would be ready to pay for water up to this minimal quantity. [10] To put things in proportion, the cost of desalinated seawater from the existing plants and those under construction, at the plants' battery limits, ranges between 2.17 NIS/m3 and 2.62 NIS/m3. The prices charged farmers for potable water today (January 2012), by Mekorot, the national water utility, are 2.08 NIS/m3 for their basic allotment, 2.38 NIS/m3 for a second allotment and 2.97 NIS/m3 for a third allotment. The prices charged for treated wastewater are 1.13 NIS/m3 for a basic allotment, 1.5 NIS/m3 for consuming an excess of 10%, and 2.24 NIS/m3 for consuming an excess above 10%. At this point it should be stressed that curtailment of agriculture in Israel, as in many other countries (which actually subsidize their farmers directly and/or indirectly for this same reason), is not only an economic issue. It is also a social, political and national security issue. It would go against Israel's long-term policy to disperse its population throughout its territory ("the periphery") and avoid excessive urban sprawl.

- 11 -
The value of maintaining this policy, by providing minimal allotments of water to Israel's farmers, though not quantified within the DMP, is nevertheless recognized and acknowledged. Water quality benefits Table 3 shows the contracted desalinated water quality in Israel's existing large seawater desalination plants and in those under construction.
Table 3 – Contracted seawater desalination plants' product water quality
Paramete
r Units Ashkelon Palmachim Hadera Soreq Ashdod
Capacity Million m
3/year
120 45 125 150 100
Chloride ppm 20> >80 20> 20> 20>
Boron ppm 0.4 0.4 0.3 0.3 0.3 TDS ppm 300 >450 >270 >300 >300 Hardness ppm >80 75 - 120 80 - 120 80 - 120 80 - 120 Alkalinity ppm -- -- 80> 80> 80> LSI -- -0.5 - 0.5 0 - 0.5 0 - 0.5 0 - 0.5 0 - 0.5 Turbidity NTU >0.5 >0.5 >0.5 >0.5 >0.5 pH -- 7.5 - 8.5 7.5 - 8.5 7.8 - 8.5 7.8 - 8.5 7.8 - 8.5
The actual quality of the product from all the operating plants has to date been better than these contracted limits. The low chloride concentrations are considerably below the Israeli Ministry of Health's upper limit for drinking water, which is 400 ppm. Actually, the low chloride concentrations were a byproduct of a much more difficult quality requirement – the limiting of boron concentrations to less than 0.4 ppm, initially, and, after new high boron rejection membranes were introduced by all the membrane manufacturers, to less than 0.3 ppm. These low boron concentrations are critical for allowing the use of the treated municipal wastewater for agricultural irrigation, since many crops are sensitive to boron concentrations above 0.7 ppm and municipal water use adds, mostly through detergents, about 0.4 ppm to the water supply's background concentration. To achieve such limits, all the large seawater desalination plants use a two-pass design, which reduces not only boron concentrations, but also chloride and sodium concentrations. The importance of the low chloride concentration to the national water system is made clear by the following Israel Hydrological Service (HIS) statistics [12]:
• The chloride concentration in the Coastal Aquifer, which, as noted above, serves as the main multi-year storage body and is one of Israel's main groundwater sources (35-40% of total groundwater

- 12 -
supply), has been increasing since the early 1960s at an average rate of about 2 ppm per year, reaching a level of 219 ppm in hydrological year 2008/9 (in some of its southern regions the rate has occasionally reached 3-9 ppm/year, and in one year a rate of 19 ppm/year was recorded).
• The cause of this increase in chloride concentration is the constant importation of chlorides into the aquifer. 75% of this import is a result of the irrigation of the agricultural land above the aquifer with higher salinity Sea of Galilee water and, lately, with growing amounts of even higher salinity treated municipal wastewater. The remaining 25% is caused by underground inflows from inland brackish water bodies and from the Mediterranean Sea, due to the lowering of Aquifer water level by over-pumping.
• About 123,000 tons of chloride entered the Coastal Aquifer from these sources in 2008/9, whereas only about 84,000 tons were exited (mostly through exporting water to the south, and a small amount through underground outflow to the sea). This resulted in a net addition of about 41,000 ton to the Aquifer's region.
• The good news is that it could take the chlorides introduced through irrigation up to tens of years to infiltrate the soil and reach the Aquifer's body of water. The bad news is that the current rate of increase in chloride concentration in the Aquifer is a result of much lower historic salt importation rates. The IHS sees the salt accumulated over the recent years, at higher salt importation rates, as a "time bomb" that eventually will salinize the Aquifer at a much more alarming rate.
With 300 million m3 of desalinated seawater introduced, additionally, into the national water system, which serves mostly the population centers over the Coastal Aquifer, each ppm of chloride within this desalinated water adds, potentially, 300 tons/year to this "time bomb". Had the IWA specified a desalination plants product quality of 250 ppm Cl max. (i.e. 150 ppm below the max concentration allowed by the Israeli Ministry of Health for drinking purposes), rather than the 20-80 ppm which it promoted (and achieved – see Table 3) through incentives, 51,000-69,000 tons of chloride would have been added each year. Even if the IWA would have demanded that the chloride concentration in the desalinated water would not exceed only 150 ppm, a level just sufficient (after the typical addition of 100-120 ppm of chloride by municipal water usage) to maintain the chloride concentrations in the treated wastewater destined for irrigation below of 250 ppm (the limit for sensitive crops such as citrus), an extra 21,000-39,000 tons/year would have reached the Aquifer. We estimate that the increase in desalinated water cost due to the lowering of boron, chloride and sodium levels is, on the average, for all plants, about 0.22 NIS/m3 or about 6 US¢/m3. The IWA believes that the long-term ability to

- 13 - reuse municipal wastewater for agricultural irrigation (the only other alternative would be to desalinate additional seawater or to curtail agricultural activities) and the protection of the Coastal Aquifer and other aquifers are well worth this cost. The desalination plants' product's 75-120 ppm (as CaCo3) hardness (as well as its alkalinity) is, of course, due to its addition, by dissolving limestone, within the post-treatment stage, to render the water non-aggressive. The DMP originally called for the blending of the product, within the plants' boundary limits, with typically hard natural water. This would have eliminated the need to purchase and import limestone. However, this concept did not materialize due to the unavailability of sufficient natural water sources near the plants, and the need to protect the piping connecting the plants to the National Carrier and to some consumers along the way to the interconnection points. Nevertheless, as can be seen in Table 4, the introduction of even this slightly hardened desalinated product, which is still "soft water" by any standard (see definition in Section 2), notably reduced water supply hardness downstream of the plants (the Sea of Galilee water data in Table 3 is given only as a reference). The reduction in water supplies hardness and chloride concentrations would have been more significant had it not been for the non-materialization of another DMP concept. As noted in Section 1, the original DMP intention was to direct the blend of natural and desalinated water preferentially to Israel's domestic and industrial consumers, who stood to gain the most from its lower salinity and hardness, and whose wastewater, mainly, after suitable treatment, would be reused for agricultural irrigation. In fact, however, since control of the blend of desalinated water and natural water, its ratio and destination, is in the hands of the national water utility, Mekorot, it was Mekorot's own considerations and priorities which prevailed. Mekorot owns and operates the National Carrier. It pumps water from the Sea of Galilee, filters it and delivers it downstream to the south, blending it along the way with groundwater from over 1,000 wells throughout the country, which it also owns. It supplies this blend to various municipalities, local water corporations, industrial and agricultural consumers. It turns out that, even after the infusion of large quantities of desalinated seawater, Mekorot has been (at least up to now) operating its water distribution network not with the objective of maximizing the benefits that its domestic and industrial clients will gain from this high quality water, as foreseen by the DMP, but with the sole objective of reducing its costs. [11]

- 14 -
Table 4 – Water supply quality before and after the introduction of desalinated seawater
Location Year Chloride Boron Hardness Alkalinity TDS
ppm ppm ppm as CaCO3 ppm as CaCO
3 ppm
Sea of Galilee 2005 238 0.05 244 109 587 2006 251 0.07 268 120 630 2008 258 0.12 264 120 610 2010 275 0.1 279 122 685
Beersheba 2005 225 0.17 279 161 660 2006 119 0.27 184 113 417 2008 111 0.23 153 106 407 2010 56 0.3 103 60 274
Kiryat Gat 2005 194 0.14 254 136 562 2006 83 0.27 181 108 334 2008 91 0.24 148 89 320 2010 69 0.33 132 76 309
Ashkelon 2005 151 0.15 209 122 471 2006 251 0.29 328 236 812 2008 41 0.24 95 64 211 2010 31 0.34 86 49 220
Jerusalem 2005 161 0.11 279 169 574 2006 157 0.18 323 261 642 2008 160 0.12 297 205 551 2010 121 0.15 280 212 492
Ness Ziona 2005 225 0.12 259 132 610 2006 192 0.19 353 229 676 2008 152 0.22 208 117 446 2010 121 0.29 162 88 355
Tel Aviv 2005 205 0.12 274 153 620 2006 221 0.08 281 142 624 2008 228 0.15 286 167 629 2010 167 0.22 221 137 485
Hadera 2005 180 0.09 278 169 550 2006 112 0.06 323 241 519 2008 175 0.09 301 196 548 2010 71 0.13 289 241 424
Haifa 2005 171 0.14 311 229 612 2006 188 0.16 325 230 634 2008 198 0.13 328 232 598 2010 187 0.20 306 220 569
Reducing costs to Mekorot means, mainly, utilization of Time of Use (TOU) electric power tariffs to minimize its pumping-energy expenditures. TOU tariffs in Israel today are such that during low power demand periods the cost of electricity is only 25-30% of its cost during peak demand periods and 53-61% of its cost during intermediate demand periods. The desalinated seawater and the natural water with which it is blended are, therefore, pumped by Mekorot to reservoirs during low demand hours, when the low power tariffs apply, and supplied to its consumers by gravity during peak and intermediate demand periods, when higher tariffs are in force. (In

- 15 - effect, this is a "pumped storage" scheme. The reservoirs are all at elevations high enough to supply the water downstream by gravity). (Incidentally, the Israeli desalination plant operators also take advantage of the TOU tariffs, pushing the plants' production to their peaks during low demand periods and reducing outputs during peak power demand periods. The savings that are derived by such an operating regime justify the additional investment in over-sizing the plants and providing suitable operational storage capacity to allow this.) As a result of Mekorot's cost-saving strategy, TOU schedules (seasonal and hourly) and reservoir capacities, and not DMP expectations, determine the blend and resultant water supply quality, and, more importantly, its destinations. Consequently, large quantities of desalinated water are supplied now also to the agricultural sector, and not preferentially to the cities and towns downstream of the desalination plants, as foreseen in the DMP. Nevertheless, ever since the currently operating desalination plants have come on line, farmers have seen quality improvement in their potable water supplies and, as demonstrated by the figures in Table 5, in their treated municipal wastewater allocations.
Table 5 – Chloride concentrations in treated municipal wastewater before and after the introduction of desalinated seawater - ppm
Wastewater treatment plant 2004 2005 2006 2008 2010
Hadera 332 268 295 301 257 Dan region 317 ---- 287 ---- 265 Ashkelon 278 298 251 257 ---- Kiryat Gat 394 345 209 197 ---- Shderot 534 364 284 285 ---- Beersheba West 411 335 237 378 ---- Arad 336 280 239 211 224 Dimona 431 342 216 197 ----
As noted earlier, all the quality-related benefits were quantified with greater precision than within the DMP in the new study performed by E. Levi [4]. More importantly, the values of the benefits were calculated in this study as a function of the percentages of desalinated water within the national water supply system. This enabled us to estimate them at the current level of desalinated water inputs, 300 million m3/year, as well as at various future levels. According to the study, current benefits add up to about 0.42 NIS/m3, or about 11 US¢/m3. As will be seen in the following section, within three years, when an additional 300 million m3/year of desalinated water will come online, this figure will increase by about 7%.

- 16 -
4. Projected Future Benefits
Added capacity benefits The gap between supply and demand that has existed for the past thirty years in Israel and resulted in overdrawn and degraded natural water sources, is expected to disappear by 2014, when 600 million m3/year of desalinated seawater will be supplied into the national water supply system. Any new economic activity that requires water and is capable of and ready to pay the real marginal cost of producing, through seawater desalination, its additional water consumption, will be able to have its demand satisfied. By 2020, when, according to the IWA's Master Plan from 2011, it is expected that 1 billion m3/year of desalinated seawater will be introduced into the water supply system, it should be possible to start replenishing the overdrawn natural water reservoirs, raising their levels to stop further deterioration of their quality, and even to reverse the degradation process and rehabilitate the natural water reservoirs. Water supply reliability will reach the DMP goal of at least 90%. Water quality benefits The current and projected improvements in water supply quality for the two largest population cities in Israel, Jerusalem and Tel Aviv, due to the infusion of high quality desalinated water, are shown in Figures 4 and 5. [4]
Figure 4 – Current and projected improvements in Jerusalem water supply quality due to the infusion of desalinated seawater
- 17 -
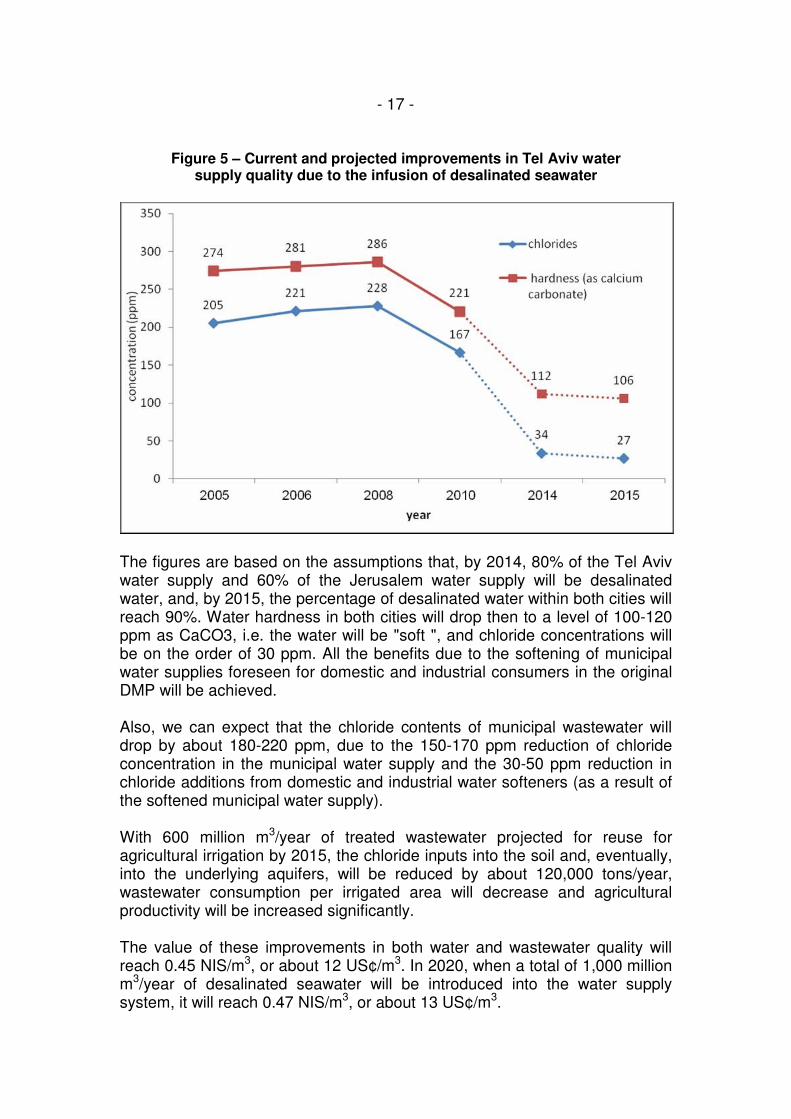
Figure 5 – Current and projected improvements in Tel Aviv water supply quality due to the infusion of desalinated seawater
The figures are based on the assumptions that, by 2014, 80% of the Tel Aviv water supply and 60% of the Jerusalem water supply will be desalinated water, and, by 2015, the percentage of desalinated water within both cities will reach 90%. Water hardness in both cities will drop then to a level of 100-120 ppm as CaCO3, i.e. the water will be "soft ", and chloride concentrations will be on the order of 30 ppm. All the benefits due to the softening of municipal water supplies foreseen for domestic and industrial consumers in the original DMP will be achieved. Also, we can expect that the chloride contents of municipal wastewater will drop by about 180-220 ppm, due to the 150-170 ppm reduction of chloride concentration in the municipal water supply and the 30-50 ppm reduction in chloride additions from domestic and industrial water softeners (as a result of the softened municipal water supply). With 600 million m3/year of treated wastewater projected for reuse for agricultural irrigation by 2015, the chloride inputs into the soil and, eventually, into the underlying aquifers, will be reduced by about 120,000 tons/year, wastewater consumption per irrigated area will decrease and agricultural productivity will be increased significantly. The value of these improvements in both water and wastewater quality will reach 0.45 NIS/m3, or about 12 US¢/m3. In 2020, when a total of 1,000 million m3/year of desalinated seawater will be introduced into the water supply system, it will reach 0.47 NIS/m3, or about 13 US¢/m3.

- 18 -
5. Conclusions The national economy as a whole and the domestic and industrial consumers of water in Israel are already benefiting from the large-scale infusion of high quality desalinated seawater, through increased economic activity and reduced water supply hardness. Similarly, the agricultural sector, which has largely converted from the use of potable natural water to the use of treated municipal wastewater, is benefiting from larger quantities of wastewater with lower concentrations of chloride and sodium. These benefits, which were foreseen in the Desalination Master Plan prepared for the Water Authority over ten years ago, have only partially materialized at this point. However, they will materialize fully within three years, when the new desalination plants capacity currently under construction will start operating. They will then be worth about 0.45 NIS/m3 or about 12 US¢/m3. To these we should add at least 0.90 NIS/m3 or 24 US¢/m3 due to increased water supply reliability, economic activities and GDP.
- 19 -
References
1. Y. Dreizin, A. Tenne, D. Hoffman, "Integrating large scale seawater desalination plants within Israel's water supply system", Desalination 220 (2008) 132-149.
2. Y. Dreizin, D. Hoffman, "Ashkelon seawater desalination project – off-taker's self costs, supplied water costs, total costs and benefits", Desalination 190 (2006) 104-116.
3. Daniel Hoffman, "Desalination and its Application in Israel", book sponsored and published by the Israel Water Authority, January 2011.
4. E. Levi, "The benefits of salinity and hardness reduction in the Israeli national water system as a result of the introduction of desalinated water", study performed in fulfillment of the requirements for a B.Sc. in biotechnology engineering at the ORT Braude College, Carmiel, January 2012.
5. E. Finerman, Y. Kopperberg and Eado Ken, Department of Agricultural Economics and Management, Faculty of Agriculture, Food and the Environment, the Hebrew University in Jerusalem, "Cost-benefit study of upgrading the quality of wastewater from the Ashkelon sewage treatment plant", May 2004
6. M. Shechter, I. Kan and M. Rappaport Rom, University of Haifa and the Hebrew University in Jerusalem, "Economic Programming Model Development for Analyzing, Evaluating and Consolidating Water Policy", February 2009.
7. US Bureau of Reclamation, "Survey of US Costs and Water Rates for Desalination and Water Softening Plants", Water Treatment technology Program Report No. 14, July 1997.
8. Dr. Amir Givati, Head of surface water and Hydrometeorology department, Israeli Hydrological Service, Israel Water Authority, personal communication. January 2012.
9. Sharon Nussbaum, Head of Suppliers Control and Information Department, Regulation Division, personal communication. January 2012.
10. Y. Danieli and d. Lavee, Pareto Group Ltd., "Report No. 5 – Pricing Wastewater", September 2002.
11. David Wiesenthal and Dan Weintraub, Water Resources Division, Mekorot Water Company, personal communication. October 2011.
12. Israel Hydrological Service Annual Report for hydrological year 2008/9.