Quantifying Social Success with Metrics
9
Metrics UGBA 198 Haas School of Business
-
Upload
tai-tran -
Category
Data & Analytics
-
view
1.457 -
download
3
Transcript of Quantifying Social Success with Metrics

MetricsUGBA 198
Haas School of Business
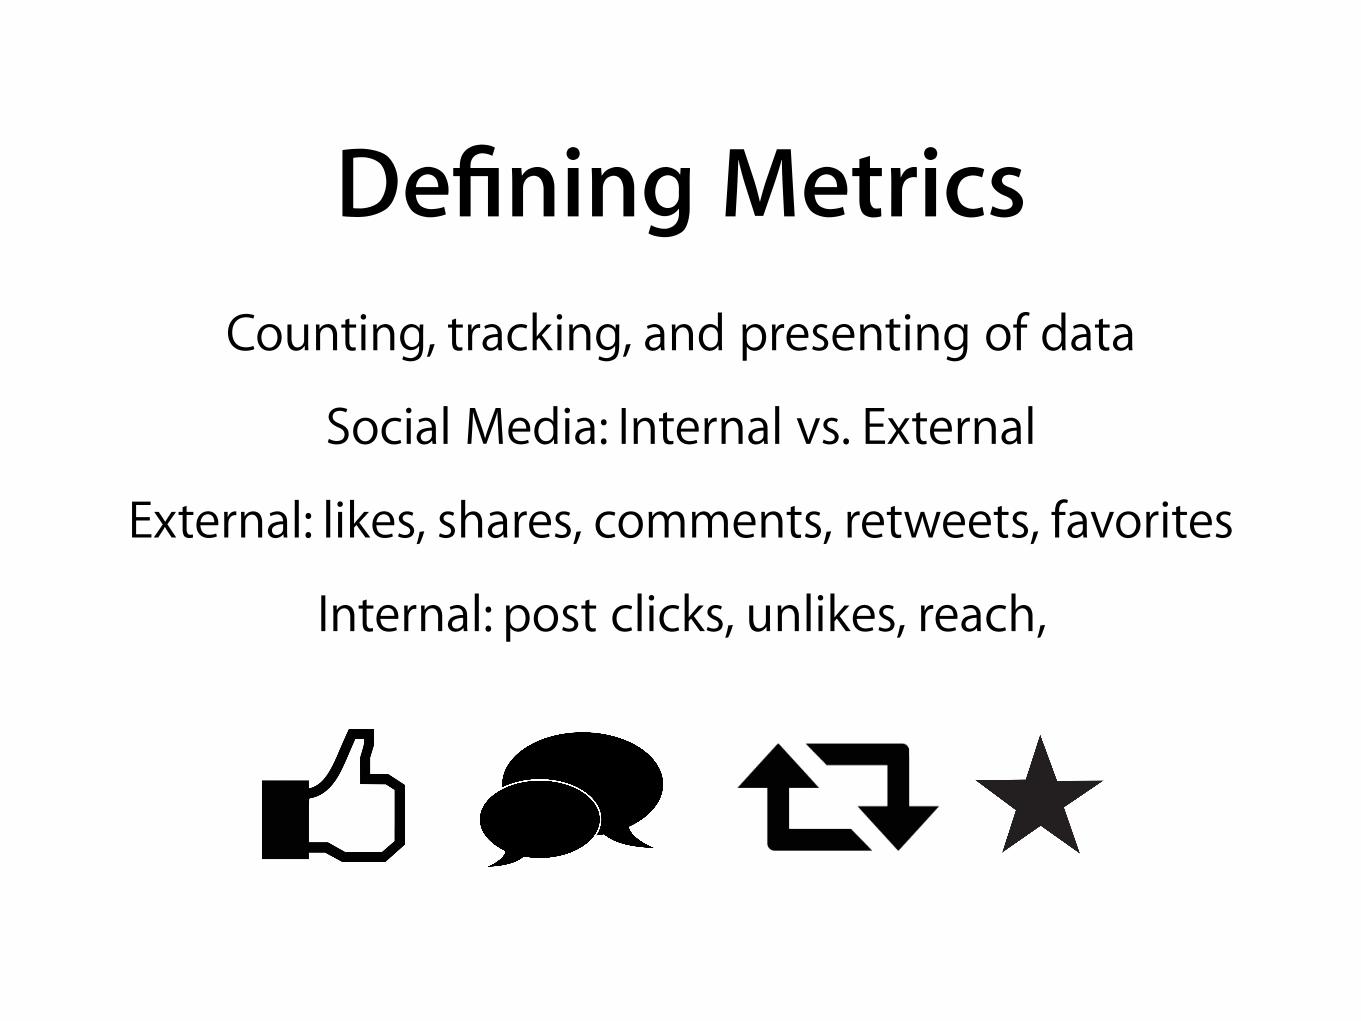
Counting, tracking, and presenting of data
Social Media: Internal vs. External
External: likes, shares, comments, retweets, favorites
Internal: post clicks, unlikes, reach,
Defining Metrics

Just raw numbers and data without strategy
Quantifying your success—return on investment (ROI)
Getting internal buy-in
Measuring relatively
Metrics Relevance

Competitive LandscapeIndustry
• Higher Education (UC Berkeley vs. Harvard) • Coffee (Starbucks vs. Peet’s Coffee) • Food (Chipotle vs. McDonalds)
Business Context
• B2B (Intel vs. Cisco) • B2C (Amazon vs. Wal-Mart) • B2E (Life@Google vs. Microsoft Careers)
• Lower (UCI, 60K likes) • Similar (UCLA, 400K likes) • Higher (Harvard, 4M likes)
• Start-up (1-2 employees) • SMB (2-5 employees) • Enterprise (10+ employees)
Followers Base
Org.Size
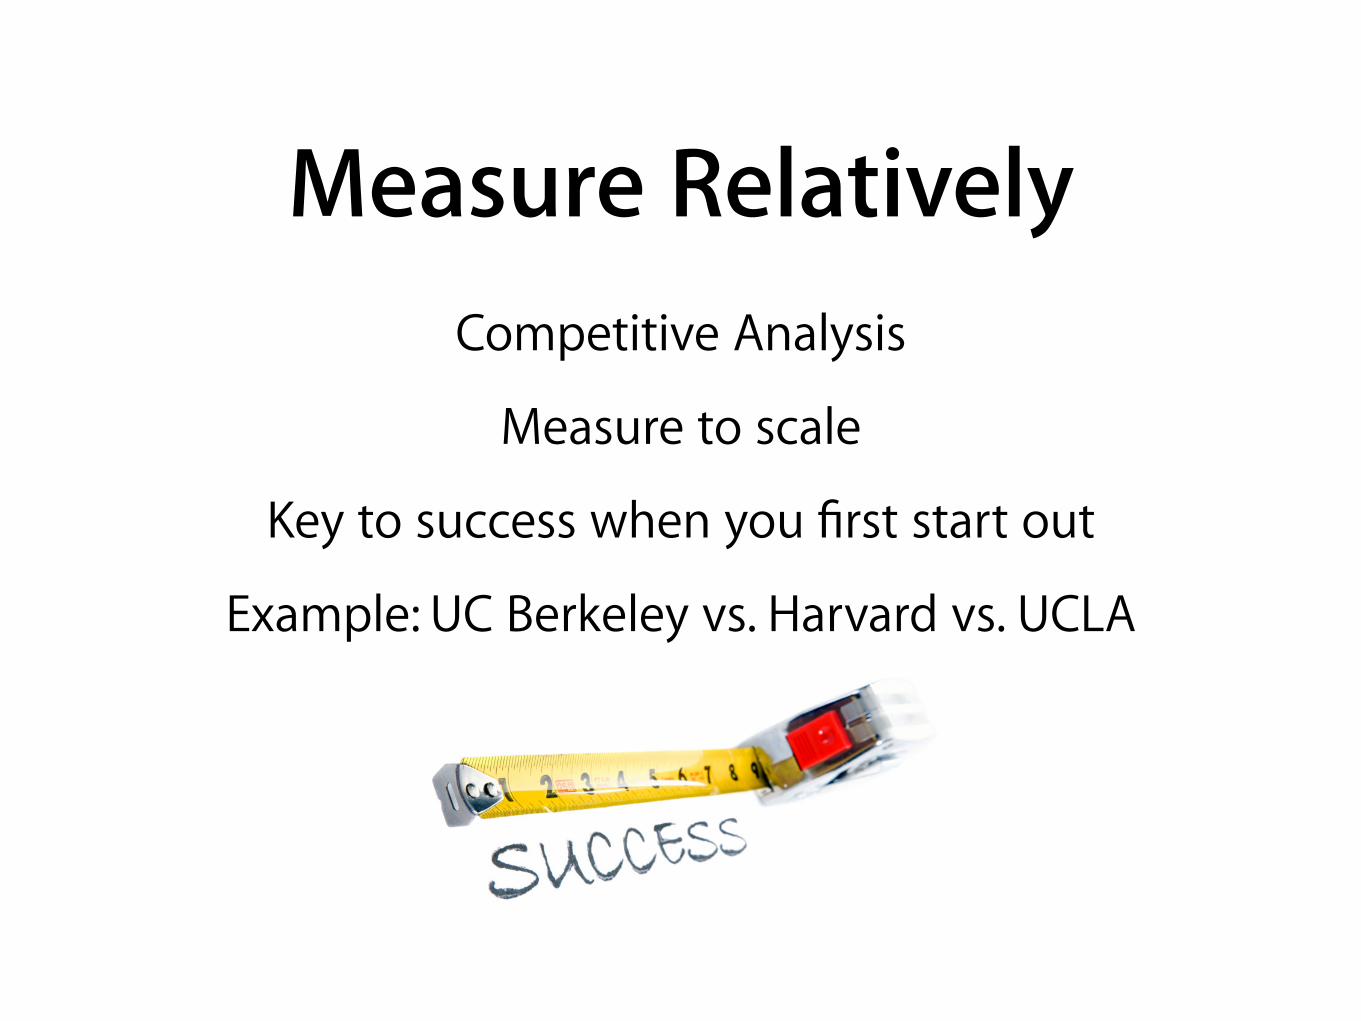
Competitive Analysis
Measure to scale
Key to success when you first start out
Example: UC Berkeley vs. Harvard vs. UCLA
Measure Relatively

Engagement Ratio
ER = People Talk About This / Total Likes
Growth Ratio
GR = Weekly New Page Likes / Total Likes
External Ratios
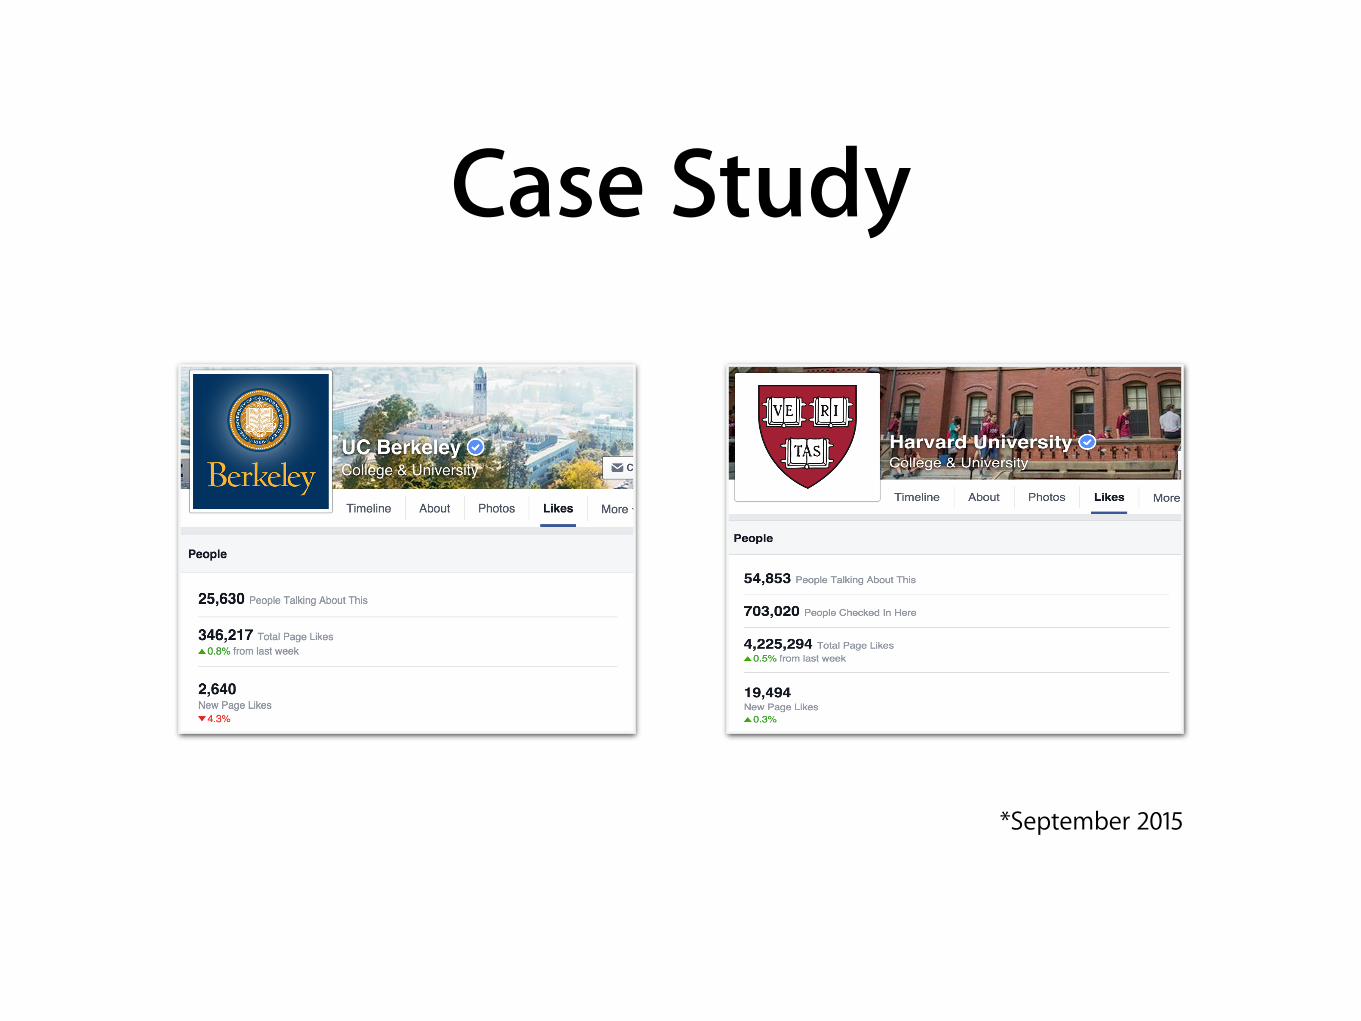
Case Study
*September 2015

UC Berkeley
UC Berkeley: 25,000 / 350,000 = 7.1%
Harvard
Harvard: 55,000 / 4,200,000 = 1.3%
CS: Engagement Ratio

UC Berkeley
UC Berkeley: 2,600 / 350,000 = 0.74%
Harvard
Harvard: 19,000 / 4,200,000 = 0.45%
CS: Growth Ratio


![Metrics for Success: Quantifying the Value of the Privacy Function [Webinar Slides]](https://static.fdocuments.us/doc/165x107/586fe3e41a28ab18428b8143/metrics-for-success-quantifying-the-value-of-the-privacy-function-webinar.jpg)