QUANTIFYING SHARED CORRIDOR WHEEL LOADING VARIATION … · 2018-02-27 · sets (IWSs), truck...
8
Proceedings of the 2013 Joint Rail Conference JRC2013 April 15-18, 2013, Knoxville, Tennessee, USA 1 Copyright © 2013 by ASME JRC2013-2404 QUANTIFYING SHARED CORRIDOR WHEEL LOADING VARIATION USING WHEEL IMPACT LOAD DETECTORS Brandon J. Van Dyk Univ. of Illinois at Urbana-Champaign Dept. of Civil and Environ. Engineering 205 N Mathews Ave, Urbana, IL 61801 [email protected] Marcus S. Dersch Univ. of Illinois at Urbana-Champaign Dept. of Civil and Environ. Engineering 205 N Mathews Ave, Urbana, IL 61801 [email protected] J. Riley Edwards Univ. of Illinois at Urbana-Champaign Dept. of Civil and Environ. Engineering 205 N Mathews Ave, Urbana, IL 61801 [email protected] Conrad Ruppert, Jr. Univ. of Illinois at Urbana-Champaign Dept. of Civil and Environ. Engineering 205 N Mathews Ave, Urbana, IL 61801 [email protected] Christopher P.L. Barkan Univ. of Illinois at Urbana-Champaign Dept. of Civil and Environ. Engineering 205 N Mathews Ave, Urbana, IL 61801 [email protected] ABSTRACT A sustained increase in heavy axle loads and cumulative freight tonnages, coupled with increased development of high speed passenger rail, is placing an increasing demand on railway infrastructure. Some of the most critical areas of the infrastructure in need of further research are track components used in high speed passenger, heavy haul, and shared infrastructure applications. In North America, many design guidelines for these systems use historical wheel loads that may not necessarily be representative of those seen on rail networks today. Without a clear understanding of the nature of these loads, it is impossible to adequately evaluate the superstructure to make design improvements. Therefore, researchers at the University of Illinois at Urbana-Champaign (UIUC) are conducting research to lay the groundwork for an improved and thorough understanding of the loading environment entering the track structure. Wheel impact load detectors (WILDs) have been used in North America for decades to identify bad-acting wheels that could damage the rail infrastructure or result in a rolling stock failure. The WILD measures vertical and lateral rail loads imparted by the wheel at the wheel-rail interface, along with other pertinent information related to the specific wheel, car, and train passing the instrumented site. This information can be used to identify and classify trends in the loading features and other characteristics of the rolling stock. These trends not only provide a clearer picture of the existing loading environment created by widely varied traffic characteristics, but can be used in future design and maintenance planning of infrastructure according to the anticipated traffic. This paper will discuss the current trends in wheel loads across the North American rail network while investigating the effects of speed on dynamic and impact loads. Ultimately this work should
Transcript of QUANTIFYING SHARED CORRIDOR WHEEL LOADING VARIATION … · 2018-02-27 · sets (IWSs), truck...

Proceedings of the 2013 Joint Rail Conference JRC2013
April 15-18, 2013, Knoxville, Tennessee, USA
1 Copyright © 2013 by ASME
JRC2013-2404
QUANTIFYING SHARED CORRIDOR WHEEL LOADING VARIATION USING
WHEEL IMPACT LOAD DETECTORS
Brandon J. Van Dyk
Univ. of Illinois at
Urbana-Champaign
Dept. of Civil and
Environ. Engineering
205 N Mathews Ave, Urbana, IL 61801
Marcus S. Dersch
Univ. of Illinois at
Urbana-Champaign
Dept. of Civil and
Environ. Engineering
205 N Mathews Ave, Urbana, IL 61801
J. Riley Edwards
Univ. of Illinois at
Urbana-Champaign
Dept. of Civil and
Environ. Engineering
205 N Mathews Ave, Urbana, IL 61801
Conrad Ruppert, Jr.
Univ. of Illinois at
Urbana-Champaign
Dept. of Civil and
Environ. Engineering
205 N Mathews Ave, Urbana, IL 61801
Christopher P.L. Barkan
Univ. of Illinois at
Urbana-Champaign
Dept. of Civil and
Environ. Engineering
205 N Mathews Ave, Urbana, IL 61801
ABSTRACT
A sustained increase in heavy axle loads and cumulative
freight tonnages, coupled with increased development of high
speed passenger rail, is placing an increasing demand on
railway infrastructure. Some of the most critical areas of the
infrastructure in need of further research are track components
used in high speed passenger, heavy haul, and shared
infrastructure applications. In North America, many design
guidelines for these systems use historical wheel loads that
may not necessarily be representative of those seen on rail
networks today. Without a clear understanding of the nature
of these loads, it is impossible to adequately evaluate the
superstructure to make design improvements. Therefore,
researchers at the University of Illinois at Urbana-Champaign
(UIUC) are conducting research to lay the groundwork for an
improved and thorough understanding of the loading
environment entering the track structure. Wheel impact load
detectors (WILDs) have been used in North America for
decades to identify bad-acting wheels that could damage the
rail infrastructure or result in a rolling stock failure. The
WILD measures vertical and lateral rail loads imparted by the
wheel at the wheel-rail interface, along with other pertinent
information related to the specific wheel, car, and train passing
the instrumented site. This information can be used to identify
and classify trends in the loading features and other
characteristics of the rolling stock. These trends not only
provide a clearer picture of the existing loading environment
created by widely varied traffic characteristics, but can be
used in future design and maintenance planning of
infrastructure according to the anticipated traffic. This paper
will discuss the current trends in wheel loads across the North
American rail network while investigating the effects of speed
on dynamic and impact loads. Ultimately this work should
2 Copyright © 2013 by ASME
lead to useful distinctions of loads for improved design
methodologies that are specific to the intended type of traffic
traversing a given route or network.
INTRODUCTION
Historically, elements of the track superstructure in North
America has been designed through a process that is generally
based on practical experience, without a clear or analytical
understanding of the loading environment causing particular
failure mechanisms. Improvements in the design of track
superstructure components may result in a more robust track
structure if the loading environment can be adequately
characterized.
The North American operating environment differs than
the operating practices found throughout much of the rest of
the world due to the prominence of rail freight transportation
and shared infrastructure between heavy haul freight and
intercity passenger traffic. One of the challenges created by
this operating environment is the design of critical
infrastructure components under such a widely varied loading
spectrum.
To best determine how to describe the loads entering the
track structure, one must explore possible causes of variation.
This paper will use data from WILDs to identify sources of
variation in the loading regime entering the track structure and
develop a framework for understanding trends between some
of the most critical parameters. Ultimately, these trends will
provide a better understanding of the loading environment,
laying the foundation for improved design and performance of
critical infrastructure components.
METHODOLOGIES AND MEASUREMENT TECHNOLOGIES
There are many different load quantification collection
systems, instrumentation strategies, and technologies available
to the rail industry, each serving a different purpose. For
example, the acoustic bearing detector records and evaluates
noise signatures to determine when stresses in wheel bearings
exceed a safe threshold (1). Specifically, instrumented wheel
sets (IWSs), truck performance detectors (TBDs), and wheel
impact load detectors (WILDs) monitor forces at the wheel-
rail interface. These methods have typically been used to
monitor rolling stock performance and assess wheel and
vehicle health. However, they can also be used to provide
insight into the magnitude and distribution of loads entering
the track structure. A clear understanding of this loading
spectrum provides a foundation for any analysis or design of
critical infrastructure components. Each wheel load
measurement technology is useful for different reasons and
can be utilized to answer specific questions related to loads
entering the track structure.
The IWS is a wheel set deployed on any type of vehicle
that measures the loads imparted by the car into the track
structure. Strain gauges on the axle and wheel provide
information related to vertical, lateral, and tangential forces
created by the wheel set, as well as the contact patch position
on the head of the rail. The IWS then produces high
frequency data with variable speed, track quality, curvature,
grade, special trackwork, and track stiffness. In the future,
UIUC will utilize IWS data from the Association of American
Railroads (AAR) and TTX Company to provide insight into
the effects of these parameters on forces experienced at the
wheel-rail interface.
A WILD consists of a series of strain gauges mounted on
the rail within the crib of the track structure to measure
vertical rail deflection. The site is over 50 feet in length, with
crossties at various spacings to capture a single wheel’s
rotation five times, recording peak (impact) forces, as well as
average forces (2). Using an algorithm that analyzes
variability along the site, these average, or nominal, forces are
distilled to obtain an estimate of static wheel load. While the
WILD has traditionally been used by infrastructure owners to
detect and identify bad-acting wheels, it has also been proven
to be a practical mechanism for producing reliable wheel data,
according to a study performed by the AAR in which they
reviewed the variation of measurements produced by the
detector (3).
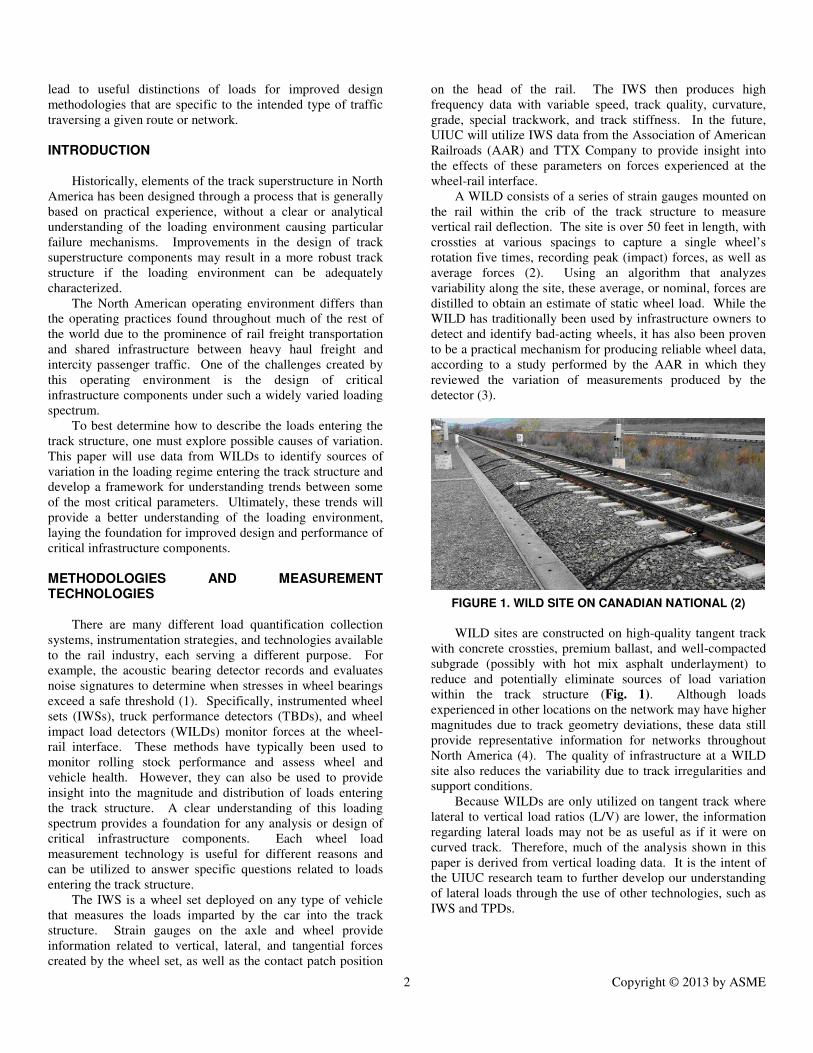
FIGURE 1. WILD SITE ON CANADIAN NATIONAL (2)
WILD sites are constructed on high-quality tangent track
with concrete crossties, premium ballast, and well-compacted
subgrade (possibly with hot mix asphalt underlayment) to
reduce and potentially eliminate sources of load variation
within the track structure (Fig. 1). Although loads
experienced in other locations on the network may have higher
magnitudes due to track geometry deviations, these data still
provide representative information for networks throughout
North America (4). The quality of infrastructure at a WILD
site also reduces the variability due to track irregularities and
support conditions.
Because WILDs are only utilized on tangent track where
lateral to vertical load ratios (L/V) are lower, the information
regarding lateral loads may not be as useful as if it were on
curved track. Therefore, much of the analysis shown in this
paper is derived from vertical loading data. It is the intent of
the UIUC research team to further develop our understanding
of lateral loads through the use of other technologies, such as
IWS and TPDs.

3 Copyright © 2013 by ASME
SHARED USE LOADING ENVIRONMENT IN NORTH AMERICA
The railroad operating and loading environment in North
America is different than much of the rest of the world. New
shared railway corridors are developing throughout the United
States as expanded and improved passenger rail service grows
alongside and within the existing freight network. Changes in
freight railroad infrastructure, rolling stock, and operating
practices have introduced many challenges involving
accommodation of passenger service while maintaining freight
service (5). One of these challenges is the design and
performance of critical infrastructure components. Because of
the diverging nature of the wheel loads and speeds on shared-
use infrastructure, designing components within the track
structure requires some significant analysis. Most design
decisions cannot be made without gaining a deeper, and
quantitative, understanding the entire load spectrum. To better
understand these loads applied to the infrastructure, UIUC has
acquired WILD data from sites throughout the United States
from both Amtrak’s Northeast Corridor (a shared corridor in
operation for many decades) and the Union Pacific Railroad
(UPRR). Figure A1, found the appendix, illustrates how
loads can vary on mixed-use lines, even within particular
vehicle types. Figure A2 shows the wide variation of loads
on a heavy haul freight line as well.
SOURCES OF LOAD VARIATION
Wheel loads imparted into the track structure on North
America’s rail network vary due to many causes, including
static load, speed, temperature, location, position within the
train, curvature, and grade. Because WILDs are constructed
on tangent track, and they are dispersed throughout the United
States, they are able to capture all of these sources of variation
except for curvature and grade.
FIGURE 2. EFFECT OF CAR TYPE ON PEAK LOAD ON
AMTRAK AT EDGEWOOD, MARYLAND (WILD DATA FROM NOVEMBER 2010)
The best indicator for the load expected to enter into the
track structure is the static wheel load. This value, as
expected, is highly dependent on the type of vehicle passing
over the WILD. Heavier vehicles produce higher peak wheel
loads, as shown in Fig. 2. Density contours are displayed to
show areas of high data concentration. As can be seen in Fig.
2, there are clearly other factors affecting the peak load
entering the track structure.
Field observations have suggested that loads at the wheel-
rail interface produced by moving loads are greater than those
produced by the same wheel loads at rest (6). Specifically,
dynamic loads can be produced by roll, slip, lurch, shock,
buff, torque, load transfer, vibration, and unequal distribution
of lading within the rolling stock (7). Generally, dynamic and
impact forces can be caused by imperfections in the moving
vehicles (as listed above), geometric track imperfections, and
variations in track stiffness (6). However, the relationship
between speed and total vertical load is not easily quantified
or characterized. As shown in Fig 3, the majority of the peak
vertical wheel loads exhibit only mild increases with increased
speed. This increase may simply be due to dynamic
interaction between the naturally vibrating vehicle and track
(8). However, the data do seem to confirm that, with
increased speed, the largest impacts become more severe.
FIGURE 3. EFFECT OF SPEED ON PEAK LOAD ON
AMTRAK AT EDGEWOOD, MARYLAND (PASSENGER WILD DATA FROM NOVEMBER 2010)
The location of the WILD site provides another very
significant source of variation. Each site sees different
distributions of car types and operating speeds. These varied
traffic characteristics often produce widely varied loads at the
wheel-rail interface. To illustrate this potential difference,
Fig. 4 compares freight traffic at Hook, PA with that at
Gothenburg, NE. For example, 53% of all wheels passing the
Hook WILD exceed 25 kips, whereas only 36% of all wheels
passing the Gothenburg WILD exceed 25 kips. Conversely,
8% of wheels passing the Hook WILD exceed 40 kips and
23% of wheels passing the Gothenburg WILD exceed 40 kips.
4 Copyright © 2013 by ASME
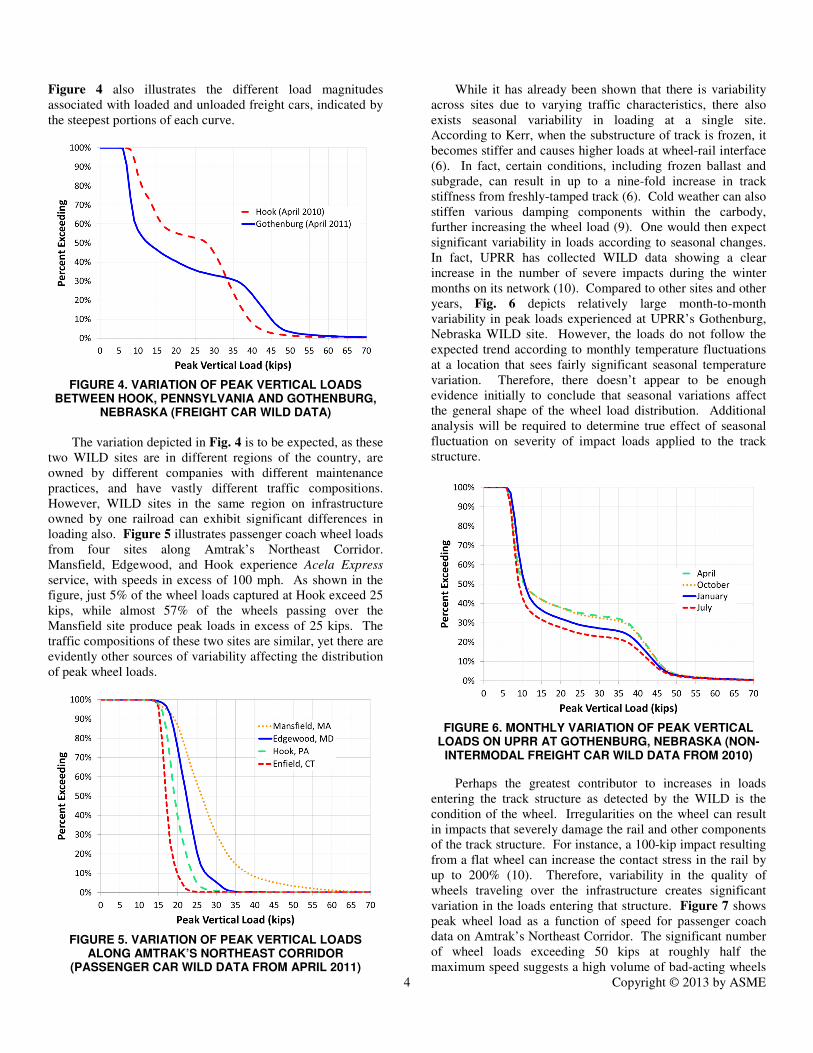
Figure 4 also illustrates the different load magnitudes
associated with loaded and unloaded freight cars, indicated by
the steepest portions of each curve.
FIGURE 4. VARIATION OF PEAK VERTICAL LOADS
BETWEEN HOOK, PENNSYLVANIA AND GOTHENBURG, NEBRASKA (FREIGHT CAR WILD DATA)
The variation depicted in Fig. 4 is to be expected, as these
two WILD sites are in different regions of the country, are
owned by different companies with different maintenance
practices, and have vastly different traffic compositions.
However, WILD sites in the same region on infrastructure
owned by one railroad can exhibit significant differences in
loading also. Figure 5 illustrates passenger coach wheel loads
from four sites along Amtrak’s Northeast Corridor.
Mansfield, Edgewood, and Hook experience Acela Express
service, with speeds in excess of 100 mph. As shown in the
figure, just 5% of the wheel loads captured at Hook exceed 25
kips, while almost 57% of the wheels passing over the
Mansfield site produce peak loads in excess of 25 kips. The
traffic compositions of these two sites are similar, yet there are
evidently other sources of variability affecting the distribution
of peak wheel loads.
FIGURE 5. VARIATION OF PEAK VERTICAL LOADS
ALONG AMTRAK’S NORTHEAST CORRIDOR (PASSENGER CAR WILD DATA FROM APRIL 2011)
While it has already been shown that there is variability
across sites due to varying traffic characteristics, there also
exists seasonal variability in loading at a single site.
According to Kerr, when the substructure of track is frozen, it
becomes stiffer and causes higher loads at wheel-rail interface
(6). In fact, certain conditions, including frozen ballast and
subgrade, can result in up to a nine-fold increase in track
stiffness from freshly-tamped track (6). Cold weather can also
stiffen various damping components within the carbody,
further increasing the wheel load (9). One would then expect
significant variability in loads according to seasonal changes.
In fact, UPRR has collected WILD data showing a clear
increase in the number of severe impacts during the winter
months on its network (10). Compared to other sites and other
years, Fig. 6 depicts relatively large month-to-month
variability in peak loads experienced at UPRR’s Gothenburg,
Nebraska WILD site. However, the loads do not follow the
expected trend according to monthly temperature fluctuations
at a location that sees fairly significant seasonal temperature
variation. Therefore, there doesn’t appear to be enough
evidence initially to conclude that seasonal variations affect
the general shape of the wheel load distribution. Additional
analysis will be required to determine true effect of seasonal
fluctuation on severity of impact loads applied to the track
structure.
FIGURE 6. MONTHLY VARIATION OF PEAK VERTICAL
LOADS ON UPRR AT GOTHENBURG, NEBRASKA (NON-INTERMODAL FREIGHT CAR WILD DATA FROM 2010)
Perhaps the greatest contributor to increases in loads
entering the track structure as detected by the WILD is the
condition of the wheel. Irregularities on the wheel can result
in impacts that severely damage the rail and other components
of the track structure. For instance, a 100-kip impact resulting
from a flat wheel can increase the contact stress in the rail by
up to 200% (10). Therefore, variability in the quality of
wheels traveling over the infrastructure creates significant
variation in the loads entering that structure. Figure 7 shows
peak wheel load as a function of speed for passenger coach
data on Amtrak’s Northeast Corridor. The significant number
of wheel loads exceeding 50 kips at roughly half the
maximum speed suggests a high volume of bad-acting wheels

5 Copyright © 2013 by ASME
travelling over this WILD site. These wheels, therefore, are
imparting loads up to six times their static load into the track
structure, potentially causing great damage to the rail and
other track components. The condition of these wheels may
contribute to the site-specific diversity as shown in Fig. 5.
FIGURE 7. EFFECT OF WHEEL CONDITION ON PEAK
LOAD ON AMTRAK AT MANSFIELD, MASSACHUSETTS (PASSENGER WILD DATA FROM NOVEMBER 2010)
Because the WILD is installed on high-quality tangent
track, the effect of wheel position within the truck, car, or train
may not be fully realized. In the future, the UIUC research
team will test this hypothesis using both WILD and IWS data
to determine what effect, if any, the axle’s position within the
rolling stock has on the loading environment.
The effect of curvature and grade are also not clear from
WILD data due to the detector’s characteristics. While
curvature significantly affects the lateral loads applied by the
wheel, the vertical loads entering the track structure will also
vary greatly. In the future, IWS data will also be used to
investigate the effects of curvature and grade.
CONCLUSIONS AND FUTURE WORK
The following conclusions can be drawn from preliminary
analysis of the data collected from Amtrak and UPRR WILD
sites:
• The WILD is a useful tool for collecting and
analyzing data entering the track structure
• Vehicle type and its associated static load provide a
baseline for the expected total load at the wheel-rail
interface
• Increasing speed mildly increases the most common
wheel loads; however, severe impact loads become
much more severe at higher speeds
• Traffic composition and other site-specific
parameters play a significant role in the distribution
of the loading environment
• Seasonal effects in load variation, while greatly
contributing to the magnitude of severe impacts,
minimally affect the majority of the wheel load
distribution
• Wheel condition is a significant factor in determining
expected loads entering the track structure
UIUC researchers will continue to analyze data provided
by their industry partners to better understand the loading
environment entering the track structure. Data collected by
IWSs and instrumentation developed by UIUC will provide
lateral and longitudinal loading insight in addition to the
vertical loads discussed in this paper.
In the future, some relationships discussed above will be
quantified using a statistically sophisticated mathematical
model. This model will potentially be used to quantitatively
describe the existing loading environment in North America.
It may also be used as a prediction tool for wheel load given
certain expected operating parameters (see Fig. 8).
FIGURE 8. PROPOSED PREDICTION MODEL FOR
EXPECTED PEAK VERTICAL WHEEL LOAD
The identification of loading variation sources, as well as
quantitative relationships developed using multiple data
collection methods will continue to paint a clearer picture of
the loading environment entering the track structure. Once
that picture is better understood, there exist opportunities for
improvements to design and, eventually, performance of
critical infrastructure components.
ACKNOWLEDGEMENTS
Funding for this research has been provided by the United
States Department of Transportation (US DOT) Federal
Railroad Administration (FRA). The published material in
this report represents the position of the authors and not
necessarily that of DOT. Industry partnership and support has
been provided by Union Pacific Railroad; BNSF Railway;
National Railway Passenger Corporation (Amtrak); Amsted
RPS / Amsted Rail, Inc.; GIC Ingeniería y Construcción;
Hanson Professional Services, Inc.; and CXT Concrete Ties,
Inc., an LB Foster Company. For providing direction, advice,
and resources, the authors would like to thank Mike Tomas
from Amtrak, William GeMeiner from Union Pacific
Railroad; and Winfred Boesterling from Vossloh.

6 Copyright © 2013 by ASME
Additionally, the authors thank the members of AREMA
Committee 30, Subcommittee 4 (Concrete Crosstie
Technology) for their continued support and guidance in
UIUC’s concrete crosstie research. The authors’ gratitude is
also expressed to Andrew Stirk and Anusha Suryanarayanan
from UIUC, who have provided invaluable service in data
processing and analyzing. The authors would also like to
thank Bassem Andrawes, Zhe Chen, Justin Grassé, Ryan
Kernes, Daniel Kuchma, David Lange, Christopher Rapp,
Moochul Shin, Amogh Shurpali, and Sihang Wei from UIUC
for their involvement in this research effort. J. Riley Edwards
has been supported in part by grants to the UIUC RailTEC
from CN, CSX, Hanson Professional Services, Norfolk
Southern, and the George Krambles Transportation
Scholarship Fund.
REFERENCES
(1) Stabler, L., “Wheels Gone WILD: A Look into the World
of Equipment Condition Detection,” Proceedings of the
Southwest Association of Rail Shippers Annual Meeting,
February 2010.
(2) Canadian National Railway, “Wheel Impact Load
Detectors: The Early History on CN,” Proceedings of the
31st Annual North American Rail Mechanical Operations
Seminar, St. Louis, MO, March 2011.
(3) Wiley, R., Elsaleiby, A., “A Review of Wheel Impact
Measurement Variation,” Technology Digest,
Transportation Technology Center, Inc., TD-11-007,
2007.
(4) Van Dyk, B. J., J. R. Edwards, C. J. Ruppert, Jr., C. P. L.
Barkan, “Considerations for Mechanistic Design of
Concrete Sleepers and Elastic Fastening Systems in North
America,” Proceedings of the 2013 International Heavy
Haul Association Conference, New Delhi, India, February
2013, pp. 4.
(5) Caughron, B. M., M. R. Saat, C. P. L. Barkan,
“Identifying and Prioritizing Shared Rail Corridor
Technical Challenge,” Proceedings of the 2012 Annual
AREMA Conference, Chicago, IL, September 2012, pp.2.
(6) Kerr, A. D., 2003, Fundamentals of Railway Track
Engineering, Simmons-Boardman Books, Inc., Omaha,
pp. 88-89, Chap. 4, pp. 250, Chap. 8.
(7) Hay, W. W., 1982, Railroad Engineering, John Wiley &
Sons, Inc., New York, pp. 253-256, Chap. 15.
(8) Esveld, C., 2001, Modern Railway Track, MRT
Productions, Zaltbommel, the Netherlands, pp. 57, Chap.
4.
(9) Nurmikolu, A., P. Salmenperä, S. Mäkitupe, K. Lane,
“Statistical analysis of wheel impact load data and review
for Finnish impact load limits,” Proceedings of the 2013
International Heavy Haul Association Conference, New
Delhi, India, February 2013, pp. 5.
(10) GeMeiner, W., 2005, “Workshop 139 – Leveraging of
WILD Vertical Force Data at Union Pacific,”
Proceedings of the 2005 Transportation Research Board
Annual Meeting, Washington, D.C.

7 Copyright © 2013 by ASME
ANNEX A
SHARED USE LOADING ENVIRONMENT FIGURES
FIGURE A1. PERCENT EXCEEDING PARTICULAR PEAK VERTICAL LOADS ON AMTRAK AT EDGEWOOD, MARYLAND (WILD DATA FROM NOVEMBER 2010)

8 Copyright © 2013 by ASME
FIGURE A2. PERCENT EXCEEDING PARTICULAR PEAK VERTICAL LOADS ON UPRR AT GOTHENBURG, NEBRASKA (WILD DATA FROM JANUARY 2010)