
Quantifying School Engagementschoolengagement.org/wp-content/uploads/2013/12/... · Quantifying...
16
Quantifying School Engagement: Research Report National Center for School Engagement December, 2006 An initiative of the Colorado Foundation for Families and Children 303 E. 17 th Avenue, Suite 400 Denver, CO 80203
Transcript of Quantifying School Engagementschoolengagement.org/wp-content/uploads/2013/12/... · Quantifying...

Quantifying School Engagement: Research Report
National Center for School Engagement
December, 2006
An initiative of the Colorado Foundation for Families and Children 303 E. 17th Avenue, Suite 400 Denver, CO 80203

1
Quantifying School Engagement: Research Report
Introduction
The Colorado Foundation for Families and Children (CFFC) received funding from the
Office of Juvenile Justice and Delinquency Prevention (OJJDP) to evaluate their Truancy
Reduction Demonstration Program. As part of this evaluation, CFFC created the National
Center for School Engagement (NCSE). One function of NCSE was to develop an instrument to
measure students’ school engagement in order to assess whether interventions in three intensive
demonstration sites had an effect on student engagement. This article explains the process by
which NCSE created the student school engagement survey and summarizes the preliminary data
about the reliability and validity of the instrument1.
Background of School Engagement
For decades, educators and educational researchers have been interested in the effects of
students’ attitudes about school and their experiences in school on achievement and attendance.
Researchers have conceptualized these attitudes and experiences in a variety of ways, with little
consistency in methods and theory.2 Researchers have used a multitude of terms to describe
what they think is important to study when it comes to attitudes and experiences.
Klem and Connell (2004) discuss different concepts that have been used. For instance,
Marks (2000) conceptualized engagement as “a psychological process, specifically, the attention,
interest, and investment and effort students expend in the work of learning.” Connell and
colleagues defined and measured two forms of engagement: ongoing engagement, which
includes student behavior, emotions, and thought processes during the school day, and reaction
1 The actual pre-post test evaluation results using the survey can be found in the Houston and Jacksonville evaluation reports. 2 Although theory does not necessarily seem to guide the research, many researchers in the area cite B. F. Skinner and Albert Bandura in their literature reviews.

2
to challenge, which refers to a student’s coping strategy for dealing with perceived failure in
school (Connell & Wellborn, 1994; Skinner, Zimmer-Gembeck, & Connell, 1996). Using the
Rochester Assessment Package for Schools (RAPS) instruments, Klem and Connell (2004)
found that students who were at optimal levels on their engagement measures were “44% more
likely to do well and 23% less likely to do poorly on the performance and attendance” indices.
In addition, students who were considered below average in engagement were 30% more likely
to do poorly on student outcomes.
Fredricks and colleagues also published a comprehensive article that synthesizes the
research in school engagement (Fredricks, Blumenfeld, & Paris, 2004) and put this body of
research into a theoretical framework consisting of three types of engagement: behavioral
engagement, cognitive engagement and emotional engagement. And while there are arguably
overlaps in these concepts3, it appears to be a good way to conceptualize the work and add to the
field. The following is a description of each:
1) Behavioral Engagement: Broadly defined as doing school work and following rules.
Examples:
• Positive Conduct: Consists of behaviors that illustrate effort, persistence, concentration,
attention, asking questions, contributing to class discussion, following rules, studying,
completing homework, and participating in school-related activities.
• Absence of Disruptive Conduct: Not skipping school and not getting in trouble.
3 For instance, a scale item designated as cognitive engagement because it refers to the effort put forth in doing school work might also be considered a behavioral engagement because it reflects behavior rather than thought.

3
2) Cognitive Engagement: Essentially defined as motivation, effort and strategy use. This
includes a psychological investment in learning, a desire to go beyond the requirements and a
preference for challenge.
Examples:
• Flexibility in problem solving, preference for hard work, investment in learning beyond just
behavioral engagement, mental effort, and desire to master a task.
3) Emotional Engagement: In general, this includes interests, values and emotions.
Examples:
• Affective reactions in the classroom, attitudes towards school and teachers,
identification with school, feelings of belonging, appreciation of success in school.
• The antithesis of positive feelings are also emotional engagement items.
The division of engagement is not intended to imply a definitive separation, because as
Fredricks et.al. (2004) state, “these factors are dynamically interrelated … they are not isolated
processes” (pg. 61). Instead, the division merely aids in understanding that “engagement” as a
whole is a multi-dimensional construct. In fact, the authors discuss numerous overlaps in past
research, and the potential for overlaps is evident in the concepts as they define it. Consequently,
we would expect these components to be highly correlated with each other, but relate differently
to student outcomes such as achievement and attendance.
Fredricks et al. (2004) also discuss the past research in terms of what associations have been
found between the types of engagement and achievement. The authors conclude that there is a
body of evidence showing the relationship between behavioral engagement and achievement
exists but that there may be mediating factors that influence this relationship. In addition, it is

4
unclear if behavioral engagement is predictive of deep understanding of material. Little
convincing evidence has been found concerning a link between emotional engagement and
achievement. This, however, may be due in part to inconsistent ways in which researchers have
measured what Fredricks et al. conceptualize as emotional engagement. However, evidence of a
relationship between cognitive engagement and achievement is much stronger, including data
from scores on achievement tests designed to measure in-depth understanding. The work in this
field, however, does not eliminate the possibility of a bi-directional influence between outcomes
and engagement: it is most likely that they influence each other.
The relationship between engagement and dropping out has been studied somewhat. Not
surprisingly, behavioral engagement, which includes measures of skipping class is related to
dropping out than the other two engagement types (Connell, Spencer, and Aber, 1994,
Rumberger, 1987). There is little empirical evidence that emotional or cognitive engagement is
related to dropping out. However, it seems plausible that cognitive engagement is related to
achievement. If it is true that students whose academic performance is poor are less engaged,
then it is possible they are also more likely to drop out. In addition, students who feel
emotionally disengaged may also be less likely to continue their school careers. In general,
there simply have not been enough studies using these types of clear engagement distinctions to
draw conclusions about the nature of engagement and student outcomes.
Methodology in the Survey Design
We examined multiple survey instruments that concerned attitudes and experiences with
school to design the student engagement questionnaire for the OJJDP intensive sites. All
potential engagement or similar concept items and scales were identified through various
sources, including national surveys, surveys from schools, journal articles, and the Core

5
Measures book produced by CSAP. The research and evaluation team at CFFC worked
collaboratively to select the questions that appeared to be most promising in terms of validity and
reliability, and that covered a breadth of content. However, in order to cover the breadth of
content, but also keep the instrument at a reasonable length, the original scales were not used in
their entirety, which had the potential of reducing their validity. The survey items came from the
following data sources:
• ADD Health Survey – The National Longitudinal Study of Adolescent Health
• Core Measures - CSAP
• School Integration Index, based on ADD Health
• Fredricks, Blumenfeld, Friedel, & Paris (2002)
• Pellerin (2000)
• Pemi-Baker School District (2002)
• School Climate Survey – From Data Analysis for Comprehensive Schoolwide Improvement
by V. Bernhardt (1998)
• Jenkins (1997) – Based on Hirschi’s social bonding theory
Although these are the primary sources we chose, many of the questions were modified
somewhat in wording. These changes were made in order to make the survey consistent in terms
of the response scales we chose and/or to make the items more clear to the students. In addition,
CFFC added unique questions that seemed pertinent to the project but were not considered
school engagement questions. For instance, we added questions about exposure to school drop
out, expulsion, and suspension, thoughts of dropping out, experience with school failure,
students’ experience as parents, activities while skipping school, victimization experience,
attitudes toward their neighborhoods, future aspirations, and parental involvement.

6
After identifying the items we felt would be most useful, we examined each one for “fit” into one
of the three types of engagement: emotional, cognitive, or behavioral, based on the descriptions
above. Each team member labeled each item by engagement category. The feedback from each
member was analyzed and items with general consensus (with all but potentially one member
agreeing that there was a fit) were assigned to be part of one of the three scales.
This process led us to create the following scales:
Emotional Engagement Sixteen items fit this category. 19a When I first walked into my school I thought it was Good….Bad. 19c When I first walked into my school I thought it was Friendly….Unfriendly. 19d When I first walked into my school I thought it was Clean….Dirty. 22c I am happy to be at my school. 22d The teachers at my school treat students fairly. 22f I like most of my teachers at school. 22m The discipline at my school is fair. 22o Most of my teachers care about how I’m doing. 22p Most of my teachers know the subject matter well. 22r There is an adult at school that I can talk to about my problems. 22s I respect most of my teachers. 22v Most of my teachers understand me. 23d I feel excited by the work in school. 23f My classroom is a fun place to be. 23u I enjoy the work I do in class 23w I feel I can go to my teachers with the things that I need to talk about.
Cognitive Engagement Twenty-two items fit this category. 21a How important do you think an education is? 21b How important do you think it is to get good grades? 21c How important do you think the things you are learning in school are going to be to you later in life? 21f How important do you think it is to have a good job or career after finishing school? 22h I am getting a good education at my school. 22j I will graduate from high school. 22k I want to go to college 22n Most of my classes are boring. 22p Most of my teachers know the subject matter well.

7
22q I learn a lot from my classes. 23e I am interested in the work I get to do in my classes. 23g When I read a book, I ask myself questions to make sure I understand what it is about. 23h I study at home even when I don’t have a test. 23j I talk with people outside of school about what I am learning in class. 23k I check my schoolwork for mistakes. 23l If I don’t know what a word means when I am reading, I do something to figure it out,
like look it up in the dictionary or ask someone. 23n If I don’t understand what I read, I go back and read it over again. 23p I try my best at school. 23r I get good grades in school.
Behavioral Engagement Seven items fit this category 14 How often have you thought of dropping out? 23a When I am in class, I just pretend I am working. 23b I follow the rules at school. 23c I get in trouble at school. 23q I skip (cut) classes during school. 23s I skip (cut) the entire school day. 23t I try to stay home from school.
We received achievement and attendance information from the Gulfton neighborhood in
Houston, TX, Kent County in Seattle, Washington, and Jacksonville, Florida. These data were
correlated with the engagement scales to examine validity. We expect that if school engagement
is related to achievement and attendance, the scales should be correlated to these indicators. In
addition, we would expect that cognitive engagement would be more highly correlated with
achievement than attendance, whereas behavioral and emotional engagement might be more
highly correlated with attendance than achievement. However, since we believe that engagement
is a single concept with multi-dimensions, we expect that each type of engagement would be
related to student outcomes as well as to each other. In addition, we ran Cronbach Alphas on
each scale in each site to examine scale reliability4.
4 Cronbach’s Alpha is an index of reliability for a set of items that indicates the extent to which items measure the same characteristic. Also known as the indicator for scale internal consistency and as scale reliability coefficient.
8
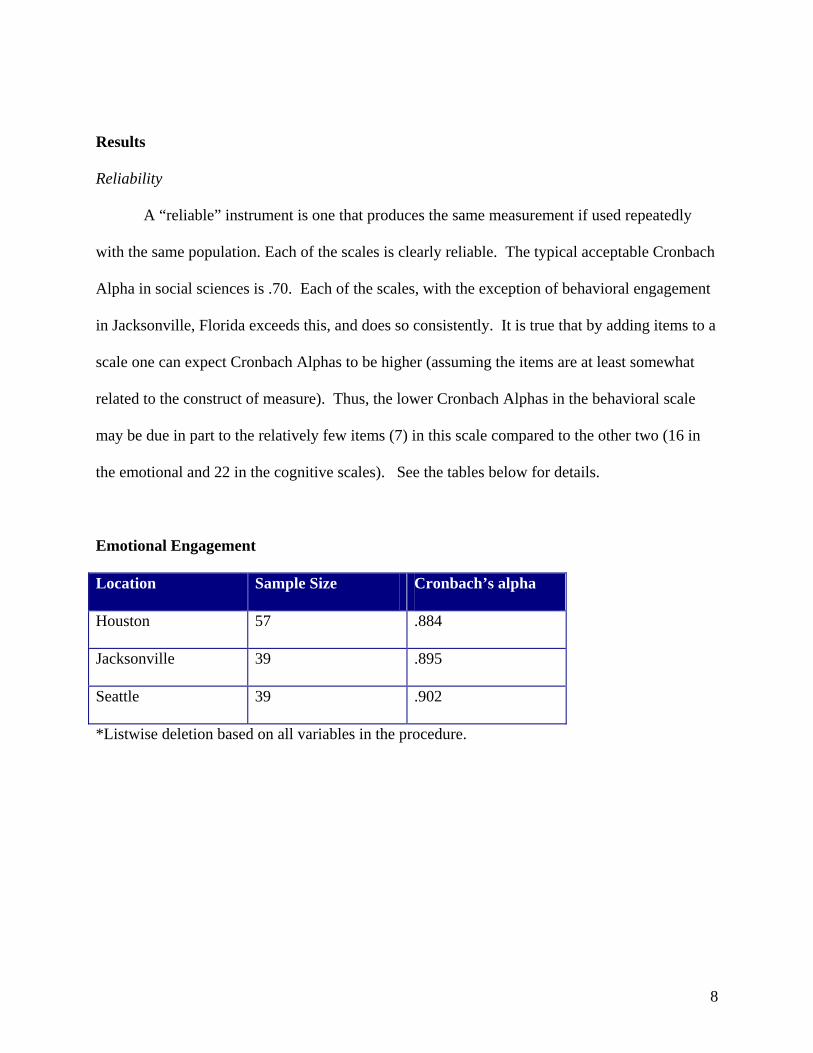
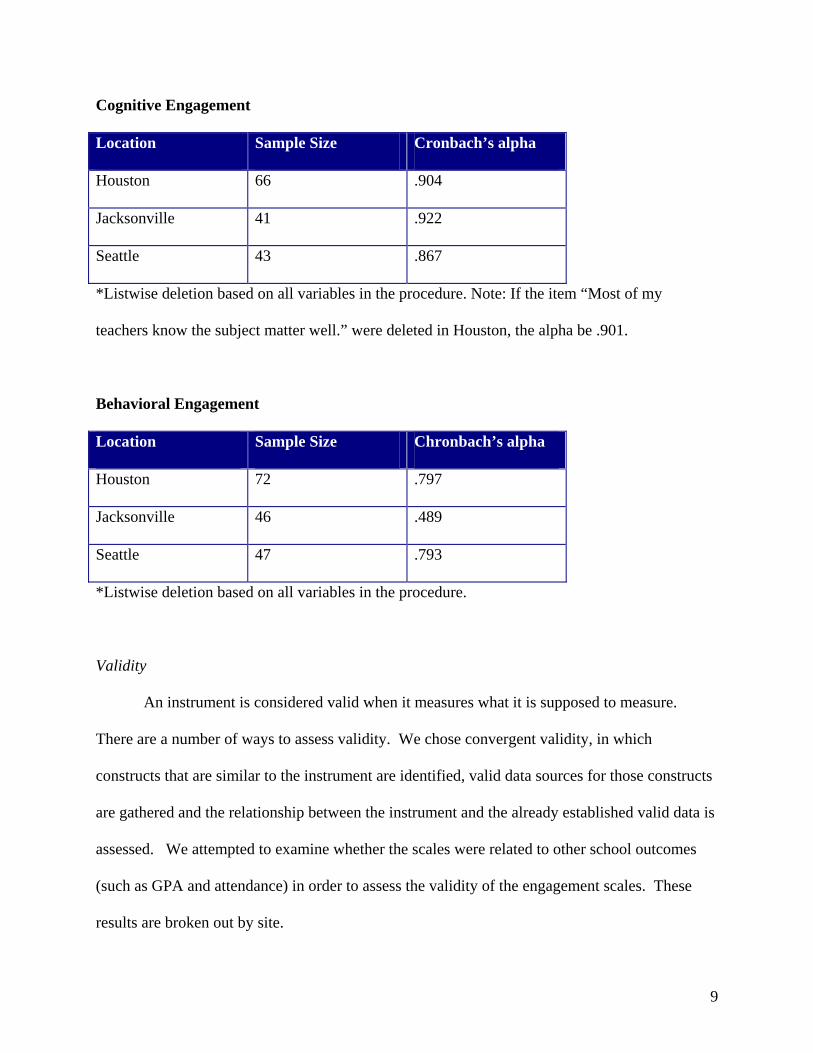
Results
Reliability
A “reliable” instrument is one that produces the same measurement if used repeatedly
with the same population. Each of the scales is clearly reliable. The typical acceptable Cronbach
Alpha in social sciences is .70. Each of the scales, with the exception of behavioral engagement
in Jacksonville, Florida exceeds this, and does so consistently. It is true that by adding items to a
scale one can expect Cronbach Alphas to be higher (assuming the items are at least somewhat
related to the construct of measure). Thus, the lower Cronbach Alphas in the behavioral scale
may be due in part to the relatively few items (7) in this scale compared to the other two (16 in
the emotional and 22 in the cognitive scales). See the tables below for details.
Emotional Engagement
Location Sample Size Cronbach’s alpha
Houston 57 .884
Jacksonville 39 .895
Seattle 39 .902
*Listwise deletion based on all variables in the procedure.
9
Cognitive Engagement
Location Sample Size Cronbach’s alpha
Houston 66 .904
Jacksonville 41 .922
Seattle 43 .867
*Listwise deletion based on all variables in the procedure. Note: If the item “Most of my
teachers know the subject matter well.” were deleted in Houston, the alpha be .901.
Behavioral Engagement
Location Sample Size Chronbach’s alpha
Houston 72 .797
Jacksonville 46 .489
Seattle 47 .793
*Listwise deletion based on all variables in the procedure.
Validity
An instrument is considered valid when it measures what it is supposed to measure.
There are a number of ways to assess validity. We chose convergent validity, in which
constructs that are similar to the instrument are identified, valid data sources for those constructs
are gathered and the relationship between the instrument and the already established valid data is
assessed. We attempted to examine whether the scales were related to other school outcomes
(such as GPA and attendance) in order to assess the validity of the engagement scales. These
results are broken out by site.
10
Houston
In Houston, the emotional engagement scale was not significantly correlated with GPA,
but the cognitive scale correlated with GPA. The coefficient was .369, which is significant at the
p<.005 level (N = 62). This means the cognitive engagement scale accounts for approximately
14% of the variance in GPA. The behavioral scale also correlated with GPA .345, which is
significant at the p<.005 level (N = 68). This means the behavioral engagement scale accounts
for approximately 12% of the variance in GPA. There were no significant correlations between
attendance and cognitive or emotional engagement, however, the correlation between behavioral
engagement and days missed was .20 (p=.15, ns). Finally, the emotional scale correlated with
the behavioral scale .22 (ns) and correlated with the cognitive scale .68, p<.001. The behavioral
scale is correlated with cognitive scale .52, p<.001.
Seattle
In Seattle, none of the engagement scales correlated with GPA or absences. Behavioral
engagement correlated with cognitive engagement, r(51) = .64, p<.001 and with emotional
engagement, r(51) = .35, p<.05. Emotional engagement correlated with cognitive engagement,
r(51) = .72, p<.001.
Jacksonville
Since the students served in Jacksonville are primarily in elementary schools, we
received Math and English grades rather than GPA. We also received attendance information
broken down for excused and unexcused absences.

11
The behavioral scale did not correlate significantly with grades, but was correlated with
unexcused absences, r(40) = .352, p<.05. The emotional scale was significantly correlated with
Math grades, r(32) = .48, p<.01, English grades, r(32) = .43, p<.05, and unexcused absences,
r(33) = .61, p<. 001. The cognitive scale was also significantly correlated with Math grades,
r(34) = .40, p<. 05, English grades, r(34) = .37, p<.05, and unexcused absences, r(35) = .46, p<.
01. None of engagement scales correlated with excused absences.
The emotional and cognitive scales were significantly and highly correlated; r(37) = .928,
p<.001, where as the behavioral scale was not significantly correlated with the cognitive scale
and was only marginally correlated with the emotional scale; r(30) = .31, p = .05.
Conclusions
The school engagement survey was designed to measure school engagement as a whole.
In this project it was tested with small samples of truant students. Consequently, the participants
in this study are likely to be less engaged than students as a whole, and to have a restricted range
of achievement and attendance indicators than that which would be found in an entire student
body. This complicates testing for validity and reliability. Nevertheless, we found support for
the reliability of the engagement scales and some support for the validity.
The scales met and exceeded the desired criterion for reliability; in all but one case, the
Cronbach Alphas ranged from .79 to .92. Cronbach Alphas can range from 0 to 1. The higher
the number, the more likely the items in the scale are measuring a similar concept. These
numbers indicate that the items “fit” in these scales.
The scales also appear to be valid as evidenced in two of the three sites. In Houston,
cognitive and behavioral engagement was significantly related to GPA. Behavioral engagement
was correlated with attendance, but not significantly so. In Jacksonville, all the scales were

12
significantly related to unexcused but not excused absences. In addition, emotional and
cognitive engagement were also related to Math and English grades. Although similar findings
were not found in Seattle, these findings do suggest that engagement is likely to predict and/or be
predicted by attendance and achievement.
Behavioral engagement is more closely related to attendance than grades, which is not
surprising given that some of the items are self-reports on missing classes. Jacksonville’s data
included excused absences, which were not related to any of the engagement indices. If we
believe that excused absences are legitimate (e.g., illnesses) and therefore not related to student
engagement, we would expect no relationship to exist. Consequently, this is perhaps a good
illustration of “discriminant validity” in which a construct unrelated to engagement, like excused
absences, would not be expected to be related to engagement. Nevertheless, the lower reliability
indices for this scale indicates that the next steps should be to add items to improve reliability
and perhaps broaden the construct in terms of other school related behaviors.
In addition, the cognitive engagement scale was more consistently correlated with
achievement than the other two types of engagement. This makes conceptual sense. One would
expect that students who report putting more effort into school work would achieve higher
grades.
All of the scales are correlated with each other. This too, makes conceptual sense
because as stated earlier, engagement is conceived to be a multi-dimensional, but unified,
construct. The fact that these correlations ranged from not significant to .93 show that although
they are related, they are not measuring identical concepts within engagement.

13
These results indicate that a school engagement questionnaire can be a useful tool in
assessing cognitive, behavioral and emotional engagement as well as providing some indication
of how students may be doing in terms of attending school and achievement. However, there is
much more research to be done before the school engagement instrument designed for this study
can be definitively said to be the best tool to use. Additional work, some of which has already
been done, includes qualitative research with students (focus groups about engagement and one-
on-one cognitive interviews about the survey items), and gathering schoolwide and hopefully
districtwide engagement and student outcome data in multiple states.

14
References Bernhardt, V. (2002) Data Analysis for Comprehensive Schoolwide Improvement. Eye on Education, Inc., Larchmont, NY. (out of print). Connell, J. P., Spencer, M. B., & Aber, J. L. (1994). Educational risk and resilience in African-American youth: Context, self, action, and outcomes in school. Child Development, 65, 493-506. Connell, J. P., & Wellborn, J. G. (1994). Engagement Versus Disaffection: Motivated Patterns of Action In the Academic Domain. Rochester, NY: University of Rochester. Fredricks, J. A., Blumenfeld, P. C., & Paris, A. H. (2004). School engagement: Potential of the concept, state of evidence. Review of Educational Research, 74, 1, 59-109. Jenkins, P.A. (1997) School delinquency and the school social bond. Journal of Research of Crime Delinquency. 34, 337– 367. Klem, A. M., & Connell, J. P ( 2004). Relationships matter: Linking teacher support to student engagement and achievement. Journal of School Health, 74, 7, 262 – 273. Marks, H.M. (2000), Student engagement in instructional activity: Patterns in the elementary, middle, and high school years. American Education Research Journal, 37, 1, 153-184. Pellerin, L. A. (2000, April). Urban youth and schooling: The effect of school climate on student disengagement and dropout. Paper presented at the Annual Meeting of The American Educational Research Association, New Orleans, LA. Rumberger, R. W. (1987). High school dropouts: A review of issues and evidence. Review of Educational Research, 57, 101-121. Skinner, E.A., Zimmer-Gembeck, M., Connel, J. P. (1996). Individual Differences And The Development of Perceived Control.

The National Center for School Engagement (NCSE) is an initiative of The Colorado Foundation for Families and Children (CFFC). NCSE strives to build a network of key stakeholders who share the belief that improving school attendance and school attachment promotes achievement and school success. NCSE was established as a result of more than a decade of educational research about youth out of the educational mainstream conducted by CFFC. The impact of this work has been the development of significant investments of state funds to reduce suspensions expulsions and truancy. Over five years ago, CFFC began working with the OJJDP, US Department of Justice to assist in the planning and implementation of pilot demonstration projects across the country. As projects developed, CFFC became the national evaluator of this five-year truancy demonstration project. The culmination of ten years of program experience and research has identified truancy and school engagement as the centerpiece of NCSE’s work to improve outcomes for youth who are at the greatest risk of school failure and delinquency. We are national leaders in applying research to help communities prevent and reduce truancy. Author: Krystina A. Finlay, Ph.D.
National Center for School Engagement c/o Colorado Foundation for Families and Children
303 E. 17th Avenue, Suite 400 Denver, CO 80203
(303) 837-8466 www.schoolengagement.org