
Quantifying LV function how good are we
28
Support for research from Hitachi Aloka, & GE Ultrasound Quantifying LV function – how good are we ? Professor Alan G Fraser Wales Heart Research Institute Cardiff University, U.K.
Transcript of Quantifying LV function how good are we

Support for research from Hitachi Aloka, & GE Ultrasound
Quantifying LV function –
how good are we ?
Professor Alan G Fraser
Wales Heart Research Institute
Cardiff University, U.K.

Kvitting et al, J Am Soc Echo 1999; 12: 698
Visual assessment of synchronicity
Computer-simulated regional delay

Fall 1, Segment 9
0
10
20
30
40
50
60
Antal 1 57 45 2
Ej bedömbar Normalt Hypokinesi Akinesi Dyskinesi
*
Fall 1, Segment 3
0
20
40
60
80
100
Antal 91 16
Ej bedömbar Normalt Hypokinesi Akinesi Dyskinesi
*
Fall 1, Segment 13
0
20
40
60
80
100
Antal 1 18 82 6
Ej bedömbar Normalt Hypokinesi Akinesi Dyskinesi
*
Fall 1, Segment 6
0
10
20
30
40
50
60
70
Antal 15 65 24 3
Ej bedömbar Normalt Hypokinesi Akinesi Dyskinesi
*
Fall 1, Segment 12
0
10
20
30
40
50
60
Antal 1 5 44 54 2
Ej bedömbar Normalt Hypokinesi Akinesi Dyskinesi
*
Fall 1, Segment 15
0
20
40
60
80
Antal 7 30 65 5
Ej bedömbar Normalt Hypokinesi Akinesi Dyskinesi
*
EQUALIS – Diagnosis of regional wall motion
Independent reporting
by 106 Swedish
centres in 2008
Courtesy of
Dr Odd Bech-Hansson
Echocardiography
Quality Control
Project: Case #1

Blondheim DS et al, JASE 2010; 23: 258-64
Inter-observer reproducibility of visual grading of
regional wall motion – 11 experienced observers
Intra-class correlation coefficients (each observer vs others)
Normal,
hypokinetic,
or akinetic
Normal,
or
abnormal
Hypokinetic,
or not
Akinetic,
or not
180
segments
from 105
studies
0.79
0.71
0.37

• Subjective interpretation of motion & thickening
• Learning curve, operator-dependent
• Sub-optimal reproducibility even in expert centres
• Insensitive for detecting single vessel disease
• Categorical outcomes, not a graded response
• Improved by LV opacification with echo contrast
• Remains a subjective diagnosis
• So why is it still used in stress echocardiography ?
Limitations of wall motion scoring

EQUALIS
Echocardiography Project
Case #1
Courtesy of
Dr Odd Bech-Hansson

Ejektionsfraktion, intervall
0
20
40
60
Antal 14 53 29 6 2 2
<20 20-29 30-39 40-49 50-59 >60
Case #1: Left ventricular ejection fraction
N
Simpson EF by 5 investigators: mean 34 % (range 32-36 %)
EQUALIS Echocardiography Quality Control Project
Independent analysis in 106 Swedish centres

Expected
normal
value
Observed value
Distribution Cumulative
frequency
LVEDD
N = 6,026
Berger AK et al, JACC 1999; 34: 1831
LVEF
Observer bias in visual estimation of LVEF

Blondheim DS et al, JASE 2010; 23: 258-64
Visual assessment of LV ejection fraction
105 echo studies interpreted by 12 observers
Coefficient of
variation 11%
Bias -8 to +4%

A4C
A2C
End-diastole End-systole
Modified
Simpson’s
method of
discs
Biplane
planimetry
LVEDV
LVESV
SV
EF

McGowan JH et al, Am Heart J 2003; 146: 388-97
Systematic review of LV quantification by echo
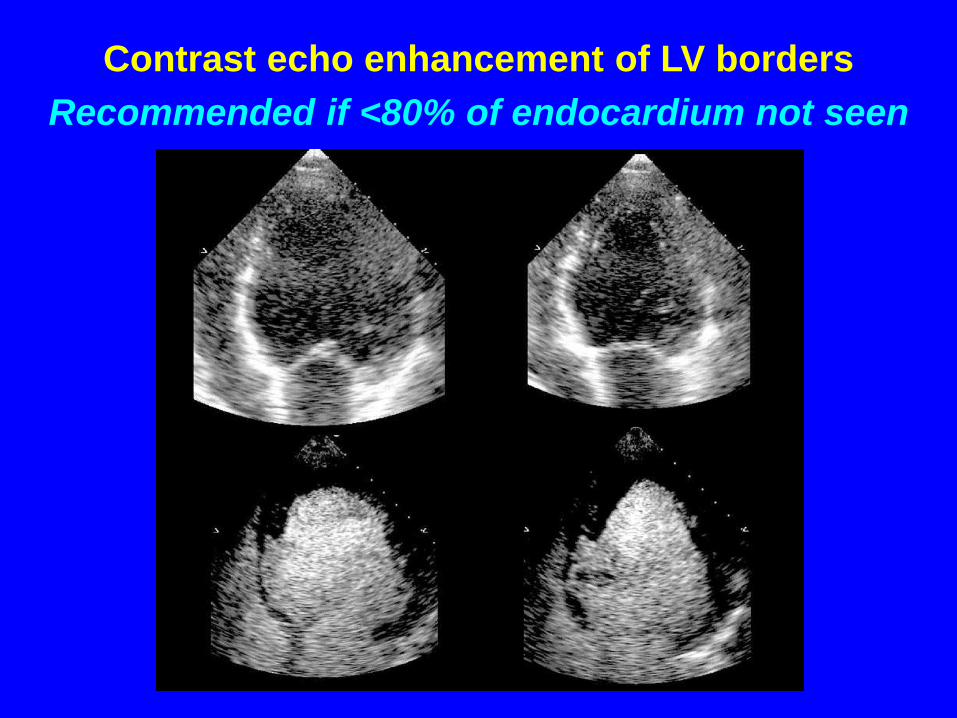
Contrast echo enhancement of LV borders
Recommended if <80% of endocardium not seen

Malm S et al et al, JACC 2004; 44: 1030-5
Accuracy of contrast echo to quantify LV function,
compared to magnetic resonance imaging (n 110)
-18% to +8%
Limits of agreement
-8% to +4%

End-
diastolic
volume (ml)
End-
systolic
volume (ml)
Ejection
fraction (%)
n
Cineventriculography,
biplane 187 ± 105 90 ± 84 56.2 ± 18.3 100
Magnetic resonance
imaging, SAX 174 ± 50 84 ± 45 54.1 ± 12.9 55
Unenhanced
echocardiography 115 ± 53 62 ± 48 50.9 ± 15.3 115
Contrast-enhanced
echocardiography 147 ± 60 73 ± 56 54.6 ± 16.8 115
Hoffmann R et al, Eur Heart J 2005; 26: 607-16
Non-invasive measurement of global LV function
Comparison of imaging modalities

Real-time 3D
echocardiography avoids
foreshortening of the LV
Real-time 3D
echocardiography allows
automated quantification
Three dimensional echocardiography
Courtesy of Luigi Badano
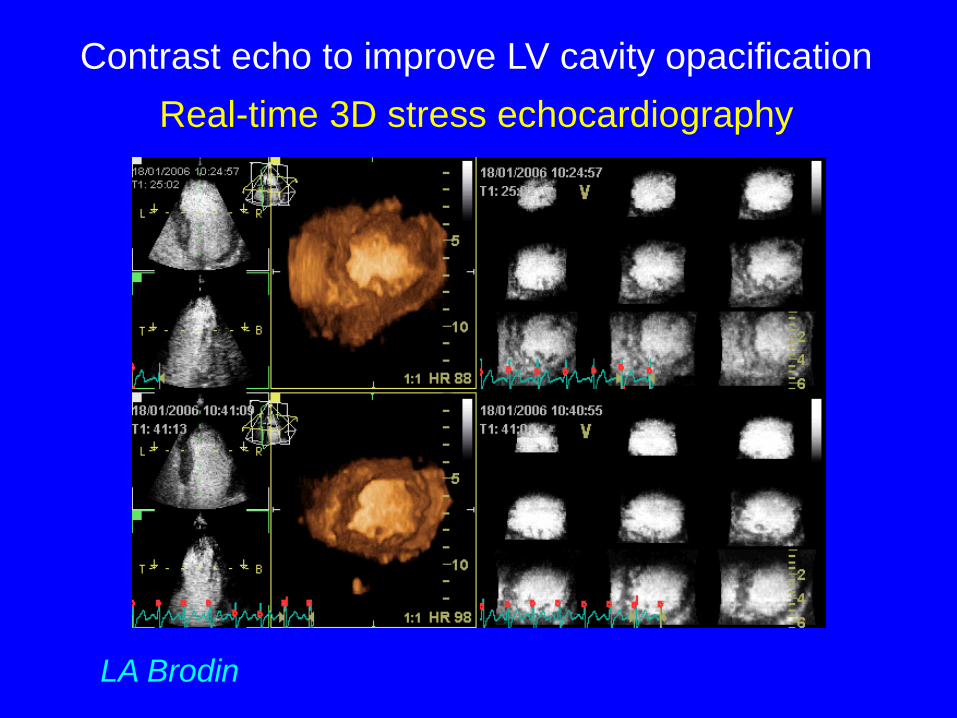
Contrast echo to improve LV cavity opacification
Real-time 3D stress echocardiography
LA Brodin

Utility of contrast for LV opacification
Real-time 3D stress echocardiography
Segments analysable 76% 90%
Image quality index 2.2 3.1
Diagnosis of ischaemia
by territory (n=108) 79% 88%
kappa 0.26 0.59
by patient (n=36) 72% 89%
kappa 0.43 0.77
RT3D + LVO
Nemes A et al, Am J Cardiol 2007; 99: 275-8

Kleijn SA et al, Am J Cardiol 2011; 108: 1038-44
Quantification of LV function: inter-machine comparison
Volumetric 3D (Philips iE33) vs speckle 3D (Toshiba Artida 4D)
“comparable & reproducible” “interchangeable .. in daily clinical practice”
n 120
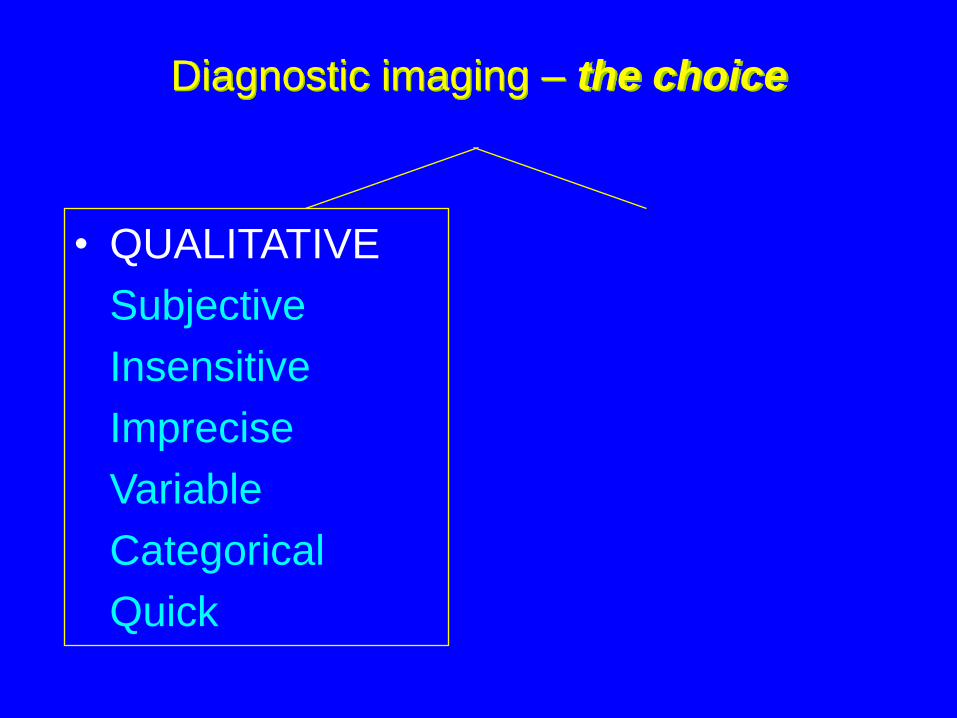
• QUALITATIVE
Subjective
Insensitive
Imprecise
Variable
Categorical
Quick
Diagnostic imaging – the choice

Croskerry P et al, J Roy Coll Physicians Edin 2011; 41: 155-62
Cognitive psychology – models of diagnostic reasoning
Type 1 Intuitive Type 2 Analytical Heuristic Deductive
Reflexive Deliberate
Fast Slow
Vulnerable to bias Consistent
Prone to error Scientific

• QUALITATIVE
Subjective
Insensitive
Imprecise
Variable
Categorical
Quick
Diagnostic imaging – the choice
• QUANTITATIVE
Objective
More sensitive
Precise
Reproducible
Continuous
Time-consuming

• Normative databases
• Compare each patient to normal values that
reflect age, gender, BMI, and risk factors
• Automated quantification / analysis
• Integrated clinical decision aids, algorithms
• Parametric visual displays of quantitative data
– measurements, significance levels, z scores
How could we improve diagnostic accuracy ?
.. by exploiting computing and information technology


Healthy
subjects
Atlas
Radial velocity
Long. velocity
(mm/s)
(mm/s)
Temporal display of mean
velocities with variance,
at a particular location
Derived from fully
automated 3D/4D
analysis of velocity
using tracking
technique
Duchateau N et al, Med Image Analysis 2011; 15: 316-28
A new concept for diagnosis: a statistical atlas
An average heart with population variability

Parametric displays of
statistically abnormal
myocardial motion
Local maps at fixed time t
p-value
(log scale)
Red = large abnormality
Base
Apex
Time
IVC Systole Diastole
Spatiotemporal maps of abnormality
Blue = Inward (vp<0)
Red = Outward (vp>0)
p-value
(log scale)
Duchateau N et al, Med Image Analysis 2011; 15: 316-28

0
10
20
30
40
50
60
0 20 40 60 80 100
Sample size
Pe
rce
nta
ge d
iffe
ren
ce r
eq
uir
ed
CV 20%
CV 10%
CV 5%
CV 2%
Courtesy of Professor Frank Dunstan
The implications of reproducibility
The “reference change value”

Number of
subjects
per sample
Coefficient of variation
2% 5% 10% 20% 30%
1 6 14 28 55 83
10 2 4 9 18 26
20 1 3 6 12 19
50 1 2 4 8 12
100 1 1 3 6 8
Statistical power by sample size & reproducibility
Significant differences that can be demonstrated

How good are we at quantifying LV function ?
Each echo lab needs its own quality control