Quantifying fatigue cracking damage in polyethylene tibial ...
41
Quantifying fatigue crack damage in polyethylene tibial inserts of prosthetic knee joints MS Candidate Dept. of Mechanical Engineering University of Utah November 17, 2014 Carly Lockard
Transcript of Quantifying fatigue cracking damage in polyethylene tibial ...
Quantifying fatigue crack damage in
polyethylene tibial inserts of
prosthetic knee joints
MS Candidate
Dept. of Mechanical Engineering
University of Utah
November 17, 2014
Carly Lockard

Introduction
• Total knee arthroplasty (TKA): gold-standard treatment for
degenerative and arthritic knee diseases
• Replaces damaged articular surfaces with metal and polyethylene
articular surfaces – prosthetic knee joint
2
Femoral
component
Tibial insert
Metal tibial
plateau and stem
Condyles of
tibia
Femur
Condyles of
femur
Tibia
Articular
cartilage

Introduction (2)
3
• Problem: failure of prosthetic knee joints• Statistical survivorship decreases after 10 – 15 years of use• Main causes of failure [1]
• Polyethylene wear, and aseptic loosening and instability due to osteolysis (bone death) cause more than 40% of all failures
Aseptic
loosening
31%
Instability
19%Infection
16%
Polyethylene
wear
10%
Arthrofibrosis
7%
Malalignment
7%
Other
10%
[1] Schroer, W. C., Berend, K. R., Lombardi, A. V., Barnes, C. L., Bolognesi, M. P., Berend, M. E., Ritter, M. A., and Nunley, R. M., 2013,
“Why are total knee failing today? Etiology of total knee revision in 2010 and 2011.,” J. Arthroplasty, 28(Suppl. 1), pp. 116–119.
Introduction (3)
4
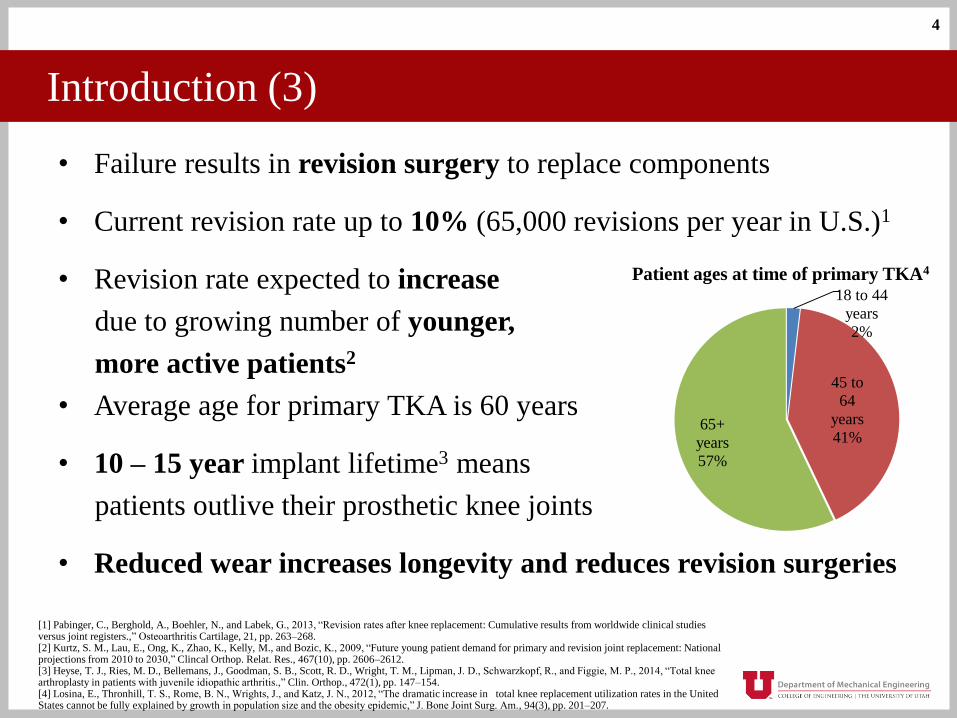
• Failure results in revision surgery to replace components
• Current revision rate up to 10% (65,000 revisions per year in U.S.)1
• Revision rate expected to increase
due to growing number of younger,
more active patients2
• Average age for primary TKA is 60 years
• 10 – 15 year implant lifetime3 means
patients outlive their prosthetic knee joints
• Reduced wear increases longevity and reduces revision surgeries
18 to 44
years
2%
45 to
64
years
41%65+
years
57%
Patient ages at time of primary TKA4
[1] Pabinger, C., Berghold, A., Boehler, N., and Labek, G., 2013, “Revision rates after knee replacement: Cumulative results from worldwide clinical studies versus joint registers.,” Osteoarthritis Cartilage, 21, pp. 263–268.[2] Kurtz, S. M., Lau, E., Ong, K., Zhao, K., Kelly, M., and Bozic, K., 2009, “Future young patient demand for primary and revision joint replacement: National projections from 2010 to 2030,” Clincal Orthop. Relat. Res., 467(10), pp. 2606–2612.[3] Heyse, T. J., Ries, M. D., Bellemans, J., Goodman, S. B., Scott, R. D., Wright, T. M., Lipman, J. D., Schwarzkopf, R., and Figgie, M. P., 2014, “Total knee arthroplasty in patients with juvenile idiopathic arthritis.,” Clin. Orthop., 472(1), pp. 147–154.[4] Losina, E., Thronhill, T. S., Rome, B. N., Wrights, J., and Katz, J. N., 2012, “The dramatic increase in total knee replacement utilization rates in the United States cannot be fully explained by growth in population size and the obesity epidemic,” J. Bone Joint Surg. Am., 94(3), pp. 201–207.
Introduction (3)
5
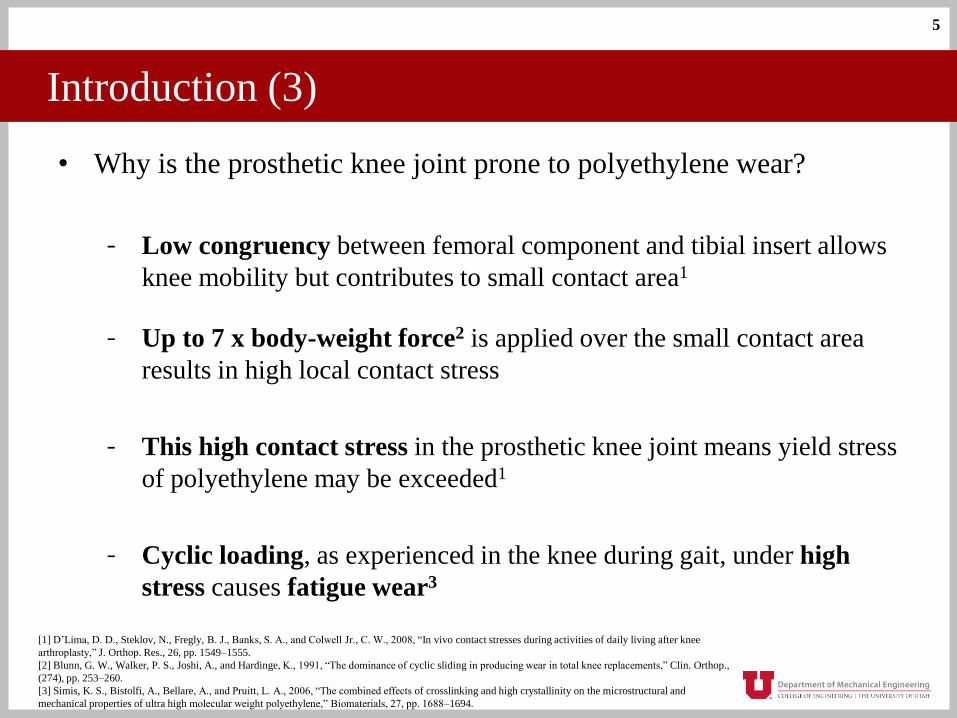
• Why is the prosthetic knee joint prone to polyethylene wear?
- Low congruency between femoral component and tibial insert allows
knee mobility but contributes to small contact area1
- Up to 7 x body-weight force2 is applied over the small contact area
results in high local contact stress
- This high contact stress in the prosthetic knee joint means yield stress
of polyethylene may be exceeded1
- Cyclic loading, as experienced in the knee during gait, under high
stress causes fatigue wear3
[1] D’Lima, D. D., Steklov, N., Fregly, B. J., Banks, S. A., and Colwell Jr., C. W., 2008, “In vivo contact stresses during activities of daily living after knee
arthroplasty,” J. Orthop. Res., 26, pp. 1549–1555.
[2] Blunn, G. W., Walker, P. S., Joshi, A., and Hardinge, K., 1991, “The dominance of cyclic sliding in producing wear in total knee replacements,” Clin. Orthop.,
(274), pp. 253–260.
[3] Simis, K. S., Bistolfi, A., Bellare, A., and Pruitt, L. A., 2006, “The combined effects of crosslinking and high crystallinity on the microstructural and
mechanical properties of ultra high molecular weight polyethylene,” Biomaterials, 27, pp. 1688–1694.
Introduction (4)
6
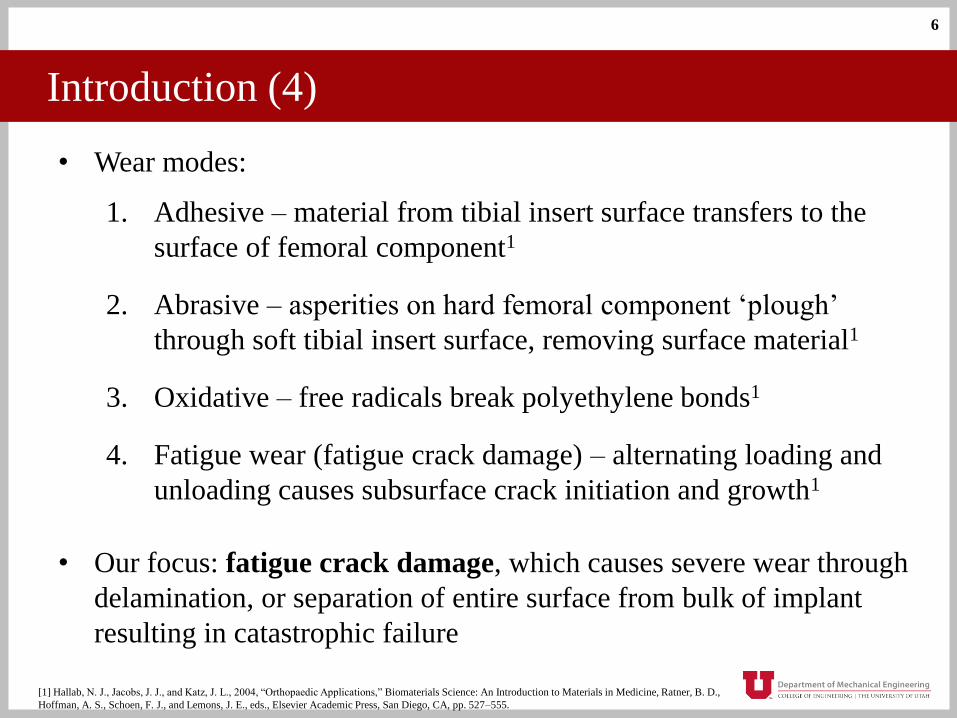
• Wear modes:
1. Adhesive – material from tibial insert surface transfers to the
surface of femoral component1
2. Abrasive – asperities on hard femoral component ‘plough’
through soft tibial insert surface, removing surface material1
3. Oxidative – free radicals break polyethylene bonds1
4. Fatigue wear (fatigue crack damage) – alternating loading and
unloading causes subsurface crack initiation and growth1
• Our focus: fatigue crack damage, which causes severe wear through
delamination, or separation of entire surface from bulk of implant
resulting in catastrophic failure
[1] Hallab, N. J., Jacobs, J. J., and Katz, J. L., 2004, “Orthopaedic Applications,” Biomaterials Science: An Introduction to Materials in Medicine, Ratner, B. D.,
Hoffman, A. S., Schoen, F. J., and Lemons, J. E., eds., Elsevier Academic Press, San Diego, CA, pp. 527–555.
Objectives
7
1. Develop a non-destructive method to measure fatigue crack
damage
2. Develop a finite element model of contact stress occurring in
tibial insert during knee simulator testing
3. Evaluate how well modeled local stress predicts fatigue crack
damage

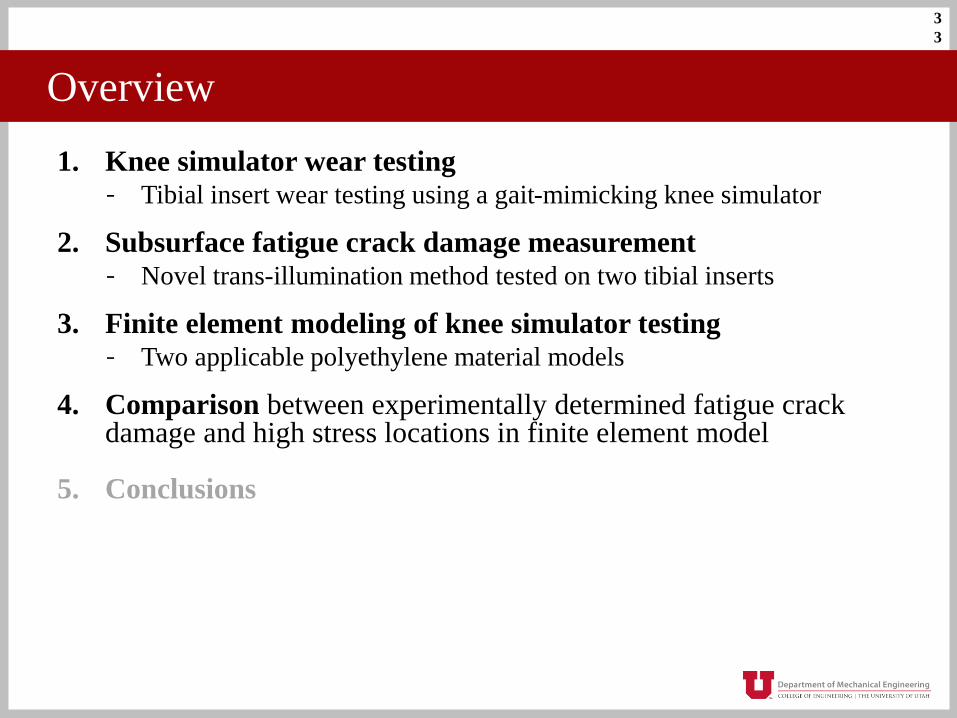
Overview
1. Knee simulator wear testing- Tibial insert wear testing using a gait-mimicking knee simulator
2. Subsurface fatigue crack damage measurement- Novel trans-illumination method tested on two tibial inserts
3. Finite element modeling of knee simulator testing- Two applicable polyethylene material models
4. Comparison between experimentally determined fatigue crack damage and high stress locations in finite element model
5. Conclusions
8
Overview
1. Knee simulator wear testing- Tibial insert wear testing using a gait-mimicking knee simulator
2. Subsurface fatigue crack damage measurement- Novel trans-illumination method tested on two tibial inserts
3. Finite element modeling of knee simulator testing- Two applicable polyethylene material models
4. Comparison between experimentally determined fatigue crack damage and high stress locations in finite element model
5. Conclusions
9
Knee simulator testing
10
Femoral
component
(posterior view)
Tibial insert
(posterior view)
Container
for bovine
calf serum
Pivot point for
varus-valgus rotation
Anterior-posterior buffer load
cells
Attachment for
femoral
component
Attachment
for tibial
insert (metal
tibial plateau)
Tibial insert
enclosure
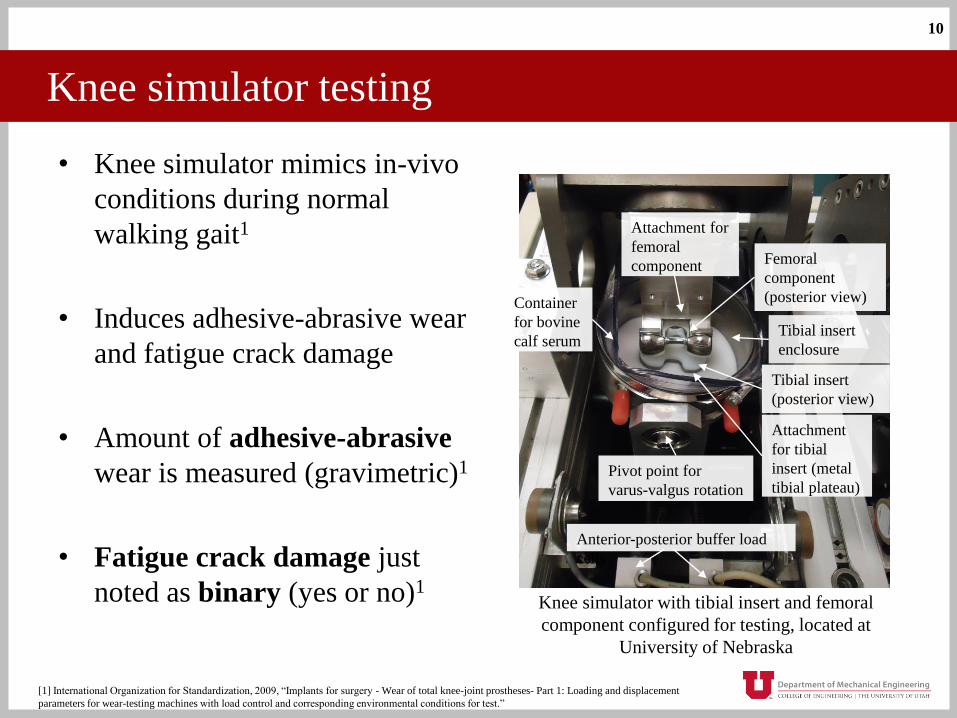
• Knee simulator mimics in-vivo
conditions during normal
walking gait1
• Induces adhesive-abrasive wear
and fatigue crack damage
• Amount of adhesive-abrasive
wear is measured (gravimetric)1
• Fatigue crack damage just
noted as binary (yes or no)1Knee simulator with tibial insert and femoral
component configured for testing, located at
University of Nebraska
[1] International Organization for Standardization, 2009, “Implants for surgery - Wear of total knee-joint prostheses- Part 1: Loading and displacement
parameters for wear-testing machines with load control and corresponding environmental conditions for test.”
Knee simulator testing (2)
11
Internal-external rotation torques
(pneumatic actuators) and load cells
Axial force (actuator) and load cell,
universal joint at base allows rotation
Left and right anterior-
posterior forces
(pneumatic actuators)
and load cells
Left and right anterior-
posterior buffer forces
(springs) and
load cells
Flexion-extension
actuation
Femoral component
Tibial insert attachment
(metal tibial plateau)
Internal-external
rotation buffer
torques (springs) and
load cells
Attachment
for femoral
componentTibial insert
Posterior pivot
point for varus-
valgus rotation
Tibial insert enclosure
Anterior pivot point for
varus-valgus rotation
(obscured)
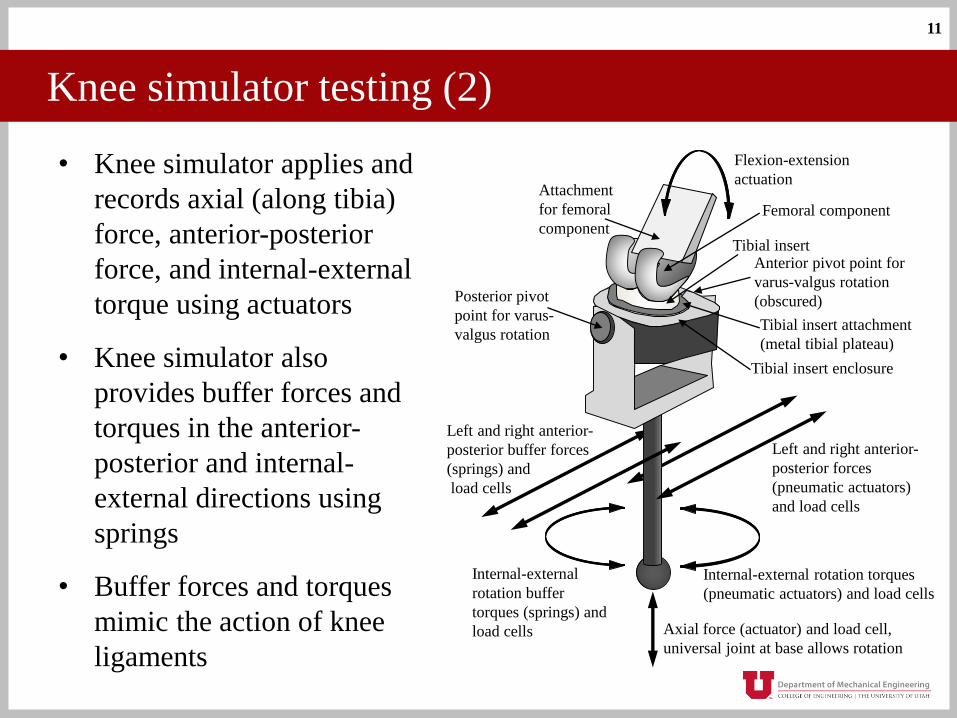
• Knee simulator applies and
records axial (along tibia)
force, anterior-posterior
force, and internal-external
torque using actuators
• Knee simulator also
provides buffer forces and
torques in the anterior-
posterior and internal-
external directions using
springs
• Buffer forces and torques
mimic the action of knee
ligaments

Knee simulator testing (3)
• Apply simulated gait cycles at 1 Hz (normal gait stride frequency)1
• Test until damage is noted or to the required minimum lifetime of 6
million cycles1
• Average the input and measured forces/torques and displacements over
19 cycles to obtain average load and displacement data
- These data are later used as input for finite element model
• Results:
- Fatigue crack damage occurred at less than 6 million cycles
- This indicates that the yield stress of polyethylene was exceeded
12
[1] International Organization for Standardization, 2009, “Implants for surgery - Wear of total knee-joint prostheses- Part 1: Loading and displacement
parameters for wear-testing machines with load control and corresponding environmental conditions for test.”
Overview
1. Knee simulator wear testing- Tibial insert wear testing using a gait-mimicking knee simulator
2. Subsurface fatigue crack damage measurement- Novel trans-illumination method tested on two tibial inserts
3. Finite element modeling of knee simulator testing- Two applicable polyethylene material models
4. Comparison between experimentally determined fatigue crack damage and high stress locations in finite element model
5. Conclusions
1
3
Fatigue crack damage measurement
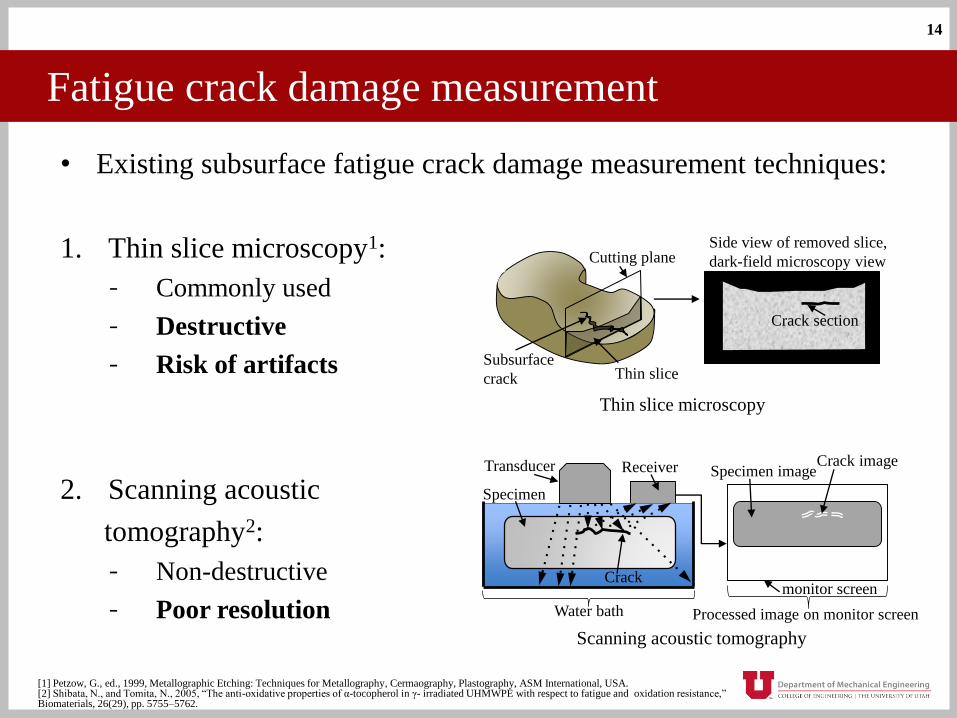
• Existing subsurface fatigue crack damage measurement techniques:
1. Thin slice microscopy1:
- Commonly used
- Destructive
- Risk of artifacts
2. Scanning acoustic
tomography2:
- Non-destructive
- Poor resolution
14
Thin slice
Side view of removed slice,
dark-field microscopy view
Crack section
Cutting plane
Subsurface
crack
Thin slice microscopy
Specimen
Water bath
Transducer Receiver
Processed image on monitor screen
Crack image
Crack
Specimen image
monitor screen
Scanning acoustic tomography
[1] Petzow, G., ed., 1999, Metallographic Etching: Techniques for Metallography, Cermaography, Plastography, ASM International, USA.[2] Shibata, N., and Tomita, N., 2005, “The anti-oxidative properties of α-tocopherol in γ- irradiated UHMWPE with respect to fatigue and oxidation resistance,” Biomaterials, 26(29), pp. 5755–5762.

Fatigue crack damage measurement (2)
3. Microscopic computed tomography (micro-CT)1:
- High resolution
- Non-destructive
- Expensive
15
Specimen
X-ray
source
Beam
Detector
Thin slice images produced by
each beam are assembled into
3D image of specimen
Thin slice
images
3D image
Microscopic computed tomography (micro-CT)
[22] Teeter, M. G., Yuan, X., Naudie, D. D. R., and Holdsworth, D. W., 2010, “Technique to quantify subsurface cracks in retrieved polyethylene components
using micro-CT,” J. Long. Term Eff. Med. Implants, 20(1), pp. 27–34.

Fatigue crack damage measurement (3)
16
Anterior
Fatigue crack
damage
Anterior Fatigue crack
damage
• Measured fatigue crack damage in two tibial inserts:
1. Tibial insert 1: knee simulator wear tested, cruciate sacrificing
2. Tibial insert 2: retrieved implant, cruciate retaining
• Both GUR 1050 ultra-high molecular weight polyethylene
(UHMWPE), gamma irradiation sterilized, nitrogen flush packaged
Tibial insert 1 Tibial insert 2

• Use diffused light from a fiber optic illuminator to uniformly trans-
illuminate tibial inserts
• Trans-illumination reveals fatigue crack damage
• Images are processed to quantify fatigue crack damage
Fatigue crack damage measurement (4)
17
Fiber optic illuminator Opaque plastic sheeting
Diffusing screen Camera
Tibial insertVise
Tripod
Anterior
Fatigue crack
damage
Damaged Pristine
Fatigue crack damage measurement (5)
18
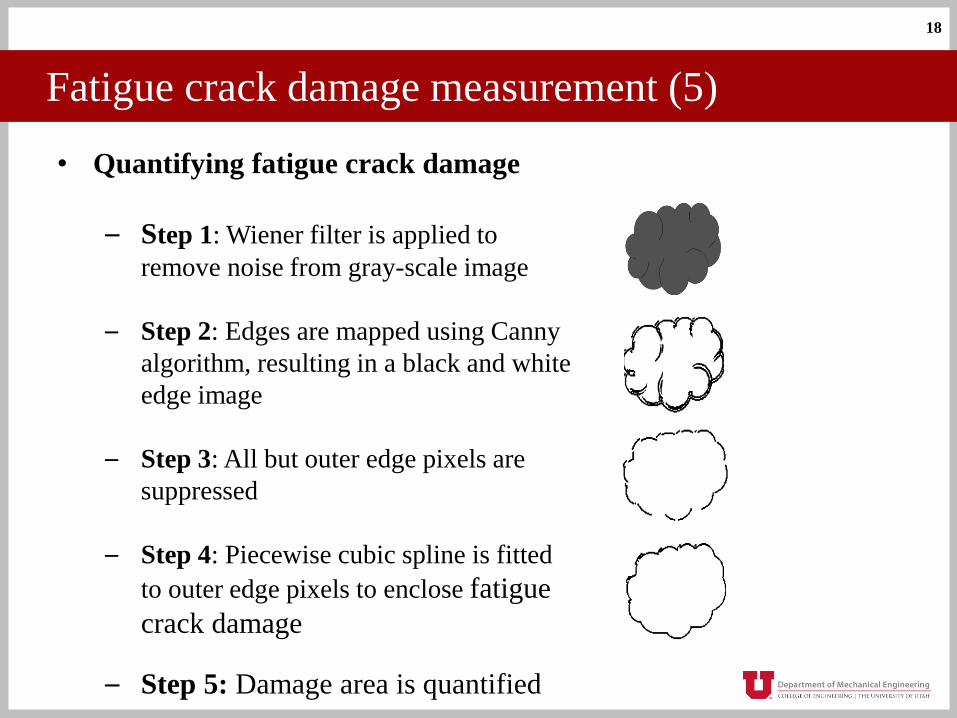
• Quantifying fatigue crack damage
– Step 1: Wiener filter is applied to
remove noise from gray-scale image
– Step 2: Edges are mapped using Canny
algorithm, resulting in a black and white
edge image
– Step 3: All but outer edge pixels are
suppressed
– Step 4: Piecewise cubic spline is fitted
to outer edge pixels to enclose fatigue
crack damage
– Step 5: Damage area is quantified

19
C
D
B
A
Fatigue crack damage measurement (6)
• Illustration of fatigue crack damage image processing steps
applied to Tibial Insert 2
A: Wiener filtered image of fatigue crack damage
B: Edges mapped using the Canny edge detection
algorithm
C: Non-damage edge pixels have been removed
D: All but outer edge pixels removed

20
Fatigue crack damage measurement (6)
E: Outer pixels are superimposed on fatigue
crack damage image for illustration
F: Piecewise cubic spline is fit to outer edge pixels
G: Cubic spline is superimposed on fatigue crack
damage image for illustration
H: Superimposed image on the tibial insert
to show scale
E Outer edge pixels
(dark grey)
Fatigue crack
damage regionNon-
damage region
F Outer edge pixels
(red)Cubic
spline
(blue)
G
Fatigue crack
damage regionNon-
damage region
Outer edge pixels
and spline (dark grey)
H
6
mm
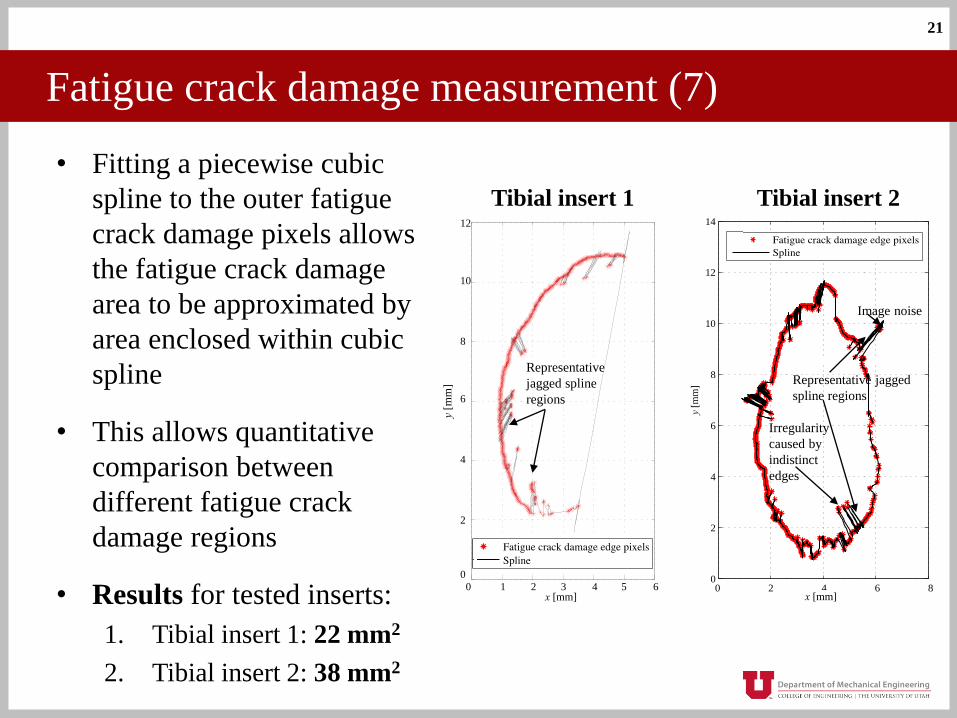
• Fitting a piecewise cubic
spline to the outer fatigue
crack damage pixels allows
the fatigue crack damage
area to be approximated by
area enclosed within cubic
spline
• This allows quantitative
comparison between
different fatigue crack
damage regions
• Results for tested inserts:
1. Tibial insert 1: 22 mm2
2. Tibial insert 2: 38 mm2
21
Fatigue crack damage measurement (7)
0 2 4 6 80
2
4
6
8
10
12
14
x [mm]
y [m
m] Representative jagged
spline regions
Image noise
Irregularity
caused by
indistinct
edges
0 2 4 6 80
2
4
6
8
10
12
14
x [mm]
y [m
m]
02
46
810
12
0 1 2 3 4 5 6
x [mm
]
y [mm]
0 2 4 6 8 10 120
1
2
3
4
5
6
x [mm]
y [m
m]
0 2 4 6 8 10 120
1
2
3
4
5
6
x [mm]
y [m
m]
Representative
jagged spline
regions
0 1 2 3 4 5 6
12
10
8
6
4
2
00 2 4 6 8 10 12
0
1
2
3
4
5
6
x [mm]
y [m
m]
Tibial insert 1 Tibial insert 2

22
Fatigue crack damage measurement (8)
• Results:
- Qualitative comparison between piecewise cubic spline and fatigue crack damage shows good agreement
- Area is successfully approximated via cubic spline fitting
• Possible sources of error:
- Deep fatigue crack damage
- Weak crack edges
- Noise
A B C
Cubic
spline
Fatigue
crack
damage
Jagged
spline
regions
57
Figure 2.23: Cubic spline superimposed on the fatigue crack damage image for tibial insert 2. (A)
The fatigue crack damage area (enclosed in black rectangle) relative to the tibial insert. (B) A
magnified view of the fatigue crack damage region. (C) The cubic spline superimposed on the
fatigue crack damage image.
2.4 Discussion
This new method to quantify fatigue crack damage overcomes the reliance on subjective
identification of fatigue crack damage edges [13,18] and manual tracing techniques [13]. In
addition, the fatigue crack area is measured, which has not been done for existing techniques such
as SAT [21] and trans-illumination for qualitative evaluation [12]. The measured fatigue crack
damage area represents a quantitative result for comparing fatigue crack damage severity between
tibial insert specimens.
The measurement accuracy when using this technique is dependent on three primary
factors. First, if the fatigue crack damage plane is not parallel to the viewing plane during fatigue
crack damage image capture, the resulting area projection will underestimate the actual fatigue
crack damage area. The orientation of the fatigue crack damage plane relative to the viewing
plane in the two tibial inserts that we tested is unknown and warrants further investigation.
[1] Bartel, D. L., Bicknell, V. L., and Wright, T. M., 1986, “The effect of conformity, thickness, and material on stresses in ultra-high molecular weight
components for a total joint replacement,” J. Bone Joint Surg. Am., 68, pp. 1041–1051.
Tibial insert 1 Tibial insert 2
Overview
1. Knee simulator wear testing- Tibial insert wear testing using a gait-mimicking knee simulator
2. Subsurface fatigue crack damage measurement- Novel trans-illumination method tested on two tibial inserts
3. Finite element modeling of knee simulator testing- Two applicable polyethylene material models
4. Comparison between experimentally determined fatigue crack damage and high stress locations in finite element model
5. Conclusions
2
3
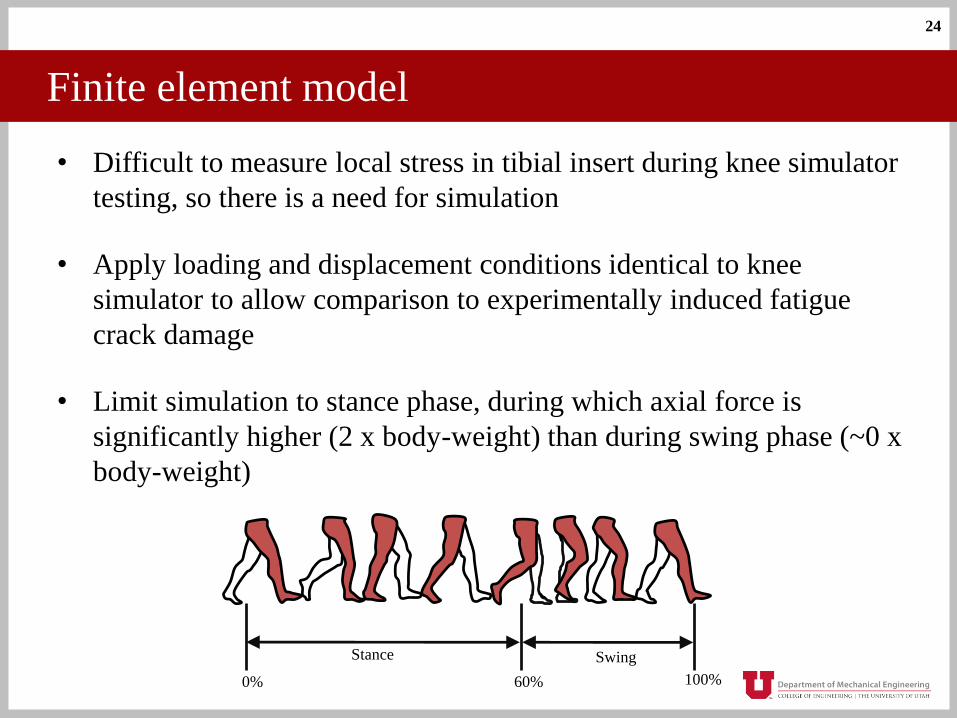
Finite element model
• Difficult to measure local stress in tibial insert during knee simulator
testing, so there is a need for simulation
• Apply loading and displacement conditions identical to knee
simulator to allow comparison to experimentally induced fatigue
crack damage
• Limit simulation to stance phase, during which axial force is
significantly higher (2 x body-weight) than during swing phase (~0 x
body-weight)
24
Stance Swing
0% 60% 100%
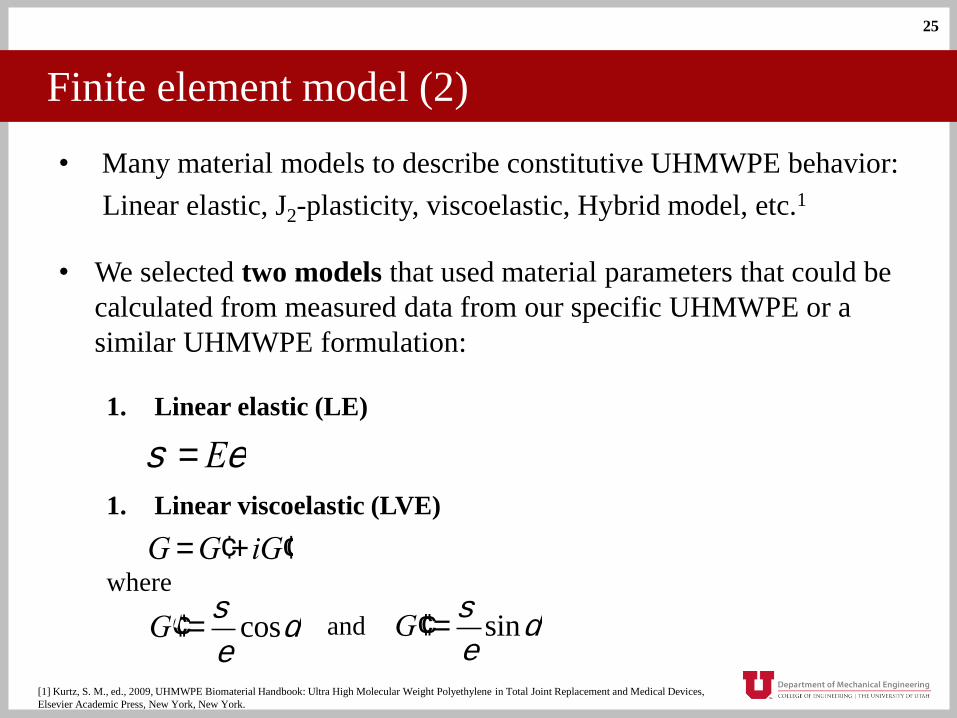
Finite element model (2)
• Many material models to describe constitutive UHMWPE behavior:
Linear elastic, J2-plasticity, viscoelastic, Hybrid model, etc.1
• We selected two models that used material parameters that could be
calculated from measured data from our specific UHMWPE or a
similar UHMWPE formulation:
1. Linear elastic (LE)
1. Linear viscoelastic (LVE)
where
25
s = Ee
G = ¢G + i ¢¢G
¢¢G =s
esind¢¢G =
s
ecosd and
[1] Kurtz, S. M., ed., 2009, UHMWPE Biomaterial Handbook: Ultra High Molecular Weight Polyethylene in Total Joint Replacement and Medical Devices,
Elsevier Academic Press, New York, New York.
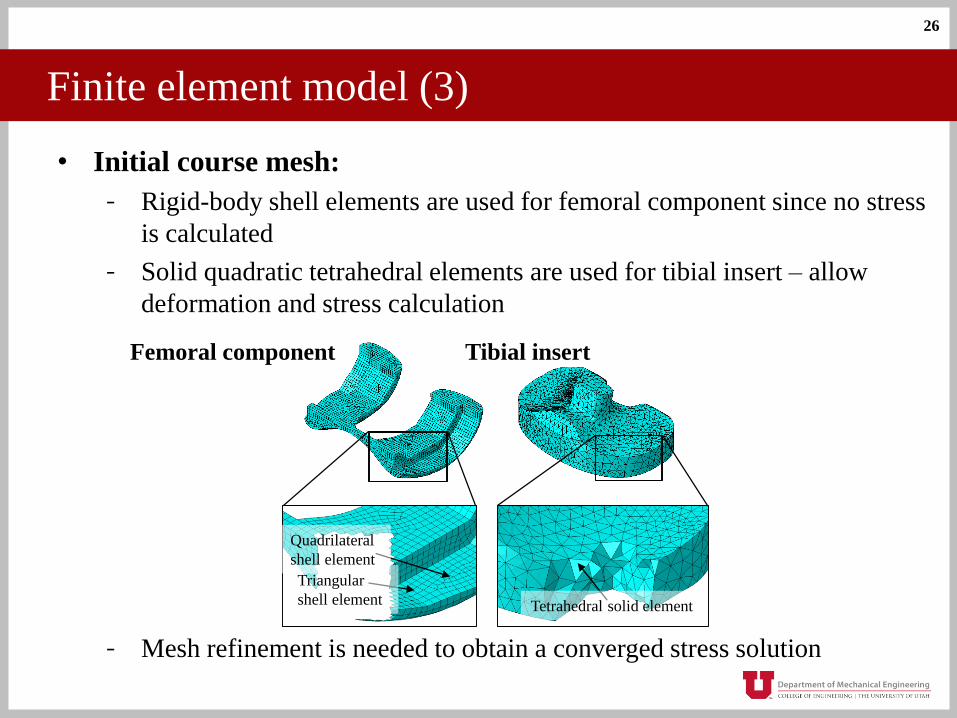
• Initial course mesh:
- Rigid-body shell elements are used for femoral component since no stress
is calculated
- Solid quadratic tetrahedral elements are used for tibial insert – allow
deformation and stress calculation
- Mesh refinement is needed to obtain a converged stress solution
Finite element model (3)
26
Quadrilateral
shell element
Triangular
shell element Tetrahedral solid element
Femoral component Tibial insert

Finite element model (4)
• Convergence study using abbreviated trial, with convergence criteria:
1. Change in maximum von Mises stress magnitude: < 3% change for
doubled number of elements in contact region
2. Qualitative: are stress contours continuous?
3. Hertz approximation: ellipsoids approximate contacting condyles,
loaded with axial force that corresponds to maximum stress in FE model
under two contact conditions
27
Contact conditionHertz contact stress
[MPa]
Maximum von Mises stress
from finite element model
[MPa]
Single-condyle 53.5979.61
Double-condyle 42.54
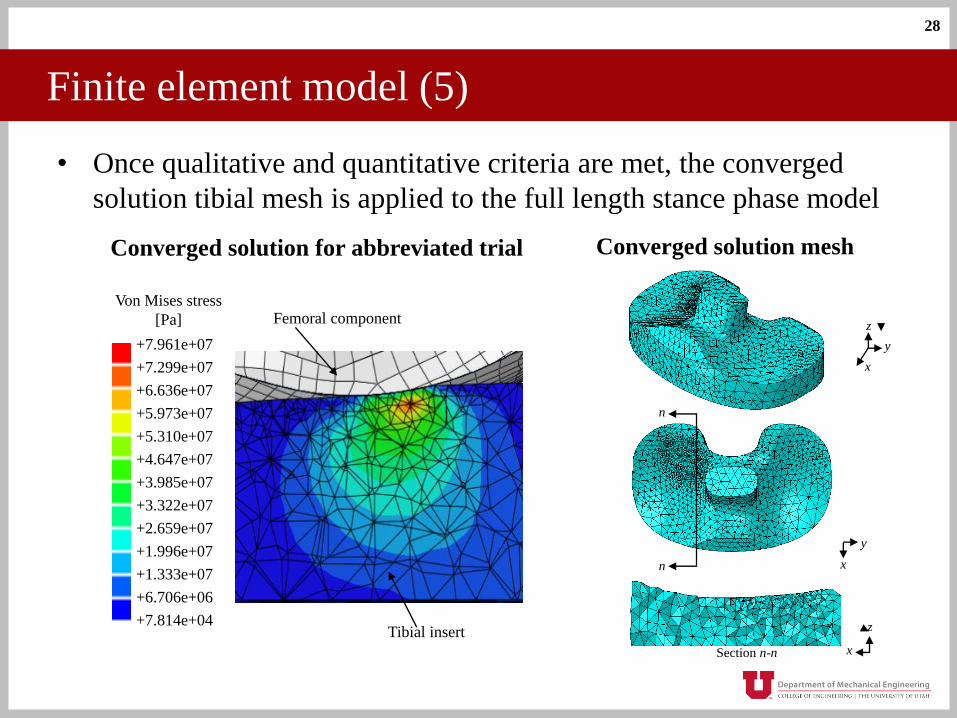
Finite element model (5)
28
Von Mises stress
[Pa]
+7.961e+07
+7.299e+07
+6.636e+07
+5.973e+07
+5.310e+07
+4.647e+07
+3.985e+07
+3.322e+07
+2.659e+07
+1.996e+07
+1.333e+07
+6.706e+06
+7.814e+04Tibial insert
Femoral component
Converged solution for abbreviated trial Converged solution mesh
n
n x
xSection n-n
x
y
z
y
z
• Once qualitative and quantitative criteria are met, the converged
solution tibial mesh is applied to the full length stance phase model

• Results of full-length, stance phase simulation:
- phase simulation
Finite element model (7)
29
0 0.1 0.2 0.3 0.4 0.5 0.60
10
20
30
40
50
60
70
80
Time [seconds]
Vo
n M
ises
str
ess
[M
Pa]
Linear elastic model (LE)
Linear viscoelastic model (VE)
0 0.1 0.2 0.3 0.4 0.5 0.60
10
20
30
40
50
60
70
80
Time [seconds]
Von
Mis
es s
tres
s [
MP
a]
Linear elastic model (LE)
Linear viscoelastic model (VE)
0 0.1 0.2 0.3 0.4 0.5 0.60
10
20
30
40
50
60
70
80
Time [seconds]
Vo
n M
ises
str
ess
[M
Pa]
Linear elastic model (LE)
Linear viscoelastic model (VE)
0 0.1 0.2 0.3 0.4 0.5 0.60
10
20
30
40
50
60
70
80
Time [seconds]
Von
Mis
es s
tres
s [
MP
a]
Linear elastic model (LE)
Linear viscoelastic model (VE)
LE: 79.82
VE: 79.75
LE: 51.38VE: 48.17
σy
σy
Linear elastic
Linear viscoelastic
- Stress in medial condyle
exceeds stress in lateral
condyle
- Yield stress is exceeded
during majority of stance
phase simulation
- Material model results for von
Mises stress maxima differ
throughout stance
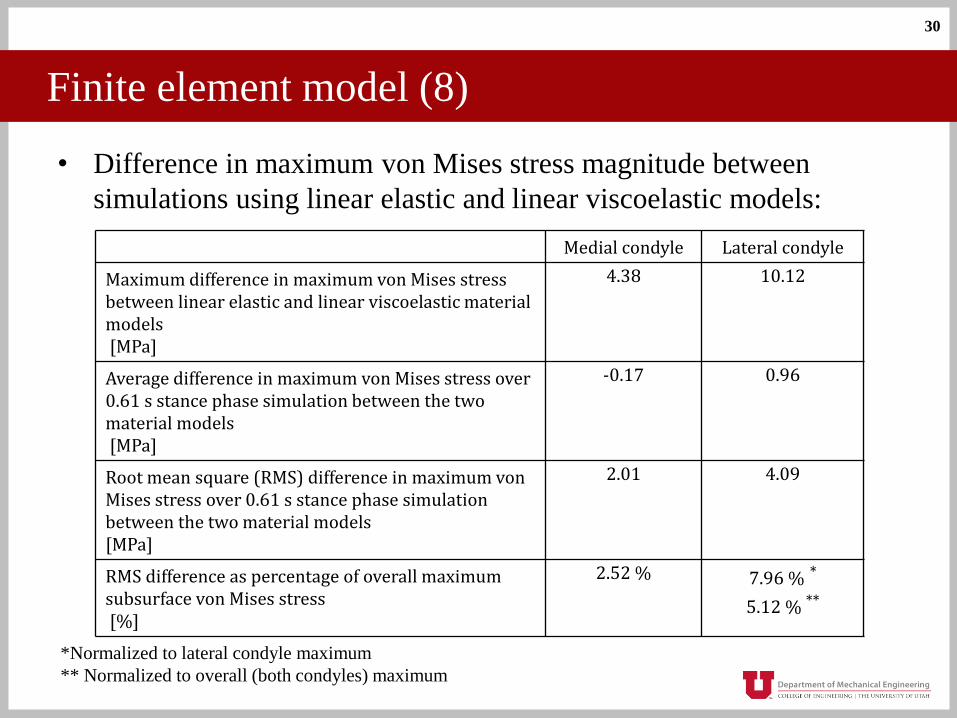
Finite element model (8)
30
• Difference in maximum von Mises stress magnitude between
simulations using linear elastic and linear viscoelastic models:
*Normalized to lateral condyle maximum
** Normalized to overall (both condyles) maximum
Medial condyle Lateral condyle
Maximum difference in maximum von Mises stress between linear elastic and linear viscoelastic material models[MPa]
4.38 10.12
Average difference in maximum von Mises stress over 0.61 s stance phase simulation between the two material models[MPa]
-0.17 0.96
Root mean square (RMS) difference in maximum von Mises stress over 0.61 s stance phase simulation between the two material models[MPa]
2.01 4.09
RMS difference as percentage of overall maximum subsurface von Mises stress [%]
2.52 % 7.96 % *
5.12 % **
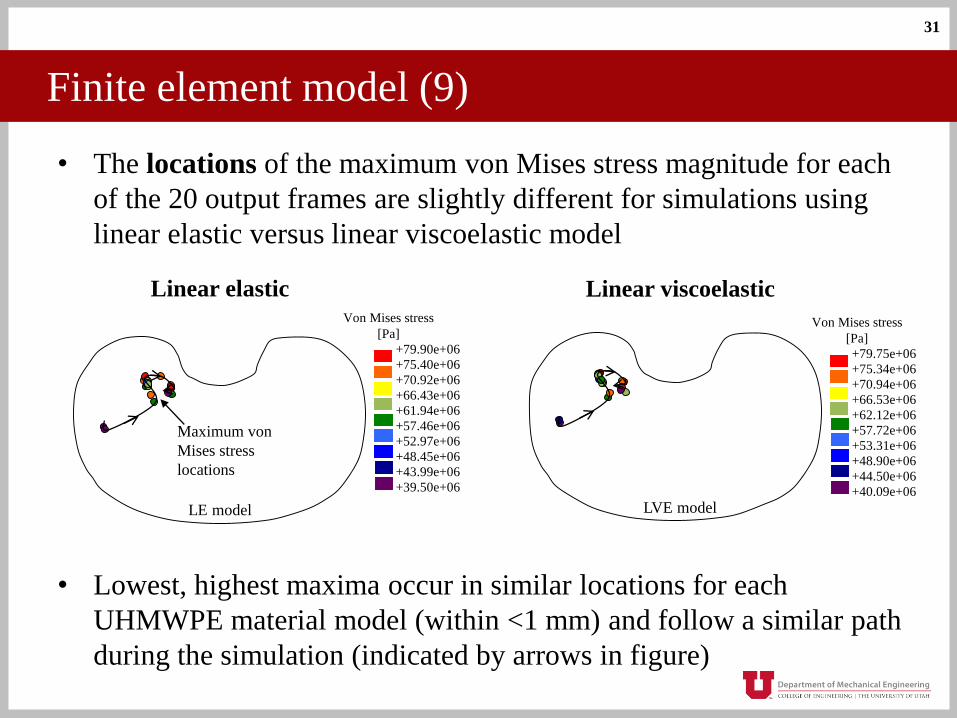
• The locations of the maximum von Mises stress magnitude for each
of the 20 output frames are slightly different for simulations using
linear elastic versus linear viscoelastic model
• Lowest, highest maxima occur in similar locations for each
UHMWPE material model (within <1 mm) and follow a similar path
during the simulation (indicated by arrows in figure)
Finite element model (9)
31
+79.90e+06
+75.40e+06
+70.92e+06
+66.43e+06
+61.94e+06
+57.46e+06
+52.97e+06
+48.45e+06
+43.99e+06
+39.50e+06
Maximum von
Mises stress
locations
Von Mises stress
[Pa]
LE model
+79.75e+06
+75.34e+06
+70.94e+06
+66.53e+06
+62.12e+06
+57.72e+06
+53.31e+06
+48.90e+06
+44.50e+06
+40.09e+06
Von Mises stress
[Pa]
LVE model
Linear elastic Linear viscoelastic

Finite element model (10)
32
Number of occurrences of von Mises stress ≥ the yield stress in
single location
LE model LVE model
1 2 3 4 5 6 7 8+ 1 2 3 4 5 6 7 8+
Locations where the Von Mises stress exceeds the
UHWMPE yield stress for the linear elastic model (top
left), linear viscoelastic model (top right), and for both
models superimposed for comparison (bottom)
• The locations at which the von
Mises stress exceeds the yield
stress for each of the 20 output
frames overlaps by 81% between
simulations using linear elastic
and linear viscoelastic models
• LE versus LVE, overall: similar
magnitudes and locations for
maximum von Mises stress, but
differences demonstrate that
material model has a substantial
effect on UHMWPE response to
conditions imposed by the knee
simulator
Overview
1. Knee simulator wear testing- Tibial insert wear testing using a gait-mimicking knee simulator
2. Subsurface fatigue crack damage measurement- Novel trans-illumination method tested on two tibial inserts
3. Finite element modeling of knee simulator testing- Two applicable polyethylene material models
4. Comparison between experimentally determined fatigue crack damage and high stress locations in finite element model
5. Conclusions
3
3

34
Finite element model versus experimental results
+79.75e+06+75.34e+06+70.94e+06+66.53e+06+62.12e+06+57.72e+06+53.31e+06+48.90e+06+44.50e+06+40.09e+06
Experimentally measured fatigue
crack damage contour
Von Mises stress
[Pa]
Maximum von
Mises stress
locations
• How do the locations of maximum stress compare to the location of
fatigue crack damage?*
• Highest von Mises stress maxima are located away from (> 5mm
lateral to) fatigue crack damage
Linear viscoelastic
35
Medial
condyle
Experimentally measured
fatigue crack damage
contour
Number of occurrences of von Mises stress exceeds the yield stress in a single location
1 2 3 4 5 6 7 8+
LVE material
model
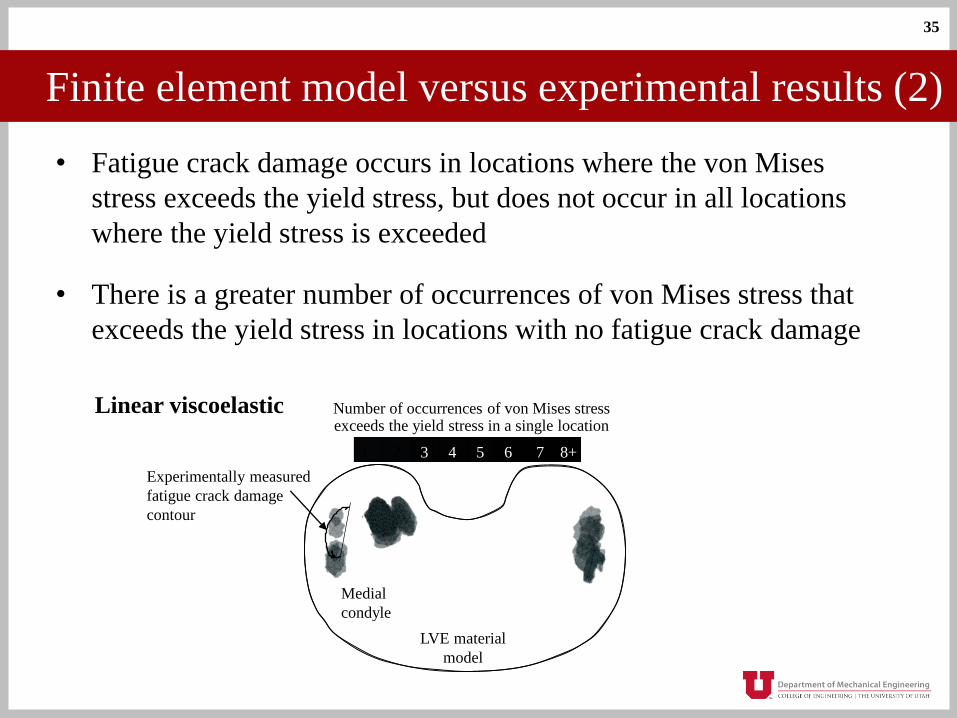
Finite element model versus experimental results (2)
• Fatigue crack damage occurs in locations where the von Mises
stress exceeds the yield stress, but does not occur in all locations
where the yield stress is exceeded
• There is a greater number of occurrences of von Mises stress that
exceeds the yield stress in locations with no fatigue crack damage
Linear viscoelastic
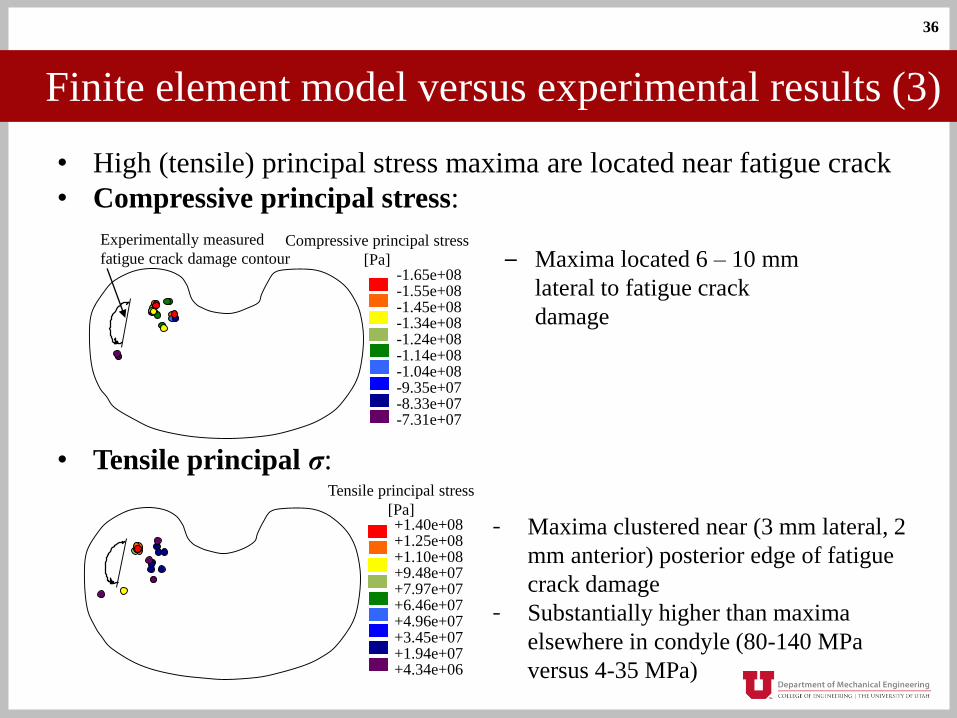
• High (tensile) principal stress maxima are located near fatigue crack
• Compressive principal stress:
• Tensile principal σ:
Finite element model versus experimental results (3)
36
Compressive principal stress
[Pa]-1.65e+08-1.55e+08-1.45e+08-1.34e+08-1.24e+08-1.14e+08-1.04e+08-9.35e+07-8.33e+07-7.31e+07
Experimentally measured
fatigue crack damage contour
+1.40e+08+1.25e+08+1.10e+08+9.48e+07+7.97e+07+6.46e+07+4.96e+07+3.45e+07+1.94e+07+4.34e+06
Tensile principal stress
[Pa]
– Maxima located 6 – 10 mm
lateral to fatigue crack
damage
- Maxima clustered near (3 mm lateral, 2
mm anterior) posterior edge of fatigue
crack damage
- Substantially higher than maxima
elsewhere in condyle (80-140 MPa
versus 4-35 MPa)

Finite element model versus experimental results (4)
37
Shear stress, x-z[Pa]
+2.06e+07+1.89e+07+1.73e+07+1.56e+07+1.40e+07+1.23e+07+1.06e+07+0.90e+06+0.73e+06+0.56e+06
Shear stress, y-z[Pa]
+2.65e+07+2.47e+07+2.30e+07+2.12e+07+1.95e+07+1.77e+07+1.60e+07+1.42e+07+1.25e+07+1.07e+07
Shear stress, x-y[Pa]
+4.98e+07+3.86e+07+3.60e+07+3.33e+07+3.07e+07+2.82e+07+2.54e+07+2.27e+07+2.01e+07+1.74e+07+1.48e+07
Experimentally measured
fatigue crack damage
contour
• High x-y and x-z shear stress
maxima are located near fatigue
crack damage
• x-y and x-z shear stress: - Maxima are clustered within ≤ 5
mm from the fatigue crack damage
• y-z shear stress: - Maxima are spread over the
posterior portion of medial condyle
Shear stress maxima for each output frame of the stance
phase simulation for the linear viscoelastic material model
with fatigue crack damage superimposed.

Overview
1. Knee simulator wear testing- Tibial insert wear testing using a gait-mimicking knee simulator
2. Subsurface fatigue crack damage measurement- Novel trans-illumination method tested on two tibial inserts
3. Finite element modeling of knee simulator testing- Two applicable polyethylene material models
4. Comparison between experimentally determined fatigue crack damage and high stress locations in finite element model
5. Conclusions
3
8

Conclusions
• Experimental (fatigue crack damage measurement):
1. Trans-illumination technique allows precise (1 mm2 resolution),
measurement of fatigue crack damage
2. Reduces subjectivity present compared to using other methods
(e.g. hand tracing)
3. Accuracy evaluated qualitatively only – would be beneficial to confirm
via other methods (micro-CT, thin-slice microscopy)
39

Conclusions (2)
• Finite element model:
1. Linear elastic, Linear viscoelastic material models result in different
von Mises stress results
• RMS difference of only ~3%, but maximum difference up to 21% (lateral
condyle)
• Material model is important for conditions seen in knee simulator testing
2. Von Mises stress maxima are insufficient for predicting fatigue crack
damage location
3. Maximum tensile stress, shear stress locations are predictive of the
location of fatigue crack damage
• Located < 3 mm and ≤ 5 mm respectively from experimentally
determined fatigue crack damage contour
40