Effects of Aggregate Angularity on Mix Design Characteristics and ...
Upload
nguyendungCategory
view
241download
0
SPEC
IAL
REPO
RT98
-1
Quantification of Shape,Angularity, and Surface Textureof Base Course MaterialsVincent C. Janoo January 1998

Abstract: A state-of-the-art review was conducted to de-termine existing test methods for characterizing theshape, angularity, and surface texture of coarse aggre-gates. The review found direct methods used by geolo-gists to determine these characteristics. These methodsinvolve physical measurements of individual aggregatesand are very laborious and time consuming. Engineershave developed index tests (indirect methods) to quan-tify the combined effect of the shape, angularity, and sur-
How to get copies of CRREL technical publications:
Department of Defense personnel and contractors may order reports through the Defense Technical Information Center:DTIC-BR SUITE 09448725 JOHN J KINGMAN RDFT BELVOIR VA 22060-6218Telephone 1 800 225 3842E-mail [email protected]
[email protected] http://www.dtic.dla.mil/
All others may order reports through the National Technical Information Service:NTIS5285 PORT ROYAL RDSPRINGFIELD VA 22161Telephone 1 703 487 4650
1 703 487 4639 (TDD for the hearing-impaired)E-mail [email protected] http://www.fedworld.gov/ntis/ntishome.html
A complete list of all CRREL technical publications is available from:USACRREL (CECRL-LP)72 LYME RDHANOVER NH 03755-1290Telephone 1 603 646 4338E-mail [email protected]
For information on all aspects of the Cold Regions Research and Engineering Laboratory, visit our World Wide Web site:http://www.crrel.usace.army.mil
face texture of coarse aggregates in terms of changesin the voids in the aggregate bulk. A description of boththe direct and indirect methods is provided in thereport. Also, the effect of shape, angularity, and surfacetexture of coarse aggregates on the base course perfor-mance was reviewed. It was found that there is somecontradiction in the published data on resilient modu-lus. Shape, angularity, and surface texture of coarseaggregates clearly influence the angle of internal friction.
Special Report 98-1
Quantification of Shape,Angularity, and Surface Textureof Base Course MaterialsVincent C. Janoo January 1998
Prepared for
STATE OF VERMONT AGENCY OF TRANSPORTATION
Approved for public release; distribution is unlimited.
US Army Corpsof Engineers®
Cold Regions Research &Engineering Laboratory

PREFACE
This report was prepared by Dr. Vincent C. Janoo, Research Civil Engineer, Civil Engi-neering Research Division, Research and Engineering Directorate, U.S. Army Cold RegionsResearch and Engineering Laboratory. Funding was provided by the State of VermontAgency of Transportation.
Technical review of this report was provided by Christopher Benda, P.E., State of Ver-mont Agency of Transportation, and by Andrew Dawson, University of Nottingham,United Kingdom. The author especially thanks Lynette Barna, Sherri Orchino, and TimBaldwin for assistance in finding the reports and papers needed for this review, and alsothanks Gioia Cattabriga for editing the report.
The contents of this report are not to be used for advertising or promotional purposes.Citation of brand names does not constitute an official endorsement or approval of the useof such commercial products.
ii
iii
CONTENTS
Preface ........................................................................................................................................... iiIntroduction .................................................................................................................................. 1Characterization of coarse aggregate shape, angularity, and surface roughness ............. 1
Petrological methods.............................................................................................................. 1Determination of aggregate characteristics using image analysis ................................. 5Determination of aggregate characteristics from indirect methods ............................... 9
Laboratory response of angular material ................................................................................ 16Summary and conclusions ......................................................................................................... 20Recommendations ....................................................................................................................... 20Literature cited ............................................................................................................................. 21Abstract ......................................................................................................................................... 23
ILLUSTRATIONS
Figure1. Aggregate classification chart ............................................................................................ 22. Roundness chart for 16- to 32-mm aggregates ................................................................ 33. Parameters for determining the degree of angularity .................................................... 34. Degree of angularity chart .................................................................................................. 45. Visual identification of aggregate angularity .................................................................. 46. Measurement method for characterizing the surface texture of an aggregate .......... 47. Image of the Pike crushed stone prior to image analysis .............................................. 58. Image of the crushed stone prior to image analysis ....................................................... 59. Image of the crushed gravel prior to image analysis ..................................................... 5
10. Material characterization using image analysis .............................................................. 611. Definition of roughness and roundness ........................................................................... 612. Relationship between mean aggregate diameter and porosity .................................... 1013. Packing volume, packing porosity, and geometric irregularity of aggregate
particles ........................................................................................................................... 1314. Schematic description of the pouring device .................................................................. 1415. Packing specific gravity and rugosity for different aggregates .................................... 1416. Test apparatus for ASTM C 1252 and modified ASTM C 1252 ..................................... 1517. QMOT time index test apparatus ...................................................................................... 1518. Effect of crushed particles on cyclic creep strain ............................................................ 1719. Effect of combined sphericity and angularity on cyclic creep of base course
materials ......................................................................................................................... 1720. Effect of sphericity and angularity on the angle of internal friction ........................... 1821. Shape classification of aggregates ..................................................................................... 1822. Influence of material type and state of stress on resilient modulus ............................ 1923. Influence of material type, stress level, and percent fines on plastic strain ............... 20
iv
TABLES
Table1. Description of aggregate shape.......................................................................................... 22. Criteria for describing particle shape ............................................................................... 23. Criteria for describing angularity of coarse-grained particles ..................................... 44. Image analysis results for crushed gravel ........................................................................ 75. Image analysis results for crushed stone ......................................................................... 86. Image analysis results for Pike crushed stone ................................................................. 87. Mean and variance of roughness and roundness values from image analysis ......... 98. Value of shape factor for various materials ..................................................................... 109. Results of particle index tests for various aggregates .................................................... 11
10. Mold size and dimensions of tamping rods for the particle index test ....................... 1211. Dimensions of mold and tamping rods ............................................................................ 1212. Specific setups for coarse fractions for the pouring test ................................................ 1413. Average flow coefficients for Vermont subbase materials ............................................ 1514. Summary of factors affecting φ .......................................................................................... 1615. Gradation of test aggregates ............................................................................................... 1716. AIF values of test aggregates ............................................................................................. 19
INTRODUCTION
The base course layer is identified as that un-bound layer between the surface course (asphaltconcrete or portland cement concrete) and thesubgrade. This layer is sometimes subdividedinto two parts: the upper layer, called the base,and the bottom, the subbase. The base is usuallyconstructed with coarse gravel or crushed stone,and the subbase with either gravel or sand. Sever-al factors affect the performance of these layers.The common factors usually cited are gradation,degree of compaction, amount of fines, moisturecontent, and permeability. The shape, angularity,and surface texture of the aggregates also have asignificant effect on the engineering response ofthe layer.
Quantification of the shape, angularity, andsurface texture of aggregates is difficult but notimpossible. There are several methods that in-volve either direct measurement of the aggre-gates or indirect inference from aggregate proper-ties. For example, geologists have developed asophisticated system that involves physical mea-surements of the aggregates, and engineers havedeveloped visual classification methods for char-acterization, shape, and angularity or index teststhat use some engineering properties, such as po-rosity, to speculate on the shape, angularity, andsurface texture of aggregates. However, none ofthe index tests developed by engineers make itpossible to quantify separately the shape, angu-larity, or surface texture. Usually these character-istics are lumped together as geometric irregular-ities.
This report reviews test methods currentlyavailable to quantify the aggregate geometric
Quantification of Shape, Angularity, andSurface Texture of Base Course Materials
VINCENT C. JANOO
irregularities and the effect of these irregularitieson the performance of base course materials. Asummary of the methods used by geologists todescribe aggregates has been included. Eventhough these methods may not be practical foreveryday engineering work, they have been usedby researchers for quantifying base course perfor-mance (Barksdale and Itani 1994). A review ofcurrent methods used by engineers, including adiscussion on the usage of image analysis for de-scribing particle shape and roughness, is also pre-sented.
CHARACTERIZATION OF COARSEAGGREGATE SHAPE, ANGULARITY,AND SURFACE ROUGHNESS
The description of the aggregate particles canbe conducted directly using petrological methodsor by using image analysis. The effect of particleshape, angularity, and surface texture on theengineering properties can also be inferred.
Petrological methodsThe shape of the aggregate can be described by
its length, width, thickness, sphericity, round-ness, and angularity. The surface texture is diffi-cult to quantify and several visual charts andsome sophisticated test methods have been pro-posed. A description of these methods is presentedbelow.
Description of aggregate shapeSedimentary petrologists have described the
shape of particles using methods developed aslong ago as 1930. The description involves mea-
surement of the aggregate dimensions (shortest,intermediate, and longest lengths). Based onthese lengths, the shape of the aggregate is quan-tified in terms of both the flatness and elongationratios or by the shape factor. The flatness ratio (p)is the ratio of the short length to intermediatelength, and the elongation ratio (q) is the ratio ofthe intermediate length to the longest length.
An alternate method for describing the shapeof the aggregate involves the shape factor (F) andsphericity (ψ) of the aggregate particles. Theshape factor (F) is the ratio of the elongation ratio(q) and the flatness ratio (p), i.e.,
F
pq
= .
A shape factor equal to 1 represents a roundedor cubic aggregate. Smaller than 1, the particletends towards being elongated and thin.Blade-shaped materials have a shape factorgreater than 1.
The sphericity (ψ) is defined as the ratio ofthe surface area of a sphere having the samevolume as the particle in question to the sur-face area of the particle. The sphericity can alsobe determined from the flatness and elonga-tion ratios as shown below:
Ψ =
+ + + + +( )12 8
1 1 6 1 1
23
2 2
.
( ).
p q
p q p q
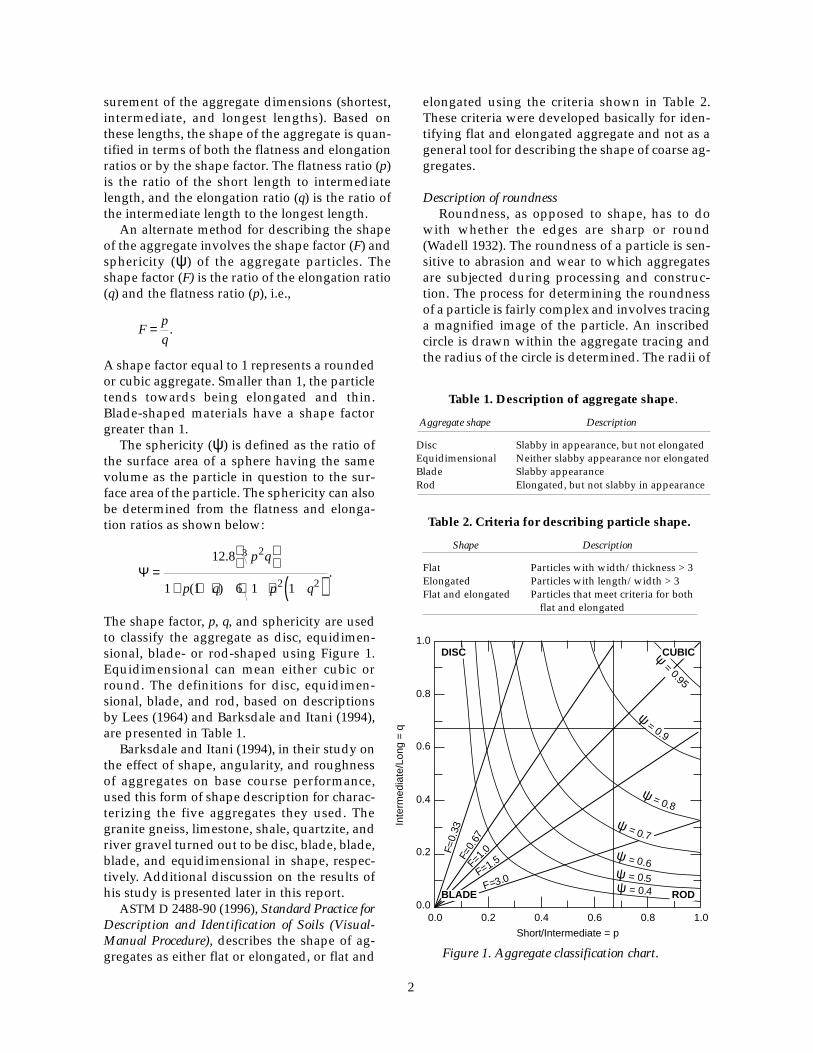
The shape factor, p, q, and sphericity are usedto classify the aggregate as disc, equidimen-sional, blade- or rod-shaped using Figure 1.Equidimensional can mean either cubic orround. The definitions for disc, equidimen-sional, blade, and rod, based on descriptionsby Lees (1964) and Barksdale and Itani (1994),are presented in Table 1.
Barksdale and Itani (1994), in their study onthe effect of shape, angularity, and roughnessof aggregates on base course performance,used this form of shape description for charac-terizing the five aggregates they used. Thegranite gneiss, limestone, shale, quartzite, andriver gravel turned out to be disc, blade, blade,blade, and equidimensional in shape, respec-tively. Additional discussion on the results ofhis study is presented later in this report.
ASTM D 2488-90 (1996), Standard Practice forDescription and Identification of Soils (Visual-Manual Procedure), describes the shape of ag-gregates as either flat or elongated, or flat and
elongated using the criteria shown in Table 2.These criteria were developed basically for iden-tifying flat and elongated aggregate and not as ageneral tool for describing the shape of coarse ag-gregates.
Description of roundnessRoundness, as opposed to shape, has to do
with whether the edges are sharp or round(Wadell 1932). The roundness of a particle is sen-sitive to abrasion and wear to which aggregatesare subjected during processing and construc-tion. The process for determining the roundnessof a particle is fairly complex and involves tracinga magnified image of the particle. An inscribedcircle is drawn within the aggregate tracing andthe radius of the circle is determined. The radii of
2
Table 2. Criteria for describing particle shape.
Shape Description
Flat Particles with width/thickness > 3Elongated Particles with length/width > 3Flat and elongated Particles that meet criteria for both
flat and elongated
0.8
1.0
0.6
0.4
0.2
0.00.80.0 0.2 0.4 0.6 1.0
Inte
rmed
iate
/Lon
g =
q
Short/Intermediate = p
F=0.
33F=
0.67
F=1.0
F=1.5
F=3.0 ψ = 0.4
ψ = 0.5
ψ = 0.6
ψ = 0.8
ψ = 0.9
ψ = 0.95
DISC
RODBLADE
CUBIC
ψ = 0.7
Figure 1. Aggregate classification chart.
Table 1. Description of aggregate shape.
Aggregate shape Description
Disc Slabby in appearance, but not elongatedEquidimensional Neither slabby appearance nor elongatedBlade Slabby appearanceRod Elongated, but not slabby in appearance
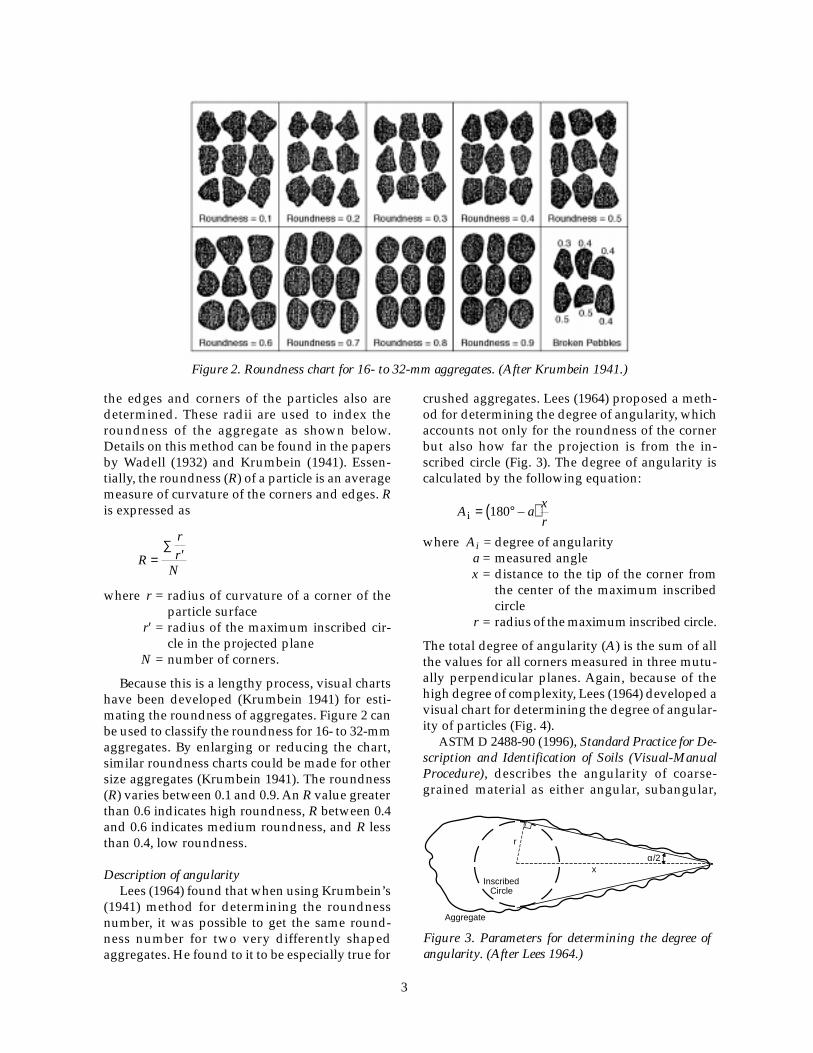
Figure 2. Roundness chart for 16- to 32-mm aggregates. (After Krumbein 1941.)
the edges and corners of the particles also aredetermined. These radii are used to index theroundness of the aggregate as shown below.Details on this method can be found in the papersby Wadell (1932) and Krumbein (1941). Essen-tially, the roundness (R) of a particle is an averagemeasure of curvature of the corners and edges. Ris expressed as
R
rr
N= ′
∑
where r = radius of curvature of a corner of theparticle surface
r′ = radius of the maximum inscribed cir-cle in the projected plane
N = number of corners.
Because this is a lengthy process, visual chartshave been developed (Krumbein 1941) for esti-mating the roundness of aggregates. Figure 2 canbe used to classify the roundness for 16- to 32-mmaggregates. By enlarging or reducing the chart,similar roundness charts could be made for othersize aggregates (Krumbein 1941). The roundness(R) varies between 0.1 and 0.9. An R value greaterthan 0.6 indicates high roundness, R between 0.4and 0.6 indicates medium roundness, and R lessthan 0.4, low roundness.
Description of angularityLees (1964) found that when using Krumbein’s
(1941) method for determining the roundnessnumber, it was possible to get the same round-ness number for two very differently shapedaggregates. He found to it to be especially true for
crushed aggregates. Lees (1964) proposed a meth-od for determining the degree of angularity, whichaccounts not only for the roundness of the cornerbut also how far the projection is from the in-scribed circle (Fig. 3). The degree of angularity iscalculated by the following equation:
A a
xri = °( )180 –
where Ai = degree of angularitya = measured anglex = distance to the tip of the corner from
the center of the maximum inscribedcircle
r = radius of the maximum inscribed circle.
The total degree of angularity (A) is the sum of allthe values for all corners measured in three mutu-ally perpendicular planes. Again, because of thehigh degree of complexity, Lees (1964) developed avisual chart for determining the degree of angular-ity of particles (Fig. 4).
ASTM D 2488-90 (1996), Standard Practice for De-scription and Identification of Soils (Visual-ManualProcedure), describes the angularity of coarse-grained material as either angular, subangular,
r
α/2x
Aggregate
InscribedCircle
Figure 3. Parameters for determining the degree ofangularity. (After Lees 1964.)
3
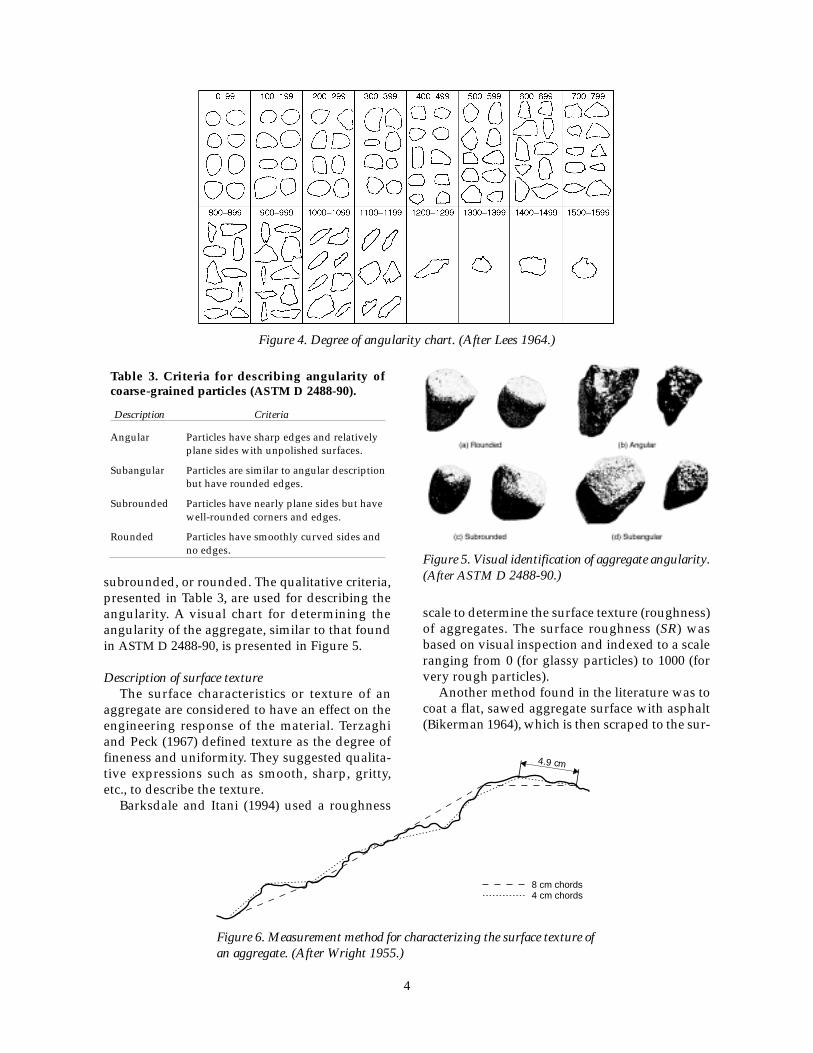
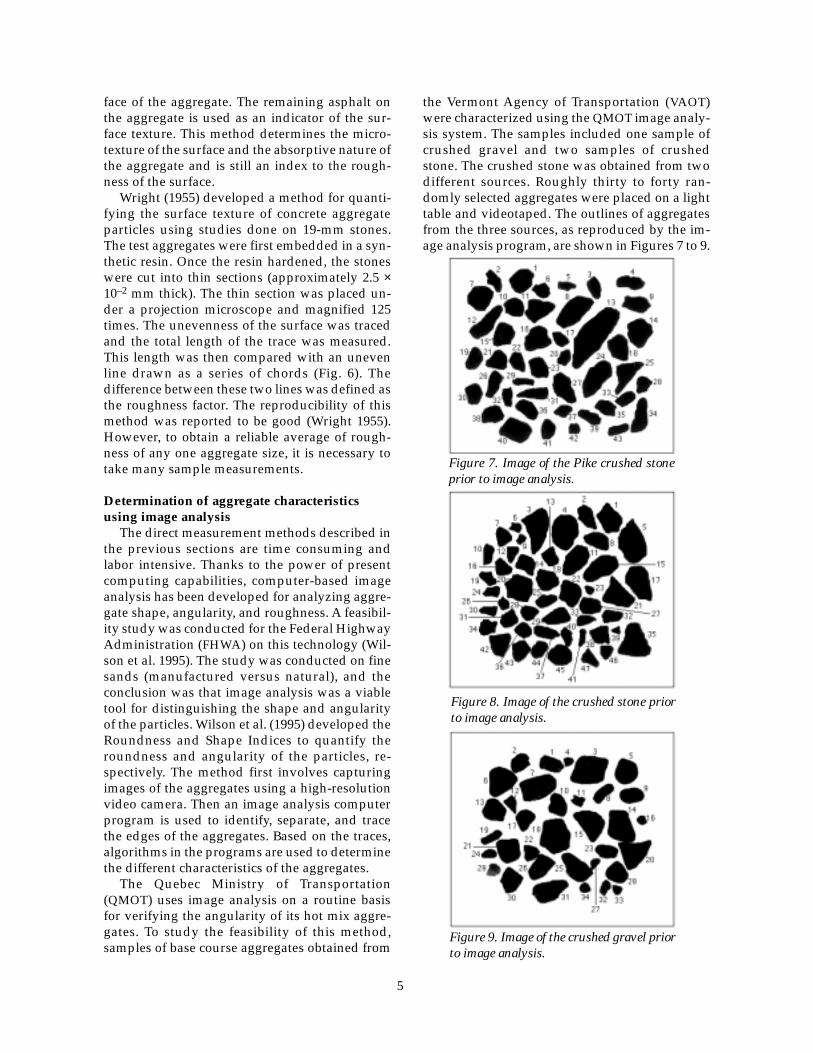
subrounded, or rounded. The qualitative criteria,presented in Table 3, are used for describing theangularity. A visual chart for determining theangularity of the aggregate, similar to that foundin ASTM D 2488-90, is presented in Figure 5.
Description of surface textureThe surface characteristics or texture of an
aggregate are considered to have an effect on theengineering response of the material. Terzaghiand Peck (1967) defined texture as the degree offineness and uniformity. They suggested qualita-tive expressions such as smooth, sharp, gritty,etc., to describe the texture.
Barksdale and Itani (1994) used a roughness
4
Figure 4. Degree of angularity chart. (After Lees 1964.)
Table 3. Criteria for describing angularity ofcoarse-grained particles (ASTM D 2488-90).
Description Criteria
Angular Particles have sharp edges and relativelyplane sides with unpolished surfaces.
Subangular Particles are similar to angular descriptionbut have rounded edges.
Subrounded Particles have nearly plane sides but havewell-rounded corners and edges.
Rounded Particles have smoothly curved sides andno edges.
8 cm chords4 cm chords
4.9 cm
Figure 5. Visual identification of aggregate angularity.(After ASTM D 2488-90.)
Figure 6. Measurement method for characterizing the surface texture ofan aggregate. (After Wright 1955.)
scale to determine the surface texture (roughness)of aggregates. The surface roughness (SR) wasbased on visual inspection and indexed to a scaleranging from 0 (for glassy particles) to 1000 (forvery rough particles).
Another method found in the literature was tocoat a flat, sawed aggregate surface with asphalt(Bikerman 1964), which is then scraped to the sur-
face of the aggregate. The remaining asphalt onthe aggregate is used as an indicator of the sur-face texture. This method determines the micro-texture of the surface and the absorptive nature ofthe aggregate and is still an index to the rough-ness of the surface.
Wright (1955) developed a method for quanti-fying the surface texture of concrete aggregateparticles using studies done on 19-mm stones.The test aggregates were first embedded in a syn-thetic resin. Once the resin hardened, the stoneswere cut into thin sections (approximately 2.5 ×10⁻² mm thick). The thin section was placed un-der a projection microscope and magnified 125times. The unevenness of the surface was tracedand the total length of the trace was measured.This length was then compared with an unevenline drawn as a series of chords (Fig. 6). Thedifference between these two lines was defined asthe roughness factor. The reproducibility of thismethod was reported to be good (Wright 1955).However, to obtain a reliable average of rough-ness of any one aggregate size, it is necessary totake many sample measurements.
Determination of aggregate characteristicsusing image analysis
The direct measurement methods described inthe previous sections are time consuming andlabor intensive. Thanks to the power of presentcomputing capabilities, computer-based imageanalysis has been developed for analyzing aggre-gate shape, angularity, and roughness. A feasibil-ity study was conducted for the Federal HighwayAdministration (FHWA) on this technology (Wil-son et al. 1995). The study was conducted on finesands (manufactured versus natural), and theconclusion was that image analysis was a viabletool for distinguishing the shape and angularityof the particles. Wilson et al. (1995) developed theRoundness and Shape Indices to quantify theroundness and angularity of the particles, re-spectively. The method first involves capturingimages of the aggregates using a high-resolutionvideo camera. Then an image analysis computerprogram is used to identify, separate, and tracethe edges of the aggregates. Based on the traces,algorithms in the programs are used to determinethe different characteristics of the aggregates.
The Quebec Ministry of Transportation(QMOT) uses image analysis on a routine basisfor verifying the angularity of its hot mix aggre-gates. To study the feasibility of this method,samples of base course aggregates obtained from
the Vermont Agency of Transportation (VAOT)were characterized using the QMOT image analy-sis system. The samples included one sample ofcrushed gravel and two samples of crushedstone. The crushed stone was obtained from twodifferent sources. Roughly thirty to forty ran-domly selected aggregates were placed on a lighttable and videotaped. The outlines of aggregatesfrom the three sources, as reproduced by the im-age analysis program, are shown in Figures 7 to 9.
Figure 7. Image of the Pike crushed stoneprior to image analysis.
Figure 9. Image of the crushed gravel priorto image analysis.
Figure 8. Image of the crushed stone priorto image analysis.
5
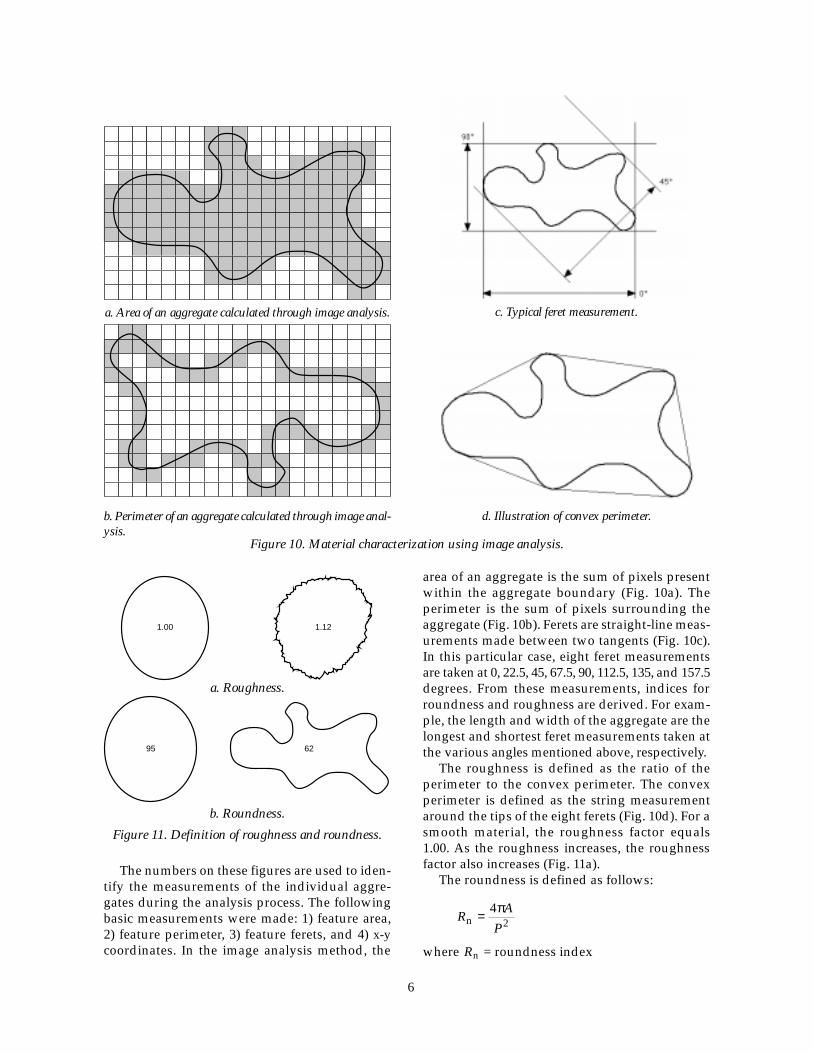
The numbers on these figures are used to iden-tify the measurements of the individual aggre-gates during the analysis process. The followingbasic measurements were made: 1) feature area,2) feature perimeter, 3) feature ferets, and 4) x-ycoordinates. In the image analysis method, the
6
1.00 1.12
95 62
Figure 11. Definition of roughness and roundness.
a. Roughness.
b. Roundness.
Figure 10. Material characterization using image analysis.
a. Area of an aggregate calculated through image analysis.
b. Perimeter of an aggregate calculated through image anal-ysis.
c. Typical feret measurement.
d. Illustration of convex perimeter.
area of an aggregate is the sum of pixels presentwithin the aggregate boundary (Fig. 10a). Theperimeter is the sum of pixels surrounding theaggregate (Fig. 10b). Ferets are straight-line meas-urements made between two tangents (Fig. 10c).In this particular case, eight feret measurementsare taken at 0, 22.5, 45, 67.5, 90, 112.5, 135, and 157.5degrees. From these measurements, indices forroundness and roughness are derived. For exam-ple, the length and width of the aggregate are thelongest and shortest feret measurements taken atthe various angles mentioned above, respectively.
The roughness is defined as the ratio of theperimeter to the convex perimeter. The convexperimeter is defined as the string measurementaround the tips of the eight ferets (Fig. 10d). For asmooth material, the roughness factor equals1.00. As the roughness increases, the roughnessfactor also increases (Fig. 11a).
The roundness is defined as follows:
R
A
Pn = 4
2π
where Rn = roundness index
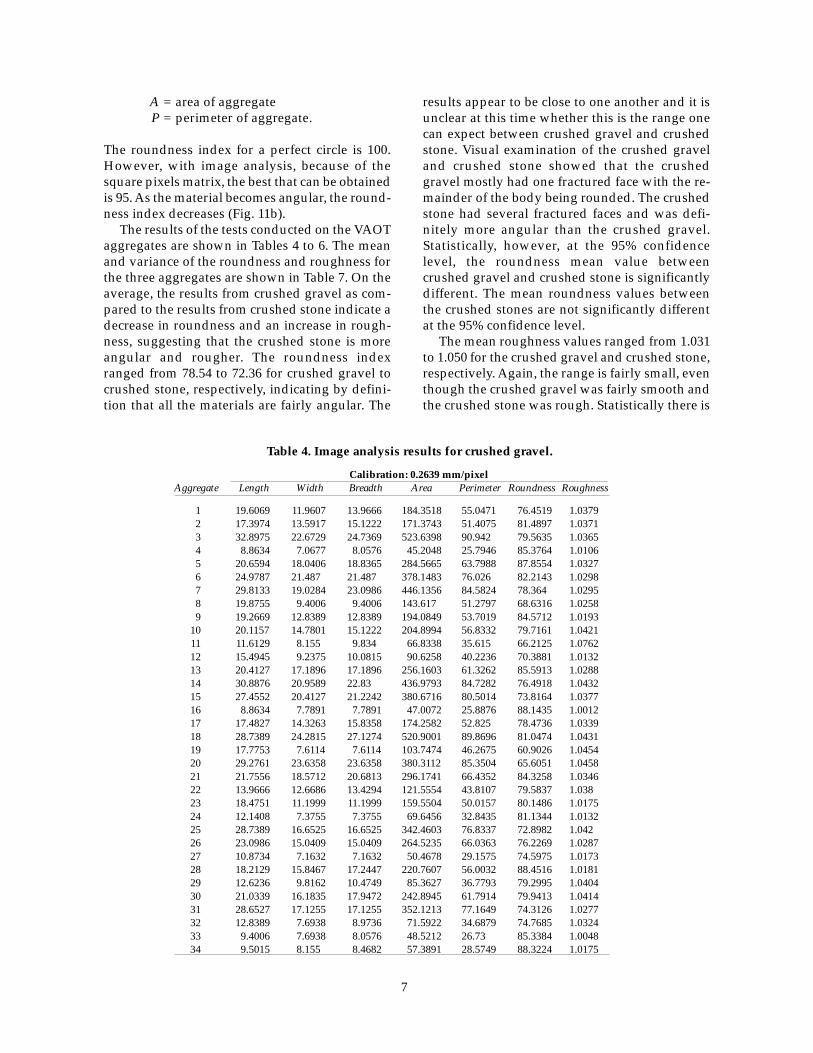
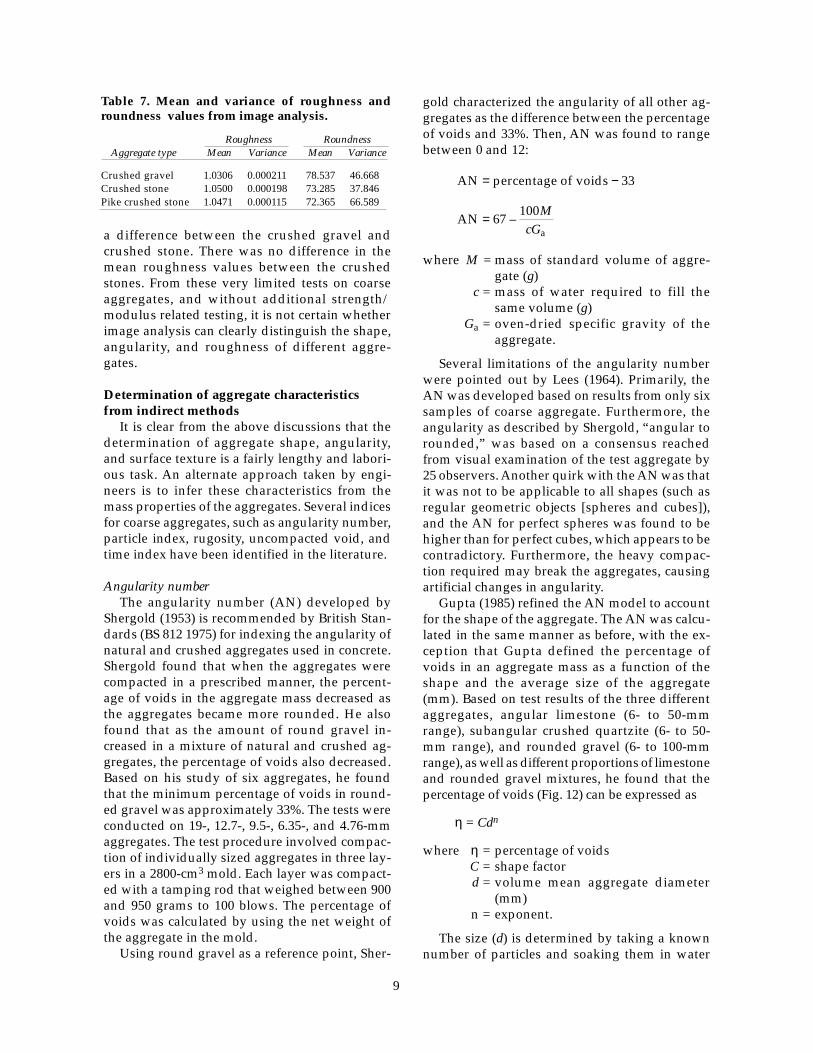
Table 4. Image analysis results for crushed gravel.
Calibration: 0.2639 mm/pixelAggregate Length Width Breadth Area Perimeter Roundness Roughness
1 19.6069 11.9607 13.9666 184.3518 55.0471 76.4519 1.03792 17.3974 13.5917 15.1222 171.3743 51.4075 81.4897 1.03713 32.8975 22.6729 24.7369 523.6398 90.942 79.5635 1.03654 8.8634 7.0677 8.0576 45.2048 25.7946 85.3764 1.01065 20.6594 18.0406 18.8365 284.5665 63.7988 87.8554 1.03276 24.9787 21.487 21.487 378.1483 76.026 82.2143 1.02987 29.8133 19.0284 23.0986 446.1356 84.5824 78.364 1.02958 19.8755 9.4006 9.4006 143.617 51.2797 68.6316 1.02589 19.2669 12.8389 12.8389 194.0849 53.7019 84.5712 1.0193
10 20.1157 14.7801 15.1222 204.8994 56.8332 79.7161 1.042111 11.6129 8.155 9.834 66.8338 35.615 66.2125 1.076212 15.4945 9.2375 10.0815 90.6258 40.2236 70.3881 1.013213 20.4127 17.1896 17.1896 256.1603 61.3262 85.5913 1.028814 30.8876 20.9589 22.83 436.9793 84.7282 76.4918 1.043215 27.4552 20.4127 21.2242 380.6716 80.5014 73.8164 1.037716 8.8634 7.7891 7.7891 47.0072 25.8876 88.1435 1.001217 17.4827 14.3263 15.8358 174.2582 52.825 78.4736 1.033918 28.7389 24.2815 27.1274 520.9001 89.8696 81.0474 1.043119 17.7753 7.6114 7.6114 103.7474 46.2675 60.9026 1.045420 29.2761 23.6358 23.6358 380.3112 85.3504 65.6051 1.045821 21.7556 18.5712 20.6813 296.1741 66.4352 84.3258 1.034622 13.9666 12.6686 13.4294 121.5554 43.8107 79.5837 1.03823 18.4751 11.1999 11.1999 159.5504 50.0157 80.1486 1.017524 12.1408 7.3755 7.3755 69.6456 32.8435 81.1344 1.013225 28.7389 16.6525 16.6525 342.4603 76.8337 72.8982 1.04226 23.0986 15.0409 15.0409 264.5235 66.0363 76.2269 1.028727 10.8734 7.1632 7.1632 50.4678 29.1575 74.5975 1.017328 18.2129 15.8467 17.2447 220.7607 56.0032 88.4516 1.018129 12.6236 9.8162 10.4749 85.3627 36.7793 79.2995 1.040430 21.0339 16.1835 17.9472 242.8945 61.7914 79.9413 1.041431 28.6527 17.1255 17.1255 352.1213 77.1649 74.3126 1.027732 12.8389 7.6938 8.9736 71.5922 34.6879 74.7685 1.032433 9.4006 7.6938 8.0576 48.5212 26.73 85.3384 1.004834 9.5015 8.155 8.4682 57.3891 28.5749 88.3224 1.0175
A = area of aggregateP = perimeter of aggregate.
The roundness index for a perfect circle is 100.However, with image analysis, because of thesquare pixels matrix, the best that can be obtainedis 95. As the material becomes angular, the round-ness index decreases (Fig. 11b).
The results of the tests conducted on the VAOTaggregates are shown in Tables 4 to 6. The meanand variance of the roundness and roughness forthe three aggregates are shown in Table 7. On theaverage, the results from crushed gravel as com-pared to the results from crushed stone indicate adecrease in roundness and an increase in rough-ness, suggesting that the crushed stone is moreangular and rougher. The roundness indexranged from 78.54 to 72.36 for crushed gravel tocrushed stone, respectively, indicating by defini-tion that all the materials are fairly angular. The
results appear to be close to one another and it isunclear at this time whether this is the range onecan expect between crushed gravel and crushedstone. Visual examination of the crushed graveland crushed stone showed that the crushedgravel mostly had one fractured face with the re-mainder of the body being rounded. The crushedstone had several fractured faces and was defi-nitely more angular than the crushed gravel.Statistically, however, at the 95% confidencelevel, the roundness mean value betweencrushed gravel and crushed stone is significantlydifferent. The mean roundness values betweenthe crushed stones are not significantly differentat the 95% confidence level.
The mean roughness values ranged from 1.031to 1.050 for the crushed gravel and crushed stone,respectively. Again, the range is fairly small, eventhough the crushed gravel was fairly smooth andthe crushed stone was rough. Statistically there is
7

8
Tab
le 5
. Im
age
anal
ysis
res
ult
s fo
r cr
ush
ed s
ton
e.
Cal
ibra
tion
: 0.2
294
mm
/pix
elA
ggre
gate
Leng
thW
idth
Bre
adth
Are
aP
erim
eter
Rou
ndne
ssR
ough
ness
121
.260
415
.677
515
.677
523
2.64
963
.099
673
.427
21.
0578
218
.905
911
.066
411
.670
314
2.26
851
.434
67.5
796
1.06
243
31.5
722
18.8
073
18.8
073
355.
915
85.4
471
61.2
578
1.07
044
24.9
255
18.5
7818
.578
349.
272
73.4
803
81.2
889
1.05
45
30.3
853
18.6
746
20.1
835
404.
154
82.9
949
73.7
316
1.05
986
9.56
966.
8506
8.63
648
.402
628
.807
73.2
963
1.04
927
14.0
057
11.2
385
11.2
385
110.
254
43.5
542
73.0
368
1.06
798
18.9
059
11.3
389
13.7
7115
6.53
352
.729
170
.748
1.05
529
7.60
826.
4554
7.08
6834
.355
523
.198
580
.220
91.
0199
1015
.118
58.
7156
9.45
2696
.533
142
.223
768
.041
31.
0606
1124
.741
14.9
3814
.938
263.
574
67.8
068
72.0
387
1.06
5712
12.9
925
9.45
269.
4526
77.1
502
37.4
273
69.2
103
1.03
813
14.4
805
10.1
442
12.3
853
112.
431
43.2
809
75.4
231
1.04
6814
16.7
721
11.8
113
13.8
331
134.
809
47.7
635
74.2
566
1.04
3515
26.1
415
14.6
461
15.8
716
290.
797
70.6
654
73.1
791.
0426
1613
.304
111
.436
911
.436
910
5.57
140
.615
280
.422
71.
0317
1726
.929
917
.060
817
.060
831
5.02
674
.082
872
.130
91.
053
1817
.038
614
.755
314
.938
175.
317
52.3
988
80.2
398
1.04
7319
13.8
331
8.63
69.
6853
80.6
892
37.4
2272
.405
61.
0453
2021
.732
918
.189
519
.827
428
0.94
269
.035
374
.077
11.
0717
2124
.095
117
.272
20.9
801
272.
666
72.2
669
65.6
091.
0694
2219
.843
15.8
257
16.1
386
206.
896
57.8
413
77.7
113
1.05
5223
8.40
266.
1419
6.30
235
.172
223
.407
80.6
712
1.01
6624
13.6
025
8.54
599.
2128
74.4
279
37.2
186
67.5
191
1.04
8325
14.9
858
9.21
289.
2128
98.1
665
41.7
519
70.7
655
1.05
7726
10.2
076
8.06
938.
4862
56.8
418
29.9
594
79.5
815
1.04
0227
15.6
382
11.6
319
14.4
712
141.
233
46.6
503
81.5
526
1.03
2828
13.0
734
10.6
823
10.6
823
96.7
509
38.9
508
80.1
367
1.03
9429
19.7
248
11.8
113
13.0
562
163.
012
53.9
461
70.3
897
1.04
1430
12.6
803
7.59
639.
2128
67.4
588
35.3
028
68.0
188
1.04
131
14.4
098
10.7
367
11.5
275
110.
199
41.9
611
78.6
491.
0484
3214
.755
39.
258
10.3
9410
2.35
941
.700
673
.969
21.
0366
3313
.833
17.
7955
7.79
5573
.502
338
.041
63.8
273
1.06
3934
14.0
044
11.3
945
12.8
373
106.
551
42.4
731
74.2
231
1.06
1835
25.9
849
21.9
023
21.9
023
360.
488
81.5
685
68.0
858
1.06
9636
12.2
192
10.3
9410
.394
93.8
108
36.6
085
87.9
627
1.01
9537
18.2
135
9.21
289.
2128
116.
842
46.6
123
67.5
781.
042
3815
.677
513
.056
214
.173
613
7.09
648
.326
273
.767
91.
0604
397.
469
5.43
325.
8352
26.2
431
21.3
065
72.6
444
1.02
9940
14.2
378
8.16
928.
1692
74.8
0938
.500
563
.420
71.
0791
4112
.581
45.
9633
5.96
3350
.852
733
.354
157
.441
61.
0601
4217
.738
914
.908
317
.272
176.
188
55.1
821
72.7
092
1.04
7743
15.6
674
12.6
803
13.0
734
136.
333
46.3
733
79.6
666
1.04
6444
13.7
7110
.144
210
.269
910
0.61
740
.237
978
.092
41.
0545
4517
.660
614
.717
914
.717
918
5.98
853
.608
781
.325
1.05
0746
10.8
664
9.45
2610
.374
872
.794
534
.578
776
.505
51.
046
4714
.646
19.
8031
11.0
664
92.4
496
41.7
757
66.5
681
1.05
12
Tab
le 6
. Im
age
anal
ysis
res
ult
s fo
r P
ike
cru
shed
sto
ne.
Cal
ibra
tion
: 0.2
294
mm
/pix
elA
ggre
gate
Leng
thW
idth
Bre
adth
Are
aP
erim
eter
Rou
ndne
ssR
ough
ness
116
.805
13.5
3813
.538
176.
732
51.8
708
82.5
431.
0405
215
.827
8.40
269.
4526
90.3
262
41.1
471
67.0
417
1.05
153
15.6
679.
633
9.63
310
3.06
743
.754
567
.652
21.
062
418
.578
9.73
289.
7328
129.
3149
.042
667
.560
81.
0528
511
.927
6.40
946.
4094
57.1
685
32.7
019
67.1
771.
0416
611
.989
9.80
319.
9215
80.2
537
35.6
7579
.240
41.
0421
717
.983
15.2
1617
.008
201.
342
55.3
385
82.6
209
1.04
038
26.9
7514
.238
17.0
0828
3.66
571
.463
669
.798
41.
0422
918
.119
11.1
0311
.395
142.
431
50.9
346
68.9
905
1.06
5310
14.0
6412
.284
12.2
8412
3.21
243
.971
880
.077
91.
0481
1119
.366
15.1
1915
.119
187.
023
56.9
493
72.4
647
1.05
512
26.3
7510
.97
10.9
720
3.62
967
.503
956
.155
41.
0598
1344
.581
17.9
7217
.972
571.
848
110.
8958
.439
91.
0549
1419
.228
16.3
6916
.514
220.
562
59.3
079
78.7
978
1.06
2215
16.5
7212
.911
14.7
0515
7.73
150
.297
178
.35
1.04
5416
19.1
3915
.119
15.8
7219
9.6
56.5
684
78.3
831.
0454
1712
.371
8.40
268.
4026
73.2
846
34.2
501
78.5
052
1.02
818
17.5
0613
.372
14.4
7117
0.63
451
.948
579
.456
51.
0432
1915
.355
9.68
319.
6831
115.
753
43.3
612
77.3
639
1.05
2920
11.6
78.
0693
8.86
9467
.567
733
.290
476
.614
41.
0447
2114
.525
12.8
1913
.465
124.
573
44.5
351
78.9
275
1.03
222
14.4
19.
222
9.22
294
.464
139
.439
976
.314
11.
0478
2315
.872
11.5
2812
.604
131.
052
45.0
253
81.2
343
1.03
3924
26.6
9414
.238
15.2
1626
5.26
270
.358
467
.336
81.
0648
2526
.375
13.5
3813
.538
193.
937
68.2
007
52.3
954
1.06
126
17.4
818.
9915
8.99
1511
6.07
947
.972
863
.383
21.
0528
2721
.24
12.4
514
.004
187.
894
59.0
315
67.7
571.
0712
2812
.137
10.1
4410
.27
85.6
983
37.1
706
77.9
441.
0424
2914
.22
5.22
255.
2225
58.1
485
35.2
694
58.7
426
1.03
0230
14.0
0611
.239
11.2
3911
2.92
142
.506
678
.536
71.
0516
3119
.954
8.30
858.
3085
114.
283
51.2
623
54.6
503
1.04
732
12.8
197.
1101
7.11
0168
.656
635
.357
769
.012
1.04
6833
13.6
038.
5042
8.50
4285
.589
436
.995
978
.581
81.
0178
3423
.623
11.2
3911
.297
170.
471
59.6
085
60.2
898
1.05
1635
14.4
719.
6853
10.9
710
4.26
441
.589
75.7
512
1.04
0436
15.4
0510
.27
10.2
711
9.07
443
.958
377
.436
21.
0388
3711
.758
8.50
428.
5042
66.3
699
32.9
214
76.9
531.
0414
3815
.405
11.6
3213
.071
129.
037
45.6
937
77.6
627
1.04
5939
15.4
478.
2679
8.26
7995
.716
442
.025
268
.104
71.
0519
4020
.642
13.7
0116
.38
218.
384
59.4
373
77.6
804
1.05
0841
13.2
949.
4037
9.40
3793
.538
538
.561
679
.047
71.
0447
428.
8694
7.56
888.
4026
45.8
981
27.0
922
78.5
808
1.04
9543
14.4
717.
323
10.2
779
.981
438
.409
368
.128
11.
0337
a difference between the crushed gravel andcrushed stone. There was no difference in themean roughness values between the crushedstones. From these very limited tests on coarseaggregates, and without additional strength/modulus related testing, it is not certain whetherimage analysis can clearly distinguish the shape,angularity, and roughness of different aggre-gates.
Determination of aggregate characteristicsfrom indirect methods
It is clear from the above discussions that thedetermination of aggregate shape, angularity,and surface texture is a fairly lengthy and labori-ous task. An alternate approach taken by engi-neers is to infer these characteristics from themass properties of the aggregates. Several indicesfor coarse aggregates, such as angularity number,particle index, rugosity, uncompacted void, andtime index have been identified in the literature.
Angularity numberThe angularity number (AN) developed by
Shergold (1953) is recommended by British Stan-dards (BS 812 1975) for indexing the angularity ofnatural and crushed aggregates used in concrete.Shergold found that when the aggregates werecompacted in a prescribed manner, the percent-age of voids in the aggregate mass decreased asthe aggregates became more rounded. He alsofound that as the amount of round gravel in-creased in a mixture of natural and crushed ag-gregates, the percentage of voids also decreased.Based on his study of six aggregates, he foundthat the minimum percentage of voids in round-ed gravel was approximately 33%. The tests wereconducted on 19-, 12.7-, 9.5-, 6.35-, and 4.76-mmaggregates. The test procedure involved compac-tion of individually sized aggregates in three lay-ers in a 2800-cm3 mold. Each layer was compact-ed with a tamping rod that weighed between 900and 950 grams to 100 blows. The percentage ofvoids was calculated by using the net weight ofthe aggregate in the mold.
Using round gravel as a reference point, Sher-
gold characterized the angularity of all other ag-gregates as the difference between the percentageof voids and 33%. Then, AN was found to rangebetween 0 and 12:
AN percentage of voids 33= −
AN
a= 67
100–
McG
where M = mass of standard volume of aggre-gate (g)
c = mass of water required to fill thesame volume (g)
Ga = oven-dried specific gravity of theaggregate.
Several limitations of the angularity numberwere pointed out by Lees (1964). Primarily, theAN was developed based on results from only sixsamples of coarse aggregate. Furthermore, theangularity as described by Shergold, “angular torounded,” was based on a consensus reachedfrom visual examination of the test aggregate by25 observers. Another quirk with the AN was thatit was not to be applicable to all shapes (such asregular geometric objects [spheres and cubes]),and the AN for perfect spheres was found to behigher than for perfect cubes, which appears to becontradictory. Furthermore, the heavy compac-tion required may break the aggregates, causingartificial changes in angularity.
Gupta (1985) refined the AN model to accountfor the shape of the aggregate. The AN was calcu-lated in the same manner as before, with the ex-ception that Gupta defined the percentage ofvoids in an aggregate mass as a function of theshape and the average size of the aggregate(mm). Based on test results of the three differentaggregates, angular limestone (6- to 50-mmrange), subangular crushed quartzite (6- to 50-mm range), and rounded gravel (6- to 100-mmrange), as well as different proportions of limestoneand rounded gravel mixtures, he found that thepercentage of voids (Fig. 12) can be expressed as
η = Cdn
where η = percentage of voidsC = shape factord = volume mean aggregate diameter
(mm)n = exponent.
The size (d) is determined by taking a knownnumber of particles and soaking them in water
Table 7. Mean and variance of roughness androundness values from image analysis.
Roughness RoundnessAggregate type Mean Variance Mean Variance
Crushed gravel 1.0306 0.000211 78.537 46.668Crushed stone 1.0500 0.000198 73.285 37.846Pike crushed stone 1.0471 0.000115 72.365 66.589
9

for 24 hours. The amount of water displaced bythese particles is the volume of the aggregates.Gupta (1985) divides this volume by the numberof particles to get the mean volume size of the in-dividual particles. The mean volume size is thenconverted to the volume mean diameter. The ex-ponent (n) was found to be a constant equal to–0.032 for all the materials and mixtures tested.
The coefficient C was found to be a function ofthe aggregate shape. It was also found to be afunction of the amount of rounded gravel in themixture. Values of C as reported by Gupta (1985)are presented in Table 8. The coefficient C rangedbetween 39 and 45 and was found to decrease asthe material changes from an angular to a round-ed material. Also, C decreased as the amount ofrounded gravel in a mix increased.
Gupta (1985) also reported that the size of sim-ilarly shaped material had an effect on the per-centage of voids. For all of the materials tested, hefound that the percentage of voids decreased asthe size of aggregate increased. For example, hereported a 5% decrease in porosity when themean size of rounded gravel increased from 5mm to 32 mm. Likewise, a 3% decrease in poros-ity was reported for a similar change in aggregatesize for angular limestone. Therefore, the size ofthe particles has an effect on the AN value. Whenusing AN to characterize angularity it is impor-tant to ensure that the comparison is done onmaterial of the same size.
10
1.58
1.50–0.4 0.2 0.4 1.0 1.2
Log, d
Log,
η
1.62
1.52
0.0–0.2 0.6 0.8
1.54
1.56
1.64
1.60
Figure 12. Relationship between mean aggregate diameter and porosity. (After Gupta 1985.)
Table 8. Value of shape factor (C) for various mate-rials. (After Gupta 1985.)
Materials Value of C
Angular limestone 45.43Subangular crushed quartzite 41.44Rounded gravel 37.89Limestone + rounded gravel (0.875 : 0.125 v/v) 43.49Limestone + rounded gravel (0. 75 : 0.25 v/v) 42.63Limestone + rounded gravel (0.50 : 0.50 v/v) 41.98Limestone + rounded gravel (0.333 : 0.667v/v) 40.58Limestone + rounded gravel (0.167 : 0.733v/v) 39.40
Limestone & Rounded Gravel (0.500:0.500 v/v)
LimestoneLimestone & Rounded Gravel (0.875:0.125 v/v)Limestone & Rounded Gravel (0.750:0.250 v/v)Limestone & Rounded Gravel (0.625:0.375 v/v)
Limestone & Rounded Gravel (0.333:0.667 v/v)Limestone & Rounded Gravel (0.167:0.835 v/v)Crushed QuartziteRounded Gravel
Particle indexThe particle index (Ia) is based on the concept
that the shape, angularity, and surface texture of auniformly (single) sized aggregate affects notonly the void ratio but also the rate at which thevoids change when the aggregate is compacted ina standard mold (Huang 1962). Through experi-mentation with different types of molds and dif-ferent types of aggregates, and with a specificprocedure, Huang (1962) found a linear relation-ship between the number of compactive strokes(10 to 50) and the void ratio. There was no generalrelationship found with fewer than 10 compac-tive strokes. The resulting change in the voidratio became insignificant when more than 50compactive strokes were used (Huang 1962). Thehypothetical void ratio at zero strokes was line-arly extrapolated from the measured void ratio atthe end of 50 strokes and the rate of void change
between 10 and 50 strokes. It was found to be de-pendent on the shape, angularity, and texture ofthe aggregates. Huang (1962) found that this “zerostroke void ratio” became smaller as the aggregatebecame more spherical, rounded, and smooth. Healso found that this was more pronounced whenthe mold was rhombohedron shaped.
The particle index test initially was developedfor three aggregate sizes: passing the 19-mm andretained on the 12.7-mm sieve, passing the 12.7-mm and retained on the 9.5-mm sieve, and pass-ing the 9.5-mm and retained on the No. 4 (4.75-mm) sieve. For each size, the test involves tamp-ing the uniform-sized aggregate into a mold inthree equal layers using a standard tamping rodwith 10 strokes per layer. The tamping rod israised to a height of 50 mm from the top of theaggregate surface. At the end of the third layer,material is added to make sure that the aggregatesurface is flush with the rim of the molds. The testis repeated using 50 strokes. The percentage ofvoids in the aggregate is calculated using the fol-lowing equation:
V
WS vn
n*
= −
⋅1 100
where Vn = percentage of voids at n strokes perlayer
Wn = net weight of aggregate in the mold atn strokes per layer (g)
s = bulk density of the aggregate (g/cc)v = volume of mold (cc).
The particle index (Ia) is calculated using the for-mula
Ia = 1.25V10 – 0.25V50 – 32
where V10 = percentage of voids in aggregates at10 strokes per layer
V50 = percentage of voids in aggregates at50 strokes per layer.
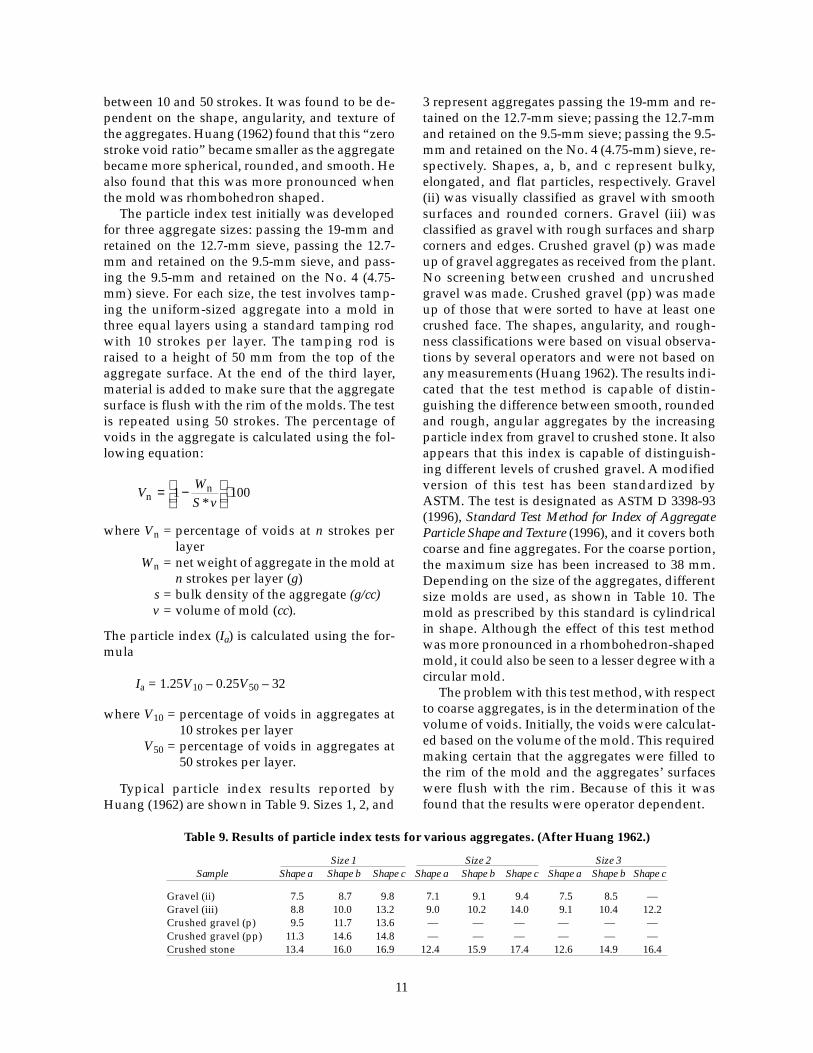
Typical particle index results reported byHuang (1962) are shown in Table 9. Sizes 1, 2, and
3 represent aggregates passing the 19-mm and re-tained on the 12.7-mm sieve; passing the 12.7-mmand retained on the 9.5-mm sieve; passing the 9.5-mm and retained on the No. 4 (4.75-mm) sieve, re-spectively. Shapes, a, b, and c represent bulky,elongated, and flat particles, respectively. Gravel(ii) was visually classified as gravel with smoothsurfaces and rounded corners. Gravel (iii) wasclassified as gravel with rough surfaces and sharpcorners and edges. Crushed gravel (p) was madeup of gravel aggregates as received from the plant.No screening between crushed and uncrushedgravel was made. Crushed gravel (pp) was madeup of those that were sorted to have at least onecrushed face. The shapes, angularity, and rough-ness classifications were based on visual observa-tions by several operators and were not based onany measurements (Huang 1962). The results indi-cated that the test method is capable of distin-guishing the difference between smooth, roundedand rough, angular aggregates by the increasingparticle index from gravel to crushed stone. It alsoappears that this index is capable of distinguish-ing different levels of crushed gravel. A modifiedversion of this test has been standardized byASTM. The test is designated as ASTM D 3398-93(1996), Standard Test Method for Index of AggregateParticle Shape and Texture (1996), and it covers bothcoarse and fine aggregates. For the coarse portion,the maximum size has been increased to 38 mm.Depending on the size of the aggregates, differentsize molds are used, as shown in Table 10. Themold as prescribed by this standard is cylindricalin shape. Although the effect of this test methodwas more pronounced in a rhombohedron-shapedmold, it could also be seen to a lesser degree with acircular mold.
The problem with this test method, with respectto coarse aggregates, is in the determination of thevolume of voids. Initially, the voids were calculat-ed based on the volume of the mold. This requiredmaking certain that the aggregates were filled tothe rim of the mold and the aggregates’ surfaceswere flush with the rim. Because of this it wasfound that the results were operator dependent.
Table 9. Results of particle index tests for various aggregates. (After Huang 1962.)
Size 1 Size 2 Size 3Sample Shape a Shape b Shape c Shape a Shape b Shape c Shape a Shape b Shape c
Gravel (ii) 7.5 8.7 9.8 7.1 9.1 9.4 7.5 8.5 —Gravel (iii) 8.8 10.0 13.2 9.0 10.2 14.0 9.1 10.4 12.2Crushed gravel (p) 9.5 11.7 13.6 — — — — — —Crushed gravel (pp) 11.3 14.6 14.8 — — — — — —Crushed stone 13.4 16.0 16.9 12.4 15.9 17.4 12.6 14.9 16.4
11
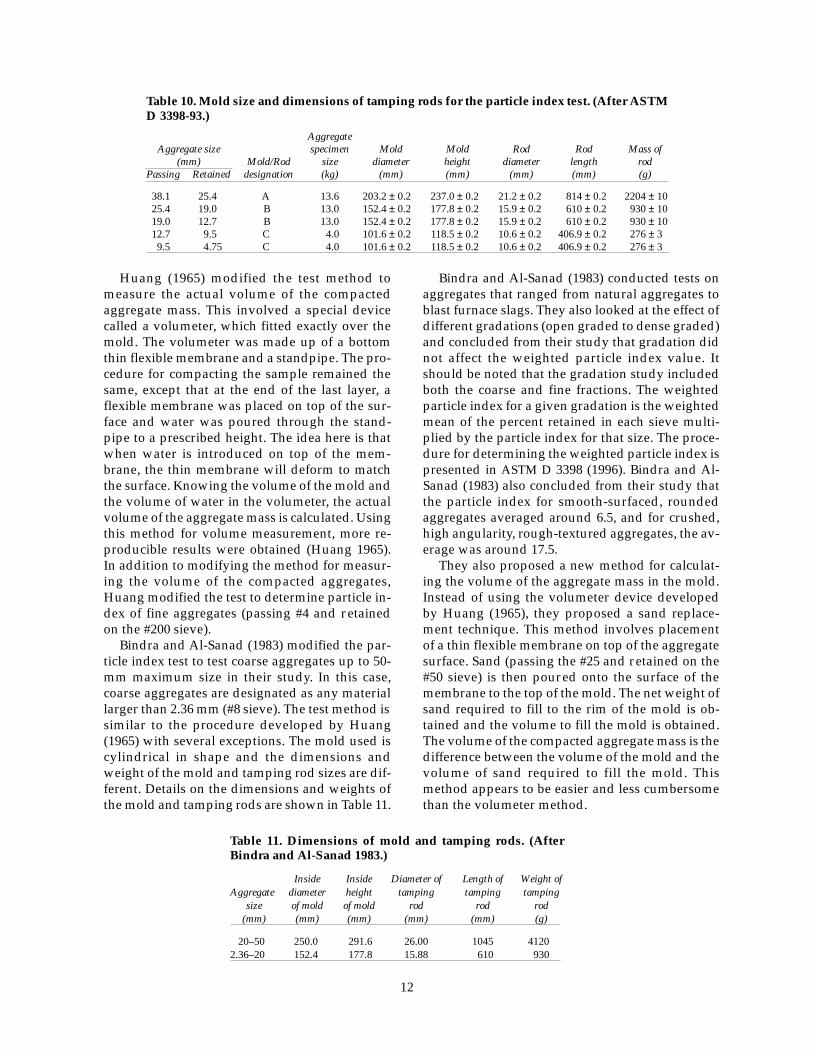
Huang (1965) modified the test method tomeasure the actual volume of the compactedaggregate mass. This involved a special devicecalled a volumeter, which fitted exactly over themold. The volumeter was made up of a bottomthin flexible membrane and a standpipe. The pro-cedure for compacting the sample remained thesame, except that at the end of the last layer, aflexible membrane was placed on top of the sur-face and water was poured through the stand-pipe to a prescribed height. The idea here is thatwhen water is introduced on top of the mem-brane, the thin membrane will deform to matchthe surface. Knowing the volume of the mold andthe volume of water in the volumeter, the actualvolume of the aggregate mass is calculated. Usingthis method for volume measurement, more re-producible results were obtained (Huang 1965).In addition to modifying the method for measur-ing the volume of the compacted aggregates,Huang modified the test to determine particle in-dex of fine aggregates (passing #4 and retainedon the #200 sieve).
Bindra and Al-Sanad (1983) modified the par-ticle index test to test coarse aggregates up to 50-mm maximum size in their study. In this case,coarse aggregates are designated as any materiallarger than 2.36 mm (#8 sieve). The test method issimilar to the procedure developed by Huang(1965) with several exceptions. The mold used iscylindrical in shape and the dimensions andweight of the mold and tamping rod sizes are dif-ferent. Details on the dimensions and weights ofthe mold and tamping rods are shown in Table 11.
Bindra and Al-Sanad (1983) conducted tests onaggregates that ranged from natural aggregates toblast furnace slags. They also looked at the effect ofdifferent gradations (open graded to dense graded)and concluded from their study that gradation didnot affect the weighted particle index value. Itshould be noted that the gradation study includedboth the coarse and fine fractions. The weightedparticle index for a given gradation is the weightedmean of the percent retained in each sieve multi-plied by the particle index for that size. The proce-dure for determining the weighted particle index ispresented in ASTM D 3398 (1996). Bindra and Al-Sanad (1983) also concluded from their study thatthe particle index for smooth-surfaced, roundedaggregates averaged around 6.5, and for crushed,high angularity, rough-textured aggregates, the av-erage was around 17.5.
They also proposed a new method for calculat-ing the volume of the aggregate mass in the mold.Instead of using the volumeter device developedby Huang (1965), they proposed a sand replace-ment technique. This method involves placementof a thin flexible membrane on top of the aggregatesurface. Sand (passing the #25 and retained on the#50 sieve) is then poured onto the surface of themembrane to the top of the mold. The net weight ofsand required to fill to the rim of the mold is ob-tained and the volume to fill the mold is obtained.The volume of the compacted aggregate mass is thedifference between the volume of the mold and thevolume of sand required to fill the mold. Thismethod appears to be easier and less cumbersomethan the volumeter method.
12
Table 11. Dimensions of mold and tamping rods. (AfterBindra and Al-Sanad 1983.)
Inside Inside Diameter of Length of Weight ofAggregate diameter height tamping tamping tamping
size of mold of mold rod rod rod(mm) (mm) (mm) (mm) (mm) (g)
20–50 250.0 291.6 26.00 1045 41202.36–20 152.4 177.8 15.88 610 930
Table 10. Mold size and dimensions of tamping rods for the particle index test. (After ASTMD 3398-93.)
AggregateAggregate size specimen Mold Mold Rod Rod Mass of
(mm) Mold/Rod size diameter height diameter length rodPassing Retained designation (kg) (mm) (mm) (mm) (mm) (g)
38.1 25.4 A 13.6 203.2 ± 0.2 237.0 ± 0.2 21.2 ± 0.2 814 ± 0.2 2204 ± 1025.4 19.0 B 13.0 152.4 ± 0.2 177.8 ± 0.2 15.9 ± 0.2 610 ± 0.2 930 ± 1019.0 12.7 B 13.0 152.4 ± 0.2 177.8 ± 0.2 15.9 ± 0.2 610 ± 0.2 930 ± 1012.7 9.5 C 4.0 101.6 ± 0.2 118.5 ± 0.2 10.6 ± 0.2 406.9 ± 0.2 276 ± 39.5 4.75 C 4.0 101.6 ± 0.2 118.5 ± 0.2 10.6 ± 0.2 406.9 ± 0.2 276 ± 3
Specific rugosity indexTons and Goetz (1968) developed the
packing volume concept to characterize theshape, angularity, and roughness of the ag-gregates used in bituminous mixtures. Thetest was developed for both the coarse (12.7-mm max) and fine fractions. They decidedthat the shape of the particle could possiblybe quantified as a separate value; however,it was difficult to separate the interaction ofangularity and roughness on aggregate per-formance. They proposed that the effect ofboth angularity and roughness be combinedand considered in one term, “rugosity.”
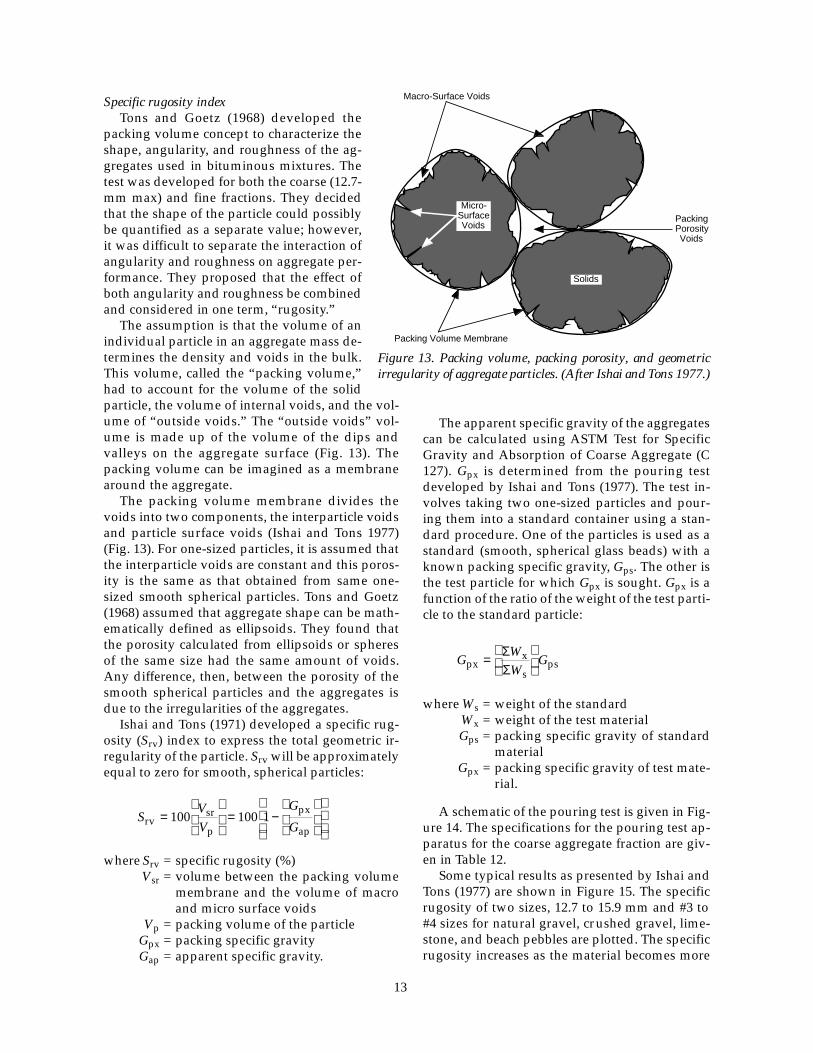
The assumption is that the volume of anindividual particle in an aggregate mass de-termines the density and voids in the bulk.This volume, called the “packing volume,”had to account for the volume of the solidparticle, the volume of internal voids, and the vol-ume of “outside voids.” The “outside voids” vol-ume is made up of the volume of the dips andvalleys on the aggregate surface (Fig. 13). Thepacking volume can be imagined as a membranearound the aggregate.
The packing volume membrane divides thevoids into two components, the interparticle voidsand particle surface voids (Ishai and Tons 1977)(Fig. 13). For one-sized particles, it is assumed thatthe interparticle voids are constant and this poros-ity is the same as that obtained from same one-sized smooth spherical particles. Tons and Goetz(1968) assumed that aggregate shape can be math-ematically defined as ellipsoids. They found thatthe porosity calculated from ellipsoids or spheresof the same size had the same amount of voids.Any difference, then, between the porosity of thesmooth spherical particles and the aggregates isdue to the irregularities of the aggregates.
Ishai and Tons (1971) developed a specific rug-osity (Srv) index to express the total geometric ir-regularity of the particle. Srv will be approximatelyequal to zero for smooth, spherical particles:
SVV
G
Grvsr
p
px
ap=
= −
100 100 1
where Srv = specific rugosity (%)Vsr = volume between the packing volume
membrane and the volume of macroand micro surface voids
Vp = packing volume of the particleGpx = packing specific gravityGap = apparent specific gravity.
The apparent specific gravity of the aggregatescan be calculated using ASTM Test for SpecificGravity and Absorption of Coarse Aggregate (C127). Gpx is determined from the pouring testdeveloped by Ishai and Tons (1977). The test in-volves taking two one-sized particles and pour-ing them into a standard container using a stan-dard procedure. One of the particles is used as astandard (smooth, spherical glass beads) with aknown packing specific gravity, Gps. The other isthe test particle for which Gpx is sought. Gpx is afunction of the ratio of the weight of the test parti-cle to the standard particle:
G
WW
Gpxx
sps=
ΣΣ
where Ws = weight of the standardWx = weight of the test materialGps = packing specific gravity of standard
materialGpx = packing specific gravity of test mate-
rial.
A schematic of the pouring test is given in Fig-ure 14. The specifications for the pouring test ap-paratus for the coarse aggregate fraction are giv-en in Table 12.
Some typical results as presented by Ishai andTons (1977) are shown in Figure 15. The specificrugosity of two sizes, 12.7 to 15.9 mm and #3 to#4 sizes for natural gravel, crushed gravel, lime-stone, and beach pebbles are plotted. The specificrugosity increases as the material becomes more
Solids
Macro-Surface Voids
PackingPorosityVoids
Packing Volume Membrane
Micro-SurfaceVoids
Figure 13. Packing volume, packing porosity, and geometricirregularity of aggregate particles. (After Ishai and Tons 1977.)
13
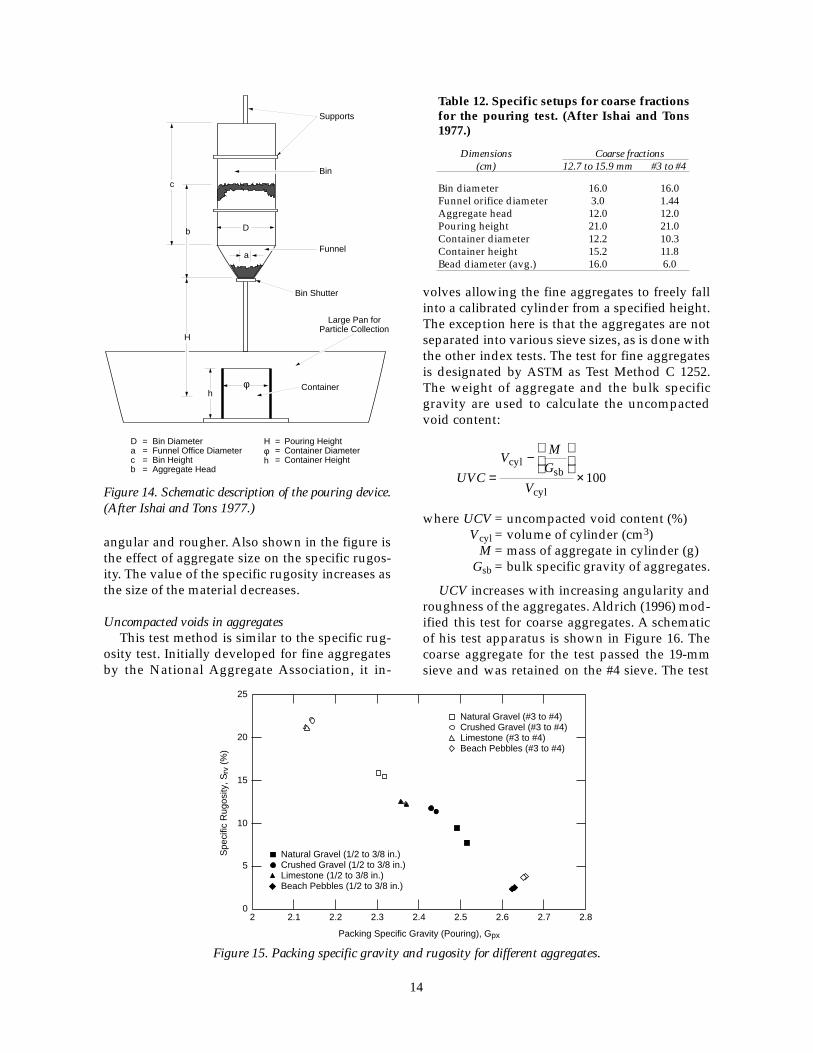
angular and rougher. Also shown in the figure isthe effect of aggregate size on the specific rugos-ity. The value of the specific rugosity increases asthe size of the material decreases.
Uncompacted voids in aggregatesThis test method is similar to the specific rug-
osity test. Initially developed for fine aggregatesby the National Aggregate Association, it in-
14
φh
Container
H
b
c
Supports
Bin
Funnel
D
Bin Shutter
Large Pan forParticle Collection
a
Bin DiameterFunnel Office DiameterBin HeightAggregate Head
====
Dacb
Pouring HeightContainer DiameterContainer Height
===
Hφh
Table 12. Specific setups for coarse fractionsfor the pouring test. (After Ishai and Tons1977.)
Dimensions Coarse fractions(cm) 12.7 to 15.9 mm #3 to #4
Bin diameter 16.0 16.0Funnel orifice diameter 3.0 1.44Aggregate head 12.0 12.0Pouring height 21.0 21.0Container diameter 12.2 10.3Container height 15.2 11.8Bead diameter (avg.) 16.0 6.0
Figure 14. Schematic description of the pouring device.(After Ishai and Tons 1977.)
Figure 15. Packing specific gravity and rugosity for different aggregates.
volves allowing the fine aggregates to freely fallinto a calibrated cylinder from a specified height.The exception here is that the aggregates are notseparated into various sieve sizes, as is done withthe other index tests. The test for fine aggregatesis designated by ASTM as Test Method C 1252.The weight of aggregate and the bulk specificgravity are used to calculate the uncompactedvoid content:
UVC
VM
G
V=
−
×cyl
sb
cyl100
where UCV = uncompacted void content (%)Vcyl = volume of cylinder (cm3)
M = mass of aggregate in cylinder (g)Gsb = bulk specific gravity of aggregates.
UCV increases with increasing angularity androughness of the aggregates. Aldrich (1996) mod-ified this test for coarse aggregates. A schematicof his test apparatus is shown in Figure 16. Thecoarse aggregate for the test passed the 19-mmsieve and was retained on the #4 sieve. The test
25
20
10
02 2.3 2.4 2.7 2.8
Packing Specific Gravity (Pouring), Gpx
Spe
cific
Rug
osity
, Srv
(%
)
15
5
2.22.1 2.5 2.6
Natural Gravel (1/2 to 3/8 in.)Crushed Gravel (1/2 to 3/8 in.)Limestone (1/2 to 3/8 in.)Beach Pebbles (1/2 to 3/8 in.)
Natural Gravel (#3 to #4)Crushed Gravel (#3 to #4)Limestone (#3 to #4)Beach Pebbles (#3 to #4)

apparatus, as pointed out by Aldrich (1996), issimilar to that developed by Ishai and Tons (1977)for the Specific Rugosity Tests. The test method issimilar to that used for fine aggregates and theuncompacted void content is calculated using thesame equation used for the fine aggregates. Ald-rich (1996) reported that the UCV increased withincreasing angularity of the aggregates.
Time indexSeveral test methods exist for fine aggregates
where the rate of flow through a standardized or-ifice is used to index the material shape, angular-ity, and texture (Rex and Peck 1956, Tobin 1978).The time of flow is usually compared to a stan-dard material, such as Ottawa sand. A similar test
method for coarse aggregates was developed bythe French in 1981. The basis of this test is that theflow rate of an aggregate mass is affected by an-gularity, surface texture, and the bulk specificgravity of the aggregate. The equipment neces-sary for this type of test method can be found inthe Quebec Ministry of Transportation Aggre-gates Laboratory in Quebec City, Quebec. Figure17 shows the test apparatus.
The flow coefficient (Ce) of an aggregate is thetime required in seconds for 7 kg of material toflow through a specified opening under a vibra-tory frequency of 50 Hz. The opening is 60 mmfor material passing the 20-mm sieve and re-tained on the 4-mm sieve. The maximum size cur-rently tested with this equipment is 20 mm. Theflow coefficient (Ce) is determined from the fol-lowing equation:
C
t Ge
sb
k= ×
where Ce = flow coefficientt = time (sec)
Gsb = bulk specific gravityk = constant (1 second).
The test involves first drying 10 kg of aggre-gate. This amount is then placed into the sampletube. The vibrating table is turned on and 1 kg ofmaterial is allowed to collect in the pan on thefloor. The pan is set on a scale and the weight ofthe aggregate in the pan is monitored. After 1 kgof material has collected in the pan, a stopwatchis turned on. The watch is stopped when an addi-tional 7 kg of material has collected in the pan.The amount of time for 7 kg to collect in the pan isnoted. The test is repeated five times and theaverage time value is determined.
The same material used for the image analysiswas tested using this equipment. The results areshown in Table 13. The bulk specific gravity of theaggregates was assumed to be 2.6.
The results indicate that, based on the flowcoefficients, crushed stone is more angular thancrushed gravel. This test can be conductedquickly; further work in this area is warranted.
6”
4.5”4”
60°
Coarse Aggregate
60°
4”
4.5”0.5”
Fine Aggregate
Figure 16. Test apparatus for ASTM C 1252 and mod-ified ASTM C 1252. (After Aldrich 1996.)
Table 13. Average flow coefficients forVermont subbase materials.
Average time FlowMaterial (s) coefficient
Crushed gravel 33.45 92.2Crushed stone 44.13 114.7Pike crushed stone 44.62 116.0Figure 17. QMOT time index test apparatus.
15
LABORATORY RESPONSE OFANGULAR MATERIAL
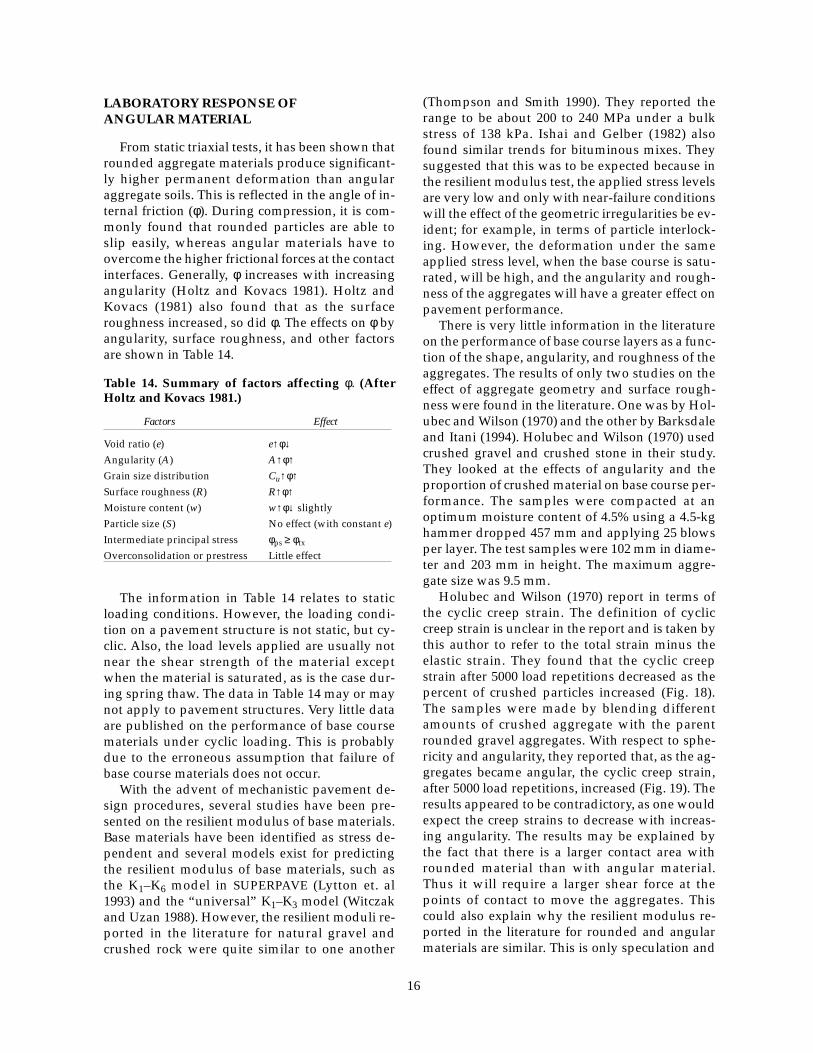
From static triaxial tests, it has been shown thatrounded aggregate materials produce significant-ly higher permanent deformation than angularaggregate soils. This is reflected in the angle of in-ternal friction (φ). During compression, it is com-monly found that rounded particles are able toslip easily, whereas angular materials have toovercome the higher frictional forces at the contactinterfaces. Generally, φ increases with increasingangularity (Holtz and Kovacs 1981). Holtz andKovacs (1981) also found that as the surfaceroughness increased, so did φ. The effects on φ byangularity, surface roughness, and other factorsare shown in Table 14.
The information in Table 14 relates to staticloading conditions. However, the loading condi-tion on a pavement structure is not static, but cy-clic. Also, the load levels applied are usually notnear the shear strength of the material exceptwhen the material is saturated, as is the case dur-ing spring thaw. The data in Table 14 may or maynot apply to pavement structures. Very little dataare published on the performance of base coursematerials under cyclic loading. This is probablydue to the erroneous assumption that failure ofbase course materials does not occur.
With the advent of mechanistic pavement de-sign procedures, several studies have been pre-sented on the resilient modulus of base materials.Base materials have been identified as stress de-pendent and several models exist for predictingthe resilient modulus of base materials, such asthe K1–K6 model in SUPERPAVE (Lytton et. al1993) and the “universal” K1–K3 model (Witczakand Uzan 1988). However, the resilient moduli re-ported in the literature for natural gravel andcrushed rock were quite similar to one another
(Thompson and Smith 1990). They reported therange to be about 200 to 240 MPa under a bulkstress of 138 kPa. Ishai and Gelber (1982) alsofound similar trends for bituminous mixes. Theysuggested that this was to be expected because inthe resilient modulus test, the applied stress levelsare very low and only with near-failure conditionswill the effect of the geometric irregularities be ev-ident; for example, in terms of particle interlock-ing. However, the deformation under the sameapplied stress level, when the base course is satu-rated, will be high, and the angularity and rough-ness of the aggregates will have a greater effect onpavement performance.
There is very little information in the literatureon the performance of base course layers as a func-tion of the shape, angularity, and roughness of theaggregates. The results of only two studies on theeffect of aggregate geometry and surface rough-ness were found in the literature. One was by Hol-ubec and Wilson (1970) and the other by Barksdaleand Itani (1994). Holubec and Wilson (1970) usedcrushed gravel and crushed stone in their study.They looked at the effects of angularity and theproportion of crushed material on base course per-formance. The samples were compacted at anoptimum moisture content of 4.5% using a 4.5-kghammer dropped 457 mm and applying 25 blowsper layer. The test samples were 102 mm in diame-ter and 203 mm in height. The maximum aggre-gate size was 9.5 mm.
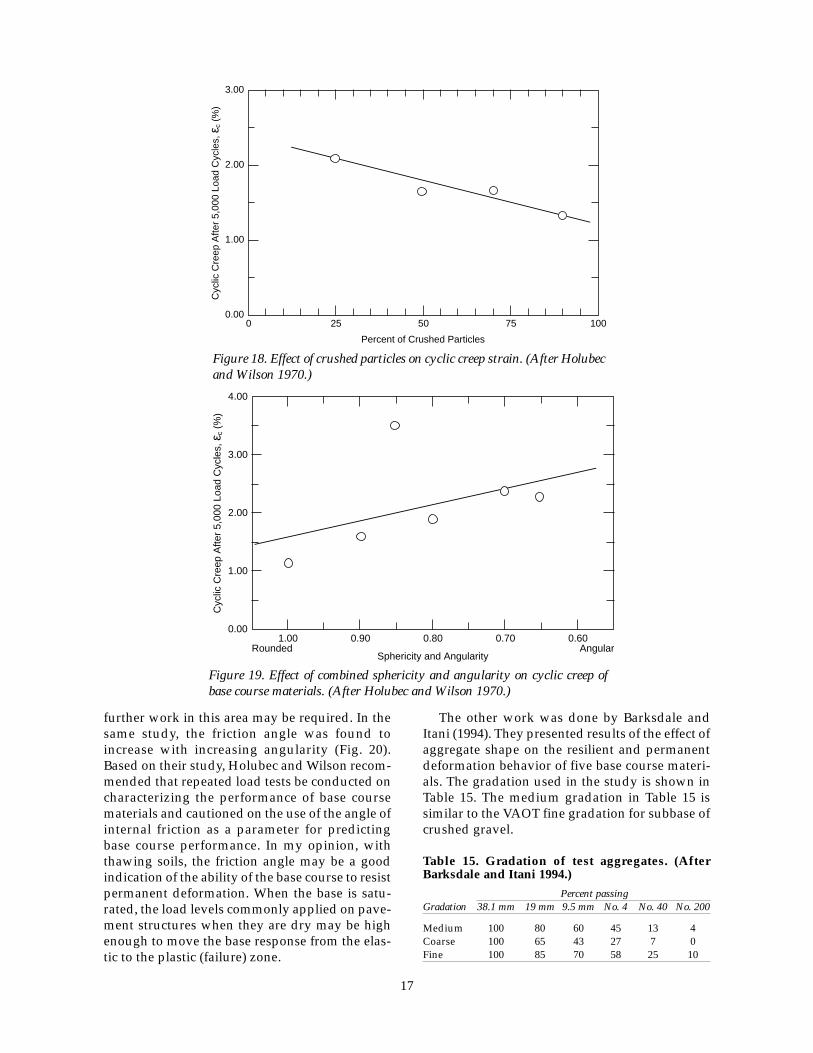
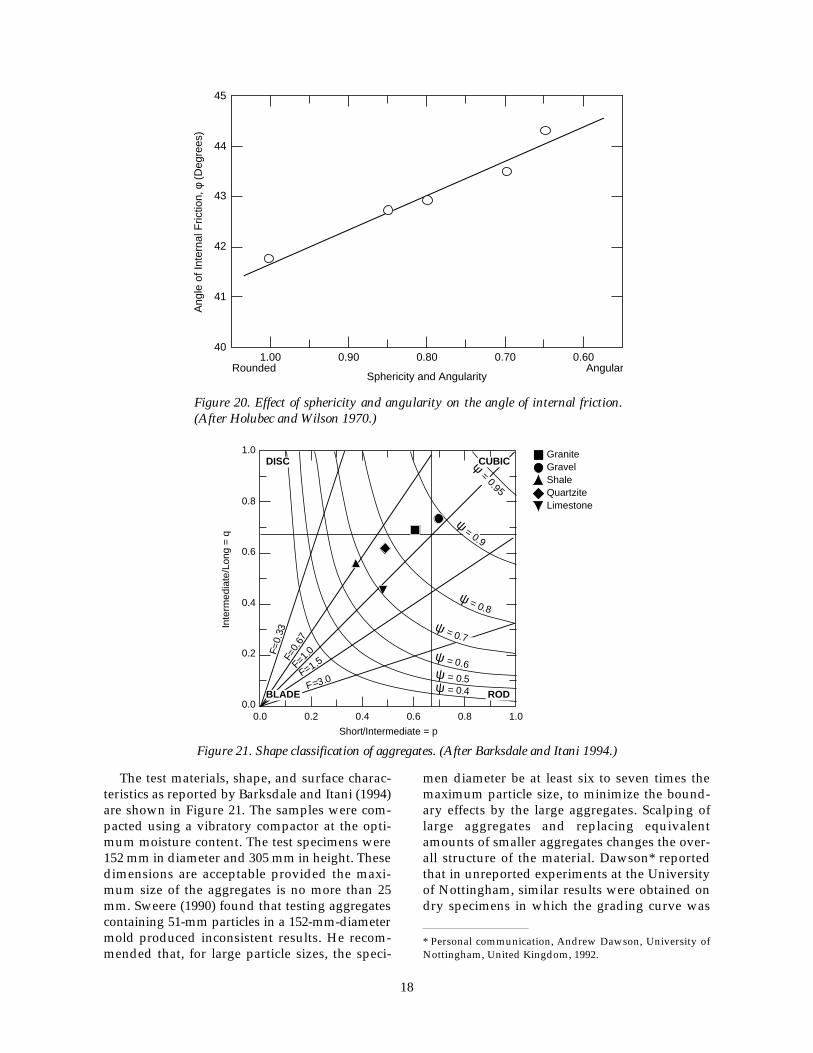
Holubec and Wilson (1970) report in terms ofthe cyclic creep strain. The definition of cycliccreep strain is unclear in the report and is taken bythis author to refer to the total strain minus theelastic strain. They found that the cyclic creepstrain after 5000 load repetitions decreased as thepercent of crushed particles increased (Fig. 18).The samples were made by blending differentamounts of crushed aggregate with the parentrounded gravel aggregates. With respect to sphe-ricity and angularity, they reported that, as the ag-gregates became angular, the cyclic creep strain,after 5000 load repetitions, increased (Fig. 19). Theresults appeared to be contradictory, as one wouldexpect the creep strains to decrease with increas-ing angularity. The results may be explained bythe fact that there is a larger contact area withrounded material than with angular material.Thus it will require a larger shear force at thepoints of contact to move the aggregates. Thiscould also explain why the resilient modulus re-ported in the literature for rounded and angularmaterials are similar. This is only speculation and
16
Table 14. Summary of factors affecting φ. (AfterHoltz and Kovacs 1981.)
Factors Effect
Void ratio (e) e↑φ↓Angularity (A) A↑φ↑Grain size distribution Cu↑φ↑Surface roughness (R) R↑φ↑Moisture content (w) w↑φ↓ slightlyParticle size (S) No effect (with constant e)Intermediate principal stress φps ≥ φtx
Overconsolidation or prestress Little effect
further work in this area may be required. In thesame study, the friction angle was found toincrease with increasing angularity (Fig. 20).Based on their study, Holubec and Wilson recom-mended that repeated load tests be conducted oncharacterizing the performance of base coursematerials and cautioned on the use of the angle ofinternal friction as a parameter for predictingbase course performance. In my opinion, withthawing soils, the friction angle may be a goodindication of the ability of the base course to resistpermanent deformation. When the base is satu-rated, the load levels commonly applied on pave-ment structures when they are dry may be highenough to move the base response from the elas-tic to the plastic (failure) zone.
The other work was done by Barksdale andItani (1994). They presented results of the effect ofaggregate shape on the resilient and permanentdeformation behavior of five base course materi-als. The gradation used in the study is shown inTable 15. The medium gradation in Table 15 issimilar to the VAOT fine gradation for subbase ofcrushed gravel.
3.00
2.00
1.00
0.000 25 50 75 100
Percent of Crushed Particles
Cyc
lic C
reep
Afte
r 5,
000
Load
Cyc
les,
ε c (
%)
Figure 18. Effect of crushed particles on cyclic creep strain. (After Holubecand Wilson 1970.)
4.00
2.00
1.00
0.001.00 0.90 0.80
Sphericity and Angularity
Cyc
lic C
reep
Afte
r 5,
000
Load
Cyc
les,
ε c (
%)
3.00
0.70 0.60Rounded Angular
Figure 19. Effect of combined sphericity and angularity on cyclic creep ofbase course materials. (After Holubec and Wilson 1970.)
Table 15. Gradation of test aggregates. (AfterBarksdale and Itani 1994.)
Percent passingGradation 38.1 mm 19 mm 9.5 mm No. 4 No. 40 No. 200
Medium 100 80 60 45 13 4Coarse 100 65 43 27 7 0Fine 100 85 70 58 25 10
17
The test materials, shape, and surface charac-teristics as reported by Barksdale and Itani (1994)are shown in Figure 21. The samples were com-pacted using a vibratory compactor at the opti-mum moisture content. The test specimens were152 mm in diameter and 305 mm in height. Thesedimensions are acceptable provided the maxi-mum size of the aggregates is no more than 25mm. Sweere (1990) found that testing aggregatescontaining 51-mm particles in a 152-mm-diametermold produced inconsistent results. He recom-mended that, for large particle sizes, the speci-
18
45
43
42
401.00 0.90 0.80
Sphericity and Angularity
Ang
le o
f Int
erna
l Fric
tion,
φ (
Deg
rees
)
44
0.70 0.60Rounded Angular
41
GraniteGravelShaleQuartziteLimestone0.8
1.0
0.6
0.4
0.2
0.00.80.0 0.2 0.4 0.6 1.0
Inte
rmed
iate
/Lon
g =
q
Short/Intermediate = p
F=0.
33F=
0.67
F=1.0
F=1.5
F=3.0 ψ = 0.4
ψ = 0.5
ψ = 0.6
ψ = 0.8
ψ = 0.9
ψ = 0.95
DISC
RODBLADE
CUBIC
ψ = 0.7
Figure 20. Effect of sphericity and angularity on the angle of internal friction.(After Holubec and Wilson 1970.)
Figure 21. Shape classification of aggregates. (After Barksdale and Itani 1994.)
* Personal communication, Andrew Dawson, University ofNottingham, United Kingdom, 1992.
men diameter be at least six to seven times themaximum particle size, to minimize the bound-ary effects by the large aggregates. Scalping oflarge aggregates and replacing equivalentamounts of smaller aggregates changes the over-all structure of the material. Dawson* reportedthat in unreported experiments at the Universityof Nottingham, similar results were obtained ondry specimens in which the grading curve was

either translated laterally or truncated. This inturn produces resilient and plastic responses thatmay not be representative of the actual material.If there is a sufficient amount of large aggregates(greater than 10%), large-scale triaxial testing isrecommended. Besides aggregate geometry,Barksdale and Itani (1994) looked at the influenceof the fines, the plasticity of the fines, gradation,and moisture content on base course perfor-mance.
To quantify the effect of the aggregate geome-try and surface roughness, Barksdale and Itani(1994) developed the aggregate influence factor(AIF), which was based on a multiple regressionbetween observed laboratory performance andvarious indices that described the aggregateshape and texture. For the aggregates tested, theyfound that the AIF was a function of the spherici-ty, roundness, surface roughness, and angularityof the aggregate. They employed methods usedby geologists to quantify sphericity and round-ness as described earlier in this report. For surfaceroughness, Barksdale and Itani (1994) used ascale from 0 to 1000 to quantify glassy to veryrough particles, respectively. They then rated theroughness of the aggregates based on visual ex-amination. For example, for the aggregates in thestudy, the AIF was as follows:
AIF = 2500* (ψ + R) – (A + SR)
where AIF = aggregate angularity factorψ = average sphericity valueR = average roundness value
SR = surface roughness coefficient.
Table 16. AIF valuesof test aggregates.
Base material AIF
Granite gneiss 500Limestone 50Shale 1675Quartzite 150River gravel 3700
This AIF value is specific to the aggregates testedby Barksdale and Itani (1994) and is not recom-mended for other aggregates. If this approach istaken to characterize base course performance,new AIF values will have to be developed for oth-er aggregates. The AIF values for the test aggre-gates are presented in Table 16. The AIF valuesdecrease with increasing angularity and rough-ness.
The resilient modulus test was conducted usingthe procedure prescribed in AASHTO T-274-82.For permanent deformation studies, the speci-mens were subjected to 41 kPa confining pressureand subjected to 70,000 load repetitions at a prin-cipal stress ratio of four or six. Barksdale foundthe resilient modulus of rough angular materialsto be higher than the rounded material by about50% at low bulk stress values and about 25% athigh bulk stress values (Fig. 22). This is muchhigher than the values reported by Thompsonand Smith (1990). There appears to be some in-consistency in the results found in the literature.The effect of moisture was also pronounced.Barksdale and Itani (1994) reported that underdrained conditions, the resilient modulus
100,000
50004
Sum of Principal Stresses (psi)
Res
ilien
t Mod
ulus
(ps
i)
10010
10,000
Granite Gneiss (γd=141 pcf, w=6.2%)Gravel (γd=126 pcf, w=3%)Shale (γd=130 pcf, w=4%)
Figure 22. Influence of material type and state of stress on resilient modulus.(After Barksdale and Itani 1994.)
19

decreased by 50% (compared to the optimummoisture content) for river gravel at a bulk stressof 103 kPa. For undrained conditions, this reduc-tion will be much higher. He also reported thatthe amount of fines in the base course materialshad a significant effect on the amount of plasticstrain (Fig. 23).
SUMMARY AND CONCLUSIONS
There are several methods for quantifying theshape, angularity, and roughness of base courseaggregates. Methods developed by geologists canbe classified as direct methods and involve actualmeasurements on the aggregates. Basic measure-ments of lengths are used to quantify the shape ofaggregates. The angularity and roughness canalso be determined with complex measurements,but several charts have been developed for sim-plifying the process. These methods are more in-volved and time consuming. However, they canbe considered as standards.
Indirect methods for quantifying the shape,angularity, and roughness have been developed.The shape, angularity, and roughness are usuallycombined together as it is fairly difficult to sepa-rate the effects of the individual components.Most indirect measurements are based on thechange in the voids of a single-sized bulk mass ofaggregates. The tests are similar to one anotherand involve compaction of the aggregate mass ina given level. Some of the indices developed arethe angularity number, particle index, and rugos-ity. Another index test involves the amount oftime required for a given aggregate gradation to
flow through a known orifice. This method isfairly simple and has been used for fine aggre-gates; it can be modified for coarse aggregates upto 50 mm in diameter.
Several research studies have shown that theshape, angularity, and roughness have a signifi-cant effect on base performance. Some of thesestudies have shown that there can be up to 50%change in resilient modulus of base materials dueto geometric irregularities. It is not conclusivewhether the resilient modulus is a good indica-tion of the effects due to changes in shape, angu-larity, and roughness of the aggregates. However,what is clear in the literature is that moisture andamount of fines have a significant effect on basecourse performance. Increasing moisture content,as during the spring thaw, can increase the failurerate of the base course. Further study is needed toconsider the combined effect of aggregate irregu-larities, moisture, and fines content on basecourse performance.
RECOMMENDATIONS
The results of this review indicate that for basecourse materials with maximum sizes rangingbetween 25 mm and 50 mm, the particle indextest is best suited for indexing the angularity ofthe material. The term “angularity” as used inthis recommendation includes the shape and sur-face characteristics of the aggregate. One of thedrawbacks of using this test is that it is time con-suming.
VAOT requirements state that any test methodused for characterizing the angularity of base
Figure 23. Influence of material type, stress level, and percent fines on plas-tic strain. (After Barksdale and Itani 1994.)
20
1.0
0.8
0.4
0.00 6 8 10 12
Percent of Fines
Pla
stic
Str
ain
(%)
0.6
0.2
42
GraniteGravelShale
σ1/σ3 = 6
σ1/σ3 = 4
σ1/σ3 = 6σ1/σ3 = 6
σ1/σ3 = 4σ1/σ3 = 4
σ3 = 6 psi

course materials be simple and quick to use.Either the flow coefficient or the uncompactedvoid tests have the greatest potential to meet theabove requirements. Currently, these tests arelimited to aggregates with a maximum size of 20mm, and modifications to both the equipmentand test procedures are required. It is recom-mended that a research program be conducted todevelop an index test for angularity of aggregatesto a maximum size of 50 mm using both the flowcoefficient and the uncompacted void tests. Theresults from both these tests will be correlatedwith the particle index, because this index hasbeen developed for larger size aggregates.
It is also advisable, but optional, that theshape, angularity, and surface texture of theaggregates be characterized using the techniquesdeveloped in the geological arena. These will beused to calibrate the index results obtained fromthe flow coefficient and the uncompacted voidtests using a similar method developed by Barks-dale and Itani (1994). The geological characteriza-tion can also be used to correlate resilient modu-lus and shear strength test results using a similarapproach used by Barksdale and Itani (1994)again.
The index angularity measurements need to betied to the resilient and strength properties of theaggregates. Ideally, the resilient modulus andshear strength tests should be conducted underoptimum moisture and saturated conditions. Thecritical time for the base courses in seasonal frostareas is during spring thaw. Therefore as a mini-mum it is recommended that the tests be con-ducted on saturated samples under undrainedconditions. As a corollary to the testing program,moisture density relationships will be developedusing the large-scale Proctor testing device. Theserelationships will be compared with thoseobtained from standard testing procedures usedat VAOT.
LITERATURE CITED
Aldrich, R.C. (1996) Influence of aggregate prop-erties on heavy duty pavements. TransportationResearch Board.ASTM D 2488-90 (1996) Standard practice for de-scription and identification of soils (visual-manualprocedure). ASTM, vol. 04.08, Soil and Rock.ASTM D 3398-93 (1996) Standard test method forindex of aggregate particle shape and texture.ASTM, vol. 04.03, Road and Paving Materials.Barksdale, R.D., and S.Y. Itani (1994) Influence of
aggregate shape on base behavior. TransportationResearch Record 1227, p. 171–182.Bikerman, J.J. (1964) Adhesion of asphalt to stone.MIT Civil Engineering, Research Report R64-3.Bindra, S.P., and H.A. Al-Sanad (1983) Particleindex evaluation of aggregates for unbound pav-ing mixtures. In Proceedings of the Fourth Confer-ence of Road Engineering, 22–26 August. Jakarta,Indonesia: Road Engineering Association of Asiaand Australasia, p. 85–93.British Standards Institution (1975) BS 812: Test-ing Aggregates.Gupta, R.D. (1985) Effect of size of particles ontheir angularity. Journal of the Institution of Engi-neers (India), 65(CI 5): 210–214.Holubec, I., and K.H. Wilson (1970) A cyclic creepstudy of pavement materials. Final Report, De-partment of Civil Engineering, University ofWaterloo, Ontario, D.H.O. Report No. RR163.Holtz, R.D., and W.D. Kovacs (1981) An Introduc-tion to Geotechnical Engineering. Englewood Cliffs,New Jersey: Prentice-Hall, Inc.Huang, E.Y. (1962) A test for evaluating the geo-metric characteristics of coarse aggregate parti-cles. Proceedings, American Society for Testing andMaterials, 62: 1223–1242.Huang, E.Y. (1965) An improved particle indextest for the evaluation of geometric characteristicsof aggregate. Michigan Highway Research Pro-ject No. 86546.Ishai, I., and H. Gelber (1982) Effect of geometricirregularity of aggregates on the properties andbehavior of bituminous concrete. Proceedings, As-sociation of Asphalt Paving Technologists, 51: 494–521.Ishai, I., and E. Tons (1971) Aggregate factors inbituminous mixture designs. University of Mich-igan, Ann Arbor, Report 335140-1-F.Ishai, I., and E. Tons (1977) Concept and testmethod for a unified characterization of the geo-metric irregularity of aggregate particles. Journalof Testing and Evaluation, 5(1): 3–15.Krumbein, W.C. (1941) Measurement and geolog-ical significance of shape and roundness of sedi-mentary particles. Journal of Sedimentary Petrology,11(2): 64–72.Lees, G. (1964) The measurement of particleshape and its influence in engineering materials.Journal of the British Granite and Whinestone Federa-tion, London, 4(2): 1–22.Lytton, R.L., J. Uzan, E.G. Fernando, R. Roque, D.Hiltunen, and S.M. Stoffel (1993) Developmentand validation of performance prediction modelsand specifications for asphalt binders and paving
21

mixes. Federal Highway Administration, Turner-Fairbanks Highway Research Center, StrategicHighway Research Program Report PA 357.Rex, H.M., and R.A. Peck (1956) A laboratory testto evaluate the shape and surface texture of fineaggregate particles. Public Roads, 29: 118–120.Shergold, F.A. (1953) The percentage of voids incompacted gravel as a measure of its angularity.Magazine of Concrete Research, 5(13): 3–10.Sweere, G.T.H. (1990) Unbound granular basesfor roads. Ph.D. Thesis, University of Delft.Terzaghi, K., and R.B. Peck (1967) Soil Mechanics inEngineering Practice. New York: John Wiley andSons, Second edition.Thompson, M.R., and K.L. Smith (1990) Repeatedtriaxial characterization of granular bases. Trans-portation Research Record, 1278: 7–17.
Tobin, R.E. (1978) Flow cone sand tests. ACI Jour-nal, p. 1–12.Tons E., and W.H. Goetz (1968) Packing volumeconcepts for aggregates. Highway Research Record,no. 236, p. 76–96.Wadell, H. (1932) Volume, shape and roundnessof rock particles. Journal of Geology, 40: 443–451.Wilson, J.D., L.D. Klotz, and C. Nagaraj (1995) Auto-mated measurement of aggregate indices of shape.Federal Highway Administration Report FHWA-RD-95-116.Witczak, M.W., and J. Uzan (1988) The universalairport pavement design system, Report I of IV:Granular material characterization. University ofMaryland, College Park, Maryland.Wright, P.J.F. (1955) A method of measuring thesurface texture of aggregate. Magazine of ConcreteResearch, 7(21): 151–160.
22
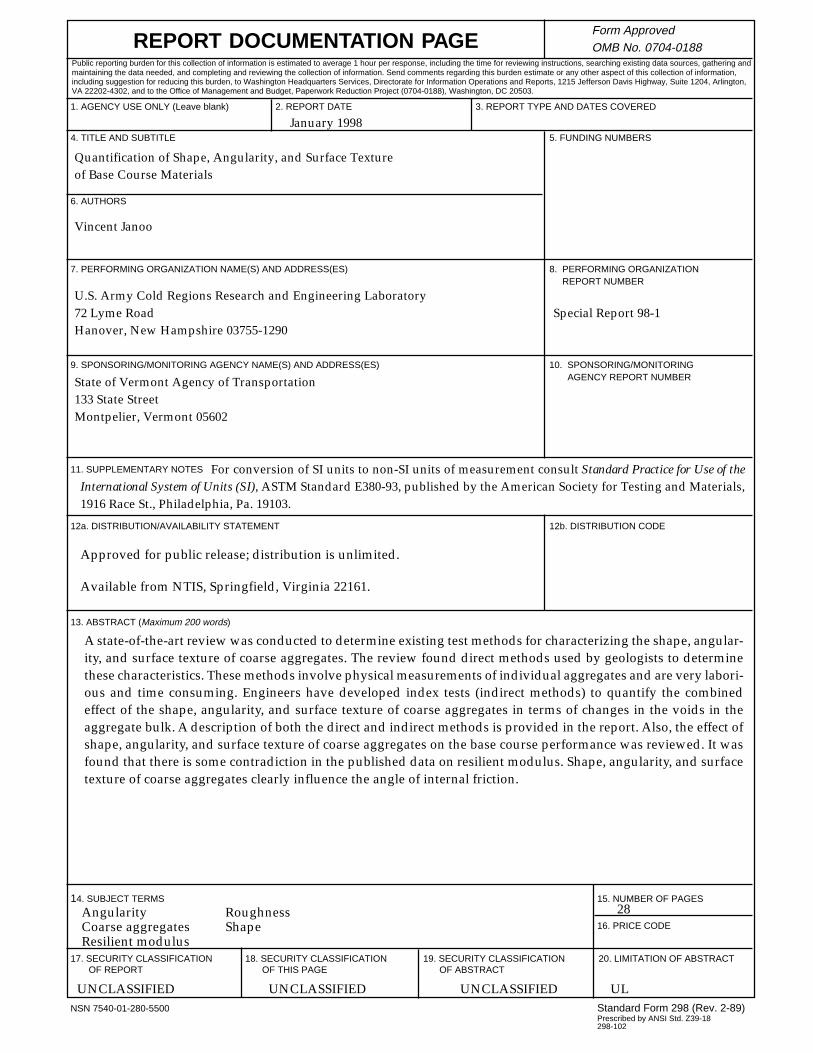
1. AGENCY USE ONLY (Leave blank) 2. REPORT DATE 3. REPORT TYPE AND DATES COVERED
4. TITLE AND SUBTITLE 5. FUNDING NUMBERS
6. AUTHORS
7. PERFORMING ORGANIZATION NAME(S) AND ADDRESS(ES) 8. PERFORMING ORGANIZATION REPORT NUMBER
9. SPONSORING/MONITORING AGENCY NAME(S) AND ADDRESS(ES) 10. SPONSORING/MONITORING AGENCY REPORT NUMBER
11. SUPPLEMENTARY NOTES
12a. DISTRIBUTION/AVAILABILITY STATEMENT 12b. DISTRIBUTION CODE
13. ABSTRACT (Maximum 200 words)
14. SUBJECT TERMS 15. NUMBER OF PAGES
16. PRICE CODE
17. SECURITY CLASSIFICATION 18. SECURITY CLASSIFICATION 19. SECURITY CLASSIFICATION 20. LIMITATION OF ABSTRACT OF REPORT OF THIS PAGE OF ABSTRACT
NSN 7540-01-280-5500 Standard Form 298 (Rev. 2-89)Prescribed by ANSI Std. Z39-18298-102
REPORT DOCUMENTATION PAGEForm ApprovedOMB No. 0704-0188
Public reporting burden for this collection of information is estimated to average 1 hour per response, including the time for reviewing instructions, searching existing data sources, gathering andmaintaining the data needed, and completing and reviewing the collection of information. Send comments regarding this burden estimate or any other aspect of this collection of information,including suggestion for reducing this burden, to Washington Headquarters Services, Directorate for Information Operations and Reports, 1215 Jefferson Davis Highway, Suite 1204, Arlington,VA 22202-4302, and to the Office of Management and Budget, Paperwork Reduction Project (0704-0188), Washington, DC 20503.
For conversion of SI units to non-SI units of measurement consult Standard Practice for Use of theInternational System of Units (SI), ASTM Standard E380-93, published by the American Society for Testing and Materials,1916 Race St., Philadelphia, Pa. 19103.
Approved for public release; distribution is unlimited.
Available from NTIS, Springfield, Virginia 22161.
January 1998
Quantification of Shape, Angularity, and Surface Textureof Base Course Materials
Vincent Janoo
U.S. Army Cold Regions Research and Engineering Laboratory72 Lyme Road Special Report 98-1Hanover, New Hampshire 03755-1290
State of Vermont Agency of Transportation133 State StreetMontpelier, Vermont 05602
28
UNCLASSIFIED UNCLASSIFIED UNCLASSIFIED UL
A state-of-the-art review was conducted to determine existing test methods for characterizing the shape, angular-ity, and surface texture of coarse aggregates. The review found direct methods used by geologists to determinethese characteristics. These methods involve physical measurements of individual aggregates and are very labori-ous and time consuming. Engineers have developed index tests (indirect methods) to quantify the combinedeffect of the shape, angularity, and surface texture of coarse aggregates in terms of changes in the voids in theaggregate bulk. A description of both the direct and indirect methods is provided in the report. Also, the effect ofshape, angularity, and surface texture of coarse aggregates on the base course performance was reviewed. It wasfound that there is some contradiction in the published data on resilient modulus. Shape, angularity, and surfacetexture of coarse aggregates clearly influence the angle of internal friction.
Angularity RoughnessCoarse aggregates ShapeResilient modulus
![arXiv:1706.02051v2 [cs.CV] 1 Oct 2018 · Other quantification methods have been reported based on texture features, which collect information about the spatial relationship of the](https://static.fdocuments.us/doc/165x107/5f8c36d161f7bc2b51467c3c/arxiv170602051v2-cscv-1-oct-2018-other-quantification-methods-have-been-reported.jpg)