
Quantification of J signal end breaks in developing B...
12
Research paper Quantification of Jn signal end breaks in developing B cells by blunt-end linker ligation and qPCR John D. Curry, Lydia Li, Mark S. Schlissel * University of California at Berkeley, Division of Immunology, Molecular and Cellular Biology, 439 Life Sciences Addition, Berkeley, CA 94720-3200, United States Received 9 September 2004; received in revised form 14 October 2004; accepted 18 October 2004 Available online 23 November 2004 Abstract Introduction of a double-strand DNA break at the junction between a rearranging gene segment and its flanking recombination signal sequence (RSS) is the first step of V(D)J recombination. Such DNA breaks can be detected by either Southern blot hybridization or ligation-mediated PCR. While Southern blotting is easily quantifiable, it is often insufficiently sensitive and while LM-PCR is far more sensitive, it is poorly quantifiable. Reported here is a LM-qPCR assay which relies on real-time qPCR to provide an absolute measure of recombinase-mediated, or any other specific, double-strand DNA break in genomic DNA. The efficiency of the initial ligation reaction was found to be relatively low with just 3% of potential targets undergoing linker ligation. Using this assay, approximately 16% of murine bone marrow pre-B cells were determined to contain a dsDNA break adjacent to the Jn1 gene segment. In addition, the kinetics of Jn1 dsDNA breaks in a temperature-sensitive cell line induced to recombine its n locus was determined. D 2004 Elsevier B.V. All rights reserved. Keywords: qPCR; Blunt-ended ligation; dsDNA breaks; J kappa 1; Murine; Pre-B cells 1. Introduction Ligation of linkers to DNA molecules is a widely utilized technique in molecular biology. When com- bined with PCR, the ligation of a linker sequence to fragmented genomic DNA allows for the amplifica- tion of DNA sequences adjacent to a DNA break. First developed for genomic sequencing and in vivo DNA foot-printing (Mueller and Wold, 1989), ligation- mediated PCR (LM-PCR) assays have been adapted to detect DNA breaks introduced by the V(D)J recombinase (Schlissel et al., 1993; Roth et al., 1993). V(D)J recombination is a site-specific DNA recombination reaction essential for the generation of immune receptor diversity (reviewed in Jung and Alt, 2004; Gellert, 2002). Germline-encoded V, D, and J gene segments are rearranged to generate exons 0022-1759/$ - see front matter D 2004 Elsevier B.V. All rights reserved. doi:10.1016/j.jim.2004.10.003 Abbreviations: qPCR, quantitative PCR; RSS, recombination signal sequence; LM, ligation-mediated; dsDNA, double-stranded DNA; SE, signal ends. * Corresponding author. Tel.: +1 510 643 2462; fax: +1 510 642 6845. E-mail address: [email protected] (M.S. Schlissel). Journal of Immunological Methods 296 (2005) 19 – 30 www.elsevier.com/locate/jim
Transcript of Quantification of J signal end breaks in developing B...

www.elsevier.com/locate/jim
Journal of Immunological Me
Research paper
Quantification of Jn signal end breaks in developing B cells by
blunt-end linker ligation and qPCR
John D. Curry, Lydia Li, Mark S. Schlissel*
University of California at Berkeley, Division of Immunology, Molecular and Cellular Biology, 439 Life Sciences Addition, Berkeley,
CA 94720-3200, United States
Received 9 September 2004; received in revised form 14 October 2004; accepted 18 October 2004
Available online 23 November 2004
Abstract
Introduction of a double-strand DNA break at the junction between a rearranging gene segment and its flanking
recombination signal sequence (RSS) is the first step of V(D)J recombination. Such DNA breaks can be detected by either
Southern blot hybridization or ligation-mediated PCR. While Southern blotting is easily quantifiable, it is often insufficiently
sensitive and while LM-PCR is far more sensitive, it is poorly quantifiable. Reported here is a LM-qPCR assay which relies on
real-time qPCR to provide an absolute measure of recombinase-mediated, or any other specific, double-strand DNA break in
genomic DNA. The efficiency of the initial ligation reaction was found to be relatively low with just 3% of potential targets
undergoing linker ligation. Using this assay, approximately 16% of murine bone marrow pre-B cells were determined to contain
a dsDNA break adjacent to the Jn1 gene segment. In addition, the kinetics of Jn1 dsDNA breaks in a temperature-sensitive cell
line induced to recombine its n locus was determined.
D 2004 Elsevier B.V. All rights reserved.
Keywords: qPCR; Blunt-ended ligation; dsDNA breaks; J kappa 1; Murine; Pre-B cells
1. Introduction
Ligation of linkers to DNA molecules is a widely
utilized technique in molecular biology. When com-
bined with PCR, the ligation of a linker sequence to
0022-1759/$ - see front matter D 2004 Elsevier B.V. All rights reserved.
doi:10.1016/j.jim.2004.10.003
Abbreviations: qPCR, quantitative PCR; RSS, recombination
signal sequence; LM, ligation-mediated; dsDNA, double-stranded
DNA; SE, signal ends.
* Corresponding author. Tel.: +1 510 643 2462; fax: +1 510
642 6845.
E-mail address: [email protected] (M.S. Schlissel).
fragmented genomic DNA allows for the amplifica-
tion of DNA sequences adjacent to a DNA break. First
developed for genomic sequencing and in vivo DNA
foot-printing (Mueller and Wold, 1989), ligation-
mediated PCR (LM-PCR) assays have been adapted
to detect DNA breaks introduced by the V(D)J
recombinase (Schlissel et al., 1993; Roth et al.,
1993). V(D)J recombination is a site-specific DNA
recombination reaction essential for the generation of
immune receptor diversity (reviewed in Jung and Alt,
2004; Gellert, 2002). Germline-encoded V, D, and J
gene segments are rearranged to generate exons
thods 296 (2005) 19–30
J.D. Curry et al. / Journal of Immunological Methods 296 (2005) 19–3020
encoding the variable domain of Ig or TCR genes. All
rearranging gene segments are flanked by a cis-acting
targeting element known as the recombination signal
sequence (RSS). The recombinase, consisting of the
RAG1 and RAG2 proteins, recognizes a compatible
pair of these RSSs and introduces dsDNA breaks
precisely at the junctions between the RSSs and
coding segments. The appropriate ends are then joined
by DNA repair proteins to create functional genes.
Thus, the presence of dsDNA breaks at RSS elements
indicates active recombination at that locus. Quanti-
fication of these double-strand breaks (termed signal
ends or SEs) has relied on semi-quantitative LM-PCR
methods that utilize sample dilution to crudely
determine relative template amounts. Real-time quan-
titative PCR (qPCR) technology can now be applied
to dramatically improve and simplify these kinds of
quantifications. Real-time qPCR assays are suffi-
ciently sensitive that the linker ligation becomes the
limiting step in the LM-PCR assay. The efficiency of
linker ligation to dsDNA breaks in genomic DNA is
unknown. In this report, qPCR was used to detect
blunt-end ligation in a LM-qPCR assay and to
measure the efficiency of that ligation reaction. A
variety of ligation reaction parameters were surveyed
and the effects on efficiency determined.
The real-time qPCR assay presented here, along
with an accurate measurement of the efficiency of
ligation, now permits absolute quantification of
specific signal ends. A temperature-sensitive cell line
that was induced to recombine its n locus was
examined and the kinetics of Jn1 breaks determined.
In addition, the fractions of Jn1 gene segments in
sorted murine bone marrow pre-B cells containing
dsDNA breaks were measured.
2. Methods
2.1. Cell population and lines
The temperature-sensitive Abelson murine leuke-
mia virus-transformed 103 line (Chen et al., 1994)
stably transfected with a Bcl-x expression construct
(103/BclX-7) was cultured in 5% fetal bovine serum
(FBS), RPMI-1640 (100 AM 2-mercaptoethanol), at
33 8C, and then shifted to 39 8C to induce V(D)J
recombination. An AMuLV-transformed pro-B cell
line (63-12) from a RAG-2 null mouse (Shinkai et al.,
1992), was cultured in the same media at 37 8C and
served as the source of germline DNA used for
background.
Animal experimentation was performed under a
protocol approved by the University of California at
Berkeley Animal Care and Use Committee (R253-
0405). Primary pro- (IgM�, B220+, CD43+, CD25�)
and pre- (IgM�, B220+, CD43�, CD25+) B cells
were sorted from red blood cell-depleted mouse bone
marrow first cleared of IgM+ B cells with rat-anti-
mouse IgM microbeads on an AutoMACS column
(Miltenyi Biotec, Auburn, CA). IgM� cells were
further stained with antibodies (BD PharMingen and
CALTAG): PE-anti-B220 (RA3-6B2), -CD25 (PC61);
bi-anti-CD43 (S7) followed by SA-conjugated
Cychrome (Liang et al., 2002). Cell sorting was
performed on an Epics Elite. Sorted population purity,
as assessed by flow cytometry, was greater than 95%
(Hsu et al., 2003).
High molecular weight genomic DNA was
extracted from the various cell populations by
proteinase K digestion in the presence of SDS,
followed by several phenol chloroform extractions,
ethanol precipitation and re-suspension in TE (10 mM
Tris–HCl, pH 8.0, 0.2 mM EDTA).
2.2. Construction of model substrate
A plasmid clone containing the murine Jn1region (GenBank accession no. M27036) was cut
with ScaI and XhoII (New England Biolabs, Beverly,
MA) and the resulting 321-base-pair (bp) fragment
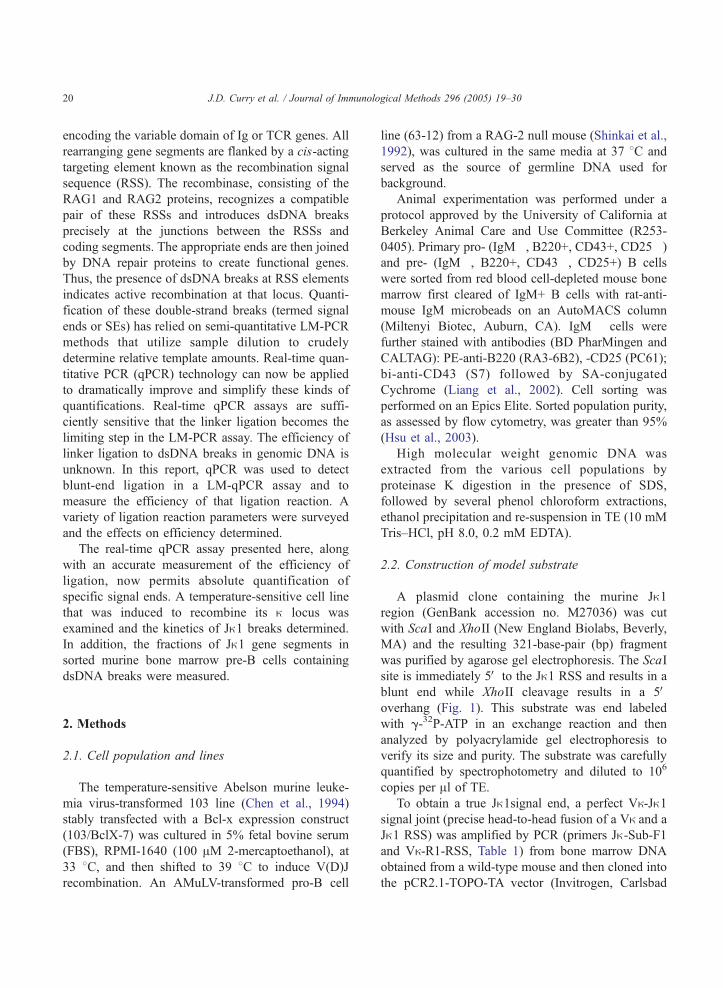
was purified by agarose gel electrophoresis. The ScaI
site is immediately 5V to the Jn1 RSS and results in a
blunt end while XhoII cleavage results in a 5Voverhang (Fig. 1). This substrate was end labeled
with g-32P-ATP in an exchange reaction and then
analyzed by polyacrylamide gel electrophoresis to
verify its size and purity. The substrate was carefully
quantified by spectrophotometry and diluted to 106
copies per Al of TE.To obtain a true Jn1signal end, a perfect Vn-Jn1
signal joint (precise head-to-head fusion of a Vn and a
Jn1 RSS) was amplified by PCR (primers Jn-Sub-F1and Vn-R1-RSS, Table 1) from bone marrow DNA
obtained from a wild-type mouse and then cloned into
the pCR2.1-TOPO-TA vector (Invitrogen, Carlsbad
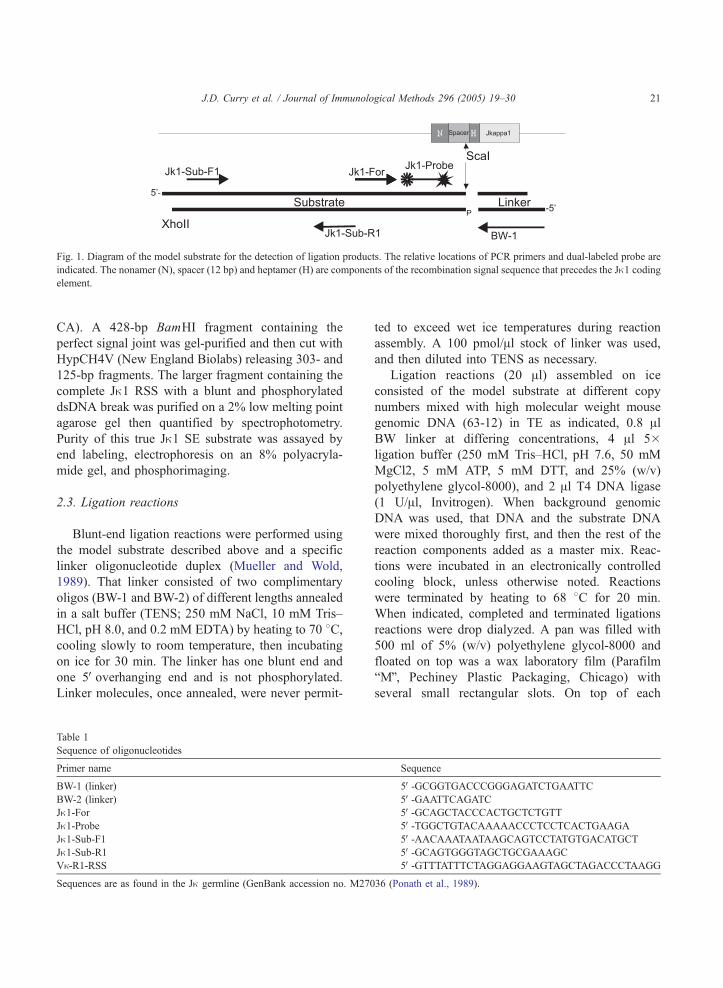
Fig. 1. Diagram of the model substrate for the detection of ligation products. The relative locations of PCR primers and dual-labeled probe are
indicated. The nonamer (N), spacer (12 bp) and heptamer (H) are components of the recombination signal sequence that precedes the Jn1 codingelement.
J.D. Curry et al. / Journal of Immunological Methods 296 (2005) 19–30 21
CA). A 428-bp BamHI fragment containing the
perfect signal joint was gel-purified and then cut with
HypCH4V (New England Biolabs) releasing 303- and
125-bp fragments. The larger fragment containing the
complete Jn1 RSS with a blunt and phosphorylated
dsDNA break was purified on a 2% low melting point
agarose gel then quantified by spectrophotometry.
Purity of this true Jn1 SE substrate was assayed by
end labeling, electrophoresis on an 8% polyacryla-
mide gel, and phosphorimaging.
2.3. Ligation reactions
Blunt-end ligation reactions were performed using
the model substrate described above and a specific
linker oligonucleotide duplex (Mueller and Wold,
1989). That linker consisted of two complimentary
oligos (BW-1 and BW-2) of different lengths annealed
in a salt buffer (TENS; 250 mM NaCl, 10 mM Tris–
HCl, pH 8.0, and 0.2 mM EDTA) by heating to 70 8C,cooling slowly to room temperature, then incubating
on ice for 30 min. The linker has one blunt end and
one 5Voverhanging end and is not phosphorylated.
Linker molecules, once annealed, were never permit-
Table 1
Sequence of oligonucleotides
Primer name
BW-1 (linker)
BW-2 (linker)
Jn1-ForJn1-ProbeJn1-Sub-F1Jn1-Sub-R1Vn-R1-RSS
Sequences are as found in the Jn germline (GenBank accession no. M270
ted to exceed wet ice temperatures during reaction
assembly. A 100 pmol/Al stock of linker was used,
and then diluted into TENS as necessary.
Ligation reactions (20 Al) assembled on ice
consisted of the model substrate at different copy
numbers mixed with high molecular weight mouse
genomic DNA (63-12) in TE as indicated, 0.8 AlBW linker at differing concentrations, 4 Al 5�ligation buffer (250 mM Tris–HCl, pH 7.6, 50 mM
MgCl2, 5 mM ATP, 5 mM DTT, and 25% (w/v)
polyethylene glycol-8000), and 2 Al T4 DNA ligase
(1 U/Al, Invitrogen). When background genomic
DNA was used, that DNA and the substrate DNA
were mixed thoroughly first, and then the rest of the
reaction components added as a master mix. Reac-
tions were incubated in an electronically controlled
cooling block, unless otherwise noted. Reactions
were terminated by heating to 68 8C for 20 min.
When indicated, completed and terminated ligations
reactions were drop dialyzed. A pan was filled with
500 ml of 5% (w/v) polyethylene glycol-8000 and
floated on top was a wax laboratory film (Parafilm
bMQ, Pechiney Plastic Packaging, Chicago) with
several small rectangular slots. On top of each
Sequence
5V-GCGGTGACCCGGGAGATCTGAATTC5V-GAATTCAGATC5V-GCAGCTACCCACTGCTCTGTT5V-TGGCTGTACAAAAACCCTCCTCACTGAAGA5V-AACAAATAATAAGCAGTCCTATGTGACATGCT5V-GCAGTGGGTAGCTGCGAAAGC5V-GTTTATTTCTAGGAGGAAGTAGCTAGACCCTAAGG
36 (Ponath et al., 1989).

J.D. Curry et al. / Journal of Immunological Methods 296 (2005) 19–3022
film slot, a single nitrocellulose membrane disc
(VSWP02500) (Millipore, Billerica, MA) was
placed, shiny side up and allowed to wet completely
on the reverse side. The ligation reaction was
dropped on to the membrane and allowed to stand
for 2 h and then carefully recovered.
2.4. Real-time qPCR reactions
A qPCR primer and hydrolysis probe set was
manually designed to detect specific Jn1 blunt-end
ligation products (Table 1). The forward primer (Jn1-For) and the probe sequence (Jn1-Probe) are borne onthe model substrate, while the BW-1 primer is only
found on the linker molecule (Fig. 1).
Real-time qPCR reactions were performed in
triplicate on 5 Al of the heat-inactivated ligation
reaction. A two-times qPCR buffer was utilized and
consisted of 40 mM Tris–HCl, pH 8.4, 100 mM KCl,
6.0 mM MgCl2, 8.0% glycerol, and 400 AM of each
dNTP. Reaction volumes were 25 Al and contained 1�reaction buffer, 0.38 units of a hot start Taq polymerase
(JumpStartk, Sigma, St. Louis, MO), 12.5 pmol of the
forward and reverse primers, 6 pmol of a dual-labeled
probe (labeled 5V with the reporter dye 6-carboxy-
fluorescein (FAM) and 3V with the quencher dye 6-
carboxytetramethylrhodamine (TAMRA)) (MWG
Biotech, High Point, NC). Reactions were thermo-
cycled using an Opticonk real-time PCRmachine (MJ
Research, Waltham, MA) as follows: an initial 5 min at
94 8C, followed by 45 cycles of 94 8C for 15 s and
60 8C for 1 min. Data was collected and analyzed with
the software supplied by the manufacturer.
To generate an absolute standard curve, a true Jn1signal end was captured by ligation using genomic
DNA purified from the tsAbl-transformed pro-B cell
line 103/BclX-7 grown at the restrictive temperature.
That specific product was then cloned into a pCR2.1-
TA vector (Invitrogen). The resulting pJn1/BW1
vector was linearized with HindIII (NEB), quantified
by spectrophotometry, and then used for construction
of the standard curve with 20,000, 2000, 200, 20, 2, 0
copies per qPCR reaction, performed in duplicate.
2.5. Southern blot analysis
Genomic DNA obtained from 103/BclX-7 cells
cultured at 39 8C for 0–72 h was restricted with
HindIII, EcoRI, and NcoI (NEB), fractionated by
field inversion gel electrophoresis on a 1% agarose
gel, and then blotted to a Hybondk-XL (Amersham
Biosciences, Piscataway, NJ) membrane. The EcoRI
to BamHI fragment from a plasmid clone of the
germline n locus was a-P32-CTP labeled by random
priming (Invitrogen), purified on a nucleotide
removal column (Qiagen, Valencia CA) and used
to probe the membrane for 20 h. The membrane was
stringently washed at 68 8C down to 0.2� SSC,
dried and then exposed to a phosphorimager cassette.
The loss of the germline band (3177 bps) was
indication of Jn recombination. Results were cor-
rected for DNA loading inconsistencies using the
invariant 2571-bp NcoI to NcoI fragment between
the J segments and the constant region. Quantifica-
tion was performed using ImageQuantR software
(Amersham Biosciences).
3. Results
Our experimental strategy was to first optimize
conditions for LM-qPCR detection and quantification
of specific dsDNA breaks in genomic DNA, then to
apply the optimized assay to DNA purified from
cells undergoing V(D)J recombination. A model
ligation substrate was generated by restriction diges-
tion of a plasmid clone of the germline n locus (Fig.
1). The substrate has a blunt end which mimics a
broken 3V RSS end and a 5V overhanging end and
contains the target sequences used for qPCR ampli-
fication of authentic Jn1 RSS breaks. Upon addition
of the BW linker and T4 DNA ligase, several
ligation products were possible. The model substrate
molecules could potentially self-ligate resulting in
products that would amplify with either the Jn1-Foror BW-1 primers alone and cause the hydrolysis of
two real-time Jn1 probes per template with each
amplification cycle. Although such events were
unlikely given the concentrations of the model
substrate in our assay system, a control experiment
was performed to test this presumption. Ligation
reactions containing up to 333333 model substrate
molecules were amplified with either the BW-1
primer or the Jn-F1 forward primer alone and were
never observed to generate any detectable qPCR
signal (data not shown).
J.D. Curry et al. / Journal of Immunological Methods 296 (2005) 19–30 23
3.1. Optimizing the linker-ligation reaction
Model substrate molecules were mixed with
genomic DNA (2000 ng/reaction) from the RAG-
deficient pro-B cell line (63-12) at molar ratios of
5% and 10% substrate copies per genome (6 pg) and
subjected to linker ligation for various lengths of
time. Reactions were terminated, diluted, and
assayed by qPCR. Ligation proceeded quickly and
products could be detected within minutes of the
initiation of incubation (Fig. 2A). Ligation products
detected at the zero time point were likely due to the
time (b30 s) it takes to mix and then terminate the
Fig. 2. Effect of (A) reaction time, (B) temperature, (C) BW linker concent
number of ligations/input number of model substrate molecules) of blunt-
genomic DNA at ratios of 5% (+) and 10% (*) per genome equivalent (
standard errors are shown. Best-fit lines (dotted 5% and solid 10%) w
procedure (Statistica, Statsoft).
reactions. Within 60 min, ligation efficiency (mole-
cules detected/input number of substrate molecules�100%) reached a plateau value of approximately
3% (Fig. 2A). Since incubations longer than 2 h did
not significantly increase the efficiency of the
ligation reaction, all subsequent ligations had 2 h
of incubation.
Variations in incubation temperature only modestly
affected the efficiency of the linker-ligation reaction
(Fig. 2B). Control substrate and 63-12 genomic DNA
mixtures of 5% and 10% were mixed with the ligation
reaction cocktail and then incubated at various
temperatures ranging from �10 to 68 8C for 2 h.
ration and (D) ligase units (Wiess) on the efficiency (detected output
end ligation reactions. Model substrate molecules were mixed with
6 pg). Ligation reactions were followed by qPCR and means with
ere calculated using a distance-weighted least squares smoothing

J.D. Curry et al. / Journal of Immunological Methods 296 (2005) 19–3024
The reactions were then terminated and assayed by
qPCR for substrate ligation events. The maximum
blunt-end ligation efficiency was found to occur with
incubation temperatures in the range from 8 to 15 8C.Ligation efficiency decreased at temperatures higher
than 23 8C, possibly due to the dissociation of the two
linker strands. All subsequent ligation reactions were
incubated at 14–15 8C.To determine the effects of linker concentration on
ligation efficiency, model substrate molecules mixed
with genomic DNA (5% and 10%) were subjected to
ligation reactions using differing amounts of linker.
Fig. 3. (A) Effect of increasing genomic DNA background on the efficiency
reaction was constant (33333) while the total amount of background genom
the maximum of 8000 ng. (B) Blunt-ended ligation efficiency varies with t
DNA (2 Ag/reaction). (C) The reproducibility of the ligation reaction und
percentages. Six separate ligation reactions were performed with each rea
averaged and presented as a mean with standard errors. (D) Input number
number of successful blunt-ended ligation. This graph generates the linear
df=28). Data from two independent experiments was combined. That equ
efficiency of the blunt-ended ligation reaction.
The efficiency of linker ligation decreased at linker
concentrations below 1.25 pmol/Al and above 5 pmol/
Al (Fig. 2C). The optimal amount of linker was
determined to be approximately 2 pmol/Al and that
concentration was used for all subsequent ligation
reactions.
Effects of ligase concentration on the efficiency of
linker ligation were determined by varying this
parameter. Surprisingly, high concentrations (N0.2
unit/Al) of ligase had an inhibitory effect on the
efficiency of ligation (Fig. 2D). In addition, at ligase
concentrations below 0.1 unit/Al, the efficiency of the
of blunt-end ligation. The number of model substrate molecules per
ic DNAwas increased by twofold increments from a low of 4 ng to
he fraction of the model substrate in a fixed background of genomic
er the conditions developed is shown for several different substrate
ction assayed by qPCR three times. Each set of qPCR values was
of model substrate molecules is plotted against the detected output
regression line shown (input=2027+25.27�output, pb10�6, R=0.93,
ation was then be used to correct the subsequent results for the low

J.D. Curry et al. / Journal of Immunological Methods 296 (2005) 19–30 25
reaction decreased. Ligase was used at 0.2 unit/Al forthe subsequent ligation reactions.
The effect of total genomic DNA concentration on
the efficiency of linker ligation was studied by mixing
varying amounts of 63-12 genomic DNAwith a fixed
number of model substrate molecules. As expected,
increasing amounts of background DNA had a
significantly deleterious effect on the efficiency of the
ligation reaction (Fig. 3A). The efficiency with which
the assay could detect and quantify dsDNA breaks fell
precipitously when the frequency of such breaks was
less than 1–2 per 50 genomes (2–4%) (Fig. 3B). Using
reaction conditions optimized as described above,
reproducibility of the real-time LM-PCR reaction was
determined. Ligation standards at 2%, 5%, 10%, and
20% in a background of 2000 ng of genomic DNAwere
assayed six times each and the mean ligation reaction
efficiencies determined (Fig. 3C). The assay was found
to be highly reproducible and the standard error around
the ligation efficiency was less than F0.5%. A
correction standard curve was generated with which
the efficiency of the ligation reaction could be
Fig. 4. The effect of potential adjuvants on the efficiency of ligation. Geno
5%, 10% and 20% per genome equivalent (6 pg) were mixed with either H
(solid), or 1 mM hexaamminecobalt chloride (open bars). A complete ligat
and incubated. Completed ligation reactions were assayed by qPCR and the
have very low ligation efficiencies.
accounted for when quantifying actual Jn1 breaks
using qPCR data (Fig. 3D).
3.2. Adjuvant to the ligation reaction
To determine whether any of several commonly
used adjuvants might increase the efficiency of linker-
ligation reactions, a minimal ligation buffer consisting
only of NaCl, MgCl2, Tris, pH 8.0, and ATP was
prepared. Ligation reactions were performed using 63-
12 DNA doped with 5%, 10%, or 20% of the model
substrate, under the previously optimized conditions.
DNA was first mixed with the additive (polyethylene
glycol-8000 (PEG) 2.5%, 0.5 mM spermidine, or 1
mM hexaamminecobalt chloride), and then the rest of
the ligation reaction components added. Completed
ligations were terminated and assayed as before.
Spermidine had a clear inhibitory effect compared to
the minimal buffer (Fig. 4). The addition of hex-
aamminecobalt chloride increased ligation efficiency
approximately 10-fold, whereas PEG increased effi-
ciency to an even greater extent. Attempts to further
mic DNA (2 Ag) doped with model substrate molecules at ratios of
2O (solid bars), 5% PEG-8000 (crossed bars), 0.5 mM spermidine
ion master mix utilizing a 10� buffer without PEG-8000 was added
means plotted. Numerical values are indicated for those means that

Fig. 5. Ligation reaction components poison qPCR reactions. A
single ligation reaction was constructed where the ligase had been
heat-inactivated prior to addition. This sham reaction was split into
two where one half was drop dialyzed on 5% PEG-8000 for 2 h
Real-time qPCRs containing either 4 (open columns) or 16 (hatched
columns) copies of the HindIII linearized pJn1/BW1 plasmid were
then mixed with 10 Al of water, the sham ligation reaction, or the
dialyzed sham ligation reaction. Twofold differences over the lowes
values obtained are presented with standard errors.
J.D. Curry et al. / Journal of Immunological Methods 296 (2005) 19–3026
boost the efficiency of the ligation reaction by adding
hexaamminecobalt chloride to ligation reactions con-
taining 5% PEG-8000 were not successful and at
levels of 0.5 mM, the genomic DNA began to
precipitate from the reaction (data not shown).
3.3. Components of the ligation reaction inhibit the
qPCR reaction
Using the optimized conditions, the assay was still
unable to detect ligation products in the genomic
DNA’s doped with 0.5% and 1% model substrate. The
ligation conditions did permit the inconsistent detec-
tion of the ligation products in the 2% substrate/DNA
mixtures and consistently detected the higher (z5.0%)
doped levels. The shapes of the qPCR curves for the
2% ligations (data not shown) led to the hypothesis
that some component of the ligation reaction was
inhibiting the qPCR reaction and that this inhibition
was of consequence only at low target concentrations.
To test whether low molecular weight components
of the ligation reaction were inhibitory to the qPCR
assay, half of a complete but substrate-free ligation
reaction mixture was drop dialyzed against an excess
of 5% polyethalene glycol-8000 (PEG) in water. A
very small number of a perfect qPCR target molecules
was added to a master qPCR mixture to which water,
undialyzed or dialyzed ligation reaction mix was
added. The qPCR signal in the dialyzed ligation
reaction mixture was identical to the H2O control,
while the undialyzed ligation reaction proved inhib-
itory (8- to 128-fold decrease) to the qPCR reactions
(Fig. 5). Further experimentation revealed that unli-
gated BW linker was the principal source of inhibitory
activity and that this inhibition was only relevant
when the ligation target concentration was below 5%
per genome (data not shown).
3.4. Accumulation of signal ends in a transformed
pro-B cell line
The 103/BclX7 murine pro-B cell line is trans-
formed with a temperature-sensitive AMuLV mutant
(Chen et al., 1994). At the permissive temperature (33
8C), these cells actively divide but express only
modest levels of V(D)J recombinase activity. At the
restrictive temperature (39 8C), these cells exit the cellcycle and begin to differentiate. Differentiation
.
t
involves significant increases in expression of RAG
proteins and activation of Ign light chain gene
rearrangement. These cells also accumulate high
levels of dsDNA breaks at Jn RSSs (Ramsden and
Gellert, 1995). To determine the absolute frequency of
these dsDNA breaks, an optimized LM-qPCR assay
was performed on DNA purified from 103/BclX7
cells grown at the permissive temperature and then
shifted to the restrictive temperature for increasing
lengths of time.
As previously detailed, the efficiency of ligation
reactions is low and only a fraction of the available
dsDNA breaks are ligated with the BW linker
molecule. To account for this ligation inefficiency,
the standard curve from Fig. 3D was applied to these
103/BclX7 results, permitting the actual number of
target dsDNA breaks to be accurately determined. This
simply entailed using the linear regression formulae to
yield corrected values (actual numbers of Jn1 dsDNA
breaks) from the observed output number of molecules
(BW-ligated Jn1 dsDNA breaks).
An increase in dsDNA breaks at Jn1 was detect-
able 32 h after the shift to the restrictive temperature
(Fig. 6A) and breaks continued to accumulate

Fig. 6. (A) Fraction of Jn1 signal ends generated per genome as a
function of time in temperature-shifted 103/BclX7 cells. Actual
output numbers are corrected against the ligation efficiency standard
curve from Fig. 3D. (B) Fraction (%) of Jn1 RSS breaks detected by
LM-PCR on dialyzed ligation reactions. In order to remove the
qPCR inhibitory components from the completed ligation reactions,
these reactions were dialyzed against 5% PEG-8000 for 2 h and then
10 Al of that dialyzed reaction assayed by the qPCR. A similarly
treated standard curve was used to correct the values obtained.
J.D. Curry et al. / Journal of Immunological Methods 296 (2005) 19–30 27
throughout a 72-h culture period. At the 72-h point,
11.6% of the genomic DNA contained a Jn1 signal
end break. For the earlier time points (0–24 h), Jn1breaks were below 5% per genome, and no successful
ligation products could be detected. At these low
levels, the qPCR assay inhibited by components of the
ligation reaction. To circumvent this problem, qPCR
assays were performed on dialyzed ligation reactions
for time points 0–32 h. As the correction standard
curve previously used (Fig. 3D) was not accurate in
this range, a set of five dialyzed ligation standard
curve points ranging from 0.5% to 10% model
substrate per 2000 ng genomic DNA was also
assayed. This standard curve was used to correct the
values obtained for the 0- to 32-h time points and that
data presented in Fig. 6B. The dialyzed correction
now reveals that there is a measurable level of Jn1breaks occurring in the cells at these initial time
points. Reassuringly, the 32-h time point value was
virtually identical between the two different assays.
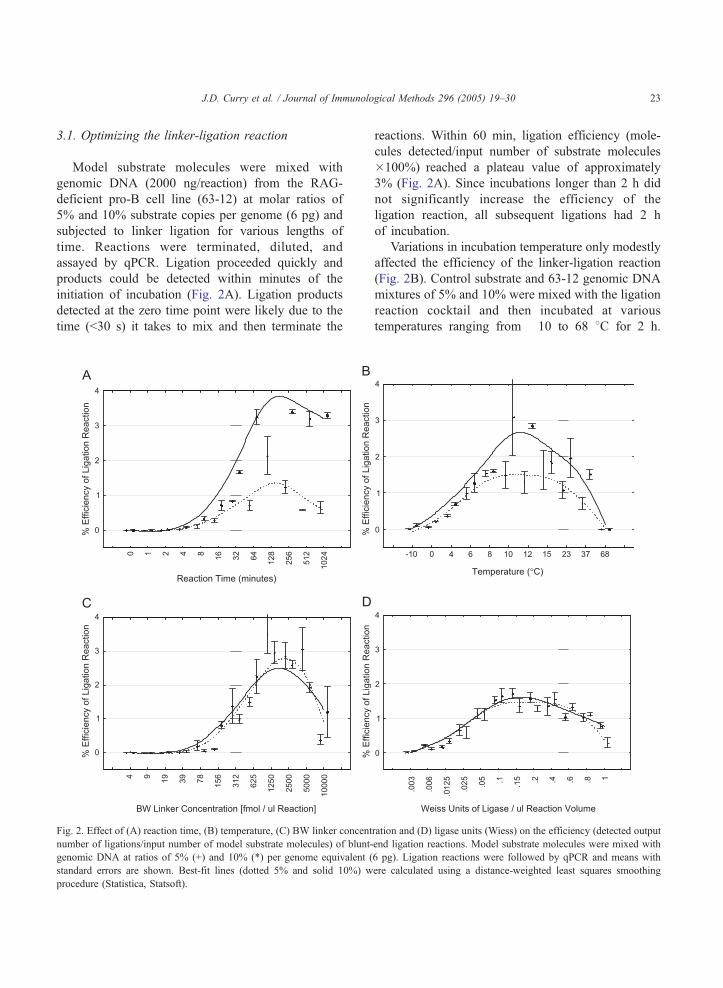
To confirm the results obtained by the LM-qPCR
assay, a Southern blot hybridization method was used
to measure the loss of the germline Jn locus fragment
which occurs with gene rearrangement using the
same 103/BclX-7 genomic DNA as used in the LM-
PCR assay (Fig. 7). Two different fragments were
quantified by phosphorimager; the larger band con-
taining the Jn segments and a smaller band contain-
ing the Cn exon. Loss of the larger band was taken as
evidence of RAG protein cleavage involving one of
the four functional Jn gene segments. The invariant
lower band was used to normalize the various
samples for DNA recovery and gel loading. The
time zero sample was presumed to contain no cleaved
or rearranged Jn segments and thus indicated zero
percent cleavage, while subsequent time points were
evaluated by comparison. No loss of germline DNA
was observed in the time 0 and 16 h samples, though
some low level (2.4%) loss was observed at 8 h.
These data are within the margin of error associated
with this type of assay. Considerable loss of germline
Jn sequence was observed at 24 h and, thereafter,
reaching a maximum level of approximately 19%
which corresponds closely to the results obtained by
real-time LM-PCR.
3.5. Absolute quantification of Jj1 signal ends in
pro- and pre-B cells
To determine the absolute number of Jn1 signal
end breaks in a physiologically relevant cell popula-
tion, DNA purified from sorted populations of murine
bone marrow pro- and pre-B cells was assayed. Pro-B
cells do not undergo significant amounts of Vn-to-Jnrearrangement and should contain few if any Jn1signal end breaks while pre-B cells are actively
Fig. 7. Map (A) of the murine Jn cluster with sizes of restriction digestion products. Autoradiograph (B) of EcoRI-, BamHI- and NcoI-digested
103-Bclx genomic DNA, probed with the EcoRI to BamHI fragment of the Jn cluster. The top band is the 3177 EcoRI to NcoI fragment
containing the Jn gene cluster. The lower band is the NcoI to NcoI fragment (2571) just after the Jn cluster. Fragments were quantified by
phosphorimager and used to determine the fraction of the top Jn band that is lost due to recombinase restriction of the Jn RSSs. The control band
(Cntr) is the EcoRI to BamHI interval cut with NcoI (50 pg).
J.D. Curry et al. / Journal of Immunological Methods 296 (2005) 19–3028
rearranging their n loci and should present a consid-
erable number of Jn1 signal ends. As expected, Jn1signal ends could not be detected by the real-time LM-
qPCR assay in the pro-B cell populations even when
using the drop dialysis methodology. In the pre-B cell
population, assuming 1 genome to be equal to 6 pg of
DNA, the frequency of Jn1 signal ends, after
correction for ligation reaction efficiency, was
0.164FS.D. 0.0124 breaks per genome.
4. Discussion
Detection of dsDNA breaks involving RSSs
flanking Ig or TCR gene segments has often served
as an indirect measure of locus-specific V(D)J
recombinase activity (Schlissel et al., 1993). As
originally described, LM-PCR is specific and very
sensitive for this purpose, but poorly quantifiable. The
novel LM-qPCR assay presented here serves two
purposes. First, using known amounts of a model
substrate doped into a population of high molecular
weight DNA, the actual efficiency of the blunt-ended
ligation reaction was determined with precision.
Factors affecting ligation efficiency were then studied
and an optimal set of conditions determined. Second,
using these ideal conditions, a correction standard
curve was generated which allows LM-qPCR data to
be corrected for variations in the efficiency of the
ligation reaction. This leads to the ability to generate
an absolute measurement of Jn1 signal end breaks in
vivo and was utilized to determine the frequency of
such breaks in pro- and pre-B cells as well as a pro-B
cell line that was induced to undergo n locus
rearrangements.
Initial experiments used the ScaI model substrate
since it was technically easy to obtain and fortu-
itously proximal (12 bp) to the 3V end of the Jn1RSS. This model substrate, however, does not have
the same sequence context as the true Jn1 signal end,
most notably the last base pair is a A:T, whereas the
true Jn1 signal end presents a G:C base-pair at its
end. Thus, the efficiency of the ScaI model substrate
ligation might be affected by its divergent sequence
context. To address this concern, a true Jn1 model
substrate was subsequently developed. That model
employed the HpyCH4V restriction enzyme which
generates a blunt end precisely in the middle of the
perfect signal joint sequence (Jn-RSS-GTG/CAC-
Vn-RSS). Identical ligation reactions for the ScaI
model and the HpyCH4V model were performed on
between 1 and 106 substrates in the absence of
competitor DNA. The ligation efficiency was equal
for both the model and true substrates leading to the
conclusion that the ScaI substrate is a valid model for
a signal end.
Blunt-ended ligation reaction efficiency was found
to be surprisingly low with approximately 3% of the
potential target molecules being ligated to the linker
under optimal conditions. In order to account for this

J.D. Curry et al. / Journal of Immunological Methods 296 (2005) 19–30 29
low efficiency, a simple correction curve was
employed to correct observed values to actual values
of initial molecules.
Components of the ligation reaction were found to
be poisonous to the qPCR and prevented detection of
dsDNA breaks below 5% per genome. A simple drop
dialysis methodology was utilized to remove those
components and permit a greater volume of the
ligation reaction to be assayed. This methodology
successfully increased the sensitivity of the LM-qPCR
assay but was only necessary for samples that contain
rare dsDNA breaks (b5%).
The conditionally transformed 103/Bcl-2 cell line
was examined previously for the kinetics and extent of
Jn1 signal ends (Ramsden and Gellert, 1995) and
those authors using a Southern blot strategy found a
maximum of 30–40% n rearrangement per n allele in
cells induced to undergo rearrangement. This figure is
considerably greater then the 18% figure this study
obtained using a similar strategy. The discrepancy
between our study and the previous report is likely
due to differences between the two cell lines used.
Southern blot analysis of the temperature-shifted
103-Bclx cell line shows that a maximum of 18%
cutting within the cluster of Jn gene segments occurs
at the 72-h time point, yet the LM-qPCR assay only
shows a 12% cutting. This difference may be due to
the fact that Southern blot assay detects dsDNA
breaks at any of the five Jn elements while the LM-
qPCR assay detects breaks only at Jn1. It is not likelythat breaks involving any of the other Jn elements (2–
5) are detected by LM-PCR due to the greater
distances from the forward and detection primers
and resulting decrease in qPCR efficiency. Gel
electrophoresis of qPCR products failed to demon-
strate the existence of products that would be expected
from cleavage of the Jn2 RSS, thus confirming this
assumption.
Signal end breaks at the Jn1 gene segment RSS are
most prevalent in the pre-B cell stage of development
(Constantinescu and Schlissel, 1997). In a highly
purified population of such cells, it was determined
that at least 16% of the cells contained a break at the
Jn1 RSS. Previous reports have demonstrated that Jn1and Jn2 signal end breaks can occur in purified pro-B
cells populations as well, although at highly reduced
levels compared to the pre-B cell populations (Con-
stantinescu and Schlissel, 1997). Activity of the
recombinase on the n locus in pro-B cells has been
confirmed by studies of mutant mice in which the pro-
to-pre B cell transition is blocked. These mutants do
contain rare V-to-Jn rearranged alleles. This level of
DNA breaks, however, is below the limit of detection
of LM-qPCR.
The LM-qPCR assay described here would also be
useful for the quantification of other types of sequence
specific dsDNA breaks such as those generated by the
P-element transposase or the HO endonuclease (Beall
and Rio, 1997; Kostriken et al., 1983). For samples
containing breaks at frequencies less than 1%, the
hemi-nested LM-PCR assay as originally described
(Schlissel et al., 1993) might serve to provide relative
rather then absolute quantification. Modification of
the linker would also permit one to quantify short
staggered double-strand breaks presumably with an
inherently greater ligation efficiency that might be
afforded by a bsticky-endedQ ligation reaction as
opposed to the low efficiency found with the ligations.
Attempts to quantify opened V(D)J recombinase-
mediated hairpin loops were refractory to this type
of analysis, likely due to the complexity of the ends
(Schlissel, 1998) and their rarity.
References
Beall, E.L., Rio, D.C., 1997. Drosophila P-element transposase is a
novel site-specific endonuclease. Genes Dev. 11, 2137.
Chen, Y.Y., Wang, L.C., Huang, M.S., Rosenberg, N., 1994. An
active v-abl protein tyrosine kinase blocks immunoglobulin
light-chain gene rearrangement. Genes Dev. 8, 688.
Constantinescu, A., Schlissel, M.S., 1997. Changes in locus-specific
V(D)J recombinase activity induced by immunoglobulin gene
products during B cell development. J. Exp. Med. 185, 609.
Gellert, M., 2002. V(D)J recombination: RAG proteins, repair
factors, and regulation. Annu. Rev. Biochem. 71, 101.
Hsu, L.Y., Lauring, J., Liang, H.E., Greenbaum, S., Cado, D.,
Zhuang, Y., Schlissel, M.S., 2003. A conserved transcriptional
enhancer regulates RAG gene expression in developing B cells.
Immunity 19, 105.
Jung, D., Alt, F.W., 2004. Unraveling V(D)J recombination; insights
into gene regulation. Cell 116, 299.
Kostriken, R., Strathern, J.N., Klar, A.J., Hicks, J.B., Heffron, F.,
1983. A site-specific endonuclease essential for mating-type
switching in Saccharomyces cerevisiae. Cell 35, 167.
Liang, H.E., Hsu, L.Y., Cado, D., Cowell, L.G., Kelsoe, G.,
Schlissel, M.S., 2002. The bdispensableQ portion of RAG2 is
necessary for efficient V-to-DJ rearrangement during B and T
cell development. Immunity 17, 639.

J.D. Curry et al. / Journal of Immunological Methods 296 (2005) 19–3030
Mueller, P.R., Wold, B., 1989. In vivo footprinting of a muscle
specific enhancer by ligation mediated PCR. Science 246, 780.
Ponath, P.D., Boyd, R.T., Hillis, D.M., Gottlieb, P.D., 1989.
Structural and evolutionary comparisons of four alleles of the
mouse Igk-J locus which encodes immunoglobulin kappa light
chain joining (J kappa) segments. Immunogenetics 29, 389.
Ramsden, D.A., Gellert, M., 1995. Formation and resolution of
double-strand break intermediates in V(D)J rearrangement.
Genes Dev. 9, 2409.
Roth, D.B., Zhu, C., Gellert, M., 1993. Characterization of broken
DNA molecules associated with V(D)J recombination. Proc.
Natl. Acad. Sci. U. S. A. 90, 10788.
Schlissel, M., Constantinescu, A., Morrow, T., Baxter, M., Peng,
A., 1993. Double-strand signal sequence breaks in V(D)J
recombination are blunt, 5V-phosphorylated. RAG-dependent,and cell cycle regulated. Genes Dev. 7, 2520.
Schlissel, M.S., 1998. Structure of nonhairpin coding-end DNA
breaks in cells undergoing V(D)J recombination. Mol. Cell.
Biol. 18, 2029.
Shinkai, Y., Rathbun, G., Lam, K.P., Oltz, E.M., Stewart, V.,
Mendelsohn, M., Charron, J., Datta, M., Young, F., Stall, A.M.,
et al., 1992. RAG-2-deficient mice lack mature lymphocytes
owing to inability to initiate V(D)J rearrangement. Cell 68, 855.