Quantification of Nitrate Sources to an Urban Stream … · Quantification of Nitrate Sources to...
8
Quantification of Nitrate Sources to an Urban Stream Using Dual Nitrate Isotopes Marion T. Divers,* Emily M. Elliott, and Daniel J. Bain Department of Geology & Planetary Science, University of Pittsburgh, 4107 O’Hara Street, Pittsburgh, Pennsylvania 15260, United States * S Supporting Information ABSTRACT: Human-engineered landscapes and subsequent altered hydrology affect the fate and transport of reactive nitrogen, particularly in urban watersheds. In this study, we used dual-nitrate isotopes and mixing model analysis (δ 15 N and δ 18 O of NO 3 − ) to quantify nitrogen inputs from two sources concentrated in urban systems, sewage and atmos- pheric deposition. Analysis was conducted on samples collected from Nine Mile Run (Pittsburgh, PA) including over two years of samples collected biweekly and samples collected through the hydrographs of four storm events. Mixing models incorporated uncertainties in the isotopic composition of potential nitrate sources and resolved the relative proportions of nitrate inputs from each source using Bayesian techniques. The results indicate that up to 94% of nitrate in streamwater originated from sewage sources during baseflow conditions. During storms, atmospheric deposition was a substantial nitrate source (∼34%) to total event-based nitrate loads, although sewage-derived nitrate remained the dominant source (66%). The potential influence of denitrification was considered by incorporating associated isotopic fractionations into mixing models; up to 19% of sewage-derived samples showed the isotopic effects of denitrification. This study quantitatively delineates proportions of nitrate from different sources to urban streamwater, while incorporating remaining uncertainties in source endmember compositions. ■ INTRODUCTION Human-built environments transform hydrologic processes in urban systems by rerouting surface waters, altering topographic variation, influencing local vegetation, microclimate, and atmospheric chemistry, and increasing loading of water pollutants. In particular, urban streams can be partially or completely buried, isolated from groundwater sources, and augmented by sewer and water infrastructure leaks, 1 all of which can contribute to surface water degradation. Surface water impairments can be further compounded by pollutants directly routed to surface water by impervious surfaces and drainage systems. 2 Urban riparian zones may be significantly altered or nonexistent and thus may limit important ecosystem services such as nutrient processing expected in less disturbed systems. 3 As a consequence of these perturbations, urban landscapes and streams with altered hydrology and biogeochemical processes are challenging to characterize with models developed in forested or agricultural areas. 4 Recognizing the sources and dynamics of biologically available, dissolved nitrogen (i.e., reactive nitrogen) in urban streams is important for nutrient management and groundwater protection in and downstream of urban centers 5−7 . Dissolved inorganic nitrogen (DIN: the sum of ammonium, nitrate, and nitrite) usually comprises over 75% of the total dissolved nitrogen load in streamwater in urban waterways. 8,9 Urban streams show particularly high concentrations of nitrate (>3 mg L −1 ) in comparison to other species of DIN. 8−13 High concentrations of nitrate indicate a supply that is far greater than the biological demand, a condition referred to as “nitrate hypersaturation” that can have extreme negative consequences for aquatic ecosystems. 8 An important part of addressing problems of hypersaturation in affected streams is understanding the contribution from various nitrate sources and the dynamics particular to each source. Nitrate in urban areas is derived commonly from sewage and atmospheric deposition, 11,12,14 two sources concentrated in regions with high population densities and significant amounts of human-engineered landscapes. Headspace within sewers pro- vides aerobic conditions necessary for mineralization of organic matter and nitrification of organic N in sewage, 15,16 and aerobic biodegradation in unsaturated zones surrounding sewer leaks creates conditions that are favorable toward converting ammonium to nitrate. 17 Nitrate originating from sewers is often assumed to be directed to streams primarily through sanitary and combined sewer overflows 18 or from wastewater treatment point sources, 20 yet aging, leaking sewer infrastructure Received: November 1, 2013 Revised: July 10, 2014 Accepted: July 17, 2014 Published: August 19, 2014 Article pubs.acs.org/est © 2014 American Chemical Society 10580 dx.doi.org/10.1021/es404880j | Environ. Sci. Technol. 2014, 48, 10580−10587
Transcript of Quantification of Nitrate Sources to an Urban Stream … · Quantification of Nitrate Sources to...

Quantification of Nitrate Sources to an Urban Stream Using DualNitrate IsotopesMarion T. Divers,* Emily M. Elliott, and Daniel J. Bain
Department of Geology & Planetary Science, University of Pittsburgh, 4107 O’Hara Street, Pittsburgh, Pennsylvania 15260, UnitedStates
*S Supporting Information
ABSTRACT: Human-engineered landscapes and subsequentaltered hydrology affect the fate and transport of reactivenitrogen, particularly in urban watersheds. In this study, weused dual-nitrate isotopes and mixing model analysis (δ15Nand δ18O of NO3
−) to quantify nitrogen inputs from twosources concentrated in urban systems, sewage and atmos-pheric deposition. Analysis was conducted on samplescollected from Nine Mile Run (Pittsburgh, PA) includingover two years of samples collected biweekly and samplescollected through the hydrographs of four storm events.Mixing models incorporated uncertainties in the isotopiccomposition of potential nitrate sources and resolved therelative proportions of nitrate inputs from each source using Bayesian techniques. The results indicate that up to 94% of nitrate instreamwater originated from sewage sources during baseflow conditions. During storms, atmospheric deposition was a substantialnitrate source (∼34%) to total event-based nitrate loads, although sewage-derived nitrate remained the dominant source (66%).The potential influence of denitrification was considered by incorporating associated isotopic fractionations into mixing models;up to 19% of sewage-derived samples showed the isotopic effects of denitrification. This study quantitatively delineatesproportions of nitrate from different sources to urban streamwater, while incorporating remaining uncertainties in sourceendmember compositions.
■ INTRODUCTION
Human-built environments transform hydrologic processes inurban systems by rerouting surface waters, altering topographicvariation, influencing local vegetation, microclimate, andatmospheric chemistry, and increasing loading of waterpollutants. In particular, urban streams can be partially orcompletely buried, isolated from groundwater sources, andaugmented by sewer and water infrastructure leaks,1 all of whichcan contribute to surface water degradation. Surface waterimpairments can be further compounded by pollutants directlyrouted to surface water by impervious surfaces and drainagesystems.2 Urban riparian zones may be significantly altered ornonexistent and thus may limit important ecosystem servicessuch as nutrient processing expected in less disturbed systems.3
As a consequence of these perturbations, urban landscapes andstreams with altered hydrology and biogeochemical processes arechallenging to characterize with models developed in forested oragricultural areas.4
Recognizing the sources and dynamics of biologically available,dissolved nitrogen (i.e., reactive nitrogen) in urban streams isimportant for nutrient management and groundwater protectionin and downstream of urban centers5−7. Dissolved inorganicnitrogen (DIN: the sum of ammonium, nitrate, and nitrite)usually comprises over 75% of the total dissolved nitrogen load instreamwater in urban waterways.8,9 Urban streams show
particularly high concentrations of nitrate (>3 mg L−1) incomparison to other species of DIN.8−13 High concentrations ofnitrate indicate a supply that is far greater than the biologicaldemand, a condition referred to as “nitrate hypersaturation” thatcan have extreme negative consequences for aquatic ecosystems.8
An important part of addressing problems of hypersaturation inaffected streams is understanding the contribution from variousnitrate sources and the dynamics particular to each source.Nitrate in urban areas is derived commonly from sewage and
atmospheric deposition,11,12,14 two sources concentrated inregions with high population densities and significant amounts ofhuman-engineered landscapes. Headspace within sewers pro-vides aerobic conditions necessary for mineralization of organicmatter and nitrification of organic N in sewage,15,16 and aerobicbiodegradation in unsaturated zones surrounding sewer leakscreates conditions that are favorable toward convertingammonium to nitrate.17 Nitrate originating from sewers isoften assumed to be directed to streams primarily throughsanitary and combined sewer overflows18 or from wastewatertreatment point sources,20 yet aging, leaking sewer infrastructure
Received: November 1, 2013Revised: July 10, 2014Accepted: July 17, 2014Published: August 19, 2014
Article
pubs.acs.org/est
© 2014 American Chemical Society 10580 dx.doi.org/10.1021/es404880j | Environ. Sci. Technol. 2014, 48, 10580−10587

also contributes potentially significant nitrate loads to urbanstreams.21 Atmospherically deposited nitrogen includes both wet(dissolved nitrate (NO3
−) and ammonium (NH4+))22 and dry
atmospheric deposition (particulate nitrate and gaseous nitricacid (HNO3
−)23 forms). In urban systems, wet atmosphericdeposition combines with accumulated dry atmosphericdeposition and is flushed into the stream during stormevents.11,24
Dual nitrate isotopes have been used to distinguish nutrientsources to urban streams in storms and baseflows.11,12,24−26
Isotopes of nitrogen and oxygen can distinguish atmosphericallydeposited nitrate (δ15N: −11‰ to +3.5‰; δ18O: +63‰ to+94‰) from sewage derived nitrate (δ15N: 0‰ to +20‰; δ18O:−15‰ to +15‰).27,28 Not only do nitrate isotopiccompositions reflect nitrate sources, but also they can recordtransformations of nitrate during transport. For example,increasing δ15N/δ18O values at a ∼ 2:1 ratio indicatedenitrification processes, particularly when sample pool nitrateconcentrations are decreasing.29−31 Results from dual-nitrateisotope analysis can be used in mixing models to estimate theproportion contributed by each source;28 however, due to theranges of isotopic values observed for each source, mixing modelresults have large uncertainties.12 Mixing models utilizingBayesian techniques, which incorporate this uncertainty bydesign, can clarify the relative importance of sources andprocesses.32−34
Prior analysis of nutrient budgets in Nine Mile Run (NMR)watershed (Pittsburgh, PA) suggested substantial sewage-sourced nitrogen inputs to stream fluxes, resulting in higherestimates of retention rates than in other studies.21 Here, ourresearch question was focused on delineating the proportionalcontribution from sewage and atmospherically derived nitrogen(ADN) to streamwater nitrate concentrations during baseflowsand stormflows. This study builds on previous work byattributing in-stream nitrate loads to sources via dual nitrateisotopes and mixing model analysis for two years of biweeklysampling and multiple periods of storm flow.
■ STUDY LOCATION AND METHODSNMR is one of the few remaining above-ground streams inPittsburgh, draining a 1570 ha urban watershed with 38%impervious cover.35 The upper portions of NMR are buried(Figure S1, Supporting Information), with the stream re-emerging aboveground 3.5 km upstream of the MonongahelaRiver. Human populations in the NMR watershed are served byboth sanitary (52% of the total watershed area) and combinedsewer systems (36%), with remaining areas (12%) in parkland.35
Each sewer system is designed to direct waste from householdsand businesses directly to the sewage treatment plant in dryweather, while in wet weather, combined sewers are designed todirect mixed sewage and stormwater fluxes to rivers andstreams.19
Field Sampling. Sampling was conducted biweekly betweenApril 2007 and December 2008 at three sampling locationsforming a longitudinal transect along NMR (Figure S1,Supporting Information). NMR1 is approximately where thestream emerges from underground storm sewers. NMR2 islocated ∼50 m below a combined sewer input. NMR3 is locatedat the mouth of the watershed. A small ephemeral stream, FernHollow (FH), was also sampled when flowing (Figure S1,Supporting Information). Stormflows were grab-sampled atNMR2 during one summer storm (Storm 1: July 20, 2008).Three subsequent storms were sampled at a location ∼50 m
below NMR2 with an ISCO 6712 autosampler. Storms sampledat this site include one additional summer storm (Storm 2: July9−10, 2010) and two winter storms (Storm 3: January 1, 2011;Storm 4: March 22−23, 2011) (Table 1). Stormflow sampleswere collected before the rainfall began and at intervalsthroughout the storm (Table 1). Storm water samples werestored frozen until filtered in the lab.During sampling, instantaneous discharges were measured at
each site using the area velocity method. In addition, dailyaverage and 15 min average discharge data (6/14/2006−9/30/2009) were obtained from USGS station 03085049 (Figure S2,Supporting Information). The USGS program “PART” was usedfor hydrograph separation (storm versus base flows) of theUSGSdaily average discharge record for 2007 and 2008.36 Duringsubsequent storm events, a pressure transducer was installed in astilling well and a rating curve was developed from dischargesmeasured with the area velocity method. Manual dischargemeasurements were compared with simultaneous stage measure-ments, and the resulting relation was applied to the continuousstage record (Figure S2, Supporting Information). During Storm4, the data logger was inadvertently full due to a false downloadand did not record stages. Discharge during individual samplingevents and storms was categorized as “baseflow” or “stormflow”via visual analysis of stream hydrographs from 15 min averagedischarge data from the USGS station, storm hydrographsrecorded by the pressure transducer, or direct observation ofstream conditions during sampling. Precipitation data wasobtained from 3 Rivers Wet Weather.37 Dry atmosphericdeposition was measured at the Laurel Highlands (LRL117)dry deposition (CASTNET) monitoring site, 75 km fromPittsburgh. Wet deposition was measured at the Piney Reservoir(MD08) National Trends Network (NTN) precipitationmonitoring site, 115 km from Pittsburgh.Biweekly bulk anion samples were vacuum-filtered (0.2 μm
nylon filters) within 24 h of collection. Storm samples werefrozen immediately and then filtered prior to subsequentanalyses. Filtered samples were placed in HDPE bottles andeither refrigerated (IC analyses) or frozen (isotopic analyses).Nitrate (NO3
−) concentrations were measured on a DionexICS2000 Ion Chromatograph. Nitrite (NO2
−) concentrationswere measured on a Thermo Scientific Evolution 60S UV−visible Spectrophotometer to evaluate potential interferenceduring isotopic measurements of nitrate.38
Isotopic Analysis. Biweekly stream samples for isotopicanalysis were filtered in the field (0.2 μm nylon filters) intoHDPE bottles triply rinsed with 18 MΩ water during samplingand frozen until subsequent analysis. Storm samples were filteredin the lab and similarly frozen until analysis. In samples withnitrite-N concentrations >3% of total nitrate-N + nitrite-N,aliquots of the sample were pretreated with sulfamic acid toremove nitrite, a potential interference during nitrate isotopicanalysis.38 For isotopic analysis of δ15N and δ18O, a denitrifyingbacteria, Pseudomonas aureofaciens, was used to convert 20nmoles of nitrate into N2O(g), purified in a series of chemicaltraps and cryofocused.39−41 The resulting gases were analyzedusing an Isoprime Continuous Flow Isotope Ratio MassSpectrometer (CF-IRMS) equipped with a Gilson GX271autosampler and a Trace Gas system at the University ofPittsburgh Regional Stable Isotope Laboratory for Earth andEnvironmental Science Research.Samples are reported relative to Standard Mean Ocean Water
(SMOW) for δ18O and atmospheric N2 (for δ15N):
Environmental Science & Technology Article
dx.doi.org/10.1021/es404880j | Environ. Sci. Technol. 2014, 48, 10580−1058710581
δ = − ×R R R‰ (( )/ ) 1000Sample Standard Standard
where R indicates the ratio of the less abundant isotope to themore abundant isotope (e.g., 18O/16O). Samples were correctedusing international reference standards USGS-32, USGS-34,USGS-35, and IAEA-N3; these standards were also used tocorrect for linearity and instrument drift. Analytical precision forinternational reference standards was 0.2‰ and 0.5‰ for δ15Nand δ18O, respectively. To evaluate the potential effect of mass-independent contributions of δ17O to m/z 45, the increase inδ15N was estimated by assuming a 1‰ increase in δ15Ncorresponds to an 18.8‰ increase in δ17O42. Preliminary Δ17O-NO3
− values, which were analyzed as part of a concurrent,ongoing study (n = 134, Δ17O range = +0.01‰ to +27.6‰),suggest δ15N values were 0.0‰ to 1.5‰ lower than uncorrectedvalues. This range of correction factors is small relative to therange of observed values for δ15N (+2.5‰ to +19.4‰); thus, wedo not correct for mass-independent contributions of δ17O tom/z 45.
Markov Chain Monte Carlo Mixing Model Estimates ofSource Contributions. Despite extensive characterization ofDIN concentrations in NMR, the sources contributing andprocesses acting on nitrate remain uncertain. For this mixingmodel analysis, nitrate is assumed to be sourced from ADN,sewage-derived sources, or sewage-derived nitrate that has beenpartially denitrified. Lawn fertilizer-sourced nitrate was notconsidered a source in this model due to its unlikely transferenceto the stream.12,42,43 Given uncertainty in the isotopiccomposition of potential endmembers, a Bayesian approachwas used to solve the mixing model. Endmember isotopiccompositions were defined as follows. δ15N and δ18O values inADN were estimated from NMR precipitation samples collectedover a range of seasons and were flux-averaged (δ15N = +3± 3‰(n = 8), δ18O = +69.0± 5‰ (n = 9)). Sewage endmembers werebased on literature values (δ15N = +10 ± 3‰, δ18O = −2 ±8‰).44,45 Denitrification enrichment factors reported in theliterature were used to estimate δ15N and δ18O values for sewage-sourced nitrate that has undergone substantial denitrifica-tion.29,31 Large standard deviations were assumed for thedenitrified nitrate source to create a range of possible valuesthat incorporates both 2:1 and 1:1 isotope enrichmenttrajectories28,44 (δ15N = +26 ± 5‰, δ18O = +12 ± 5‰).Recent advances in Monte Carlo Markov Chain (MCMC)
methods for solving mixing models have been successfully usedto infer food sources to organisms;32,33,46 here, thesemethods areused to elucidate nitrate sources in a geochemical/isotopesystem. This mixing model analysis was implemented using the“SIAR”(Stable Isotope Analysis in R)46,47 package whereindividual water samples were treated as “organisms” and nitratesources were “food sources.” Concentration dependencies werenot required in the model; proportional source contributionswere the goal. Fractional corrections were not incorporated asthe denitrification endmember was estimated on the basis ofprior observed fractionations. The SIAR defaults for priorprobabilities of source proportions were used; i.e., theseproportions were assumed to be vague and assigned a Dirichletdistribution.46 The model was run for 500 000 iterations, with aburn-in of 5000. Chains were thinned by 15 and convergenceevaluated with the diagnostics built into the SIAR package.
■ RESULTSDischarge and Nitrate-N Concentrations during
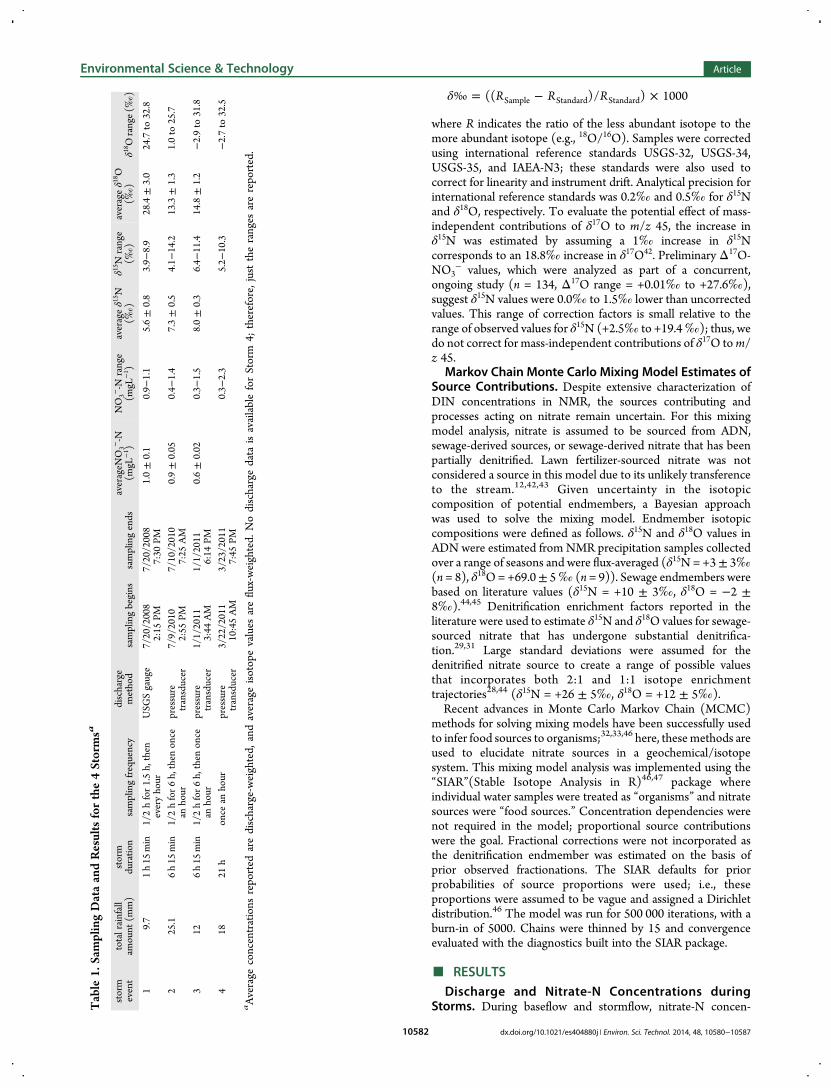
Storms. During baseflow and stormflow, nitrate-N concen-Table1.SamplingDataandResultsforthe4Stormsa
storm
event
totalrainfall
amount
(mm)
storm
duratio
nsamplingfrequency
discharge
method
samplingbegins
samplingends
averageN
O3−-N
(mgL
−1 )
NO
3−-N
range
(mgL
−1 )
averageδ1
5 N(‰
)δ1
5 Nrange
(‰)
averageδ1
8 O(‰
)δ1
8 Orange(‰
)
19.7
1h15
min
1/2hfor1.5h,then
everyhour
USG
Sgauge
7/20/2008
2:15
PM7/20/2008
7:30
PM1.0±0.1
0.9−
1.1
5.6±0.8
3.9−
8.9
28.4±3.0
24.7to
32.8
225.1
6h15
min
1/2hfor6h,then
once
anhour
pressure
transducer
7/9/2010
2:55
PM7/10/2010
7:25
AM
0.9±0.05
0.4−
1.4
7.3±0.5
4.1−
14.2
13.3±1.3
1.0to
25.7
312
6h15
min
1/2hfor6h,then
once
anhour
pressure
transducer
1/1/2011
3:44
AM
1/1/2011
6:14
PM0.6±0.02
0.3−
1.5
8.0±0.3
6.4−
11.4
14.8±1.2
−2.9to
31.8
418
21h
once
anhour
pressure
transducer
3/22/2011
10:45AM
3/23/2011
7:45
PM0.3−
2.3
5.2−
10.3
−2.7to
32.5
aAverage
concentrations
reported
aredischarge-weighted,
andaverageisotopevalues
areflux-weighted.
Nodischargedata
isavailableforStorm
4;therefore,justtheranges
arereported.
Environmental Science & Technology Article
dx.doi.org/10.1021/es404880j | Environ. Sci. Technol. 2014, 48, 10580−1058710582

trations were similar along the stream course (Figure 1).Discharge-weighted average nitrate-N concentrations were 2.1±0.4, 1.7± 0.6, and 1.9± 0.7 at NMR1, 2, and 3, respectively, withlower concentrations at FH (0.8 ± 0.07).21 Additional detailsregarding discharge and nitrate-N concentrations during base-flow conditions are reported in Divers et al.21 Discharge-weighted average nitrate-N concentrations for individual stormsranged from 0.6 ± 0.02 (Storm 2) to 1.0 ± 0.1 mg L−1 (Storm 1)(Table 1). Nitrate-N concentrations varied across a small rangeduring Storm 1 (0.9−1.1 mg L−1), whereas larger ranges wereobserved during Storms 2−4 (0.3−2.3 mg L−1 (Figure 1)).Nitrogen and Oxygen Isotope Values during Baseflow
and Storms. During baseflows, the δ15N and δ18O values at allsites indicate that the nitrate was sourced primarily fromsewage28(Figure 2). The range in baseflow δ15N values was+6.4‰ to +12.1‰, +2.5‰ to +14.2‰, and +3.0‰ to +19.4‰,at NMR1, 2, and 3, respectively (Figures 1, 2). δ18O valuesmeasured during biweekly sampling, which generally captured
baseflows, were as low as −2.7‰ (NMR2) and as high as+43.4‰ (NMR1); however, this high sample was taken duringhigher flows (0.4 m3s−1). Biweekly δ18O values ranged from−1.9‰ to +43.4‰, −2.7‰ to +36.9‰, −0.3‰ to +22.9‰,and +0.1‰ to +19.8‰ at NMR1, 2, 3, and FH, respectively(Figures 1, 2).δ15N values at NMR2 varied during stormflows (Table 1,
Figures 1, 2) where the widest range of isotopic compositionswas observed in Storm 2 (13.1‰) and the narrowest range inStorm 1 (5.1‰). δ18O values in stormwater nitrate ranged from+1.0‰ to +25.7‰ during Storm 2, −2.9‰ to +31.8‰ duringStorm 3, and −2.7‰ to +32.5‰ during Storm 4 (Figure 1). Asmaller range in δ18O values was observed during Storm 1, whereδ18O values ranged from +24.7‰ to +32.8‰ (Figure 1). Theflux-weighted average streamwater nitrate isotopic valuesmeasured in the two summer storms and one winter storm(with available discharge measurements) were similar (Table 1).
Figure 1. (a) Boxplots indicating median, quartiles, and outliers for each site during biweekly baseflow sampling. n = 38, 49, 38, and 12 for NMR1, 2, 3,and FH, respectively. (b) Boxplots indicating median, quartiles, and outliers for NMR2 during the four storms measured at that site.
Environmental Science & Technology Article
dx.doi.org/10.1021/es404880j | Environ. Sci. Technol. 2014, 48, 10580−1058710583

MCMCEstimates of Source Proportion.The combinationof high nitrate concentrations (Figure 1), high δ15N values, andlow δ18O values indicates that baseflow nitrate flux was derivedprimarily from sewage (Figure 2). The SIAR mixing modelestimates that sewage-sourced nitrate contributes between 75%and 87% to total baseline nitrate concentrations in the main stemof NMR and 72% in FH (Figure 3). Although sewagecontributions appear to decrease moving downstream, thischange results from increasing contributions from thedenitrification-influenced nitrate endmember (Figure 3). Theobserved relationship between δ15N and δ18O values suggeststhat the original nitrate source for the denitrification endmemberis sewage-derived nitrate (Figure 2). The total percentage ofsewage-sourced nitrate in NMR was 93%−94% at each siteduring baseflows (Figure 3) when the original source ofdenitrified nitrate is considered. In contrast, at all sites duringbaseflow, the nitrate contribution from ADN was minor, 6 ± 2%at NMR1, 7 ± 1% at NMR2, and 6 ± 1% at NMR3 (Figure 3).In comparison, streamwater nitrate during storms has
substantial ADN contributions, although the dominant sourceis still sewage. SIAR results indicate ADN contributions duringstormflow of 34 ± 3% of the total nitrate load to NMR2 wherethe remaining 66 ± 3% is derived from sewage sources (Figure3). The influence of ADN is evident by higher flux-weightedaverage δ18O values and lower δ15N values at NMR2 relative tothose observed during baseflow (+13.3‰ to +28.4‰ and+5.6‰ to +8.0‰ for δ18O and δ15N, respectively during storms)and indicates mixing between atmospheric and sewage-derivednitrate sources. Sewage contributions during both storm andbaseflow likely result from both leaks in the sanitary sewersystem21 and direct inputs from the combined sewer during wetweather.Although samples were not intentionally collected throughout
storm hydrographs at sites NMR1 and NMR3, several high flowswere captured during biweekly sampling (n = 8 at NMR1 and n =7 at NMR3, Figure 2). During these high flow events, NMR1 hasa flux-weighted average δ15N value (+7.7 + 0.5‰) that is lower
than the flux-weighted average baseflow value (+9.1 ± 0.2‰)and δ18O values that are higher during stormflow (+18.8 ±3.8‰) than during baseflows (+5.6 ± 0.5‰). The lower δ15Nand higher δ18O values at NMR1 during higher flows indicate acontribution from ADN to this site from storm sewers. Incontrast, at NMR3, storm flow flux-averaged δ15N was +8.0 ±0.8‰, and δ18O was +6.9 ± 1.7‰, values that overlap with thebaseflow values (Figure 2).
■ DISCUSSION
Export and Flux Estimates by Nitrate Source. Export andflux calculations helped to determine the influence of each sourceon streamwater loads in different flow regimes. To confirm massbalance analysis that inferred significant inputs of nitrate derivedfrom leaking sewers,21 dual nitrate isotopes data were combinedwith flux data to estimate total flux of nitrate. The total export ofnitrate from each source was calculated for the years 2007 and2008 by determining total discharge in base and storm flows,flow-weighted average nitrate concentrations during base andstorm flows for each year, and the average proportion of nitratesource during each flow regime.With this approach, results indicate that 3.5 and 2.7 kg
ha−1yr−1 of sewage-sourced nitrate was exported from the NMRwatershed in 2007 and 2008, respectively. This is similar topreviously estimates of sewage-sourced NO3
−-N export for thesame years (2007:3.9−5.1 kg ha−1yr−1, 2008:2.4−2.7 kgha−1yr−1)21 based on mass balance models alone. Importantly,the dual isotope data and flux calculations presented here confirmthe dominance of sewage-sourced nitrate to DIN loads in NMRstreamwater. This observation substantiates the conclusion thatsewers leak and sewage-sourced nitrate is not solely fromcombined sewer overflows. While some disagree with theinference of sewer-derived DIN and exfiltration of sewage frompipes based on mass balance approaches,48 the isotopic evidencestrongly supports this conclusion.Dual isotope data was also used to calculate the amount of
ADN-sourced nitrate exported from the NMR watershed. Total
Figure 2. Results from dual isotope analysis of nitrate in baseflow (n = 141, solid dots) and high flow (n = 88, ×) samples. Flow regime was considered“high” as the result of precipitation events and classified by direct examination of the discharge record. Results from all sites (NMR1, 2, 3, and FH 1) areshown. Inset plot shows data cluster in “human-animal waste” section of plot. Figure adapted with permission from ref 28. Copyright 2007 BlackwellScientific Publications.
Environmental Science & Technology Article
dx.doi.org/10.1021/es404880j | Environ. Sci. Technol. 2014, 48, 10580−1058710584

export of ADN was calculated similarly, by multiplying the totalstormflow discharge for each year21 (inm3) by the average nitrateconcentration in streamwater observed during storms (0.27 mgL−1). The estimated export of ADN-sourced nitrate in
streamwater was 0.32 kg ha−1yr−1 and 0.19 kg ha−1yr−1 for2007 and 2008, respectively. This export constitutes 8% and 5%,respectively, of estimated inputs from wet and dry ADN to theNMR watershed for 2007 (4.0 kg ha−1yr−1) and 2008 (3.6 kgha−1yr−1)49 and supports previous results that indicate significantretention in the NMR watershed.21 A minimum estimate ofretention for ADN is 92−95% of the total flux into the NMRwatershed. These results demonstrate that retention of ADN ispotentially high in urban systems relative to retention of sewage-sourced nitrate, as there is likely strong subsurface connectivitybetween sewage-sourced inputs and streamwater. Studiesindicate a strong potential for ADN retention in urban lawns,soil,50,51 and groundwater, where observations indicate thatADN undergoes significant processing.52 Our results concur withindications of high rates of ADN retention in urban systems andfurther with these observations by quantifying export, thusallowing for quantitative estimates of actual retention through abudget approach.Results from this study indicate that 34% of streamwater
nitrate loads during storms are sourced from ADN, with theremainder of storm nitrate sourced from sewage. The presence ofADN in suburban/urban streams is expected due to impervioussurfaces and storm sewer systems that work together to direct dryand wet deposition to streams during storm events. Comparisonsbetween the percentage of ADN in NMR versus other urban andsuburban watersheds using mixing models reveal the strength ofthe Baysian-based MCMC approach in incorporating uncer-tainty in source endmember values. Studies in other temperate,Eastern U.S. cities report substantial ADN-sourced nitrate instreamwater, similar to the percentage reported here (New York,43−50%;25 Baltimore, MD, 5−94% ADN, with a reportedaverage of 50%12). However, endmembers used in the othermixing models do not incorporate the substantial uncertainty inthe range of values for each source. It should be noted that neweranalytical approaches using O-NO3- take advantage of reduceduncertainty in apportioning atmospheric nitrate inputs to urbansystems (for examples, see reference 53). The MCMC analysisused here takes into account the range of values possible forsource endmembers, thereby accurately estimating uncertainty inthe contribution of ADN-sourced nitrate.
Denitrification in the NMR Watershed. The process ofdenitrification contributes to overall nitrate retention observed inthe NMR watershed. The increase in δ15N and δ18O values atdownstream NMR3 suggests a portion of the nitrate poolundergoes denitrification (Figure S4, Supporting Information),and SIAR mixing models estimate that 7 ± 2% of streamwaternitrate at NMR1 is contributed by pools of sewage-derivednitrate that exhibit the isotopic effects of denitrification, whiledownstream at NMR3, 19 ± 3% is contributed by this source(Figure 3). Nitrate in the steam draining the FH subwatershedalso shows evidence of denitrification, with 22 ± 3% ofstreamwater nitrate contributed by denitrified, sewage-sourcednitrate sources (Figure 3). This contrasts with previous work thatconcludes, on the basis of dual-isotope data, that nitrate sourcedfrom leaky sewers does not undergo processing.12 The positiveslope of δ15N vs δ18O suggests denitrification contributions atNMR3, where isotopic values increase linearly, with a ratio of1:2.3 (Figure S4, Supporting Information). The linear trendindicates systemic enrichment of the remaining nitrate pool, aslighter isotopes are removed via Rayleigh fractionation.8,27 In theNMRwatershed, the weaker isotopic trend at NMR1may be dueto the proximity of the buried portion of NMR with leakingunderground sewers that would continue to supply sewer-
Figure 3. Boxplots of mixing model proportions for each site,categorized by source, during baseflow. Shown are the 5%, 25%, 75%,and 95% Bayesian credible intervals for the probability distributioncalculated for each source.
Environmental Science & Technology Article
dx.doi.org/10.1021/es404880j | Environ. Sci. Technol. 2014, 48, 10580−1058710585

sourced nitrate to the stream.24,54 While precise quantification ofdenitrification rates will require in situ experiments or otherapproaches. The application of dual-isotope analysis withMCMC techniques documents denitrification of sewage-sourcednitrate.
■ IMPLICATIONSDual nitrate isotope analysis has refined mass-balance inversemodeling results, attributing up to 94% of in-stream nitrateduring baseflow to sewage-derived sources (including sewagethat has undergone some denitrification) and an average of 67%during stormflow.21 Furthermore, this analysis documents andquantifies significant retention of ADN-sourced nitrate in thewatershed. This information is important for efforts to reducenitrate concentrations in urban streams. The impact of reactivenitrogen on downstream systems is strongly dependent on thehydrologic connectivity between nitrogen source and surfacewaters.42 In the system described here, both ADN and sewagesources are connected to streamwater via hydrological pathways,thereby leading to significant impacts on streamwater nitrateloads. Both sources, but in particular sewage, contribute to nitrate“hypersaturation” in urban streams with severe negativeimplications for ecosystem health and in-stream biota.8 Toreduce nutrient loads in NMR and other urban systems withsimilarly aged sewage infrastructure, focus must be placed onhow to reduce these leaks or increase processing of sewer-sourced nitrate before it reaches the stream, where it is quicklyexported from the watershed. Source and process information,such as that demonstrated here, should be made part ofmanagement decisions in order to effectively mitigate nutrientproblems in urban watersheds.55
■ ASSOCIATED CONTENT*S Supporting InformationTable S1 and Figures S1−S4. This material is available free ofcharge via the Internet at http://pubs.acs.org.
■ AUTHOR INFORMATIONCorresponding Author*E-mail: [email protected]; phone: (412) 624-8882; fax:(412) 624-391.NotesThe authors declare no competing financial interest.
■ ACKNOWLEDGMENTSFunding provided by the University of Pittsburgh DietrichSchool of Arts & Sciences, the Pennsylvania Water ResourcesResearch Institute, the Geological Society of America, and theU.S. Steel Foundation. We are grateful and thankful for the fieldand lab assistance provided by Emily Broich, Talia Brinton, JesseBobrzynski, Kevin Divers, Christina Farber, Katelin Fisher, DonFulmer, Michelle Gregorich, Krissy Hopkins, ChristopherHughes, Amelia Johnson, Mollie Kish, Jennifer Lozano, AmarMehta, Tamara Misner, Michael Muder, Katie Redling, LucyRose, Shellie Rose, Erin Stacy, Sarah Strano, James Tucker, KatieTuite, Erin Wozniak, and Margaret Zak.
■ REFERENCES(1) Lerner, D. N. Identifying and quantifying urban recharge: A review.Hydrogeology 2002, 10, 143−152.(2) Walsh, C. J.; Roy, A. H.; Feminella, J. W.; Cottingham, P. D.;Groffman, P. M.; Morgan, R. P. The Urban Stream Syndrome, current
knowledge and the search for a cure. J. North Am. Benthological Soc.2005, 24 (3), 706−723.(3) Cadenasso, M. L.; Pickett, S. T.; Groffman, P. M.; Band, L. E.;Brush, G. S.; Galvin, M. F.; Grove, J. M.; Hagar, G.; Marshall, V.;McGrath, B. P.; O’Neil-Dunne, J. P. M.; Stack, W. P.; Troy, A. R.Exchanges across land-water-scape boundaries in urban systems;Strategies for reducing nitrate pollution. Ann. N.Y. Acad. Sci. 2008,1134, 213−232.(4) Kaye, J. P.; Groffman, P. M.; Grimm, N. G.; Lawrence, B. A.;Pouyat, R. V. A distinct urban biogeochemistry? Trends Ecol. Evol. 2006,21 (4), 192−199.(5) Lerner, D. N.; Yang, Y.; Barrett, M. H.; Tellam, J. H. Loadings ofnon-agricultural nitrogen in urban groundwater. In Impacts of UrbanGrowth on Surface Water and Groundwater Quality (Proceedings of IUGG99 Symposium HS5), Birmingham, July 1999; IAHS Publ. no. 259.(6)Wolf, L.; Held, I.; Eiswirth, M.; Hotzl, H. Impact of leaky sewers ongroundwater quality. Acta Hydrochimica Hydrobiologia 2004, 32, 361−373.(7) Rueedi, J.; Cronin, A. A.; Morris, B. L. Estimation of sewer leakageto urban groundwater using depth-specific hydrochemistry. WaterEnviron. 2009, 23, 134−144.(8) Stanley, E.; Maxted, J. T. Changes in the dissolved nitrogen poolacross land cover gradients in Wisconsin streams. Ecol. Appl. 2008, 18(7), 1579−1590.(9) Wollheim, W. M.; Pellerin, B. A.; Vorosmarty, C. J.; Hopkinson, C.S. N retention in urbanizing headwater catchments. Ecosystems 2005, 8,871−884.(10) US EPANitrogen in urban streams; http://www.epa.gov/caddis/ssr_urb_wsq3.html (accessed December 1, 2013).(11) Silva, S. R.; Ging, B. P.; Lee, R. W.; Ebbert, J. C.; Tesoriero, A. J.;Inkpen, E. L. Forensic applications of nitrogen and oxygen isotopes intracing nitrate sources in urban environments. Environ. Forensics 2002, 3,125−130.(12) Kaushal, S.; Groffman, P. M.; Band, L. E.; Elliott, E. M.; Shields, C.A.; Kendall, C. Tracking nonpoint source nitrogen pollution in human-impacted watersheds. Environ. Sci. Technol. 2011, 45 (19), 8225.(13) Rosenzweig, B. R.; Moon, H. S.; Smith, J. A.; Baeck, M. L.; Jaffe, P.R. Variation in the instream dissolved inorganic nitrogen responsebetween and within rainstorm events in an urban watershed. J. Environ.Sci. Health 2008, 43, 1223−1233.(14) Wakida, F. T.; Lerner, D. N. Non-agricultural sources ofgroundwater nitrate: A review and case study. Water Res. 2005, 39, 3−16.(15) Sydney, R.; Esfandi, E.; Surapaneni, S. Control concrete sewercorrosion via the crown spray process.Water Environ. Res. 1996, 68 (3),338−347.(16) Neethling, J. B.; Mah, R. A.; Stenstrom, M. K. Causes and controlof concrete pipe corrosion. Annual Report Submitted to the CountySanitation Districts of Los Angeles County, 1989; http://www.q u a k e w r a p . c o m / f r p % 2 0 p a p e r s /CausesAndControlOfConcretePipeCorrosion.pdf.(17) Eiswirth, M.; Hotzl, H.; Lazar, C.; Merkler, G. P. Detection ofcontaminant transport from damaged sewerage systems and leakylandfills. InGroundwater quality: remediation and protection (Proceedingsof the Prague Conference), Prague, Czech Republic, 1995; Kransny, K.K., Ed.; IAHS: Prague, Czech Republic, 1995; IAHS Publ. no. 225.(18) USEPA Report to Congress on Impacts and Control of CombinedSewer Overflows and Sanitary Sewer Overflows: Fact Sheet EPA 833-R-04-001; USEPA: Washington, DC, August 26, 2004.(19) USEPA Combined Sewer Overflow Demographics; http://cfpub.epa.gov/npdes/cso/demo.cfm?program_id=5 (accessed October 19,2009).(20) Sobota, D. J.; Compton, J. E.; Harrison, J. A. Reactive nitrogeninputs to US lands and waterways: How certain are we about sourcesand fluxes? Front. Ecol. Environ. 2013, 11 (2), 82−90.(21) Divers, M. T.; Elliott, E. M.; Bain, D. J. Constraining nitrogeninputs to urban streams from leaking sewers using inverse modeling:Implications for dissolved inorganic nitrogen (DIN) retention in urbanenvironments. Environ. Sci. Technol. 2013, 47 (4), 1816−1823.
Environmental Science & Technology Article
dx.doi.org/10.1021/es404880j | Environ. Sci. Technol. 2014, 48, 10580−1058710586

(22) NTN The National Amospheric Deposition Program: NationalTrends Network; http://nadp.sws.uiuc.edu/ntn/ (accessed November29, 2013).(23) Clean Air Status and Trends Network (CASTNET) Factsheet;http://www.epa.gov/castnet/ (accessed January 2, 2009).(24) Anisfeld, S. C.; Barnes, R. T.; Altabet, M. A.; Wu, A. Isotopicapportionment of atmospheric and sewage nitrogen sources in twoconnecticut streams. Environ. Sci. Technol. 2007, 41, 6363−6369.(25) Burns, D. A.; Boyer, E. W.; Elliott, E. M.; Kendall, C. Sources andtransformations of nitrate from streams draining varying land uses:Evidence from dual isotope analysis. J. Environ. Qual. 2009, 38, 1149−1159.(26) Fukada, T.; Hiscock, K.; Dennis, P. A dual-isotope approach tothe nitrogen hydrochemistry of an urban aquifer. Appl. Geochem. 2004,19 (5), 709−719.(27) Kendall, C. Tracing nitrogen sources and cycling in catchments.In Isotope Tracers in Catchemnt Hydrology; Kendall, C., McDonnell, J. J.,Eds.; Elsevier: Amsterdam, 1998; pp 521−576.(28) Kendall, C.; Elliott, E. M.; Wankel, S. D. Tracing anthropogenicinputs of nitrogen to ecosystems. In Stable Isotopes in Ecology andEnvironmental Science; Lajtha, K., Michener, R., Eds.; Blackwell ScientificPublications: Oxford, 2007.(29) Lehmann, M. F.; Reichert, P.; Bernasconi, S. M.; Barbieri, A.;McKenzie, J. A. Modelling nitrogen and oxygen isotope fractionationduring dentirification in a lacustrine redox-transition zone. Geochim.Cosmochim. Acta 2003, 67 (14), 2529−2542.(30) Bottcher, J.; Strebel, O.; Voerkelius, S.; Schmidt, H. L. Usingisotope fractionation of nitrate-nitrogen and nitrate-oxygen forevaluation of microbial denitrification in a sandy aquifer. J. Hydrol.1990, 114, 413−424.(31) Aravena, R.; Robertson, W. D. Use of multiple isotope tracers toevaluate denitrification in ground water: Study of nitrate from a large-flux septic system plume. Ground Water 1998, 36, 975−982.(32) Semmens, B.; Ward, E. J.; Moore, J. W.; Darimont, C. T.Quantifying inter-and intra-population niche variability using hierarchialBayesian stable isotope mixing models. PLoS One 2009, 4 (7),No. e6187.(33)Moore, J. W.; Semmens, B. X. Incorporating uncertainty and priorinformation into stable isotope mixing models. Ecol. Lett. 2008, 11,470−480.(34) Phillips, D. L.; Gregg, J. W. Source partitioning using stableisotopes: Coping with toomany sources.Oecologia 2003, 136, 261−269.(35) Homer, C.; Huang, C.; Yang, L.; Wylie, B.; Coan, M.Development of a 2001 national landcover database for the UnitedStates. Photogramm. Eng. Remote Sens. 2004, 70 (July), 829−840.(36) Rutledge, A. T. Computer programs for describing the recessionof ground-water discharge and for estimating mean ground-waterrecharge and discharge from streamflow data - update; USGS: Reston,VA, 1998; p 43.(37) 3RWW The 3 Rivers Wet Weather Demonstration Project; http://www.3riverswetweather.org/ (accessed November 4, 2010).(38) Granger, J.; Sigman, D. M. Removal of nitrite with sulfamic acidfor nitrate N and O isotope analysis with the denitrifier method. RapidCommun. Mass Spectrom. 2009, 23, 3753−3762.(39) Sigman, D. M.; Casciotti, K. L.; Andreani, M.; Barford, C.;Galanter, M.; Bolhlke, J. K. A bacterial method for the nitrogen isotopicanalysis of nitrate in seawater and freshwater. Anal. Chem. 2001, 73 (1),4145−4153.(40) Casciotti, K. L.; Sigman, D. M.; Galanter Hastings, M.; Bolhlke, J.K.; Hilkert, A. Measurement of the oxygen isotopic composition ofnitrate in seawater and freshwater using the denitrifier method. Anal.Chem. 2002, 74, 4905−4912.(41) Coplen, T. B.; Bohlke, J. K.; Casciotti, K. L. Using dual-bacterialdentirification to improve δ15N determinationsof nitrates containingmass-independent 17O. Rapid Commun. Mass Spectrom. 2004, 18, 245−250.(42) Elliott, E. M.; Brush, G. S. Sedimented organic nitrogen isotopesin freshwater wetlands record long-term changes in watershed nitrogensources and land use. Environ. Sci. Technol. 2006, 40, 2910−2916.
(43) Kaye, J. P.; McCulley, R. L.; Burke, I. C. Carbon fluxes, nitrogencycling, and soil microbial communities in adjacent urban, native, andagricultural ecosystems. Global Change Biol. 2005, 11, 575−587.(44) Aravena, R.; Evans, M.; Cherry, J. Stable isotopes of oxygen andnitrogen in source identification of nitrate from septic systems. GroundWater 1993, 31, 180−186.(45) Fogg, G. E.; Rolston, D. E.; Decker, D. L.; Louie, D. T.; Grismer,M. E. Spatial variation in nitrogen isotope values beneath nitratecontamination sources. Groundwater 1998, 36 (3), 418−426.(46) Parnell, A.; Inger, R.; Bearhop, S.; Jackson, A. Source partitioningusing stable isotopes: Coping with too much variation. PLoS One 2010,5 (3), No. e9672.(47) R Development Core Team R: A language and environment forstatistical computing; R Foundation for Statistical Computing: Vienna,Austria, 2011.(48) Parker, D. S. Comment on constraining nitrogen inputs to urbanstreams from leaking sewers using inverse modeling: Implications fordissolved inorganic nitrogen (DIN) retention in urban environments.Environ. Sci. Technol. 2013, 47 (12), 6720.(49) Castnet, Clean Air Status and Trends Network; USEPA:Washington, DC, 2014.(50) Raciti, S. M.; Groffman, P. M.; Jenkins, J. C.; Pouyat, R. V.; Fahey,T. J.; Pickett, S. T.; Cadenasso, M. L. Accumulation of carbon andnitrogen in residential soils with different land-use histories. Ecosystems2011, 14, 287−297.(51) Groffman, P. M.; Boulware, N. J.; Zipperer, W. C.; Pouyat, R. V.;Band, L. E.; Colosimo, M. F. Soil nitrogen cycle processes in urbanriparian zones. Environ. Sci. Technol. 2002, 36, 4547−4552.(52) Dejwakh, N. R.; Meixner, T.; Michalski, G.; Mcintosh, J. Using
17O to investigate nitrate sources and sinks in a semi-arid groundwatersystem. Environ. Sci. Technol. 2001, 46, 745−751.(53) Hale, R. L.; Turnbull, L.; Earl, S.; Grimm, N. G.; Riha, K.;Michalski, G.; Lohse, K. A.; Childers, D. Sources and transport ofnitrogen in arid urban watersheds. Environ. Sci. Technol. 2014, 48, 6211−6219. Dejwakh, N. R.; Meixner, T.; et al.et al. Using 17O to InvestigateNitrate Sources and Sinks in a Semi-Arid Groundwater System. Environ.Sci. Technol. 2012, 46, 745−751. Michalski, G.; Meixner, T.; et al.et al.Tracing Atmospheric Nitrate Deposition in a Complex SemiaridEcosystem using D17O. Environ. Sci. Technol. 2004, 38, 2175−2181.(54) Mayer, B.; Boyer, E. W.; Goodale, C. L.; Jaworski, N. A.; VanBreemen, N.; Howarth, R. W.; Seitzinger, S.; Billen, G.; Lajtha, K.;Nadelhoffer, K.; Van Dam, D.; Hetling, L. J.; Nosal, M.; Paustian, K.Sources of nitrate in rivers draining sixteen watersheds in thenortheastern U.S.: Isotopic constraints. Biogeochemistry 2002, 57/58,171−197.(55) Bain, D.; Copeland, E. M.; Divers, M. T.; Hecht, M.; Hopkins, K.G.; Hynicka, J. D.; Koryak, M.; Kostalos, M.; Brown, L. M.; Elliott, E.M.;Fedor, J.; Gregorich, M.; Porter, B. A.; Smith, B.; Tracey, C.; Zak, M. A.Characterizing Major Urban Stream Restoration Projects: Nine MileRun (Pittsburgh, PA, USA). J. Am. Water Resour. Assoc., in press.
■ NOTE ADDED AFTER ASAP PUBLICATIONThis paper was published ASAP on August 19, 2014 without allof the authors’ final corrections applied. The updated paper withcomplete corrections and a revised Figure 2 was reposted onSeptember 4, 2014.
Environmental Science & Technology Article
dx.doi.org/10.1021/es404880j | Environ. Sci. Technol. 2014, 48, 10580−1058710587