Quality rating reassessments - ACECQA
31
Occasional Paper 6 July 2018 Quality rating reassessments An analysis of quality improvement in education and care services 2013-2017
Transcript of Quality rating reassessments - ACECQA

Occasional Paper 6 July 2018
Quality rating reassessments An analysis of quality improvement in education and care services 2013-2017

2
The best start in life | www.acecqa.gov.au
ContentsOverview 3
Background 6
Quality improvement at reassessment 7
Improvement in the overall quality rating 8
Improvement in the overall quality rating by service characteristics 11
Quality area ratings 17
Quality improvement at the element level 18
Quality improvement at the element level by service characteristics 19
Quality improvement – Sector perspectives 22
Factors that contribute to quality improvement 22
Case studies 24
Long day care 25
Preschool/Kindergarten 26
Outside school hours care 27
Family day care 28
Conclusion 29
Revised 2018 NQS 29

3
The best start in life | www.acecqa.gov.au
One of the six objectives of the National Quality Framework (NQF) is to promote continuous improvement in the provision of quality education and care services, with one of its six guiding principles focused on the expectation that best practice underpins service provision.
This occasional paper is the sixth in a series on the NQF. It examines trends in quality improvement from the perspective of services rated Working Towards National Quality Standard (NQS) under the 2012 NQS. In this paper, a service is considered to have improved its quality at reassessment where it:
■ receives a higher overall quality rating
■ receives a higher rating in a quality area
■ meets a higher number of elements of quality.
Qualitative analysis suggests primary drivers of quality improvement include the recruitment and retention of highly trained educators that have a good understanding of the NQF, delivering education and care under the direction of high quality service leadership.
Assessments under the 2012 NQS
Under the 2012 NQS, a service’s overall quality rating was based on:
■ 58 Elements assessed as ‘met’ or ‘not met’
■ 18 Standards rated on the four point scale below
■ 7 Quality Areas also rated on the four point scale below.
Standards, quality areas and the overall quality rating were assessed on a four point scale of:
■ Exceeding NQS
■ Meeting NQS
■ Working Towards NQS
■ Significant Improvement Required.
In addition, under the 2012 NQS, a provider with a service that had an overall rating of Exceeding NQS was eligible to apply to ACECQA to be assessed for the Excellent rating.
Overview
4
The best start in life | www.acecqa.gov.au
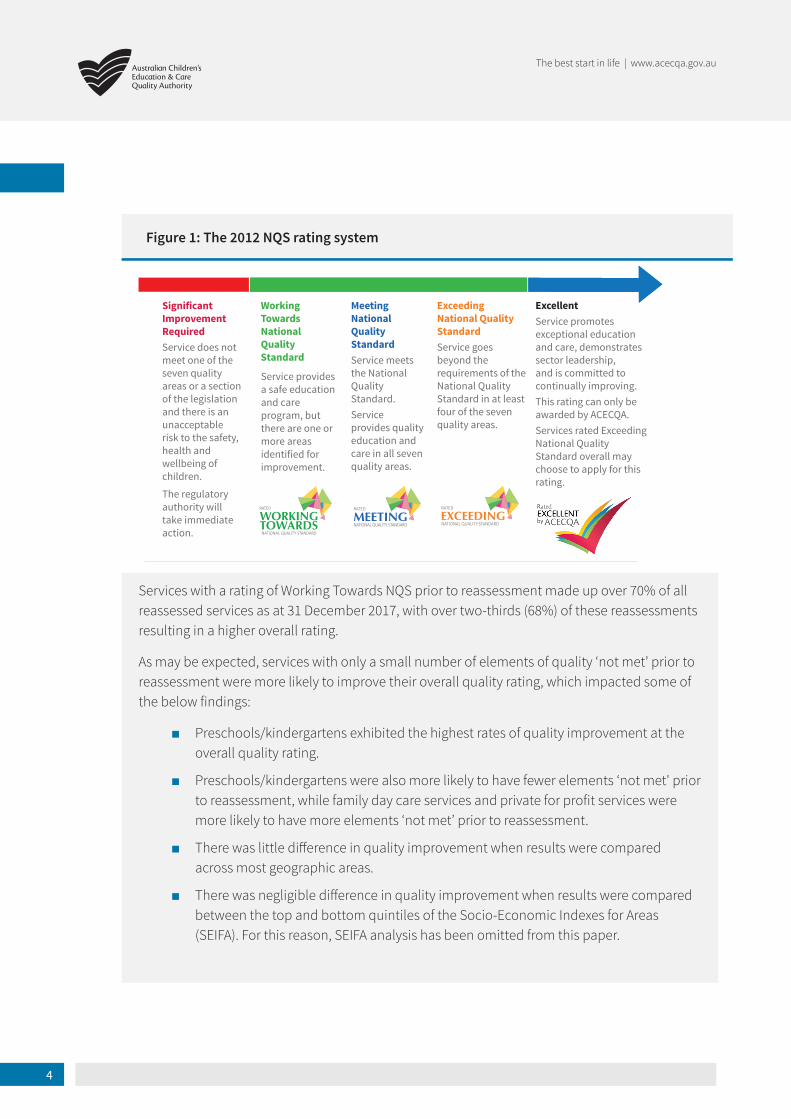
Figure 1: The 2012 NQS rating system
Significant Improvement RequiredService does not meet one of the seven quality areas or a section of the legislation and there is an unacceptable risk to the safety, health and wellbeing of children.
Meeting National Quality StandardService meets the National Quality Standard.Service provides quality education and care in all seven quality areas.
Working Towards National Quality Standard
Exceeding National Quality StandardService goes beyond the requirements of the National Quality Standard in at least four of the seven quality areas.
ExcellentService promotes exceptional education and care, demonstrates sector leadership, and is committed to continually improving.This rating can only be awarded by ACECQA.Services rated Exceeding National Quality Standard overall may choose to apply for this rating.
The regulatory authority will take immediate action.
Service provides a safe education and care program, but there are one or more areas identified for improvement.
RATED
NATIONAL QUALITY STANDARDMEETING EXCEEDINGWORKING
TOWARDSNATIONAL QUALITY STANDARD
RATED
Services with a rating of Working Towards NQS prior to reassessment made up over 70% of all reassessed services as at 31 December 2017, with over two-thirds (68%) of these reassessments resulting in a higher overall rating.
As may be expected, services with only a small number of elements of quality ‘not met’ prior to reassessment were more likely to improve their overall quality rating, which impacted some of the below findings:
■ Preschools/kindergartens exhibited the highest rates of quality improvement at the overall quality rating.
■ Preschools/kindergartens were also more likely to have fewer elements ‘not met' prior to reassessment, while family day care services and private for profit services were more likely to have more elements ‘not met’ prior to reassessment.
■ There was little difference in quality improvement when results were compared across most geographic areas.
■ There was negligible difference in quality improvement when results were compared between the top and bottom quintiles of the Socio-Economic Indexes for Areas (SEIFA). For this reason, SEIFA analysis has been omitted from this paper.

5
The best start in life | www.acecqa.gov.au
■ Family day care services were less likely than other service types to receive a higher overall quality rating following reassessment.
■ Private for profit services were less likely than services with other management types, for example not for profit and government managed services, to receive a higher overall quality rating following reassessment.
Case studies describing quality improvement practices that were evident during reassessment have been included in this paper. These case studies are intended to aid and support the process of continuous quality improvement and the ongoing development of quality improvement plans (QIPs).
Unless otherwise stated, this paper draws on data from the NQA ITS as at 31 December 2017.
The other papers in this series are:
■ Quality Area 1: Educational program and practice
■ Quality Area 2: Children’s health and safety
■ Promoting consistency and efficiency under the NQF
■ Quality Area 3: Physical environment
■ Quality Area 7: Leadership and service management

6
The best start in life | www.acecqa.gov.au
The National Quality Framework (NQF) operates under an applied law system, comprising the Education and Care Services National Law (the National Law) and Education and Care Services National Regulations (the National Regulations).
The National Regulations support the National Law by providing detail on a range of matters, including the application processes for provider and service approval, and the minimum requirements relating to the operation of education and care services. These include requirements relating to health and safety, serious incidents, medical conditions, emergencies and evacuations, indoor and outdoor space, educator to child ratios, and educator qualifications.
In addition, the National Regulations outline the National Quality Standard (NQS), which sets the benchmark for quality in education and care services, and the process for quality assessment and rating. The quality assessment and rating process is undertaken by authorised officers in each state and territory, who are trained and tested by ACECQA before they commence assessments. Ongoing authorised officer training, support and testing is also provided by ACECQA.
When state and territory regulatory authorities schedule quality rating assessments, the goal is to assess and rate the quality of services, drive continuous improvement and keep information for families and communities accurate and up to date.
To focus resources on services most in need of quality improvement, the actions of regulatory authorities are responsive and risk-based. Services with a lower quality rating are typically re-rated more frequently than services with a higher quality rating.
When managing assessment and rating schedules, state and territory regulatory authorities consider the following factors:
■ The quality rating of a service, including results at the quality area, standard and element level – for example, services with several quality areas rated at Working Towards NQS may be reassessed more frequently than services with only one or two quality areas rated at Working Towards NQS. Similarly, services rated Working Towards NQS for certain standards, or for a high number of standards, may also be reassessed more frequently.
■ A change in service attributes that may affect the service’s quality – for example, a change of ownership or service management, may result in an expedited quality assessment.
■ Events that occur at the service – for example, one or more serious incidents, or substantiated complaints or breaches of the requirements of the National Law and Regulations, may also result in an expedited quality assessment.
Background

7
The best start in life | www.acecqa.gov.au
■ The length of time since the last quality rating – for example, over time a quality rating can lose its currency and value.
The quality rating reassessment of a service can involve a review of the entire NQS or specific quality areas, standards or elements.
A quality rating reassessment can be instigated by a state and territory regulatory authority or requested by an approved provider. More information about the process of applying for a reassessment, as well as the assessment and rating process overall, can be found in the Guide to the National Quality Framework.
This paper uses quality rating data from the National Quality Agenda IT System (NQA ITS) as at 31 December 2017. As such, all quality rating data relates to the 2012 NQS. From 1 February 2018, the revised 2018 NQS replaced the 2012 NQS. More information about the 2018 NQS is available on the ACECQA website.
Continuous quality improvement is an objective, with best practice service provision a guiding principle, of the NQF that applies to all education and care services regardless of their quality rating. A risk-based approach to the reassessment of quality has meant state and territory regulatory authorities have typically focused on services that were rated Working Towards NQS.
This paper therefore focuses primarily on quality improvement among these services.
This paper examines quality improvement from three different perspectives:
1. An improvement in the overall quality rating following reassessment.
2. An improvement in quality area ratings following reassessment.
3. An improvement in the number of elements that were met following reassessment.
Quality improvement at reassessment

8
The best start in life | www.acecqa.gov.au
Improvement in the overall quality ratingTable 1 compares the ratings of services before and after reassessment. As at 31 December 2017, almost a quarter (23%) of all approved services had been reassessed.
The results show:
■ an improvement in overall quality in more than half (55%) of reassessments (the sum of all the green shaded numbers – 2090 out of 3776 reassessments)
■ no change in overall quality in more than a third (37%) of reassessments (the sum of all the orange shaded numbers – 1406 out of 3776 reassessments)
■ a decrease in overall quality in 7% of reassessments (the sum of all the red shaded numbers – 280 out of 3776 reassessments).
As previously mentioned, most reassessments (2700 out of 3776) have been of services rated Working Towards NQS. The most likely result is for a service rated Working Towards NQS to improve their overall rating to Meeting NQS. This has been the outcome on 1277 occasions. On a further 550 occasions, a reassessment of a service rated Working Towards NQS has resulted in an overall quality rating of Exceeding NQS. Combining these two outcomes results in a quality improvement rate for services rated Working Towards NQS prior to reassessment of 68% (1827 out of 2700).
Looking at reassessments of services rated Meeting NQS, 31% led to a rating of Exceeding NQS, while 21% led to a rating of Working Towards, with the remaining 48% resulting in the overall quality rating remaining unchanged.
Although only relatively few reassessments have been undertaken of services rated Exceeding NQS (302 out of 3776), almost two thirds (62%) of these resulted in another rating of Exceeding NQS. The remainder resulted in a rating of Meeting or Working Towards NQS, with performance against Quality Area 4 – Staffing arrangements most likely to have deteriorated, and performance against Quality Area 6 – Collaborative partnerships with families and communities least likely to have deteriorated.
It is important to remember that Exceeding NQS is the highest rating a state and territory regulatory authority awards, therefore it is not possible for a service rated Exceeding NQS to improve its overall rating at reassessment.
It is also noteworthy that three quarters (75%) of reassessments of the small number of services rated Significant Improvement Required resulted in a higher overall rating.

9
The best start in life | www.acecqa.gov.au
Table 1: Reassessments by overall quality rating, as at 31 December 2017
Rating after reassessmentSignificant
Improvement Required
Working Towards
NQS
Meeting NQS
Exceeding NQS
Total
Ratin
g be
fore
re
asse
ssm
ent
Significant Improvement Required
13 33 6 0 52
Working Towards NQS
15 858 1277 550 2700
Meeting NQS 0 150 348 224 722
Exceeding NQS 0 43 72 187 302
Total 28 1084 1703 961 3776Rating after reassessment
Significant Improvement
Required
Working Towards
NQS
Meeting NQS
Exceeding NQS
Improvement rate
Ratin
g be
fore
re
asse
ssm
ent
Significant Improvement Required
25% 63% 12% - 75%
Working Towards NQS
1% 32% 47% 20% 68%
Meeting NQS - 21% 48% 31% 31%
Exceeding NQS - 14% 24% 62% -

10
The best start in life | www.acecqa.gov.au
Figure 2 tracks the reassessment outcomes over time for services rated Working Towards NQS. The proportion of Working Towards NQS services that improved their overall quality rating has remained very similar, ranging from 70% as at Q2 2016 to 68% as at Q4 2017.
Figure 2: Overall quality rating changes for services that have been reassessed where previous rating was Working Towards NQS
68% 70% 69% 69% 69% 69% 69% 68%
32% 30% 31% 31% 30% 31% 31% 32%
0.0% 0.1% 0.1% 0.2% 0.3% 0.3% 1% 1%
Q1 Q2 Q3 Q4 Q1 Q2 Q3 Q4
2016 2017
Higher rating Unchanged rating Lower rating

11
The best start in life | www.acecqa.gov.au
64%
68%
85% 82%
67%
63%
71%
52% 50%
60%
70%
80%
90%
100%
Q1 Q2 Q3 Q4 Q1 Q2 Q3 Q4
2016 2017
Long Day Care Preschool/Kindergarten Outside School Hours Care Family Day Care
Improvement in the overall quality rating by service characteristics
Service type Figure 3 tracks the reassessment outcomes over time by service type for services that were rated Working Towards NQS before reassessment and received a higher overall rating after reassessment.
The proportion of services previously rated Working Towards NQS that received a higher rating at reassessment has remained largely consistent for preschools/kindergartens, long day care services and outside school hours care services.
In contrast, there is a clear declining trend in quality improvement for family day care services since Q2 2016, at which point 76% of reassessed family day care services improved their overall quality rating, compared to Q4 2017, at which point 52% of reassessed family day care services improved their overall quality rating. This result is influenced by the relatively low numbers of family day care services that have been reassessed (29 services at Q2 2016; 102 services at Q4 2017).
Figure 3: Proportion of services that received a higher overall rating at reassessment where the previous overall rating was Working Towards NQS, by service type
Preschools/kindergartens (67%) and long day care (45%) services were more likely than outside school hours care (43%) and family day care (34%) services to have a small number of elements (between one and five) ‘not met’ prior to reassessment. They were also more likely to demonstrate quality improvement at reassessment.

12
The best start in life | www.acecqa.gov.au
As shown in Table 2, quality improvement at the overall rating level was observed among 79% of long day care services and 85% of preschools/kindergartens rated at Working Towards NQS prior to reassessment based on one to five elements being not met.
Table 2: Number and proportion of Working Towards NQS services by service type that received a higher overall rating following reassessment, by the number of elements ‘not met’ prior to reassessment
1 to 5 elements
6 to 19 elements
20 or more elements Total
Long day care 547 418 70 1035
Preschool/Kindergarten 190 73 10 273
Outside school hours care 220 208 37 465
Family day care 21 29 3 53
Total 978 728 120 1826
1 to 5 elements
6 to 19 elements
20 or more elements Total
Long day care 79% 64% 38% 68%
Preschool/Kindergarten 85% 75% 71% 82%
Outside school hours care 69% 62% 45% 63%
Family day care 60% 56% 20% 52%
Total 77% 64% 40% 68%
13
The best start in life | www.acecqa.gov.au
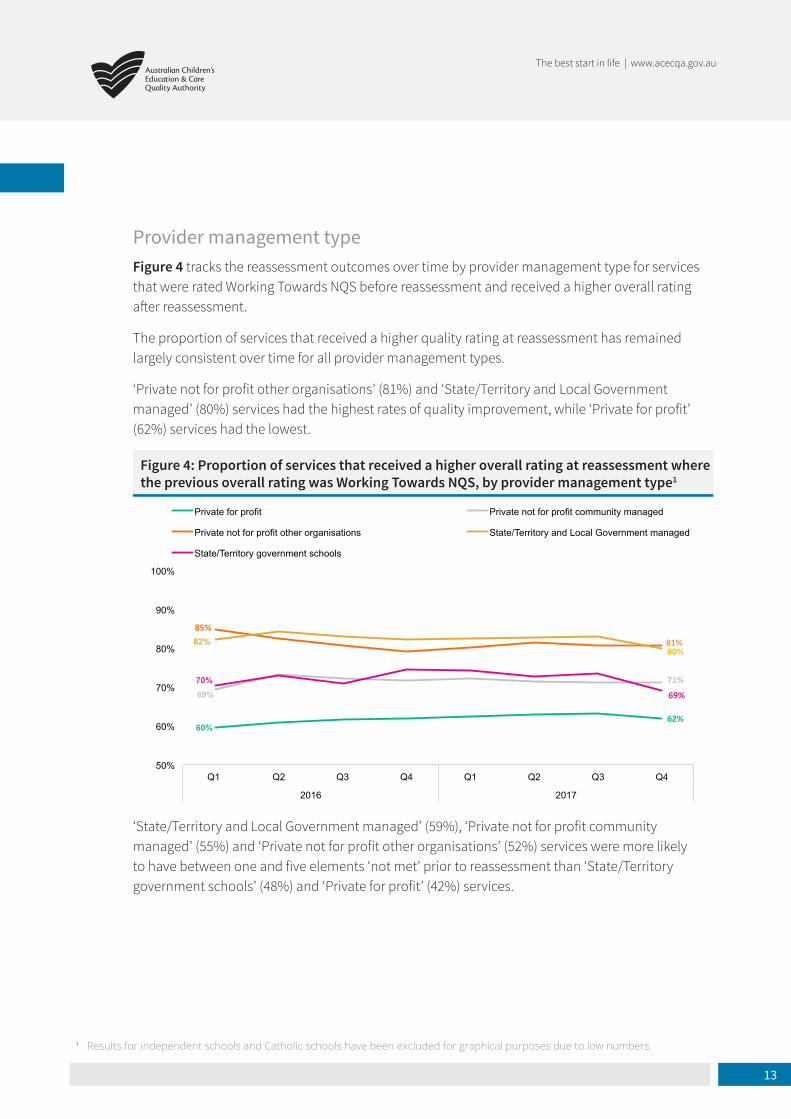
Provider management type Figure 4 tracks the reassessment outcomes over time by provider management type for services that were rated Working Towards NQS before reassessment and received a higher overall rating after reassessment.
The proportion of services that received a higher quality rating at reassessment has remained largely consistent over time for all provider management types.
‘Private not for profit other organisations’ (81%) and ‘State/Territory and Local Government managed’ (80%) services had the highest rates of quality improvement, while ‘Private for profit’ (62%) services had the lowest.
Figure 4: Proportion of services that received a higher overall rating at reassessment where the previous overall rating was Working Towards NQS, by provider management type1
‘State/Territory and Local Government managed’ (59%), ‘Private not for profit community managed’ (55%) and ‘Private not for profit other organisations’ (52%) services were more likely to have between one and five elements ‘not met’ prior to reassessment than ‘State/Territory government schools’ (48%) and ‘Private for profit’ (42%) services.
1 Results for independent schools and Catholic schools have been excluded for graphical purposes due to low numbers.
60% 62%
69% 71%
85%
81%82% 80%
70%
69%
50%
60%
70%
80%
90%
100%
Q1 Q2 Q3 Q4 Q1 Q2 Q3 Q4
2016 2017
Private for profit Private not for profit community managed
Private not for profit other organisations State/Territory and Local Government managed
State/Territory government schools

14
The best start in life | www.acecqa.gov.au
As shown in Table 3, around three quarters of Working Towards NQS ‘Private for profit’ (74%) and ‘Private not for profit community managed’ (75%) services with one to five elements ‘not met’ prior to reassessment exhibited overall quality improvement following reassessment. This proportion rose to 86% for ‘Private not for profit other organisations’ services and 85% for ‘State/Territory and Local Government managed’ services.
Furthermore, at least three quarters of services managed by ‘Private not for profit other organisations’ exhibited overall quality improvement following reassessment, regardless of the number of elements that were ‘not met’ prior to reassessment.
Table 3: Number and proportion of Working Towards NQS services by provider management type that received a higher overall rating following reassessment, by the number of elements ‘not met’ prior to reassessment
1 to 5 elements
6 to 19 elements
20 or more elements Total
Private for profit 429 371 63 863
Private not for profit community managed
237 149 19 405
Private not for profit other organisations
161 107 26 294
State/Territory and Local Government managed
58 33 2 93
State/Territory government schools
61 46 3 110
Total2 946 706 113 1765
1 to 5 elements
6 to 19 elements
20 or more elements Total
Private for profit 74% 59% 34% 62%
Private not for profit community managed
75% 69% 43% 71%
Private not for profit other organisations
86% 75% 79% 81%
State/Territory and Local Government managed
85% 79% 33% 80%
State/Territory government schools
80% 65% 23% 69%
Total 77% 64% 40% 68%
2 Total sum does not include counts for independent schools or Catholic schools.

15
The best start in life | www.acecqa.gov.au
Remoteness classificationFigure 5 highlights the proportion of Working Towards NQS services that received a higher rating at reassessment over time according to remoteness as measured by the Accessibility/Remoteness Index of Australia (ARIA+).3
As at 31 December 2017, ‘Major Cities of Australia’ (70%) had the highest proportion of services with a higher overall rating at reassessment. In contrast, ‘Very Remote Australia’ (55%) had the lowest proportion.
There has been an increasing trend in quality improvement for Working Towards NQS services in ‘Remote Australia’ (from 47% at Q1 2016 to 69% at Q4 2017). The results for ‘Very Remote Australia’ and ‘Remote Australia’ are influenced by the relatively low numbers of services that have been reassessed (28 services at Q1 2016; 80 services at Q4 2017).
Figure 5: Proportion of services that received a higher overall rating at reassessment where the previous overall rating was Working Towards NQS, by remoteness classification4
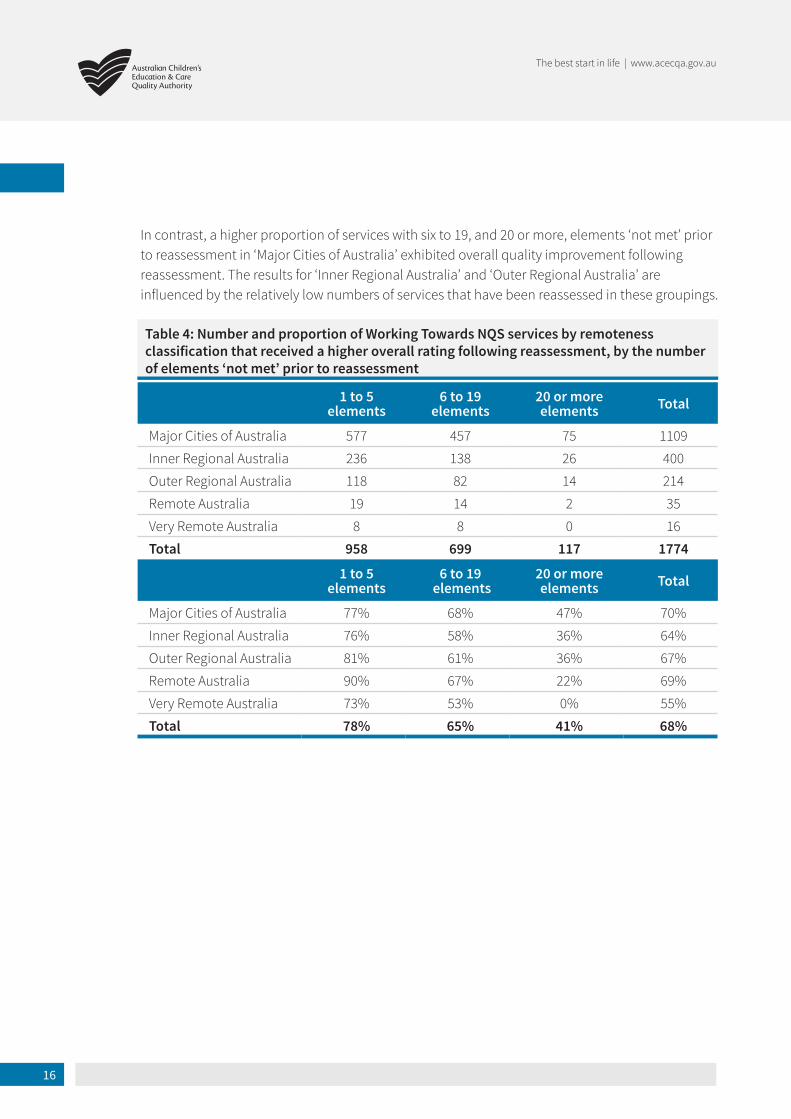
As mentioned above, the vast majority of reassessments have occurred in metropolitan and regional Australia. As shown in Table 4, a similar proportion of services with one to five elements ‘not met’ prior to reassessment exhibited overall quality improvement following reassessment across ‘Major Cities of Australia’ (77%), ‘Inner Regional Australia’ (76%) and ‘Outer Regional Australia’ (81%).
3 Family day care services are excluded from remoteness classification because their approval is not specific to one location. There are also 78 centre-based services with an address that is unable to be tagged with a remoteness classification.4 Quality improvement results for remote and very remote services are based on small sample sizes. Caution is advised when interpreting the results for these groups.
73% 70%
67% 64%
60%
67%
47%
69%
55% 55%
40%
50%
60%
70%
80%
90%
100%
Q1 Q2 Q3 Q4 Q1 Q2 Q3 Q4
2016 2017
Major Cities of Australia Inner Regional Australia Outer Regional Australia
Remote Australia Very Remote Australia
16
The best start in life | www.acecqa.gov.au
In contrast, a higher proportion of services with six to 19, and 20 or more, elements ‘not met’ prior to reassessment in ‘Major Cities of Australia’ exhibited overall quality improvement following reassessment. The results for ‘Inner Regional Australia’ and ‘Outer Regional Australia’ are influenced by the relatively low numbers of services that have been reassessed in these groupings.
Table 4: Number and proportion of Working Towards NQS services by remoteness classification that received a higher overall rating following reassessment, by the number of elements ‘not met’ prior to reassessment
1 to 5 elements
6 to 19 elements
20 or more elements Total
Major Cities of Australia 577 457 75 1109
Inner Regional Australia 236 138 26 400
Outer Regional Australia 118 82 14 214
Remote Australia 19 14 2 35
Very Remote Australia 8 8 0 16
Total 958 699 117 1774
1 to 5 elements
6 to 19 elements
20 or more elements Total
Major Cities of Australia 77% 68% 47% 70%
Inner Regional Australia 76% 58% 36% 64%
Outer Regional Australia 81% 61% 36% 67%
Remote Australia 90% 67% 22% 69%
Very Remote Australia 73% 53% 0% 55%
Total 78% 65% 41% 68%

17
The best start in life | www.acecqa.gov.au
69% 70% 72%
74% 74% 75%
84%
81% 82%
86%
81% 81%
73% 72%
60%
70%
80%
90%
100%
Q1 Q2 Q3 Q4 Q1 Q2 Q3 Q4
2016 2017
QA1 QA2 QA3 QA4 QA5 QA6 QA7
Quality area ratings Figure 6 shows the trend in the proportion of services rated at Working Towards NQS for individual quality areas that received a higher rating at reassessment for that quality area.
The rate of quality improvement over time has remained consistent across all seven quality areas.
As at Q4 2017, quality improvement at reassessment was highest in Quality Area 5 – Relationships with children (86%), Quality Area 4 – Staffing arrangements and Quality Area 6 – Collaborative partnerships with families and communities (both 81%).
In contrast, services found it more difficult to improve in Quality Area 1 – Educational program and practice (70%) and Quality Area 7 – Leadership and service management (72%). Both Quality Area 1 and Quality Area 7 have been the focus of previous occasional papers published by ACECQA. Both papers identify these quality areas as the most challenging for services to be rated Meeting or Exceeding NQS.
These two quality areas are very important to the quality improvement journey. For instance, ‘effective leaders lead and influence organisational change and consequently are instrumental in driving quality improvement and implementing national reforms such as the NQS’.5 Educational leaders are also responsible for the development and implementation of the educational program and assessment and planning cycle, illustrating the correlation between quality improvement in Quality Area 7 and Quality Area 1.6
Figure 6: Proportion of services that received a higher quality area rating at reassessment where previous rating was Working Towards NQS for that quality area
5 ACECQA, Occasional Paper 5: Leadership and management in education and care services, p.19. 6 ACECQA, Information sheet, Quality Area 7: The role of the educational leader, p.1.

18
The best start in life | www.acecqa.gov.au
Quality improvement at the element level This section examines quality improvement in terms of an increase in the number of elements met at reassessment among services that were rated Working Towards NQS at their previous assessment. The analysis includes services that did not receive a higher overall rating following reassessment.
Figure 7 tracks the proportion of services with an initial rating of Working Towards NQS that either met more, the same number, or fewer elements at reassessment. At least 85% of reassessments of Working Towards NQS services over time have resulted in a higher number of elements being met.
It should be noted that the proportion of Working Towards NQS services with more elements judged as met at reassessment has gradually decreased. This may be as a result of the risk-based approach adopted by state and territory regulatory authorities when scheduling and prioritising reassessments. Services with the greatest number of elements judged as ‘not met’, and therefore the greatest scope for improvement, may have been prioritised for reassessment before services with fewer elements judged as ‘not met’.
Figure 7: Element level changes for services that have been reassessed where previous rating was Working Towards NQS
89% 89% 88% 88% 88% 87% 86% 85%
2% 2% 2% 2% 2% 2% 2% 2%
9% 9% 10% 11% 11% 12% 12% 13%
Q1 Q2 Q3 Q4 Q1 Q2 Q3 Q4
2016 2017
More elements met Unchanged number of elements met Fewer elements met

19
The best start in life | www.acecqa.gov.au
92%
85% 83%
73%
Preschool/Kindergarten Long Day Care Outside School Hours Care Family Day Care
85%
Quality improvement at the element level by service characteristics
Service type As at 31 December 2017, preschools/kindergartens (92%) were most likely to have a higher number of elements assessed as met following reassessment, followed by long day care services (85%), and outside school hours care services (83%). Less than three quarters (73%) of family day care services had a higher number of elements met following reassessment (see Figure 8).
Figure 8: Proportion of services with more elements met following reassessment by service type, as at 31 December 2017

20
The best start in life | www.acecqa.gov.au
92% 91% 87% 86% 82%
State/Territory and Local Government managed
Private not for profit other organisations
Private not for profit community managed
State/Territory government schools
Private for profit
85%
Provider management typeFigure 9 shows over 80% of services improved in quality at the element level regardless of their provider management type. ‘State/Territory and Local Government managed’ (92%) and ‘Private not for profit other organisations’ (91%) services were most likely to demonstrate quality improvement at the element level following reassessment. In contrast, ‘Private for profit’ services were least likely to demonstrate quality improvement (82%).
Figure 9: Proportion of services with more elements met following reassessment by provider management type, as at 31 December 2017

21
The best start in life | www.acecqa.gov.au
Remoteness classificationWhile noting the relatively small sample sizes, services in ‘Very Remote Australia’ (97%) and ‘Remote Australia’ (92%) were most likely to demonstrate quality improvement at element level. Services located in ‘Inner Regional Australia’ were slightly less likely to demonstrate quality improvement than the national proportion (83% of services compared to 85% of all services).
Figure 10: Proportion of services with more elements met following reassessment by remoteness classification, as at 31 December 2017
97% 92% 88%
86% 83%
Very Remote Australia Remote Australia Outer Regional Australia Major Cities of Australia Inner Regional Australia
85%
22
The best start in life | www.acecqa.gov.au
Through its ongoing statutory functions, such as monitoring and guiding the administration of the NQF, ACECQA has gathered information from both state and territory regulatory authorities, and approved providers of education and care services, about the factors contributing to quality improvement at reassessment. A brief discussion of the primary factors is provided below.
Factors that contribute to quality improvementThe primary factors that contribute to quality improvement at reassessment include:
■ service staff familiarity with the regulatory system, including the quality rating system
■ high quality leadership, particularly from the service’s educational leader.
Staff familiarity with the regulatory systemThe presence of experienced staff has a positive impact on quality improvement at a service. Experienced and high quality staff are generally more familiar with the requirements under the NQF and have in-depth knowledge and understanding of the National Law and Regulations. They also have a better understanding of the practical application of the NQS in the service environment. As such, they are better equipped to assess their service’s strengths and weaknesses, and implement quality improvement initiatives.
Increased familiarity with the requirements of the NQF also leads to more ‘authentic’ Quality Improvement Plans (QIPs) to guide improvement efforts, as experienced educators have a better understanding of key terms such as ‘embedded practice’ and are more effective at critically reflecting on their practice.
State and territory regulatory authorities can offer support by including ‘QIP notes’ (suggestions to guide quality improvement efforts at a service) in the assessment and rating report completed by the authorised officer after the assessment and rating visit.
Quality improvement – Sector perspectives
7 We Hear You blog, NEL, posts, Quality Area 7 – Something in it for everyone.

23
The best start in life | www.acecqa.gov.au
High quality leadershipGood leadership, particularly at the level of the educational leader, is an essential component of quality improvement. The broad responsibility of the role is ‘to lead the development and implementation of the educational program and assessment and planning cycle’.7
Knowledgeable educational leaders understand the service’s philosophy and support educators to integrate it into their practice and the curriculum content. Effective leaders also drive an ongoing cycle of planning, review and evaluation that enables services to engage in continuous quality improvement. Studies have found that ‘leadership can positively impact on the quality of the centre as a workplace, the quality of education provided and the developmental outcomes achieved by children over time’.8
For a more detailed discussion of the components of high quality leadership and management in education and care, see Occasional Paper 5 (Quality Area 7: Leadership and management in education and care services).
8 Waniganayake et al (2017), in ACECQA, Information sheet, Quality Area 7: The role of the educational leader, p.1.
24
The best start in life | www.acecqa.gov.au
The following section includes case studies from a number of services across all four service types. These case studies provide practical examples of quality improvement in each of the different service settings. By reading about examples of quality improvement practices in other services, these case studies may promote and support the self-reflection process at services and help inform QIPs. It is important to note that these examples, while relevant to the quality improvement journey at a particular service to meet the needs of its children and families, might not be relevant for all services.
Case studies

25
The best start in life | www.acecqa.gov.au
Long day care
Collaborative partnerships
At reassessment, the service demonstrated it had continued to develop its collaborative partnerships with community organisations. For example, guidance from a local university about waste reduction has shaped the service’s sustainable practices.
The service has continued to organise an annual community event which encourages and strengthens connections within the community. The event has grown over time, and now includes many local and regional agencies, support groups, sports organisations, dance groups, performers, and other education and care services.
Leadership
At its initial assessment, the service hosted professional development opportunities which were accessible to the wider community, including families and educators from other services. These included family information sessions, and modules about working in teams and managing people.
At reassessment, the service continued to provide professional development opportunities to the wider community with one of these opportunities directly influencing practice and environments at a local school that was planning to implement a new outdoor learning program.
Educational program
During its first assessment, the service described how it had implemented a ‘yarning circle’ which provided opportunities for children to share their knowledge, experiences and interests. At reassessment, the yarning circle had developed further and now supports children’s agency by providing them with regular opportunities to contribute to the educational program.
Physical environment
At reassessment, the re-development of the service’s playground and garden had been completed, with the planning and design having been influenced by children’s opinions. Families had also shared their knowledge of plants they use in cooking. For example, a family from the Philippines shared how they use the leaves from sweet potatoes in soups and salads. Meanwhile, a family from the Solomon Islands donated plants used in their cooking to the garden.

26
The best start in life | www.acecqa.gov.au
Preschool/Kindergarten
Collaborative partnerships
The service has continued to develop its collaborative partnerships since its first assessment based on the needs of its children and families. For example, the service extended its relationships with specialists to include occupational therapists and speech pathologists to support children to participate fully in the service’s programs.
Leadership
The service shares its knowledge and experiences in various ways. Examples include the service supporting other education and care services, and contributing content to professional publications.
Staff professional development
The service provides access to support initiatives and professional development opportunities for staff. An example of this is the ‘Wednesday program’, which involves setting aside two hours each Wednesday afternoon for professional learning. During this time educators are encouraged to engage with their colleagues around issues of teaching and learning.
At reassessment, the service further developed the ‘Wednesday program’, by providing the various training opportunities for staff during the two-hour period. This included anaphylaxis training, child protection training, curriculum meetings and discussions on the QIP.

27
The best start in life | www.acecqa.gov.au
Outside school hours care
Collaborative partnerships
The service has continued to develop collaborative partnerships with community organisations identified in their first assessment.
For example, a partnership with a computer retailer has enabled both educators and children to learn about computer programs, improve their skills and provide opportunities for children to extend their learning based on their interests.
The service also expanded its work with support services and organisations supporting socio-economically disadvantaged groups. For example, the service has recently developed a collaborative partnership with a small remote preschool. Children donated resources, drafted emails and made signs to attract support from families who also donated resources and clothes, which were posted to the remote preschool.
Leadership
The service continued to demonstrate leadership at reassessment by sharing its practice and by mentoring educators from other services. The service’s director and educational leader also presented at a series of educational leader symposiums on the role of the educational leader and what leadership means at the service.
Relationships with children and families
At reassessment, the service described the progress it had made in implementing a new program for children transitioning to high school. The plans are being shaped and influenced by input from the diverse range of children and families who use the service.
28
The best start in life | www.acecqa.gov.au
Family day care
Collaborative partnerships
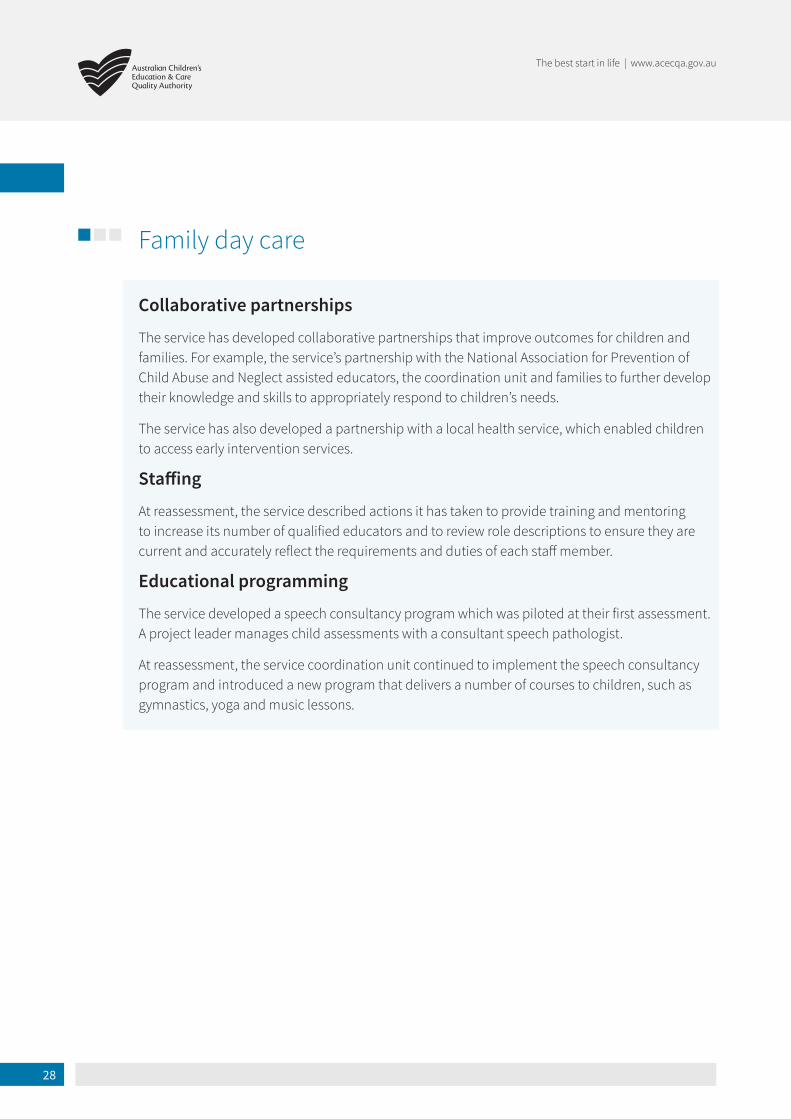
The service has developed collaborative partnerships that improve outcomes for children and families. For example, the service’s partnership with the National Association for Prevention of Child Abuse and Neglect assisted educators, the coordination unit and families to further develop their knowledge and skills to appropriately respond to children’s needs.
The service has also developed a partnership with a local health service, which enabled children to access early intervention services.
Staffing
At reassessment, the service described actions it has taken to provide training and mentoring to increase its number of qualified educators and to review role descriptions to ensure they are current and accurately reflect the requirements and duties of each staff member.
Educational programming
The service developed a speech consultancy program which was piloted at their first assessment. A project leader manages child assessments with a consultant speech pathologist.
At reassessment, the service coordination unit continued to implement the speech consultancy program and introduced a new program that delivers a number of courses to children, such as gymnastics, yoga and music lessons.

29
The best start in life | www.acecqa.gov.au
This paper has analysed reassessment data of thousands of education and care services to report on the dimensions of quality improvement as at Q4 2017 (31 December 2017).
Between 2013 and 2017, education and care services have demonstrated a strong and persistent rate of quality improvement at the overall rating level. Furthermore, the majority of services which did not improve their overall rating have demonstrated improvements at the quality area, standard and/or element level.
The paper also highlighted differences in results at reassessment according to a number of service characteristics, including service and provider management type. It is important to view these in the context of how ‘close’ or ‘far away’ different service types were from achieving overall quality improvement – in other words, by considering how many elements of quality were judged as ‘not met’ prior to reassessment.
The paper emphasises two important drivers of quality improvement: high quality educators who are familiar with the regulatory system; and effective leaders who understand and articulate a service’s philosophy, including its translation into practice. ACECQA intends to undertake follow-up qualitative research to further examine the drivers of quality improvement by engaging with a representative cross section of services that have improved their overall quality rating from Working Towards NQS to Meeting or Exceeding NQS.
A number of case studies have also been included in this paper to provide non-prescriptive examples of quality improvement practices that have been undertaken in different types of services.
Revised 2018 NQSThe revised 2018 NQS was introduced on 1 February 2018. It removed some conceptual overlap between elements and standards, clarified language and reduced the number of standards from 18 to 15, and the number of elements from 58 to 40.
A feature of the 2018 NQS is the introduction of key concepts for each standard and element. These concepts support services to identify strengths and opportunities for quality improvement.
Ongoing self-assessment against the NQS drives continuous improvement and is essential to providing quality outcomes for children. To aid in this process, ACECQA, in collaboration with regulatory authorities, has produced guidance on developing a QIP and an updated QIP template.
Conclusion

30
The best start in life | www.acecqa.gov.au
ACECQA, in collaboration with state and territory regulatory authorities, has also developed a number of information sheets and resources, including a comprehensive Guide to the NQF.
From 1 February 2018, to achieve a rating of Exceeding NQS for any standard, three Exceeding themes need to be reflected in service practice for that standard. The themes are:
■ Practice is embedded in service operations
■ Practice is informed by critical reflection
■ Practice is shaped by meaningful engagement with families and/or the community.

31
The best start in life | www.acecqa.gov.au
© Australian Children’s Education and Care Quality Authority 2018
This work has been produced by the Australian Children’s Education and Care Quality Authority (ACECQA). Apart from any use permitted under the Copyright Act 1968, no part of this publication may be reproduced by any process without written permission from ACECQA.
Comments and suggestions regarding this publication are welcomed and should be forwarded to ACECQA.
Published by ACECQA
ABN 59 372 786 746
Level 6, 175 Liverpool Street, Sydney NSW 2000
Web: www.acecqa.gov.au
Email: [email protected]
Media enquiries: [email protected]
© 2018 Australian Children’s Education and Care Quality Authority.

![FDC Guidance - ACECQA...February 2018 FDC Guidance n u v }( ] v v À vµ More information is available on the ACECQA website acecqa.gov.au Useful resources Guide to the NQF Family](https://static.fdocuments.us/doc/165x107/5fe25db77b59232669690142/fdc-guidance-acecqa-february-2018-fdc-guidance-n-u-v-v-v-v-more.jpg)