Quality ProgressApril 2012
76
v QUALITY PROGRESS | APRIL 2012 THE 7 NEW QUALITY TOOLS VOLUME 45/NUMBER 4 Plus: Quality Can Drive Economic Recovery p. 12 The 7 new quality tools: When the basics just aren’t enough p. 18 Meet the 2011 Baldrige Recipients p. 30 Q P QUALITY PROGRESS Moneyball: A Winning Strategy? p. 36 Putting Best Practices to Work www.qualityprogress.com | April 2012
-
Upload
jcastellon14370 -
Category
Documents
-
view
127 -
download
0
Transcript of Quality ProgressApril 2012

v
Qu
ality Pro
gress | a
Pril 2012 th
e 7 New
Qu
ality to
ols
Volu
me 45/N
um
ber 4
Plus: Quality Can Drive Economic Recovery p. 12
the 7 new quality tools: when the basics just aren’t enough p. 18
Meet the 2011 Baldrige Recipients p. 30
QPQUALITY PROGRESS
Moneyball: a winning
strategy? p. 36
Putting Best Practices to Work www.qualityprogress.com | april 2012

Learn to see your data.
e-learning for statistics
UCL=49.72
X=34.25
LCL=18.78
www.qualitytrainer.com
QualityProgress_QTFullpage_EN-US_07-29-11.indd 1 7/29/2011 9:15:20 AM
Visit us at booth 403 at the ASQ World Conference on Quality and Improvement.

www.etq.com/quality800-354-4476 • [email protected]
: Integrated modules for Quality and FDA Compliance Management:
CAPA • Change Management • Risk Assessment ...and more!
Risk Management eventsin the Quality System
Flexible: Leading edge flexible workflow adapts to all business processes, without programming
: Integrates with 3rd party business systems
Scalable: Readily adapts to enterprise environments, and deployments
Supplier Management: Collaborates with Suppliers through Supplier
Business Intelligence in decision-making with hundreds of configurable charts and reports
...with the most VALUE
Select the Enterprise Quality &
CAPAQuality Compliance Software
Receiving
QualityQMS Software
QMS
ISO/TS MRB
DiscreteCalibration
Risk Assessment
Product Data Management
Process
Product Data Management
Corrective Actions
Quality Systems Software
ISO/TS 16949
FMEA
QMS Software
QMS Software
Calibration
TL 9001
TL 9001
CAPA
Process
QualityISO 13485
ISO
ERP
Nonconforming Materials
Discrete
MES
Quality Software
Manufacturing
NCMISO
Quality Assurance
ISO 9000
ISO 9000ISO 9000
Supplier Rating
ERP
Quality ComplianceManufacturingNonconformance
QMS
CalibrationISO/TS
ISO/TS
Quality Assurance
FMEA
ISO 13485
Quality Management SoftwareCorrective Actions
AS9100
QMS Software
Quality Compliance
CAPAISO Process
PDM
Risk Assessment
FMEA
Manufacturing
Manufacturing
Product Data Management
ISO/TS 16949
ERPCAPA
Quality ComplianceManufacturing
NCM
Nonconforming MaterialsISO 9000Discrete
QualityCAPA
ISO/TS CalibrationQuality Software
QualityISO
Discrete
Supplier
PDM
Materials
Inspections
QMS Software
ISO 13485
Quality AssuranceManufacturing
NCMR
Corrective ActionsMRBNonconforming
Nonconforming
Calibration ISO 13485
Calibration
ISO/TSAS9100Compliance
Compliance
Process
Manufacturing
Calibration
FMEA
PDM
ISO/TS
QMS PDM
TL 9001
QMS
QualitySupplier
Quality AssuranceERP
ISO 13485
Quality
ISO 13485AS9100
ISO/TS
CAPAFMEA
Process
Quality
Rating
Inspections
PDM
FMEAISO
Supplier& Materials
Supplier & Materials
Nonconformance
TL 9001
Supplier & Materials
QMS Software
MaterialsISO/TS
MRB
Receiving Nonconformance
Receiving Inspections
Product DataManagement
Process
QMS
Visit us at booth 517 at the ASQ World Conference on Quality and Improvement.


Putting Best Practices to Work | April 2012 | www.qualityprogress.com
ContentsFEATURES
• ’Beyond’ Bonuses A webcast series featuring authors of “Beyond the Basics,” p. 18, shows and tells more about the seven new quality tools, plus a sidebar with figures and tables describing prioritization matrixes, sometimes a stand-in for matrix data analysis.
• Not Fair Enough Scatter plots that show the role on-base percentage plays in the Moneyball method described in “Fair or Foul?” p. 36.
• Next in the Queue A flowchart, check sheet and other figures to illustrate an organization’s challenges in lining up the next project, the topic of 3.4 per Million (“Next in Line,” p. 44).
• Fishbone Focus Examples of fishbone diagrams that can be used to jump-start a lean Six Sigma project, the subject of Back to Basics (“Creative Combination,”p. 72). Spanish version is also available.
www.qualityprogress.comOnly @
BASIC QUALITY Beyond the BasicsYou've heard about the seven basic quality tools, but how much do you know about the seven new quality tools?
by Grace L. Duffy, Scott Laman, Pradip Mehta, Govind Ramu, Natalia Scriabina and Keith Wagoner.
BALDRIGE AWARDOne Size Fits AllProfiles of four organizations that ratcheted up their quality efforts and claimed 2011 Baldrige awards.
by QP Staff
STATISTICSFair or Foul? Baseball’s Moneyball method shows that using some analytics are powerful, but they can only take a team so far.
by I. Elaine Allen and Julia E. Seaman
18
30
36
20 Affinity Diagrams 21 Arrow Diagrams22 Matrix Data Analysis25 Matrix Diagrams26 Process Decision Program Charts 27 Relations Diagrams28 Tree Diagrams
36
18

QP • www.qualityprogress.com4
Inbox • Implementing a QMS for the long haul.• Undermining ISO 9000?
Expert Answers• The best Six Sigma deployment model.• Accepting—and acting on—an audit’s results.
Keeping Current • Error off the field in Major League Baseball?• A look ahead to ASQ’s world conference.
Mr. Pareto Head
QP Toolbox
QP Reviews
QP Calendar
DEPARTMENTS 7
8
14
15
64
Up FrontTools: the sequel.
PerspectivesRecovery requires shift in mindset.
3.4 per MillionAlways something in the queue.
Quality in the First PersonChecklists for everyday activities.
Career CornerThe whistle-blower’s dilemma.
Statistics RoundtableInside overlapping confidence intervals.
Standards OutlookRevisiting the rules of internal control.
One Good IdeaComparing when data are limited.
Back to BasicsTools to tackle an LSS project.
Mail Quality Progress/ASQ600 N. Plankinton Ave.Milwaukee, WI 53203Telephone Fax 800-248-1946 414-272-1734414-272-8575
Email Follow protocol of first initial and full last name followed by @asq.org (for example, [email protected]).
Article Submissions Quality Progress is a peer-reviewed publica-tion with 85% of its feature articles written by quality professionals. For information about submitting an article, call Valerie Ellifson at 800-248-1946 x7373, or email [email protected].
Author GuidelinesTo learn more about the manuscript review process, helpful hints before submitting a manuscript and QP’s 2012 editorial planner, click on “Author Guidelines” under “Tools and Resources” at www.qualityprogress.com.
Photocopying Authorization Authorization to photocopy items for internal or personal use or the internal or personal use of specific clients is granted by Quality Progress provided the fee of $1 per copy is paid to ASQ or the Copyright Clear-ance Center, 222 Rosewood Drive, Danvers, MA 01923, 978-750-8400. Copying for other purposes requires the express permission of Quality Progress. For permission, write Quality Progress, PO Box 3005, Milwaukee, WI 53201-3005, call 414-272-8575 x7406, fax 414-272-1734 or email [email protected].
Photocopies, Reprints And MicroformArticle photocopies are available from ASQ at 800-248-1946. To purchase bulk reprints (more than 100), contact Barbara Mitrovic at ASQ, 800-248-1946. For microform, contact ProQuest Information and Learning, 300 N. Zeeb Road, Ann Arbor, MI 48106, 800-521-0600 x2888, international 734-761-4700, www.il.proquest.com.
Membership and Subscriptions For more than 60 years, ASQ has been the worldwide provider of information and learn-ing opportunities related to quality. In addi-tion, ASQ membership offers information, networking, certification and educational opportunities to help quality profession-als obtain practical solutions to the many problems they face each day. Subscriptions to Quality Progress are one of the many benefits of ASQ membership. To join, call 800-248-1946 or see information and an application on p. 5.
List RentalsOrders for ASQ’s member and nonmember buyer lists can be purchased by contacting Michael Costantino at the Infogroup/Edith Roman List Management Co., 845-731-2748 or fax 845-620-9035.
COLUMNS
QUALITY PROGRESS
Quality Progress (ISSN 0033-524X) is published monthly by the American Society for Quality, 600 N. Plankinton Ave., Milwaukee, WI 53203. Editorial and advertising offices: 414-272-8575. Periodicals postage paid at Milwaukee, WI, and at additional mailing offices. Institutional subscriptions are held in the name of a company, corporation, government agency or library. Requests for back issues must be prepaid and are based on availability: ASQ members $15 per copy; nonmembers $23 per copy. Canadian GST #128717618, Canadian Publications Mail Agreement #40030175. Canada Post: Return undeliverables to 2835 Kew Drive, Windsor, ON N8T 3B7. Prices are subject to change without prior notification. © 2012 by ASQ. No claim for missing issues will be accepted after three months following the month of publication of the issue for domestic addresses and six months for Canadian and international addresses.Postmaster: Please send address changes to the American Society for Quality, PO Box 3005, Milwaukee, WI 53201-3005. Printed in USA.
ASQ’s Vision: By making quality a global priority, an organizational imperative and a personal ethic, the American Society for Quality becomes the community for everyone who seeks quality technology, concepts or tools to improve themselves and their world.
- HR AND SRDeveloping talent in a setting of sustainability and social responsibility.
- DMAIC FOR SR Six Sigma to implement lean social responsibility at your organization.
QP
6
12
44
48
50
52
61
71
72
NEXT MONTH
SPECIAL SECTION: ASQ wORLD CONFERENCE ON QUALITY AND IMPROVEMENT SPONSORS AND ExHIBITORS p. 54
8
50
66
68
BONus arTiclE!

Membership ApplicationOFFICE USE ONLY
PRIORITY CODE _______________________
Order Number ________________________
Member Number ______________________
❑ Audit (19)
❑ Automotive (3)
❑ Aviation, Space and Defense (2)
❑ Biomedical (10)
❑ Chemical and Process Industries (4)
❑ Customer-Supplier (15)
❑ Design and Construction (20)
❑ Education (21)
❑ Electronics and Communications (5)
❑ Energy and Environmental (11)
❑ Food, Drug, and Cosmetic (7)
❑ Government (22)
❑ Healthcare (18)
❑ Human Development and Leadership (13)
❑ Inspection (9)
❑ Lean Enterprise (23)
❑ Measurement Quality (17)
❑ Product Safety and Liability Prevention (25)
❑ Quality Management (1)
❑ Reliability (8)
❑ Service Quality (16)
❑ Six Sigma (26)
❑ Software (14)
❑ Statistics (12)
❑ Team & Workplace Excellence (27)
❑ Accountant
❑ Administrator
❑ Advisor
❑ Analyst
❑ Associate
❑ Auditor
❑ CEO
❑ Chemist
❑ Clinician
❑ Consultant
❑ Contractor
❑ Controller/
Comptroller
❑ Coordinator
❑ Director
❑ Engineer
❑ Facilitator
❑ Foreman
❑ General
Manager
❑ Inspector
❑ Instructor
❑ Machinist
❑ Manager
❑ Mechanic
❑ Nurse
❑ Owner
❑ Physician
❑ President
❑ Principal
❑ Professor
❑ Programmer
❑ Retired
❑ Scientist
❑ Six Sigma
Black Belt
❑ Six Sigma
Green Belt
❑ Specialist
❑ Statistician
❑ Student
❑ Superintendent
❑ Teacher
❑ Technician
❑ Unemployed
❑ Other
Which one of the following best describes your title?
ASQ does not sell email addresses to third parties.
Mailing Lists❑ Occasionally ASQ shares its mailing list with carefully selected quality-related organizations to provide you with information on products and services. Please check this circle if you do not wish to receive these mailings.
Member Referred By:
___________________________________ ____________________ Member Name Member Number
Payment Information ❑ Check or money order (U.S. dollars drawn on a U.S. bank) Make check payable to ASQ.
❑ MasterCard ❑ Visa ❑ American Express (Check one)
____________________________________________________________________ Cardholder’s Name (please print)
______________________________________________ ___________________ Card Number Exp. Date
______________________________________________ Cardholder’s Signature
____________________________________________________________________ Cardholder’s Address
MBKBK51
1
2
3
Preferred Mailing Address: ❑ Home ❑ Business
❑ Mr. ❑ Ms. ❑ Mrs. ❑ Dr. ❑ Male ❑ Female
Date of Birth _________________________________
____________________________________________________________________ First Name Middle Initial Last Name
____________________________________________________________________ Company Name Job Title
____________________________________________________________________ Business Address Ste.
____________________________________________________________________ City, State/Province Zip+4/Postal Code Country
____________________________________________________________________ Home Address Apt./Ste.
____________________________________________________________________ City, State/Province Zip+4/Postal Code Country
____________________________________________________________________Area Code/Business Telephone Area Code/Home Telephone
____________________________________________________________________ Preferred Email Address Fax
Member Type:
❑ Full $138 ❑ Associate $80 $ __________________
The one geographic Section included with Full membership will be determined by your primary address.*
Sections (geographic) may be added to any member type for an additional $20.00 each. Visit www.asq.org for a listing of available Sections.
Sections , , $_______
Contact ASQ to change your assigned Section.
Forum or Division SelectionAs part of your Full membership you receive participation in one topic- or industry-specifi c Forum or Division. Use the list below to indicate the Forum or Division number and name. _____ ______________________ $_____________ (#) Name
Additional Forums and Divisions may be added to all levels of membership.Please indicate in the list below the additional Forums or Divisions you would like and total the number you have selected.
❑ Healthcare ❑ Government❑ Manufacturing
Industry: ❑ Service ❑ Education
Total of all items (1-3): $ _________ Please submit your application with remittance to:
New memberships are effective upon receipt of payment. New members receive one year of membership from the date they join. Members are billed prior to the anniversary date of their membership for next year’s dues. Memberships, even those paid by employers, are nontransferable. All prices are subject to change.
In becoming an ASQ member, you have the duty to follow the ASQ Code of Ethics and Society governing documents.
You may also join online at www.asq.orgor by calling ASQ Customer Care at
USA and Canada: 800-248-1946Mexico: 001-800-514-1564
All other locations: +1-414-272-8575
ASQ P.O. Box 3066 Milwaukee, WI 53201-3066 USA or fax to 414-272-1734.
included
Additional Forum and Division selections:Full or Associate member ________ x $10 = $________________________
total
/ / M D Y
To help us understand what’s important to you, please tell us the top three reasons why you became an ASQ member.
❑ Career Development
❑ Certifi cation Pricing
❑ In-person Networking
❑ Involvement in ASQ’s Cause
❑ Involvement in SRO
❑ Knowledge/Information
❑ Leadership Opportunities
❑ Online Networking/Communities
❑ Product Discounts
❑ Training
WHY DID YOU JOIN?

upfront
tools: the SequelYour guide to 7 more basic quality toolsIn january 2009, we published one of our most popular cover stories ever, “Building
from the Basics: The seven essential quality tools,” which you can find at http://asq.org/
quality-progress/2009/01/basic-quality/building-from-the-basics.html. Readers wrote to
say how much they appreciated the refresher on “the old seven”—the foundation of any
quality pro’s tool box. Quality veterans—who know the tools inside and out—said they
were happy to have a neatly packaged assemblage of tools to share with colleagues who
were newer to quality.
A few years have gone by, and we thought it was high time to revisit the basics once
again. This time, though, we detail the “new seven,” as identified by the Union of Japa-
nese Scientists and Engineers (JUSE) in 1976. Its purpose for grouping these tools? To
promote ways to innovate, communicate and plan major and complex projects.
We hope you find this sequel, “Beyond the Basics,” p. 18, just as riveting as you did
the original. Don’t miss exclusive webcasts with some of the article’s authors at www.
qualityprogress.com that will debut this month. And find these and more tools and tem-
plates in the Knowledge Center at www.asq.org.
While we’re on the subject of movies, what do you get when you cross a star-studded
cast with the power of sabermetrics? The critically acclaimed, Oscar-nominated movie
“Moneyball,” which serves as the basis for the article “Fair or Foul?” p. 36. Authors
I. Elaine Allen and Julia E. Seaman take a deep look at the Moneyball method the Oakland
A’s employed beginning in the 2002 season and explain whether the tactic really made a
difference long-term for the team. They also reveal whether the method is played out.
To round out our feature roster, we take a look at the common threads present among
this year’s Baldrige recipients. While the organizations themselves couldn’t be more
different, all used the Baldrige criteria as the basis for vast quality improvements—think
98% customer satisfaction scores or a 40% drop in expensive ER visits.
Get a glimpse into how these four organizations achieved Baldrige-level excellence in
“One Size Fits All,” p. 30. QP
Seiche Sanders
Editor
PublisherWilliam A. tony
executive editor andassociate PublisherSeiche Sanders
associate editorMark Edmund
assistant editorBrett Krzykowski
manuscriPt coordinatorValerie Ellifson
contributinG editorAmanda Hankel
coPY editorSusan E. Daniels
art directorMary uttech
GraPhic desiGnerSandy Wyss
Production Cathy Milquet
advertisinG ProductionBarbara Mitrovic
diGital Production sPecialistLaura franceschi
media salesnaylor LLCLou BrandowKrys D’Antonionorbert Musialrob Shafer
media sales administratorKathy thomas
marketinG administratorMatt Meinholz
editorial officesphone: 414-272-8575fax: 414-272-1734
advertisinG officesphone: 866-277-5666
asQ administrationceo paul E. Borawski
managing directorsChristopher D. BaumanJulie GabelmannBrian J. LeHouillierMichelle MasonLaurel nelson-rowe
to promote discussion of issues in the field of quality and ensure coverage of all responsible points of view, Quality Progress publishes articles representing conflicting and minor-ity views. opinions expressed are those of the authors and not necessarily of ASQ or Quality Progress. use of the ASQ logo in advertisements does not necessarily constitute endorsement of that particular product or service by ASQ.
QualitY ProGress
QP
QP • www.qualityprogress.com6

Link in a chainIn the article “Get on Board”
(February 2012, pp. 37-40), the
author did an excellent job ar-
guing that employee involve-
ment is critical to a successful
quality management system
(QMS). Citing appropriate schol-
arly sources and providing em-
pirical findings can further en-
hance the content of this article.
The author makes the following
statement: “ISO 9001:2008 specifies
QMS requirements an organization must
achieve to consistently provide products or
services that meet customer or regulatory
requirements.” Regulatory requirements
are not optional. ISO 9001:2008 clearly
specifies that an organization must fulfill
customer requirements and regulatory
requirements.
Quality improvement benefits need to
be reviewed from the perspective of W.
Edwards Deming’s chain reaction:
1. Improving quality leads to decreased
costs.
2. Decreased costs lead to productivity
improvements.
3. Productivity improvements lead to
increased market share, better product
quality and lower price.
4. Increased market share leads to staying
in business and creating more jobs.1
The real motivation for implementing
quality standards should be continuous
quality improvement and customer satis-
faction.
Some organizations implement QMS
frameworks and standards for the wrong
reasons, such as using a QMS
just to get certification, or
the wrong way, such as using
a QMS with no or minimal
employee involvement. These
organizations are in it for
the short-term benefits and
can’t take advantage of the
long-term benefits a sound
implementation can offer.
Kishore Erukulapati
Renton, WA
RefeRence1. W. Edwards Deming, Out of the Crisis, Massachusetts
Institute of Technology Press, 1986.
Self-reflectionDelivering quality-as-process and quality-
as-result is the goal of quality professionals,
correct? If we agree nothing is or can be
unchanging, and we are planning for al-
ternative futures, we need thinkers, doers,
leaders and usable tools. Yes, ISO 9000 is
a usable tool. It is in the tool kit along with
many other tools.
Bob Kennedy has given us important
issues to think about in his article (“Taken
for Granted,” February 2012, pp. 12-13). As
quality professionals, we support results.
We support systems that deliver results. If
we undermine our systems and if we lose
our tools, there are going to be significant
problems.
If we, the “quality experts” are under-
mining one of our tools, we are causing a
problem. Kennedy’s ideas had better be
considered.
Jerry Brong
Ellensburg, WA
INBOx QPQUALITY PROGRESS
In YouR own woRdsLet us know what you think about the topics in this month’s feature articles or anything else on your mind by emailing [email protected].
PAST CHAIRE. David Spong, The Boeing Co. (retired)
CHAIRJames J. Rooney, ABS Consulting
CHAIR-ELECTJohn C. Timmerman, Marriott International Inc.
TREASURERWilliam B. (Bo) McBee, Hewlett-Packard Co. (retired)
PARLIAMENTARIANKarla Riesinger, ASQ
DIRECTORSJ. Michael (Mike) Adams, Allegheny Energy Inc. (retired)Belinda Chavez, United Space AllianceDarlene Stoddard Deane, Automotive Components
Holding LLCAlexis P. Goncalves, Pfizer Inc.Kathleen Jennison Goonan, Goonan Performance
StrategiesHarold P. Greenberg, American Certification Corp.Eric A. Hayler, BMW Manufacturing Co. LLCMarc P. Kelemen, NanoSynopsis LLCLou Ann Lathrop, Chrysler LLCJoanne D. MayoElias Monreal, Industrial Tool Die & EngineeringRichard A. Perlman, Bayer HealthCareArt Trepanier, Lockheed MartinG. Geoffrey (Geoff) Vining, Virginia TechJ. Eric Whichard, JE Whichard & AssociatesSteven E. Wilson, U.S. Department of Commerce
Seafood Inspection Program
QP EDITORIAL REVIEW BOARDRandy Brull, chair
Administrative Committee Brady Boggs, Randy Brull, Jane Campanizzi, Larry Haugh, Jim Jaquess, Gary MacLean,R. Dan Reid, Christine Robinson, Richard Stump
Technical reviewersI. Elaine Allen, Andy Barnett, David Bonyuet, John Brown, Bernie Carpenter, Ken Cogan, Linda Cubalchini-Travis, Ahmad Elshennawy, Tim Folkerts, Eric Furness, Mark Gavoor, Kunita Gear, Lynne Hare, Ron Kenett, Ray Klotz, Tom Kubiak, William LaFollette, Shin Ta Liu, Pradip Mehta, Gene Placzkowski, Paul Plsek, Tony Polito, Peter Pylipow, Philip Ramsey, R. Dan Reid, Wayne Reynolds, John Richards, James J. Rooney, Anil Sengupta, Sunil Thawani, Joe Tunner, Jeffrey Vaks, Manu Vora, Jack Westfall, James Zurn
April 2012 • QP 7

QP • www.qualityprogress.com8
Six Sigma centralQ: Which is the right way to deploy Six
Sigma initiatives:
1. Set up a separate Six Sigma department
headed by a newly created Six Sigma
manager or site deployment manager,
with all Black Belts (BB) being a part of
this department.
2. Keep all BBs in their original depart-
ments, and have them report to their
department managers, as well as Six
Sigma leadership, which is not a newly
created position, but instead is an exist-
ing manager who takes this task as
an additional responsibility. This way,
management can leverage BB resources
organizationwide based on need.
David Chen
Lisle, IL
A: Six Sigma deployment models vary
depending on the organization’s goals,
available resources, number of employees,
geographic distribution, process maturity
and culture. Each has its own advantages
and risks. Sometimes, it helps to think
about where your organization is in its
deployment life cycle—launch, growth,
expansion or mature—when selecting the
appropriate deployment model.
For larger, more geographically dis-
persed organizations that are just embark-
ing on their Six Sigma journey, I would rec-
ommend a centralized or “federal” model
that has a corporate program management
office (PMO) responsible for designing the
curriculum and training program, select-
ing projects, and executing and managing
those projects with its own dedicated BBs.
In this case, there’s a need to generate
widespread transformational change, prove
the business case, build credibility and
gain momentum by tackling highly visible
projects and getting some quick wins. This
model requires a strong corporate PMO to
enforce relentless consistency, adherence
to common process, discipline, execution
cadence and a common language.
While the centralized model offers more
control over deployment decisions, timing
and outcomes, it does require significant
management oversight.
Over time, however, the model runs
the risk of never fully integrating the Six
Sigma method, skills and mindset into the
rest of the organization’s business units,
preventing them from becoming more
self-sufficient. This, in turn, can create a
certain level of alienation between the
PMO and the business units, even leading
to a perception of elitism—corporate BBs
vs. all others.
A decentralized or “state” model is char-
acterized by a smaller PMO with more BBs
embedded in the business units. The PMO
continues to provide the basic infrastruc-
ture—tools, training, project tracking and
reporting—but leverages the BBs in the
business units for identifying and executing
the projects.
Accountability at the business unit level
is paramount. The decentralized model
provides a more flexible approach for ad-
dressing the needs of the business units,
particularly as the deployment progresses,
and more creativity and ownership is
required. In that evolution, the organization
moves from smaller, standalone projects to
larger initiatives that cross business units,
or shifts from traditional existing process
improvement projects to designing new
processes or new products.
With this model, the PMO offers strategic
support in terms of coordinating with other
business units, helping build the business
ExPErTAnSWE rS

April 2012 • QP 9
case, and guidance or expertise in using
methods such as design for Six Sigma. This
model promotes self-sufficiency among the
business units and fosters a more seamless
cultural integration of the BBs.
Decentralized deployment models gen-
erally do not work well until the organiza-
tion has reached a certain level of process
maturity, moving from initial launch to
scale, replication and sustainment.
For organizations without the resources
to staff a team of full-time BBs to sup-
port all the business units, there is a third
alternative: a hybrid approach in which the
PMO maintains only a small cadre of BBs
or Master BBs. While working on larger,
more strategic initiatives, the BBs also train
and mentor internal, part-time Green Belts
(GB) supplied by the business units. These
internal GBs work on projects sponsored by
their business units.
This model allows the PMO to ef-
fectively distribute resources and works
well in smaller organizations during the
early stages of a Six Sigma deployment.
This is the model we currently use at my
organization.
Some possible limitations of this model
are an overwhelmingly unbalanced ratio of
GBs to BBs—10-to-1 is a good ratio—and
the reliance on smaller, low-hanging proj-
ects that can be driven by part-time GBs.
regardless of the model, I would stress
one guiding principle: Form should follow
function. In other words, strive to under-
stand your organization’s strategic goals
and objectives before designing the struc-
ture of the deployment.
Peter J. Sherman
Director, process excellence
Cbeyond Inc.
Atlanta
For More InForMatIonWest, A.H. “Jack,” “Critical Stage,” Quality Progress, Septem-
ber 2009, pp. 22-27.
In denialQ: In my internal auditing activities, I have
occasionally worked with auditees who
unilaterally close nonconformity reports
in response to audit corrective action re-
quests without any corrective action being
taken. Usually, the auditee cites as justifica-
tion their disagreement with the auditor’s
nonconformity finding.
This does not seem to be supported by
logic, research or any training I’ve had, but
I also haven’t seen it expressly prohibited.
Assuming there’s proper documentation of
the requirement and evidence of the non-
conformance, is there any justification for
an auditee proceeding in this manner?
Peter McGuiness
San Ramon, CA
A: There is no justification for an auditee
unilaterally closing a nonconformance
report without taking corrective action just
because the auditee does not agree with
the nonconformance cited. If and when this
happens, it’s up to the lead auditor, team
leader or general auditor to raise this mat-
ter to the next level of management—pref-
erably, to the client.
The client is the person who originally
authorized the audit and thus has a vested
interest in an audit outcome; otherwise,
the client would not have authorized the
audit, even in the case of an internal audit.
Every audit has a client, whether the audit
is internal or external, and it’s up to this
client to officially accept or not accept
the closure of any nonconforming items.
Therefore, the key is to figure out who the
client is.
In the case you detailed, it may be that
the auditee is able to convince the client
that the nonconformance cited in the
internal audit does not matter much, and
therefore no corrective action is required.
In this case, I would highly recommend
that auditors—either by themselves or
through their boss—bring the client up to
date about the incidents in which the audi-
tee closed an incident of nonconformance
without any corrective actions simply
because the auditee did not agree with the
nonconformance.
Pradip Mehta
Principal
Mehta Consulting LLC
Coppell, TX
ExPErTAnSWE rSStrive to understand your organization’s goals before designing your Six Sigma deployment.
aSked and anSweredSooner or later, everyone runs into a problem they can’t solve alone. Let us help. Submit your question at www.qualityprogress.com, or send it to [email protected], and our subject matter experts will help you find a solution.

SOLUTION TEXTS
CD-ROMS
QUALITY COUNCIL OF INDIANA
Our Primers contain study material for the current ASQ bodies of knowledge plus sample questions and answers. The Primers may be taken into the exam. The completeness of our materials makes them
themostwidelyusedtextsforCertificationTraining.
Quality Council of Indiana offers detailed solutions to all questions presented in the corresponding Primer.
SOLUTION TEXT ....................................................... $35 (+ S&H)
QCI offers user-friendly interactive software to assist students preparing for ASQ examinations. Each CD contains 1000 total questions. Examinationsaretimedandsummarizedgraphically.Ahelpfileprovidesexplanations and references. The CDs run on Windows XP and newer.
Mail OrdersQuality Council
of IndianaOrder Department602 W. Paris Ave.
W. Terre Haute, IN 47885-1124
Information812-533-4215
Telephone Orders800-660-4215
CQIAPRIMER
C
CSSBBPRIMER
C
CQEPRIMER
C
CQTPRIMER
C
CSQEPRIMER
C
CMQPRIMER
C
CREPRIMER
C
LSSPRIMER
C
CQIPRIMER
C
CCTPRIMER
C
CQAPRIMER
C
CSSGBPRIMER
C
SOLUTION TEXT
CSSBBPRIMER
GLENN GEE, WESLEY RICHARDSON & BILL WORTMANC
SOLUTION TEXT
CMQPRIMER
GLENN GEE, WESLEY RICHARDSON & BILL WORTMANC
SOLUTION TEXT
CSSGBPRIMER
QUALITY COUNCIL OF INDIANAC
CQE
CQA
CSSGB
.......................................................$70 (+ S&H)
Internet Orderswww.qualitycouncil.com
Fax Orders812-533-4216
PRIMERSCRE, CSQE, CMQ, CSSBB, CQE ..................................$80 (+ S&H)
CQA, CQT, CQI, CCT, CSSGB, LSS .............................$70 (+ S&H) CQIA, CQPA .....................................................................$65 (+ S&H)
Visit us at booth 408 and 409 at the ASQ World Conference on Quality and Improvement.
En Español
CSSGBPRIMER
LSS PRIMERThe Lean Six Sigma Primer is written to a QCI BoK. There are more case studies and lean content than in any other QCI products. 400 questions are included. A solution text is also available.
QUALITY DICTIONARY
RAM DICTIONARY
ISO 9001 InternalAuditing Primer
Juran’s QualityHandbook
SpanishGreen Belt
ImplementingSix Sigma
ISO PRIMER
QUALITY SYSTEMHANDBOOK
by Tracy Omdahl
2010 updated. More than 2500 defi nitions. Great for any ASQ certifi cation.
by Tracy Omdahl
Contains 2800 defi nitions. Helpful for Reliability and Quality Engineers.
ISOISOSO
by Bensley & Wortman
Presents a thorough treat-ment of the ISO implemen-
tation and documentation process. The CD contains generic quality
manuals in Adobe PDF.
NDBOOKby Edenborough
Details the selection, organi-zation, and writing of quality documents. The disk contains procedures
and work instructions.
ISO 9001:2008 updated.
QUAHANHANbyy EEdd
DDeetataililzaqd
an
QSH
by Greg Wies & Bert Scali
A convenient book for training internal auditors to the ISO 9001 expectations.
An instructor CD is available.
6th Edition
by Juran & De Feo
• The essential quality reference• Very useful for most ASQ exams
RR • The Spanish version of the CSSGB Primer.
• Can be downloaded electronically.
• The instructor electronic format is fun.
2nd Edition
by Forrest W. Breyfogle, III
• A great CSSBB reference
Reliability & MaintenanceAnalyst CD
Measurement Analyst CD
AAAnnnaaalllyyysssttt CCCDDD
MM A l CCD
by Bryan Dodson
Solve your Weibull, reliability, warranty, Bayesian & Maintenance, prediction & estimation problems.
MMMeeeaaasssuuurrreeemmmeeennnttt AAAnnnaaalllyyysssttt CCCDDDPerforms all measurements required in the AIAG manual. Contains ANOVA methods and excellent graphs.ins ANOANOVAVA tmeth dhods as andnd excexc llell tent gr graphaphs
Site and global license available!!!
Used by Chrysler, ITT, FedEx, Ford, TRW, GM, HP, U.S. Postal Service

QP • www.qualityprogress.com12
PERSPECTIVES BY TonY Gojanovic
Theory of EvolutionRadical change is needed for the global economy to truly recoverIn the Past decade, the face of the world
has changed in many ways—from how
we purchase and consume products to
how we’ve become more intertwined, and
perhaps even entangled, through global
communication and financial systems.
Our perception of big business has
also changed after seeing how banks and
investment firms overindulged in high-risk
moneymaking schemes and contributed
to the recent economic calamity. But
one of the biggest surprises of the recent
recession, especially in the United States,
has been that hyper consumerism is not a
sustainable economic paradigm. In years
past, it would have been cited as the rea-
son for tremendous prosperity.
Thumbing through a well-worn copy of
W. Edward Deming’s timeless classic Out
of the Crisis, it’s striking to see how the
current economic crisis, as well as quality
crises related to a few highly publicized
recalls, can be attributed to the factors he
pointed out so many years ago as road-
blocks to quality and productivity.1
Wrong focusOn the heels of the recent economic down-
turn, managers continue to be galvanized
by cost savings, focusing on reducing
headcount, cutting employee education
programs and eliminating research dollars
to satisfy short-term financial incentives.
In many cases, exaggerated cost savings
have become a cancer with no chance of
remission in the form of improved eco-
nomic health or the manufacture of quality
products. Many organizations simply don’t
know what else to do, so they resort to
what is simple rather than what is right.
Focusing only on short-term financial
gains shareholders demand, these orga-
nizations create a precarious situation by
jeopardizing long-term objectives, espe-
cially global economic and environmental
ones. It is impossible to make quality deci-
sions when you’re mesmerized by short-
term activities with no time to reflect. As
Deming said, short-term profits aren’t an
indication of management ability.2
A coworker once told me that being
focused on short-term goals is like getting
laid off from your job and then bragging
about how you’ve cut household costs by
eating stale bread, not driving anywhere
and reading only during the day to save
electricity—while at the same time not
understanding why no one will hire you.
To survive—and even thrive—requires
you to invest in your education and skills,
develop an energized and fresh outlook,
and perhaps buy a new suit, even if it
doesn’t seem like the right financial thing
to do at the moment. What does this teach
us? We need to become comfortable mak-
ing what appear to be short-term sacrifices
for long-term goals. We need to trust our-
selves in the face of an uncertain world.
Sustaining gainsThe future will be based on a paradigm of
environmental and economic sustainabil-
ity. What will we do for the long haul? How
can we band together as human beings for
the greater good?
Organizations can no longer continue
to churn out products as if there will be
infinite demand. One of the greatest busi-
ness booms in the last decade in the United
States has been self-storage lockers, which
we need to hold all of our things. But how
much stuff can we actually accumulate?
The idea of an economic perpetual-
motion machine simply doesn’t exist. The
future will be based on the promotion of
products and services people truly need,
rather than marketing to create artificial
demand for things they don’t. The future
will focus on product and service differen-
tiation through innovation and the ability
to tackle new markets focused on less
consumption and better quality of life.
Superlative quality will become the
superstructure on which the success of
innovations will wholeheartedly depend.
Single-use disposable products and the
philosophy of built-in obsolescence will
not be tolerated by an environmentally
conscientious society focused on eliminat-
ing waste. No one will part ways with their
hard-earned income for junk.
The future will belong to courageous
people willing to take risks. Taking a
chance on hiring and investing in bright,
creative people instead of figuring out how
to cut them from the bottom line would
be a good start. There are plenty of eager,
talented individuals looking for work who
shouldn’t just be given anything to do, but
instead given a task they love so they have
the opportunity to shine.
A strong America will come from
partnering with suppliers and customers
in new, creative and mutually beneficial
ways. Innovation will be the wave of the
future, not only for products and services,
but also for business processes.
For an example, look at the brilliant busi-
ness model of Blake Mycoskie, who created
TOMS Shoes, one of the most successful
footwear companies in the world, based on
the premise of selling a pair of shoes and
giving a pair away to someone in need.3
Thinking of some of the most influential
and progressive organizations and products
of the past decade—such as Apple with its

April 2012 • QP 13
iPhone or Google with its internet services
and products—you see that quality and in-
novation are no longer mutually exclusive
functions, but instead have merged.
The Achilles heel for many organiza-
tions is an emphasis on mediocre prod-
ucts and services buoyed by a snail’s pace
philosophy of change and innovation. As
Deming pointed out more than a half-cen-
tury ago, real change comes from the top.4
And when the best rises to the top, we see
the results, such as Apple and its innova-
tive former leader, Steve Jobs.
Even the workforce is changing, with
a higher level of educated workers in jobs
that have traditionally been classified as
blue collar or service. Traditional top-
down obedience by corporations will no
longer work if we expect to develop a syn-
ergistic relationship between employees
and management to tackle the problems of
the future, including answering the ques-
tion, “What will become of quality?”
The leaders who continue to focus on
sustaining an environment of quotas, fear
and general paranoia will go the way of
the dinosaur and acquiesce to leaders
who create an atmosphere of cooperation,
respect and progressive thinking, and
who can give their employees a vision and
meaning to the work they do.
In this paradigm, quality will no longer
be a department or one person, but instead
will become a fundamental way of thinking
in the organization. This does not mean
we’ll impose a uniform Orwellian mentality
on people by putting them through Black
Belt indoctrination camps. Instead, it sig-
nals the emergence of quality practitioners
with the right education, a great attitude
and a creative, revolutionary spirit.
These individuals will provide the right
tools for day-to-day tasks and leadership
in the form of coaches and mentors who
are not afraid to think. As Deming wrote,
we need to adopt a new philosophy and to
provide leadership, not mere management.5
As Peter Senge pointed out in The Fifth
Discipline, today’s problems come from
yesterday’s solutions.6 Many of the problems
we encounter in our lives can be traced to
a lack of systems thinking and even simple
memory failure about how what was done
in the past affects us today.
Senge wrote that the future will require
individuals and organizations to focus on
learning, developing shared visions and
understanding key interrelationships be-
tween variables through systems thinking.7
Deming also advocated system thinking
and the big-picture approach.8
Individuals and companies will need
to challenge and redesign their mental
models—otherwise, as Senge pointed out,
many of our easy solutions will simply
lead back to the same problem, perhaps in
a slightly disguised form.9
The relationship between variables that
affect the long-term outlook will need to be
dealt with to address questions of economic
and environmental sustainability, encour-
age ethical actions that benefit the planet
and bring quality not only to products and
processes, but also to people’s lives.
New lifeAccording to Daniel Pink in A Whole New
Mind, we are leaving the Information Age,
which is characterized by knowledge work-
ers, and entering the Conceptual Age, which
is characterized by creators and empathiz-
ers.10 Now is the time for radical change and
an open mind. The right-brained, logical,
linear-thinking quality practitioners of years
past will benefit by being more like their
left-brained, creative, non-linear marketing
and innovative counterparts.
In this world, the well-worn, invaluable
tools of statistical process control will be
reinvigorated by the emerging and flour-
ishing innovation industry—one focused
on design, form and sustainability. Art
will meet science, and aesthetic quality
requirements will be as vital as functional
requirements.
New quality tools based on holistic,
system thinking will need to be developed
to meet the challenge. Quality will never
be dead, but it may reemerge as a com-
pletely new and broader entity. The quality
practitioner of the future will need to be a
visionary, creative, empathetic, a learner,
an educator and, above all, a steward of
responsible action.
More than just a mere problem solver
or someone tasked with oiling the ma-
chine, a quality practitioner will need to
be courageous to inquire deeply into the
nature of real-life quandaries through
dialogue, something that isn’t reinforced
in today’s business environment but is
sorely needed.
The world’s problems come from the
human mind, which is where the solu-
tions also reside. There is hope for a
better world, but it requires a fundamental
change to our mindset. QP
RefeRences1. W. Edwards Deming, Out of the Crisis, MiT Press, 1986.2. ibid.3. Blake Mycoskie, Start Something That Matters, Speigal
and Grau, 2011.4. Deming, Out of the Crisis, reference 1.5. ibid.6. Peter Senge, The Fifth Discipline, Doubleday, 1990.7. ibid.8. Deming, Out of the Crisis, reference 1.9. Senge, The Fifth Discipline, reference 6.10. Daniel H. Pink, A Whole New Mind, Berkeley Publishing
Group, 2006.
TONy GOjANOviC is a statistician at MillerCoors in Golden, CO. He has a master’s degree in statistics from the University of Colorado in Denver and is a member of ASQ.
The future will belong to courageous people willing to take risks.

B
QP • www.qualityprogress.com14
Baseball fans will likely argue more than usual this season: How will
Albert Pujols adjust to the American League? Is Bobby Valentine the
answer in Boston? Does baseball need the new wild-card round?
There’s one discussion no one could have expected, but perhaps
now it’s warranted following Ryan Braun’s successful appeal of his
suspension for testing positive for performance-enhancing drugs: How
could quality be used to avoid an apparent process breakdown and
improve Major League Baseball’s (MLB) sample-collection system?
“This is a quality issue—bar none,” said Linda Wawrzyniak, owner
of Higher Standards Academy, which specializes in language, quality
and skills training for athletes, business owners, medical profession-
als and management. She is also the founder of ASQ’s Quality in
Athletics intrerest group (http://asq.org/quality-athletics). “The MLB,
the NBA, the NHL, the NFL—anyone that does drug testing—they
really need to learn from this and learn about quality procedures. It’s
really important in what they do.”
Just as teams gathered for spring training, news about Braun and
his successful appeal got out. The Milwaukee Brewers outfielder
received much attention, in large part, because he was the National
League’s Most Valuable Player last season. But other drug cases are
now starting to get press: Two NFL players suspended for violating
the NFL’s drug policy tried to overturn rulings, contending the league-
appointed drug test collector mishandled their urine samples.1
In Braun’s case, the urine sample taken in October tested positive
for elevated testosterone. Braun’s camp said the ratio was the high-
est ever recorded in baseball’s testing program.
Braun faced a 50-game suspension for violating MLB policy, but
he appealed, and the ruling was overturned in late February. Reports
surfaced that an arbitrator had sided with Braun because of chain-
of-custody issues surrounding the handling of Braun’s urine sample.
“I am the victim of a process that completely broke down and
failed,” said Braun, who also called the testing “fatally flawed.”2
The sample, taken from Braun after a game in Milwaukee, was
destined via FedEx for a lab in Montreal. Because a FedEx facility near
the stadium had already closed for the day, the collector took Braun’s
sample to his home, which some reports say is not unprecedented in
drug testing. Braun questioned that decision and why the collector did
not return to FedEx until 44 hours after the sample was submitted.3
There has been no official statement from the arbitrator explain-
ing the decision. MLB officials defended the collector and the pro-
cess, however, calling the system “the highest-quality drug testing
program of any professional sports organization in the world.”4
However, “the arbitrator found that those instructions were
not consistent with certain language in our program, even though
the instructions were identical to those used by many other drug
programs—including the other professional sports and the World
Anti-Doping Agency,” according to an MLB statement.5
Some say Braun has escaped punishment through a loophole or
technicality, while others contend these questions about the sample
handling raise the possibility of tampering.
“This [ruling] is really for the protection of the rest of the play-
ers,” said Wawrzyniak, who had
just finished working with several
teams during spring training. “What
happened here was for the good of
baseball.”
“Everybody was doing what they
felt was best,” she added. “Based on
the conditions, they’re doing it [col-
lecting and delivering the samples]
the best they can. From this [Braun’s case], hopefully it will give
baseball some better practices. And that’s always a good thing for
every player.”
Will the collection and handling process be closely reviewed and
analyzed? Will the laboratory that conducted the testing be scruti-
nized as well? Will sample collectors be audited to ensure they have
been complying with requirements and following the process?
For now, MLB and the players union have said that the language
in the drug policy regarding shipping of samples will be tightened.6
“As has happened several times before with other matters, this case
has focused the parties’ attention on an aspect of our program that
can be improved,” said players’ union director Michael Weiner. “After
discussions with the commissioner’s office, we are confident that all
collections going forward will follow the parties’ agreed-upon rules.”7
––Mark Edmund, associate editor
REFERENCES1. Ken Benson, “Suspended Broncos May File a Lawsuit,” New York Times, March 10, 2012,
www.nytimes.com/2012/03/11/sports/football/suspended-broncos-mcbean-and-williams-might-file-lawsuit.html.
2. Clark Spencer, “Miami Marlins’ Gaby Sanchez Backs Ryan Braun’s Denial,” Miami Herald, Feb. 25, 2012, www.miamiherald.com/2012/02/24/2659560/miami-marlins-gaby-sanchez-backs.html.
3. Adam McCalvy, “Braun Speaks Out, Proud of ‘Integrity,’” mlb.com, Feb. 24, 2012, http://mlb.mlb.com/news/article.jsp?ymd=20120224&content_id=26834634.
4. Ibid.5. Ibid.6. Tom Haudricourt, “MLB Drug Process Designed to Prevent Tampering,” Milwaukee
Journal Sentinel, Feb. 27, 2012, www.jsonline.com/blogs/sports/140591403.html.html?ua=iphone&dc=smart.
7. Ibid.
kEEPINgcuRRE NT SPORTS
Miscues and MisplaysCould a dose of quality help baseball improve its drug-testing process?

April 2012 • QP 15
kEEPINgcuRRE NT
An organization’s leadership simply cannot dic-
tate or mandate the use of quality, and instead
must use measurements to promote a true
culture of quality within the organization.
That’s what a new research report from the
American Productivity and Quality center (APQc)
reveals based on responses from four high-pro-
file organizations—Altera corp., caterpillar Inc.,
chemonics International and Textron Systems—
that shared how they organize quality functions,
measure their impact and ensure a quality
culture is used to drive business value.
“What this study underscores is that quality
is not just a set of tools, concepts or policies;
it is the way work is performed every day, by
everyone,” said Travis colton, an APQc project
manager.
The report also identified eight imperatives for
the enterprise quality function.
To download the 62-page report, which was
produced with support from ASQ, visit www.
apqc.org.
QuALITy REPORT
MeasureMeNTs CaN help proMoTe qualiTy CulTure
Mr. pareto head By MIKe CROSSen
BANkINg
More CusToMers leaviNg Big BaNks over Fees, serviCeFed up with new fees and poor service, more big-bank customers switched
to smaller institutions last year than previous years, according to a recent J.D.
Power and Associates’ survey.
The defection rate for large, regional and mid-size banks averaged be-
tween 10% and 11.3% of customers last year, the survey showed. In 2010, the
average defection rates ranged from 7.4% to 9.8%
“When banks announce the implementation of new fees, public reaction
can be quite volatile and result in customers voting with their feet,” said
Michael Beird, director of the banking services practice at J.D. Power and
Associates.
customers do, however, weigh the price they pay against the value of their
experience.
“It is apparent that new or increased fees are the proverbial straws that
break the camel’s back,” Beird said. “Service experiences that fall below
customer expectations are a powerful influencer that primes customers for
switching once a subsequent event gives them a final reason to defect. Re-
gardless of bank size, more than one-half of all customers who said fees were
the main reason to shop for another bank also indicated that their prior bank
provided poor service.”
Small banks and credit unions lost only 0.9% of their customers on aver-
age last year, a significant decline from the 8.8% defection rate in 2010.
More details from the survey can be found at www.jdpower.com/content/
press-release/gAdX32O/2012-u-s-bank-customer-switching-and-acquisition-
studysm.htm (case sensitive).

QP • www.qualityprogress.com16
kEEPINgcuRRENT
SOMETHING NEWThis month, listen to a webcast series with the authors of this
month’s cover story, “Beyond the Basics,” p. 18, telling more
about the seven new quality tools and how to use them.
REady TO GO One quality professional shares her kayaking and hiking gear
lists in this supplement to Quality in the First Person
(“Quality Assurance at Home,” p. 48).
IT’S COMplICaTEdAn additional figure that shows the results of the two one-sided
t-tests used to demonstrate comparability, described in One
good Idea (“complicated comparison,” p. 71).
QuICk pOll RESulTS Each month at www.qualityprogress.com, visitors can take an
informal survey. Here are the numbers from a recent Quick Poll:
“how would you describe your email use?”
• keeping up, but it takes too much time. 46.2%
• Totally in control. 36.2%
• can’t keep up with my overloaded inbox. 17.5%
Visit www.qualityprogress.com for the latest question:
“What’s the best way to build a successful baseball team?”• count on development of drafted players.
• Throw money at high-priced free agents.
• use analytics to find hidden gems.
Thirteen quality thought leaders will be
honored at this year’s ASQ World confer-
ence on Quality and Improvement next
month in Anaheim, cA. The recipients are:
• Feigenbaum Medal: Paulo Sampaio,
university of Minho, Braga, Portugal.
• Freund Marquardt Medal: Joseph J.
Tsiakals, Baxa corp., Englewood, cO.
• grant Medal: Thong Ngee goh, Na-
tional university of Singapore.
• hutchens Medal: Joel Makower, green-
Biz group, Oakland, cA.
• ishikawa Medal: H. James Harrington,
Harrington Institute Inc., Los gatos, cA.
• lancaster Medal: Janak Meht, TQM
International Pvt. Ltd., Delhi, India.
• shainin Medal: Jack B. ReVelle, ReVelle
Solutions LLc, Santa Ana, cA.
• shewhart Medal: Jerald F. Lawless,
university of Waterloo, Ontario.
• Brumbaugh award: Bradley Jones, SAS
Institute, cary, N.c., and guest profes-
sor at universiteit Antwerpen, Antwerp,
Belgium; and christopher J. Nachtsheim,
carlson School of Management, univer-
sity of Minnesota, Minneapolis.
• gryna award: Michelle M. Deutsch,
cincinnati children’s Hospital Medical
center.
Earlier this year, it was announced that
Jim Bossert and Sister Mary Jean Ryan will
be awarded ASQ’s Distinguished Service
Medals at the conference. The award
ceremony will take place Sunday, May 20,
during the annual business meeting.
advance audioyou may now preview what keynote speak-
ers will say at the world conference. Audio
interviews with many of the scheduled
keynote speakers will be posted this month
at http://wcqi.asq.org/speakers.html.
Scheduled speakers are:
• James Albaugh, executive vice president
of the Boeing co., and president and
cEO of Boeing commercial Airplanes.
• carletta Ooton, vice president and chief
quality, safety and sustainable opera-
tions officer for the coca-cola co.
• Simon Sinek, leadership expert and
author of Start With Why: How Great
Leaders Inspire Everyone to Take Action.
• Majora carter, president of Mcg con-
sulting, a firm that advises organizations
about climate adaptation, urban micro-
agribusiness and leadership develop-
ment strategies.
• Joseph A. DeFeo, president and cEO
of the Juran Institute and authority on
transformational change systems and
breakthrough management principles.
Team competitionThirty-two teams have been selected as
finalists for the 27th annual International
Team Excellence Awards. The teams rep-
resent nine countries and will participate
in live project presentations at the world
conference.
The team’s project summaries and pro-
files, along with the presentation schedule,
can be found at http://wcqi.asq.org/team-
competition/index.html. Watch for further
coverage of the 2012 award recipients in
future editions of QP.
Visit http://wcqi.asq.org/index.html for
more about the speakers, the 100-plus con-
ference sessions and a complete schedule
of events and details. you can also access a
mobile site (http://team.asq.org/wcqi) while
attending the conference to more easily
browse sessions and other details about
the event.
ASQ WORLD cONFERENcE
eveNT FeaTures 15 aWard reCipieNTs, TeaM CoMpeTiTioN
QPoNliNe oNpaper

April 2012 • QP 17
kEEPINgcuRRENTaSQNEWSNeW gM For asq ChiNa Fred Zhang was
recently appointed gener-
al manager of ASQ china.
Zhang previously worked
for Bureau Veritas (BV)
china, serving as its direc-
tor for the greater china region and leading
a team providing management certification
service in quality, environmental, health and
safety, and social accountability fields. Zhang
is based in ASQ china’s Shanghai office.
JourNal added To iNdeX Quality
Engineering, a journal co-published by ASQ
and Taylor & Francis group, has been added
to Thomson Reuters Science citation Index.
The index provides citation data—impact
factors—from science and technology
journals throughout the world, measuring
how often a journal article has been cited.
The data help determine how journals are
evaluated and viewed, and it can raise a
publication’s prestige and reputation when
more readers and authors see how often
a publication is cited. Quality Engineering’s
inclusion in the index will be effective back
to volume 21 (or 2009) content.
TWo NeW Board MeMBers Eric A.
Hayler of BMW Manufacturing co. in Bol-
ing Springs, Sc, and g. geoffrey Vining
of Virginia Tech in Blacksburg have been
named to the ASQ Board of Directors. They
replace two directors who were appointed
to serve additional six-month terms while
ASQ transitioned its fiscal year from a July
1 to a Jan. 1 start.
douBle BuCks iN May ASQ’s mem-
ber referral program will feature “double
bucks” in May for ASQ members who refer
new members. Instead of receiving five
ASQ bucks for each member referred, you
will get 10 to use toward ASQ Quality Press
books, standards, certification, training,
conferences and your own membership
renewal. Visit http://asq.org/refer for more
about the program.
TraNsiTioN plaNs The Baldrige Enter-
prise has unveiled details on its plans to
transition its business model after federal
funding was eliminated from the program’s
budget this year. For more details, visit
www.nist.gov/baldrige/transition/index.cfm.
NoMiNaTioNs soughT ASQ is now ac-
cepting nominations for Six Sigma Forum
Magazine’s editor position. Responsibilities
include maintaining a qualified editorial
review board, recruiting authors, overseeing
the submission and peer review of suitable
content, and building awareness of SSFM
at conferences and through social media.
The new editor’s term is 2013-2016. Send
questions and nominations to William Tony,
ASQ publisher, at [email protected]. For more
information about SSFM, visit http://asq.org/
pub/sixsigma.
EDWARDS MEDALIST
FirsT eXeCuTive To BaCk deMiNg diesWilliam E. conway, known by many as the first
Fortune 500 executive to work with W. Edwards
Deming and truly embrace continuous improvement
methods, has died. He was 85.
The 1983 recipient of ASQ’s george D. Edwards
Medal, he was president and cEO of Nashua corp.
when he was interviewed in “If Japan can … Why
can’t We?” a 1980 documentary that introduced
many of Deming’s methods to American industry.
conway later formed conway Management co.
to help organizations improve operational effective-
ness. He also authored many quality-related articles
and two books: The Quality Secret: The Right Way to
Manage and Winning the War on Waste: Changing
the Way We Work.
conway’s full obituary can be found at www.
davisfuneralhomenh.com/?menuitem=557&
siteid=79&action=1&value=12&obituaries_
action=2&obituaryid=111593.
ASQ SuRVEy OF ENgINEERS
hiTTiNg The Books pays oFFLong hours studying to succeed and maintain high grades in science and math
classes was the primary challenge most engineers said they faced while they
pursued their degrees, according to a recent ASQ survey.
The biggest factor in their success as engineers was the amount of time they
spent studying, according to 43% of the respondents. Twenty-seven percent of
engineers surveyed said the instruction they received from high school teachers
and college professors had the most influence in their success as engineers.
The latest ASQ-Harris Interactive Survey follows a previous study that re-
ported 67% of sixth through 12th-graders said they were interested in pursuing a
career in science, technology, engineering and math (STEM), but they were wor-
ried about obstacles that might block their pursuit of professions in those areas.
The results of both surveys were released during National Engineers Week.
One-quarter of those students said they felt pursuing a STEM career involves
too much work and studying compared with other career paths. One-quarter also
said they were concerned their grades in math and science weren’t good enough.
Most engineers polled in the latest survey said they are satisfied with their
career: 49% said they are most satisfied with the challenging and interesting
nature of engineering, and 35% are most satisfied with their contributions to
projects and products.
For more about the surveys, visit www.asq.org/media-room/index.html.
ZhaNg
Seven new quality tools help innovate, communicate and plan

April 2012 • QP 19
basic quality
Back then, we featured snapshots of each
of the “old seven”—cause and effect diagrams,
check sheets, control charts, histograms, Pareto
analysis, scatter plots and stratification—offer-
ing the basics on what you need to understand
about them and how they are used. This month,
we’re throwing the spotlight on the seven man-
agement and planning tools, often referred to as
the seven new quality tools: affinity diagrams,
arrow diagrams, matrix data analysis, matrix
diagrams, process decision program charts, re-
lations diagrams and tree diagrams.
A team from the Union of Japanese Scientists
and Engineers (JUSE) first collected these tools
in 1976 to promote ways to innovate, communi-
cate, and plan major and complex projects. At
the time, some of the tools weren’t necessarily
new, but their grouping and promotion were.
Not to spoil the ending, but 36 years later,
there’s nothing new or groundbreaking in this
re-release of the newer seven. But we think this
collection of articles about these new tools does
what JUSE set out to do when it devised the
collection of seven: promote ways to innovate,
communicate and plan.
As noted in the original installment, our cast
of contributors could have provided much, much
more on each tool. Many of the tools include ad-
ditional resources at the end of each article if
you want to learn more.
You can also visit QP’s archives (www.
qualityprogress.com) to access the original
article (“Building From the Basics,” January
2009, pp. 18-29), as well as other articles on basic
tools. ASQ’s website, too, has plenty of resourc-
es and publications (www.asq.org/books-and-
publications.html) to help you learn about the
basics of quality.
AA movie sequel often can be as, if not more, captivating
than the original. Take “The Godfather: Part II.” Remember “The Em-
pire Strikes Back”? More recently, what about “The Lord of the Rings:
The Two Towers”? Audiences everywhere couldn’t wait to get inside
theaters on opening night to see what happened to the Corleone fam-
ily, Luke Skywalker, and Frodo and Sam.
Essentially, a sequel builds on the original, continuing a journey
with familiar characters and settings, developing ideas and unveiling
more insight. In that spirit, we asked a supporting cast of QP con-
tributors to help us write the script for the sequel to our January 2009
feature on Kaoru Ishikawa’s original seven quality tools.

T
QP • www.qualityprogress.com20
The affinity diagram is a visual tool that allows an indi-
vidual or a team to group a large number of ideas, issues,
observations or items into categories for further analysis.
The tool groups the ideas in a way that allows those with
natural relationships or relevance to be placed together in
the same group or category.1
The affinity diagram partners well with the brainstorm-
ing tool to organize many ideas and issues. The tool also
provides an opportunity to creatively identify categories
of team observations or input. Often, it helps to overcome
team paralysis by offering a step-by-step way to organize
multitudes of options. Groups can use affinity diagrams:
•
As the next step in organizing the output of a brain-
storming event into relevant themes or categories for
analysis.
• Toactivelyinvolvestakeholdersinthespecificsofa
situation in which their understanding, experience,
knowledge and support is required.
• Asavehicleforbreakthroughthinkingandcreative
association.
• To further analyze data, ideas or observations for
eventual hypothesis testing, prioritization and deci-
sion making.2
To build an affinity diagram, clearly state the issue
being explored. Gain consensus among group members
on the issue statement, and brainstorm ideas related to
the issue under consideration.
Write one idea each on a sticky note. Make sure the
words are in large-enough print to be seen at least five
feet away. Randomly place the notes on a board, wall or
flip chart so they are visible to the whole group. Figure
1 shows an example of a list created by a group that was
brainstorming its organization’s community partners.
As a group, cluster the ideas into categories or
themes suggested by the content in relation to the is-
sue being explored. Figure 2 shows how the list of com-
munity partners can be organized through an affinity
diagram.
If an idea logically fits within more than one thematic
category, reproduce the note so it can be posted in all
relevant areas. Sometimes, it may be necessary to iso-
late ideas that do not naturally fit into the categories
identified by the group. These one-offs may provide
valuable insight into additional analysis later.
Next, create an affinity card (or header card) for each
group with a short statement describing the entire group
of ideas. Review the resulting cluster themes for con-
sensus.
Two additional techniques can be used to encourage
creativity among team members:
1. Allow no speaking among team members during the
affinity categorization of the sticky notes. All asso-
ciations of one idea with another should be done in
silence.
2. Require team members to use their nondominant
hand to move the sticky notes around during catego-
Community partners brainstorming list / figure 1
Affinity diagram of community partners list / figure 2
Business owners
AA/NA
Mayor
YWCA/YMCA
School board
Chamber of commerce Over-55 community
United Way Faith-based groups
Hospitals
Harley-Davidson riders
Habitat for Humanity
Parksdepartment
Technicalcollege
Armed forcesrecruiters
Policedepartment
AA = Alcoholics AnonymousNA = Narcotics Anonymous
YMCA = Young Men’s Christian Association YWCA = Young Women’s Christian Association
Business ownersAA/NA
YWCA/YMCA
School board
Chamber of commerce
Over-55 community
United Way Faith-basedgroups
Private/commercialGovernmentNot-for-profit
Hospitals
Harley-Davidson ridersHabitat for Humanity
Parks department
Mayor
Technical college
Armed forces recruiters
Police department
AA = Alcoholics AnonymousNA = Narcotics Anonymous
YMCA = Young Men’s Christian Association YWCA = Young Women’s Christian Association

T
April 2012 • QP 21
basic quality
The arrow diagram—also known as activity diagram,
network diagram, activity chart, node diagram or critical
path method chart—is used to illustrate the order of ac-
tivities of a process or project. A basic example is shown
in Figure 3.
The arrow diagram can be simple and straightfor-
ward, but over time its use has evolved to that of orga-
nizing and monitoring complex projects and situations.
In the 1950s, two project management techniques—the
program evaluation review technique (PERT) and the
critical path method (CPM)—propelled the development
of the arrow diagram to the next level.
The U.S Navy developed the techniques between 1956
and 1958 while developing its Polaris nuclear subma-
rine. E.I. Du Pont de Nemours Co., planning to construct
major chemical plants in United States, also used these
methods to plan, schedule and control its projects.
With PERT and CPM, the arrow diagram can include
very specific scheduling and monitoring tasks by infus-
ing additional information and details about each activ-
ity within a sometimes complex process or project be-
ing defined. Table 1 (p. 22) summarizes PERT and CPM
Simple arrow diagram / figure 3
1. Select a supplier
▲ 2. Sign an agreement with a selected supplier
rization. In other words, a right-handed person should
only use his or her left hand when moving ideas
around the board, wall or flip chart. This simple exer-
cise will encourage team members to be more deliber-
ate and pay more attention to the decisions and moves
they make.
By using affinity diagrams, a group can move away
from idea paralysis and start its journey of exploring an
issue or finding solutions to problems.
—Grace L. Duffy
REFERENCES1. John E. bauer, Grace l. Duffy and Russell t. Westcott, The Quality Improvement
Handbook, second edition, asq quality Press, 2006. 2. Ron bialek, Grace l. Duffy and John W. Moran, The Public Health Quality
Improvement Handbook, asq quality Press, 2009.
Arrow diagram using CPM and PERT / figure 4
▲Develop supplier
evaluation criteria ▲
evaluate supplier A ▲
Negotiate with supplier A
Dr = 2 SL = 0 Dr = 1 SL = 2 Dr = 5 SL = 0
eS = 1 ef = 3 eS = 3 ef = 4 eS = 7 ef = 12
LS = 1 Lf = 3 LS = 5 Lf = 6 LS = 7 Lf = 12 ▲
Choose a preferred supplier and send
an agreement
▲
Project kickoff
evaluate supplier B
Rate suppliers
Negotiate with supplier B
Dr = 1 SL = 0 ▲ Dr = 3 SL = 0 ▲ Dr = 1 SL = 0 ▲ Dr = 3 SL = 2 ▲ Dr = 2 SL = 0
eS = 0 ef = 1 eS = 3 ef = 6 eS = 6 ef = 7 eS = 7 ef = 10 eS = 12 ef = 14
LS = 0 Lf = 1 LS = 3 Lf = 6 LS = 6 Lf = 7 LS = 9 Lf = 12 LS = 12 Lf = 14
▲ ▲ ▲
evaluate supplier C
Negotiate with supplier C
▲ Dr = 2 SL = 1 ▲ Dr = 2 SL = 3
eS = 3 ef = 5 eS = 7 ef = 9
LS = 4 Lf = 6 LS = 10 Lf = 12
Create a purchasing agreement template
▲ Dr = 3 SL = 8
eS = 1 ef = 4
LS = 9 Lf = 12
CPM = critical path method Dr = activity duration ef = early finish time
eS = early start time Lf = late finish time LS = late start time SL = slack PERT = program evaluation review technique
DR, EF, ES, LF, LS and SL are measured in days.

m
terminology. Figure 4 (p. 21) is an example of applying
PERT and CPM to selecting a supplier and signing a pur-
chasing agreement.
The critical path, marked in red on the arrow diagram
in Figure 4, includes activities that should be conducted
without delay because they are critical to meeting the
scheduled end date. All other activities can be conducted
using a more flexible schedule.
The creation of a purchasing agreement template,
for example, can start anytime between the first and the
ninth day of the project, and it can take more than the
anticipated three days if an early start day was chosen.
The example illustrates how the arrow diagram helps
to balance project resources and identify activities that
are critical for the completion of the project on time.
—Natalia Scriabina
BIBLIOGRAPHYberger, Roger W., The Certified Quality Engineer Handbook, asq quality Press,
2006.Heagney, Joseph, Fundamentals of Project Management, aMacOM Division of
american Management association, 2011.levy, Ferdinand K., Gerald l. thompson and Jerome D. Wies, “the abcs of the
critical Path Method,” featured in Managing Projects and Programs, Harvard business school Press, 1989.
Miller, Robert W., “How to Plan and control With PERt,” which appeared in “Managing Projects and Programs,” Harvard Business Review, reprint series No. 10811, Harvard business school Press, 1989.
Wilcox, William H., and James J. O’brien, “How to Win campaigns,” National Civic Review, Vol. 56, No. 5, 1967, pp. 265-269.
QP • www.qualityprogress.com22
Many of the seven new quality tools packaged and pro-
moted by JUSE are referred to by names different from
what JUSE originally called them, but only one has actu-
ally been modified through the years: matrix data analysis.
In its original form, matrix data analysis was heavy
on mathematics. Sometimes, it has been replaced on this
list by the similar prioritization matrix (see the online
sidebar and five additional tables on this article’s web-
page at www.qualityprogress.com). There is very little
reference material on matrix data analysis itself, but I
have compiled the limited information and developed an
example.
In more complex industrial problems, data are not
necessarily one dimensional. Often, we get into analyz-
ing data that have many possibilities. For example, auto-
mobiles are built with several
features targeting different
consumer demographics. Dif-
ferent demographic groups
may react differently because
the features and preferences
vary. Younger consumers may
pay more attention to design
style, while older consumers place greater emphasis on
stability and safety of the design. Similarly, there may be
preference discrepencies between men and women in
terms of color and comfort.
To analyze this data, the traditional seven quality tools
may not be adequate. The matrix data analysis method
can be used to analyze the data arranged in matrix for-
mat. For example, you may want to analyze the customer
responses to several attributes of a new product to form
a smaller number of uncorrelated variables that are eas-
ier to interpret.
The matrix diagram arranges items in a column and
row format, with the degree of correlation entered into
the relevant columns using symbols or numerical values.
This idea appears similar to the relationship matrix tool.
In the matrix data analysis, however, the correlation co-
efficient is used to identify the relationship instead of
symbols.
One type of matrix data analysis is principal com-
ponent analysis. This technique is used in multivariate
analysis. Principal component analysis is a selective
measurement technique in which the representative
characteristics can be mathematically calculated. Prin-
Arrow diagram acronyms / TAbLE 1
Term and acronym
What is it? How it is calculated?
early start time (eS)
The earliest time a given task can start.
A duration of the activities leading into this one.
early finish time (ef)
The earliest time a given task can be finished.
eS + a duration of this activity.
Late finish time (Lf)
The latest time a given task can be finished and still keep the projection schedule.
A duration of the activities following this one.
Late start time (LS)
The latest time a given task can start and still keep the project on schedule.
Lf − a duration of this activity.
Slack (SL) The time this activity could be postponed without delaying the project schedule.
LS − ES or LF − EF.
HEAR ANd SEE MORE from the authors
who contributed to this package
featuring the seven new quality tools.
Find links to prerecorded
webcasts throughout April at
www.qualityprogress.com.

April 2012 • QP 23
cipal components analysis can reduce your data and
avoid multicollinearity, or a situation in which you
have too many predictors relative to the number of
observations. Principal components analysis often can
uncover unsuspected relationships, allowing you to in-
terpret data in a new way.
For the automobile example, 100 potential custom-
ers (both genders of various ages in urban and rural
areas) were asked to score five automobile features.
A score of one was the lowest preference score, and
10 was the highest. The following steps were used to
construct and analyze data using matrix data analysis:
1. The scores were averaged and each data item was
arranged in row and column format, as shown in
Table 2.
2. The correlation coefficient matrix was calculated
for each observed group. The example in Table 3 is
the sex and age of the observed groups.
3. The characteristic values and vectors using the cor-
relation matrix were calculated, as shown in Table
4 (p. 24). In our example, the first principal compo-
nent has variance 7.607 (equal to the largest eigen-
value) and accounts for 0.634 (63.4%) of the total
variation in the data. The second principal compo-
nent (variance 3.608) accounts for 0.301 (30.1%) of
the total data variation. The third principal com-
ponent (variance 0.652) accounts for 0.054 (5.4%)
of the total data variation. The first two principal
components with variances equal to the eigenvalues
greater than one represent 0.935 (93.5%) of the total
variability, suggesting the first two principal compo-
nents adequately explain the variation in the data.
4. The degree of preference for each feature by demo-
graphics was reviewed. Such value expresses the de-
gree of preference. The value of characteristics’ vec-
tor changes from positive to negative in accordance
with age for men and women (Figure 5, p. 24). Gen-
eral preference affected by demography, age and sex
are calculated. This is graphically represented by the
score plot and biplot in Figures 6 and 7. The score
plot graphs the second principal component scores
basic quality
Matrix data analysis / TAbLE 2
Correlation coefficient matrix / TAbLE 3
Group Feature one
Feature two
Feature three
Feature four
Feature five
united states: urban
Men (age < 35) 7.5 7 8 9 6.5
Men (age 36-60) 5.5 8.8 8.5 7.5 6
Men (age > 60) 5 8 8.5 7 6.5
Women (age < 35) 8 5.5 8 9 6
Women (age 36-60) 8.5 6 7.5 8.5 7.5
Women (age > 60) 9 6.8 7 8 8
united states: rural
Men (age < 35) 6 7.5 8.5 8.5 7
Men (age 36-60) 5.5 8.5 8 7.5 7.5
Men (age > 60) 5.5 8 8 7.5 8
Women (age < 35) 8.5 6.5 8.5 9 6.6
Women (age 36-60) 8.5 5.5 7.5 8.5 7.5
Women (> 60) 9 5 7 8 6
urban Rural
Men (< 35)
Men (36-60)
Men (> 60)
Women (< 35)
Women (36-60)
Women (> 60)
Men (< 35)
Men (36-60)
Men (> 60)
Women (< 35)
Women (36-60)
urban
Men (age 36-60) 0.26
Men (age > 60) 0.142 0.937
Women (age < 35) 0.894 −0.125 −0.185
Women (age 36-60) 0.558 −0.635 −0.624 0.839
Women (age > 60) 0.064 −0.928 −0.967 0.41 0.803
Rural
Men (age < 35) 0.613 0.761 0.818 0.318 −0.115 −0.664
Men (age 36-60) −0.046 0.847 0.921 −0.421 −0.738 −0.944 0.724
Men (age > 60) −0.108 0.671 0.842 −0.404 −0.608 −0.837 0.707 0.951
Women (age < 35) 0.881 −0.082 −0.163 0.99 0.795 0.379 0.29 −0.436 −0.448
Women (age 36-60) 0.531 −0.638 −0.596 0.826 0.996 0.782 −0.096 −0.716 −0.565 0.78
Women (age > 60) 0.223 −0.854 −0.783 0.6 0.933 0.906 −0.389 −0.839 −0.654 0.554 0.942

QP • www.qualityprogress.com24
versus the first principal component scores. As in
this example, if the first two components account
for most of the variance in the data, you can use the
score plot to assess the data structure and detect
clusters, outliers and trends. For examples with
multiple variables, the plot may reveal groupings
of points, which may indicate two or more separate
distributions in the data.
The biplot overlays the score and loading (prefer-
ence, importance) plots of the first two principal com-
ponents. The second principal component scores are
plotted versus the first principal component scores.
The loadings for these two principal components are
plotted on the same graph.
The plot may reveal groupings of points, which
may indicate two or more separate distributions in the
data. This may be evident with an example that uses
hundreds of features. Only five features of the matrix
data analysis technique have been mentioned for il-
lustration purposes.
If the data follow a normal distribution and no out-
liers are present, the points are randomly distributed
around zero. In the score plot diagram, the generally
preferred features appear as you move right along the
horizontal axis, and features that are not preferred
move to the left.
With the exception of the youngest age group, the
biplot (Figure 7) seems to indicate that rural and ur-
ban men have the same preferences, rural and urban
women share the same preferences, and those under
Characteristic values and vectors / TAbLE 4
GroupsFirst
principal component
second principal
component
Third principal
component
urban
Men (age < 35) 0.102 −0.489 0.204
Men (age 36-60) −0.300 −0.257 0.343
Men (age >60) −0.314 −0.245 −0.038
Women (age <35) 0.229 −0.405 0.099
Women (age 36-60) 0.333 −0.187 −0.224
Women (age > 60) 0.348 0.129 −0.059
Rural
Men (age < 35) −0.179 −0.444 −0.260
Men (age 36-60) −0.342 −0.133 −0.244
Men (age > 60) −0.306 −0.116 −0.603
Women (age < 35) 0.222 −0.399 0.240
Women (age 36-60) 0.327 −0.187 −0.302
Women (age > 60) 0.344 −0.014 −0.369
Eigenvalue 7.607 3.608 0.652
Proportion 0.634 0.301 0.054
Cumulative 0.634 0.935 0.989
▲
least preferred features
most preferred features
▲
▲
▲
Vector changes / figure 5
Score plot of evaluated groups / figure 6
43210−1−2−3−4
2
1
0
−1
−2
First component
5
3
21
Sec
on
d c
om
po
nen
t
4
43210−1−2−3−4
2
1
0
−1
−2
First component
Sec
on
d c
om
po
nen
t
Rural women (age > 60)
Rural women (age 36-60)
Rural women (age < 35)
Rural men (age > 60)
Rural men (age 36-60)
Rural men (age < 35)
Urban women (age > 60)
Urban women (age 36-60)
Urban women (age < 35)
Urban men (age > 60)
Urban men (age 36-60)
Urban men (age < 35)
2
5
1
3
4
Biplot of evaluated groups / figure 7

K
April 2012 • QP 25
basic quality
35 years old share the same preferences—regardless of
gender.
This tool can be used to analyze market data, new
product introduction and for narrowing down root
cause analysis. Relationships among defects and their
causes, location of defect occurrence or process step
can be analyzed using the tool.
—Govind Ramu
BIBLIOGRAPHYbrassard, Michael, The Memory Jogger Plus+, Goal/qPc inc., 1989.Domb, E.R., “7 New tools,” Quality Digest, December 1994.Minitab, “Meet Minitab 16” software documentation, www.minitab.com/en-us/
products/minitab/documentation.aspx?langtype=1033.quality council of indiana, Certified Manager of Quality Primer, 2010, pp. vi-19.shigeru, Mizuno, Management for Quality Improvement: The Seven New QC
Tools, Productivity Press, 1988.tetsuichi, asaka, and Ozeki Kazuo, Handbook of Quality Tools: The Japanese
Approach, Productivity Press, 1990.
Knowing how to visually present data is absolutely criti-
cal in today’s workplace, especially when you consider
that visual representation of data is the only way you will
reach some individuals. Matrix diagrams can be used to
show the relationship between two, three or four groups
of information.
There is a fundamental need for matrix diagram us-
ers to be familiar with data. To get started, you must
determine ahead of time where the comparisons are go-
ing to be. The tool can be an excellent way to compare
customers, associates in a call center, departments and
processes, for example. The entities being compared are
typically listed across the page (x axis). Features or as-
pects for comparison are listed going down the page (y
axis).
Suppose a back-office processing area is scanning
forms into a system. When you look at productivity data,
you can quickly see there are two groups with distinctly
different productivity.
List the names of the associates across the page, keep-
ing in mind the total number of associates. If the number
is small, you can list all the associates. If the number is
large, you may need to create a composite employee,
showing how typical high and low performers appear.
Brainstorm potential areas that participants say they
think might be at the root of driving performance. The
output of this activity would be listed down the page.
Start filling in the matrix with the data you have. You will
then have something to show management about how
employees differ in performance and what may be caus-
ing the performances to be different.
One particular matrix diagram my organization uses
on a regular basis is the 2 x 2 matrix (Figure 8). When
we conduct workshops with clients, invariably a point is
reached at which we identify po-
tential solutions. The 2 x 2 matrix
helps the business partner differ-
entiate the solutions.
This differentiation is cen-
tered on the effort required to
implement a given solution and
what the potential impact would
be. Solutions are placed on the
grid in response to the evalua-
tion of the solution against a pre-
defined set of criteria that defines
effort and impact.
Potential solutions falling into
the green block—high impact
and low effort—are the targeted
solutions. These are typically labeled as quick hits. So-
lutions falling into the red block—high effort and low
impact—are prioritized lower on the list because more
resources are required to implement a solution that will
make less of an impact.
Using the two extremes as an example, the matrix
diagram of impact and effort shows the relationship be-
tween the solutions by their positions on the grid. Using
the predefined criteria enables a group to use this dif-
ferentiation to make business decisions regarding which
solutions to pursue.
Matrix diagrams are a simple yet powerful means of un-
derstanding data. Perhaps more importantly, they are an
effective way to convey information to decision makers.
—Keith Wagoner
BIBLIOGRAPHYasq, “seven New Management and Planning tools—Matrix Diagram,” http://
asq.org/learn-about-quality/new-management-planning-tools/overview/matrix-diagram.html.
2 × 2 impact and effort grid / figure 8
High
effo
rt
Low
Low High impact

T
QP • www.qualityprogress.com26
The process decision program chart (PDPC) is an excel-
lent tool for what can be called project risk management.
Risk management involves looking ahead proactively
during planning to identify potential future problems.
PDPC provides a structure to identify what can go wrong
and then plan what to do when the wrong things happen.
PDPC is a visual tool that combines and builds on ele-
ments of several other techniques. It may enhance a tree
diagram in which an objective and one or two levels of
activities or tasks already have been defined. It has some
characteristics of failure mode and effects analysis, such as
the identification of risks, consequences and mitigations.
The PDPC also can be described as a graphical version
of the good project management practice of proactively
identifying issues, risks and assumptions. Therefore, a
PDPC is a nice tool to place into a project plan or charter.
Many levels of planning could benefit from the PDPC.
The top level is strategic planning, for which the PDPC
could be used to help select key initiatives or programs
from several alternatives. A second level is program plan-
ning. “Program” means a portfolio of projects or a group
of interrelated activities with specific endpoints.
A PDPC can be used to help select the projects or ap-
proaches that are most likely to succeed and weed out those
that are not feasible because of high risk or unavailability
of resources. After a specific project has been chosen, the
PDPC can be used in its most basic form for detailed contin-
gency analysis within the scope of project planning.
Figure 9 is a simplified example of a PDPC with infor-
mation from program and project planning. The initiative
of training quality engineers was chosen as a way to sup-
port the strategy of improving product quality in design.
Alternative projects addressing different methods to de-
liver the training were evaluated. The concept of using
internal resources was chosen as the preferred strategy.
Then, within the scope of this project, several risks
Process decision program chart example / figure 9
Strategic planninginitiative selection
Improve product quality in design
Quality engineer training(selected initiative)
Obtain training fromexternal sources or
consultants
Lack ofunderstanding ofinternal company
systems
Timecommitment
too high
Do not haveexpertise in
trainingCost too high
Lack of benefitof interaction
Difficult to trackprogress, ensureconsistency and
motivate
Train the externaltrainers on
internalprocesses and
procedures
Solicitmanagement
support, place onemployees’objectives
Provide trainingon presentation
skills andtraining
dynamics
Allocate funds inthe budget
Bring studentstogether
periodically fordiscussion
Provideoversight ofindividuals
Self-study andindividual certification
Use internal resources(selected project)
Program planningproject selection
Project planningcontingency selection
XLogistics
O XCost
XSchedule
OSelected mitigation
OSelected mitigation
Project benefits do not outweigh risk. Project benefits do not outweigh risk. Benefits outweigh mitigated risks. Trainers increaseknowledge and presentation skills, cost savings comparedwith external, team building with interaction and participation.

A
April 2012 • QP 27
basic quality
were identified and mitigations developed during the plan-
ning phase. Throughout the process, decisions were made
by considering the potential risks at each step and elimi-
nating the activities for which risk mitigations or counter-
measures were not considered practical.
Figure 9 also shows the common PDPC practice of
denoting impractical countermeasures with an X and
practical countermeasures with an O. Identification of
countermeasures deemed impractical was based on con-
straints in the project cost, schedule or logistics.
Ultimately, using the PDPC thought process facilitates
project planning, identifies risks and mitigations, and
helps secure approval to execute a project based on the
best benefit and risk ratio, and likelihood of success. The
process decision program chart is, therefore, very de-
serving of its accurate and descriptive long name.
—Scott Laman
A relations diagram is a graphical representation of the
relationship between cause and effect or a given out-
come, and all the factors that influence or contribute to
that outcome. Figure 10 shows an example of a relations
diagram, which is a variation of a typical fishbone or
cause and effect diagram.
Developing a relations diagram is a structured ap-
proach to problem solving. The diagram also can be used
to learn more about the problem being addressed, be-
cause it can clarify thinking about how various factors
are related or contribute to the problem being addressed.
After you know these factors, you
can address each one, depending on
its importance in terms of severity
of effect and the cost of addressing
it or not.
Developing a relations diagram
involves brainstorming and organiz-
ing thoughts as explained in the fol-
lowing five steps:
1. Identify a group of people—usu-
ally no more than five or seven—
to participate in developing a
relations diagram about a prob-
lem. Include people from various
departments and people with dif-
ferent perspectives.
2. Distribute a clear problem state-
ment to be reviewed at least a
day or two in advance of the first
meeting so group members have a chance to think
about it and come to the meeting somewhat prepared.
3. Ask everyone to write on a sticky note one factor they
think contributes to the problem. Collect the notes
and place them on a wall or a board. Do this a second
or third time, or until all factors are covered. These
notes do not need to be placed in any order—placing
them randomly is fine.
4. Write the problem statement on another wall, board
or a flip chart. Then, take one of the notes and discuss
whether it is a contributing factor and whether the
Poor quality
Ongoing conflictbetween quality
assurance (QA) andproduction
Poor machinemaintenance
Low-qualitymaterials
High operatorturnover
Low payLack of training
Lack ofadvancement
Poor working
conditions
Productiontoo busy
Management notunderstanding linkbetween qualityand profitability
Inadequate QA andHR budgets
No accurate cost-of-quality data available
Buying from thecheapest source
No account ofincoming materials
Lack of purchasing
professionalism
Relations diagram / figure 10
MANY OF THE AuTHORS drew from Nancy R.
Tague’s The Quality Toolbox (ASQ Quality Press,
2005) to develop the summaries of the seven
management and planning tools. For more about
the book and to read a sample chapter, visit
http://asq.org/quality-press/display-item/index.
html?item=H1224 (case sensitive).

A
QP • www.qualityprogress.com28
A tree diagram allows you to detail a conceptual or high-
level goal into more operational tasks to achieve the
desired result. The tree diagram starts with one item
that branches into two or more branches, each of which
branches into two or more, and so on.
Tree diagrams can be used to break down broad cat-
egories into finer levels of detail and can be adapted for a
wide variety of uses.1 Developing the tree diagram helps
move team thinking from generalities to specifics. The
tree diagram is a generic tool that can be adapted for a
wide variety of purposes:
•Developinglogicalstepstoattainaspecificresult.
•Conductingafivewhysanalysistoexplorearootcause.
•Communicatingtoencourageinvolvementinthedevel-
opment of a jointly supported result.
•Drillingdowntomoredetailedlevelsofaprocessflow.
• Graphicallyrepresentingahierarchicalprogression,such
as a genealogy or classification scheme.
The structure of the tree diagram represents the hi-
erarchical nature of a structure in a graphical form. It is
called a tree structure because the classic representation
resembles a tree, even though the chart is generally upside
down compared with the shape of an actual tree.
Some quality improvement teams often represent the
tree from left to right, with the root at the left and the
increasing levels of detail branching out to the right.
Every completed tree diagram has a root or root node,
which also can be thought of as the starting node. The
lines connecting elements are called branches, and the
elements themselves are called nodes. Nodes without
children are called leaf nodes, end-nodes or leaves.2
To construct a tree diagram, begin with the root node.
Develop a short statement of the goal, issue or item be-
ing broken down. Locate the root node either at the top
or far left of the diagram. Brainstorm what will take the
hierarchy to the next level of detail. For an action plan,
this may be the next steps to be taken. For an organiza-
tion chart, it’s the person who reports to the next level of
the organization.
Brainstorm all possible items for each level until there
group agrees it is. Place it near the problem statement,
and draw an arrow from this note to the problem
statement. Repeat the same process with another note
(factor). Continue this and a relations diagram will
emerge, as shown in Figure 10. If one factor contrib-
utes to more than one outcome, you can have arrows
starting from a factor leading to several outcomes, as
shown in the figure.
5. Schedule a relations diagram session for no more than
one hour because of the fatigue factor. If necessary,
hold more than one session.
Looking at Figure 10, it is clear the lack of manage-
ment understanding about the link between quality and
profitability contributes to many factors leading to poor
quality. However, there are no cost-of-quality data avail-
able, so the link between quality and profitability cannot
be explained.
Therefore, to address poor quality, the first step must
be to collect cost-of-quality data for a certain period. Af-
ter sufficient data are collected and analyzed, a presenta-
tion on the subject can be made to management. Ideally,
after management understands the link between quality
and profitability, it will support quality efforts and also
look into the professionalism of the procurement and
purchasing function.
Before the relations diagram was developed, the nor-
mal tendency for everyone in an organization was to
blame poor quality on high operator turnover, poor-quali-
ty materials or poor machine maintenance. The relations
diagram clarifies what ultimately drives those factors,
which in turn helps address the root cause of poor quality.
—Pradip Mehta
CHECk OuT THE ARTICLE that inspired this month’s sequel. “Building From
the Basics” appeared in the January 2009 edition of QP and continues to
receive rave reviews from readers. You can find
the open-access article at http://asq.org/quality-
progress/2009/01/basic-quality/building-from-
the-basics.html. Share the link with colleagues
through email, Twitter or Facebook. Also find
templates for most of the seven basic tools at
ASQ’s Quality Tools & Templates corner of its
website at http://asq.org/learn-about-quality/
tools-templates.html.
Putting Best Practices to Work www.qualityprogress.com | January 2009
Plus: The Big Three:
Did Quality Fail Them?p. 14
Lean Six Sigma Saves Millions
p. 42
QU
ALITY PRO
GRESS | JA
NU
ARY 2009
BUILD
ING
FROM
THE BA
SICS: 7 Q
UA
LITY TOO
LS VO
LUM
E 42/NU
MBER 1
QUALITY PROGRESS
12 Tips To Survive The Recession p. 8
The seven essential quality tools p. 18
B L NG S I S U
F M HEB
R

GRACE L. DUFFY is president of Management and Per-formance Systems in Tavares, FL. She earned a master’s degree in management and information systems from Georgia State University in Atlanta. Duffy is an ASQ fellow and holds ASQ certifications as a quality auditor, manager of quality/organizational excellence and improvement associate.
SCOTT A. LAMAN is a senior manager of quality engineer-ing and risk management for Teleflex Inc. in Reading, PA. He earned a master’s degree in chemical engineering from Syracuse University in New York. Scott is an ASQ fellow and is certified as a quality engineer, reliability engineer, manager of quality/organizational excellence, auditor and Six Sigma Black Belt.
PRADIP MEHTA is the retired director of quality assurance for the Army & Air Force Exchange Service in Dallas. He earned master’s degrees in textile engineering from Lowell Tech in Lowell, MA, and business administration from the University of Dallas in Irving, TX. A certified quality auditor and systems lead auditor, Mehta is an ASQ fellow and the former chair of its diversity committee.
GOVIND RAMU is a senior manager for global quality sys-tems at SunPower Corp. in San Jose, CA. Ramu is a licensed professional mechanical engineer from Ontario, Canada. An ASQ member since 1998 and an ASQ fellow, Ramu holds six ASQ certifications: manager of quality/organizational excel-lence, engineer, Six Sigma Black Belt, auditor, software engi-neer and reliability engineer. He is co-author of the certified six sigma Green belt Handbook (ASQ Quality Press, 2008).
NATALIA SCRIABINA is a vice president and cofounder of Centauri Business Group Inc. in Waterloo, Ontario. She earned a master’s degree in engineering sciences, automat-ed control of electrical systems from the National Technical University of Ukraine in Kiev. Scriabina is a member of ASQ.
KEITH WAGONER is a director of continuous improvement at Lincoln Financial Group in Greensboro, NC. He is a senior member of ASQ and a certified quality engineer.
is no item or action available at a
finer level of description. For a
vertical tree, write each idea in a
line below the branch. For a hori-
zontal tree, write it to the right of
the first statement. Do a “neces-
sary and sufficient” check. Are all
the items at this level necessary for
the one on the level above? If all
the items at this level were present
or accomplished, would they be
sufficient for the one on the level
above?3
Figure 11 shows an example of
a tree diagram that illustrates how
to prepare for ASQ’s manager of
quality/organizational excellence
(CMQ/QE) certification. “Prepare
for CMQ/QE” represents the goal,
or root, of the tree diagram, while
“Take ASQ review course,” “Take
another course” and “Self-study
from ASQ Body of Knowledge” are
the next level of details, or nodes,
that branch from the root. Further
activities and descriptions below
each of these three nodes continue
until options and ideas seem exhausted.
—Grace L. Duffy
Tree diagram to prepare for CMQ/OE exam / figure 11
Prepare for CMQ/OEcertification
Take ASQreview course
Take othercourse
Researchother options
E-learning
Gain approval
Register
Participate
Study alone In study group
Study
StudyStudy
Borrow fromfriend
Order reviewguide from
Quality Press
Use ASQ CMQ/OE
review guide
Use other texts
Considerparticipants
Contactparticipants
Secure studylocation
Decide timesand schedule
Public course
Local
Gain approval
Register
Travel required
Gain approval
Attend Register
Attend
Providejustification
Researchoptions
Providejustification
Make travelplans
Self-study fromASQ Body ofKnowledge
CMQ/OE = certified manager of quality/organizational excellenceNote: This tree diagram is intended to be used an example and is not a complete guide to prepare for the CMQ/OE exam.
basic quality
April 2012 • QP 29
REFERENCES1. Nancy R. tague, The Quality Toolbox, second edition, asq quality Press, 2004, p. 501.
2. Wikipedia, tree structure, http://en.wikipedia.org/wiki/tree_structure.
3. tague, The Quality Toolbox, p. 502, see reference 1.

One Size Fits All

April 2012 • QP 31
One Size Fits All
EvEry Handyman rElisHEs the chance to
use his biggest and baddest tool: the circular saw, the power
sander, the power drill—pretty much anything with the word
“power” in it, actually. But while those are fun to use, it’s rare to
find a home-improvement project that doesn’t require having a
hammer somewhere in the vicinity.
There’s a reason why a tool like that endures in this age of
technology: It works, regardless of the situation. That’s a char-
acteristic shared by the Baldrige Criteria for Performance Ex-
cellence, which has helped every type of organization you can
imagine—from those with 100 employees in one location to
those with 100 sites around the world—improve all facets of
their operation.
The wide-ranging impact of the criteria is evident in the four
organizations selected to receive the Malcolm Baldrige National
Quality Award in 2011. From a small publishing house in St. Lou-
is to a massive healthcare system headquartered in Detroit, the
quartet found common ground in their desire to improve and
the tool they used to achieve their goal.
BAldrige AwArd
Baldrige recipients prove organizations of all
sizes can benefit from using award criteria
by QP Staff

A
QP • www.qualityprogress.com32
schneck medical CenterAsk anyone who has ever been treated at a hospital to
list the jobs that are key to a positive patient experi-
ence, and you’ll hear the obvious: doctors, nurses and
receptionists. But what about staff that deal with money
more than medicine? Or those in HR instead of the ER?
That all-inclusive approach to putting the patient
first helped Schneck Medical Center (SMC) in Jackson
County, IN, earn a 2011 Baldrige award and, more im-
portantly, created an organizational culture as healthy
as the customers it serves.
SMC created a patient-focused system supported by
four areas—quality of care, customer service, fiscal and
operations, and human resources (see Online Figure 1
at www.qualityprogress.com)—and each area saw the
improvement you’d expect from a Baldrige recipient.
1. Quality of care. For any organization, it’s quite a
feat to measure your time between negative incidents
in years. SMC is in that elite class thanks to a focus
on preventing hospital-acquired infections. It recorded
zero central line-associated bloodstream infections in
2011, the last case of ventilator-associated pneumonia
was in 2009, and the overall rate of hospital-acquired
infections has remained at or below 1% since 2008.
SMC proved its commitment to putting the patient
first when it noticed that a measure related to its treat-
ment of heart attacks was far beyond what it could have
been. Its “door-to-balloon time”—how long it takes to
assess and diagnose a myocardial infarction, and de-
liver the necessary intervention—was 120 minutes, so
SMC partnered with a competitor 25 miles away to co-
ordinate handoffs. The new system drastically reduced
door-to-balloon time to as low as 53 minutes.
2. Customer service. Consulting firm Press Ganey
helps those in the healthcare industry improve perfor-
mance by tracking measures in crucial service areas.
In the last round of surveys, SMC landed in the top 25%
for nine of 10 measures and earned a spot in the top
10% for overall satisfaction in each customer segment
and overall satisfaction for adult inpatients.
Those numbers were supported by the Hospital
Consumer Assessment of Healthcare Providers and
Systems, which verified that SMC bested other Indiana
hospitals from 2008 to 2011 in areas such as the abil-
ity of nurses and physicians to listen, understand and
provide clear discharge instructions.
3. Fiscal and operations. By rigorously monitor-
ing its daily and monthly activities, in addition to an
annual review of key performance measures, SMC has
improved its bond rating and its operating margin in
the years since the 2009 economic downturn. Because
of those efforts, its reported results are in line with
Standard & Poor’s “A” and “AA” rated median levels.
Also, from 2008 to 2010, SMC achieved revenue
growth in its five strategic focus areas: women’s health,
joint replacement, noninvasive cardiac care, cancer care
and bariatric surgery. That’s no surprise considering that
in the county in which it resides, SMC’s market share
is better than 60% for inpatient care, 70% for outpatient
care and 80% for ambulatory care.
4. Human resources. Since implementing the Bal-
drige criteria in 2007, SMC’s staff turnover rate has
dropped by 25%. Those results stem from an increased
focus on staff feedback, as well as a hiring program that
features peer interviewing and collects employee input,
both of which contribute to the selection of new hires.
On the nursing side, from 2009 to 2011, SMC report-
ed a satisfaction level above the benchmark set by the
National Database of Nursing Quality Indicators. The
results for doctors are equally impressive thanks to a
revamped approach by the medical executive commit-
tee, which welcomes physician input for staffing deci-
sions. Because of that, 90% of SMC doctors said they
felt engaged and aligned with the organization.
Perhaps the most intriguing approach to ensuring a
satisfied staff comes from SMC’s “Grow Our Own” pro-
gram. In it, local students at the middle and high-school
levels shadow staff members, and then return to work
at SMC during college. The program is directly respon-
sible for 17 individuals joining the current medical staff.
“Our employees are our most important contribu-
tor to Schneck’s performance excellence,” said Gary A.
Meyer, SMC president and CEO. “Receiving this award
is an extraordinary accomplishment and recognition
of their commitment to continuously improve patient
outcomes while safely reducing the cost of care.”
—Brett Krzykowski, assistant editorSourceSSchneck Medical Center, “Schneck receives 2011 Presidential Award for
Quality and Performance excellence,” http://schneckmed.org/aboutus/newsdetail.aspx?id=167, Nov. 22, 2011.
National institute of Standards and Technology, “Schneck Medical Center,” www.nist.gov/baldrige/award_recipients/schneck_profile.cfm.

A
April 2012 • QP 33
BAldrige AwArd
As one of the most comprehensive integrated health sys-
tems in the nation, Detroit-based Henry Ford Health Sys-
tem (HFHS) employs a workforce of 29,856 at 140 sites
spanning a three-county area. The system includes:
• Seven hospitals, including a large, level-one trauma
flagship hospital.
• 33multispecialtyambulatorycarecenters.
• Affiliatedphysicianpractices.
• Aresearchandeducationcomponent.
• AHealthAlliancePlanprovidinghealthcoverage to
more than 467,000 members.
• 91 community care operations, including outpatient
behavioral health, nursing homes, hospices and dialy-
sis centers, and retail operations offering such servic-
es as optometry and home medical products.
So when HFHS decided to use the Baldrige frame-
work, it knew it would take work to successfully imple-
ment it on a systemwide level. But, as Susan Hawkins, se-
nior vice president of performance excellence at HFHS,
explained, the system’s leaders were undaunted.
“We think it may have been easier for one of our hos-
pitals or business units to apply for the award as an indi-
vidual entity,” she said. “But our CEO never wavered in
her belief that we have to do this as a system. Everything
that we have to do around the Baldrige criteria supports
integration—all units working together for a common
purpose. We took the harder road.”
Because of its systemwide approach, one of the key
contributors to the success of HFHS has been its senior
leaders team, which consists of about 25 CEOs from each
of its business units and key corporate leaders.
The team meets bimonthly for two to three hours at
a time, focusing on strategic planning activities and or-
ganizational performance review. Each leader is respon-
sible for communicating and implementing ideas from
these meetings back at his or her business unit.
According to Hawkins, the team represents a dramat-
ic shift in the way the organization is led and has been
a key part in its Baldrige success. “Each member of the
senior team is accountable to the others for sharing ac-
tions and results—both strengths and opportunities—
routinely and transparently,” she said.
HFHS’s patient-safety and quality-of-care efforts—key
drivers in its pursuit of the Baldrige award—hinge on ini-
tiatives the system continues each year, including:
• Aseriesof interventions focusedonmortality reduc-
tion. Since 2004, the system has reduced its mortality
rates by 40%.
• A “No Harm” campaign modeled after the Institute
for Health Improvement’s 100,000 and 5 Million Lives
campaigns to reduce patient morbidity and mortality.
The HFHS program focuses on reducing harm on a
broad scale. In the program’s fifth year, the system has
seen a 27% reduction in harm.
• Asystemwideefforttoreducereadmissionsbyiden-
tifying necessary actions needed for patients deemed
at high risk for readmission.
• A focus on innovation in ambulatory patient care.
To drive improvement, the system established and
spread a medical home model—called Patient Cen-
tered Team Care—and created bundles of clinical
interventions and screenings focused on prevention
and diabetes management. These bundles are linked
to quality bonuses for physicians.
HFHS plans to travel this year and host “sharing days”
to discuss its quality strategies with other organizations.
But this doesn’t mean the system will stop moving for-
ward in its own quality journey.
“We can’t stop improving,” Hawkins said. “We have
work to do. We know what our opportunities are—they
were validated by our feedback in the Baldrige site visit
experience—and we’ll continue to look at those things.
This is just the beginning.”
—Amanda Hankel, contributing editorSourceNational institute of Standards and Technology, “Henry Ford Health System,”
www.nist.gov/baldrige/award_recipients/ford_profile.cfm.
dOCTOrs FrOm HEnry Ford Health system meet as they walk the hallways of one of the organization’s 140 sites.
Henry Ford Health system

B
QP • www.qualityprogress.com34
Bruce Kintz, president and CEO of Concordia Publishing
House (CPH), a nonprofit organization headquartered in
St. Louis, MO, says the Baldrige criteria has been in his
head pretty much his entire career. But he knew he needed
to get quality into the heads of his employees at CPH be-
fore formally rolling out the criteria as the company’s per-
formance improvement framework in 2001.
“I started off slow and went the route of making sure
we had proper buy-in before I actually announced that
there was criteria associated with the effort,” Kintz said.
“So while we’ve been using it and known the actual
words of the criteria for a decade, it’s been about 13 years
in total that we’ve been implementing it.”
CPH has pursued quality excellence via the Baldrige
criteria for more than a decade. The organization first
gained recognition in 2009, winning the Missouri Quality
Award.
“That told us we were on the right track. Then, two
years later, to win the national Baldrige award was a ma-
jor milestone in our quality journey that further proves
we run as efficiently as many other benchmark compa-
nies,” Kintz said.
He attributes CPH’s success to several efforts that
have helped leaders run the organization efficiently
while keeping customers and employees happy.
First, CPH’s annual strategic planning process is
continuously improved through multiple review cycles
that engage management and employees. The organiza-
tion employs an inverted strategic planning process that
involves three planning horizons—long, medium and
short-term. This strategy provides in-process measures
that help predict end-of-process measures, Kintz said.
“The process improvement process that we use—
plan, do, check, act—has been inculcated throughout
CPH,” Kintz said. “When you couple those along with
voice of the customer (VOC) and voice of the employee,
we have all we need to work well with our board of di-
rectors and plan for the future.”
He added that with help from those tools, CPH’s over-
all customer satisfaction scores soared above 98% and
exceeded levels set by the annual Purdue University
Benchmark Study of U.S. Call Centers.
“We focus on our customers in everything that we do,
and our quality improvement is aimed at improving our
relationship with the customer,” Kintz said. “VOC feed-
back actually drives our product development here.”
CPH uses VOC to gather input from customers for
compliments, product ideas and complaints. Core prod-
uct teams analyze customer data, prioritize product and
service offerings, and design products to meet and ex-
ceed customer requirements and expectations.
In addition, CPH’s emerging products team explores
the use of state-of-the-art technologies to deliver new
and innovative products, such as eBooks, iPhone/iPad
apps and customizable online curriculum builders.
As a result, the number of digital products CPH of-
fers increased from 457 in 2008 to 1,927 in 2010. “It’s the
future—digital publishing rather than traditional,” Kintz
said.
CPH also gathers employee feedback through a bi-
annual employee survey, the results of which have im-
proved every two years over the previous survey taken.
“Our employees are our reason for success,” Kintz
said. “They’re our associates, partners and family, and
they’re also the future of this business. If we listen as a
management team, then our employees are going to be
responsive to that and give us good ideas.”
It seems there is no shortage of good ideas at CPH. It
recently launched an innovation team to ensure employ-
ees are actively involved in developing new ideas and see-
ing them come to fruition. It’s just another way the organi-
zation continues its commitment to quality improvement.
“It’s never over,” Kintz said. “It’s a quality journey, and
this is one step forward in that journey.”
—Amanda HankelSourceNational institute of Standards and Technology, “Concordia Publishing House,”
www.nist.gov/baldrige/award_recipients/concordia_profile.cfm.
Concordia Publishing House
COnCOrdia PUBlisHinG HOUsE’s increased focus on electronic offerings resulted in a nearly five-fold increase in e-products from 2008 to 2010.

April 2012 • QP 35
BAldrige AwArd
Asouthcentral FoundationAnyone who thinks a grassroots, homegrown effort
can’t transform a stumbling organization into a bastion
of efficiency and excellence, Southcentral Foundation
(SCF) has one word for you: nuka.
That’s the Alaska Native word used for strong, gi-
ant structures and living things. It’s also the name of
the healthcare model that helped transform the service
provided to Alaska Natives and American Indians from
a slogging system to a streamlined one that helped An-
chorage-based SCF earn a 2011 Baldrige award.
“This award recognizes and honors the strength and
traditional values of the Alaska Native people and our
customer-owners, which Southcentral Foundation’s
Nuka System of Care was built upon,” said Ileen Sylves-
ter, SCF vice president of executive and tribal services.
“A large component of our vision is a healthy, thriving
community for generations to come. This award reflects
that we are well-positioned to see that vision through.”
Back in 1998, that wasn’t the case. Patients waited
weeks for an appointment, and then waited some more
after finally arriving at the doctor’s office. When they
actually saw a physician, often it was a different doc-
tor for every visit. The connection between patient and
provider was simply nonexistent.1
Everything changed in 1999, when SCF completed
its transition away from a government-run healthcare
system to a customer-owned approach. That process
began in 1982 and culminated with an organization that
bases everything it does on relationships.
That’s not as easy as it sounds because of the
ground SCF must cover. The organization’s 1,400 em-
ployees serve around 55,000 people, including 10,000
in 60 remote Alaskan villages.2 But SCF has established
an environment in which it puts what it calls its “cus-
tomer-owners” first, and it did it via its Nuka System of
Care, which is founded on four principles:
1. Customers drive everything.
2. Customers must know and trust the healthcare team.
3. Customers should face no barriers in seeking care.
4. Employees and supporting facilities are vital to suc-
cess.3
SCF’s results prove those tenets aren’t just words.
Gone are the days of waits measured in weeks. Now, if
customer-owners call by 4 p.m. and arrive by 4:30 p.m.,
they can see their primary-care provider the same day.
SCF can do that because it has constructed a system in
which 70% to 80% of appointment slots are unfilled at
the beginning of the day.4
That access has contributed to a customer-satisfac-
tion rating that reached 91% in 2010. In addition, Con-
sumer Assessment of Healthcare Providers and Systems
(CAHPS) surveys put SCF’s overall satisfaction rating at
73.3%, well above the CAHPS benchmark of 46%.5
Those numbers wouldn’t have been possible if SCF
hadn’t changed its leadership makeup and involved a
group of people that had a vested interest in its suc-
cess. Now, the majority of managers are Alaska Na-
tives or American Indians.
“It is so wonderful for external experts to recog-
nize the amazing journey of Alaska Native people in
creating and running SCF’s Nuka System of Care,” said
Douglas Eby, M.D., vice president of medical services.
With that change in leadership came a philosophy
centered on the values of the Alaska Natives, which
SCF credits for its ability to provide same-day service,
as well as several other improvements:
• A40%decrease inexpensiveERandurgent-care
visits.
• A50%decreaseinspecialtycare.
• A20%decreaseinprimary-carevisits.
• A 30% decrease in admissions and the number of
days that patients spend in the hospital.6
If anyone is as pleased with those numbers as
SCF, it’s the Alaska Native Tribal Health Consortium
(ANTHC), which partners with SCF to operate and
manage the Alaska Native Medical Center.
“Undoubtedly, the accolades will continue for
Southcentral Foundation,” said ANTHC Chairman
and President Andy Teuber, “not only through awards
such as the Baldrige National Quality Award, but also
through the continued recognition of the Nuka System
of Care that acknowledges that relationships support
wellness.”
—Brett KrzykowskireFerenceS1. Southcentral Foundation, “Southcentral Foundation’s Nuka Model,” www.
arcticparl.org/files/080812katherinegottlieb1.pdf.2. Southcentral Foundation, “About Us,” www.scf.cc/about/index.ak.3. Baldrige.com, “A Unique Healthcare delivery System,” www.baldrige.com/
sector/healthcare/a-unique-healthcare-delivery-system, dec. 1, 2011.4. ibid.5. ibid.6. Southcentral Foundation, “Southcentral Foundation’s Nuka Model,” see ref-
erence 1.

1
Fair Fou l?
or

QP • www.qualityprogress.com2
Headline Goes In This Area
FIrsT THree words are Vectora Bold 18 pt all
cap. Ullamet iustrud dipit nulla alit nonsecte modolenibh eum
at, quat. Ibh eui ea faccumsan henim atue magna faccum quat.
Odolortio odo dolor alit ipis at, con utatuer ad tat luptatumsan
enissecte molendrem iriure er acil eu feum eummolobor iurem
er sim quatet illa facidunt wisi.
Gait nullam quat. Ut inibh ero ex exerostrud tat nos autet ex
ea feugiat iusto consed tatie dolorper iril utat etueraessis ex
eugiamc onulpute modoloreet lum augueril dit vulputem venit,
sit nulput ut voloborper illa feum vendrer cincipi sisit, conse
erciduis dolorperos nulputpatum dolor iusto odolore rciniat,
se venis ad dunt lum ip ea facidunt ea am, veleniam volortinit
In 50 Words Or Less • Text for 50 words or
less is Vectora Roman 9 on 11 with hanging indents.
• Text for 50 words or less is Vectora Roman 9 on 11 with hanging indents.
• Text for 50 words or less is Vectora Roman 9 on 11 with hanging indents.
• Text for 50 words or less is Vectora Roman 9 on 11 with hanging indents.
Deck goes hereby Author Name
April 2012 • QP 37
AFTer MONEYBALL1 wAs published nine years
ago, Oakland A’s General Manager Billy Beane was hailed as a
genius for adopting analytics in baseball. His goal was to create a
small-budget Major League Baseball (MLB) team that could com-
pete with big-spending teams in the American League (AL), effec-
tively turning the old system of recruiting players upside down.
Nearly a decade later, Beane’s methods for discovering and
drafting undervalued players are baseball’s worst-kept secret.
What’s become known as the Moneyball philosophy has become
well entrenched in the sport and the mainstream. Every baseball
club employs statisticians who leverage sabermetrics2 to assem-
ble the best possible baseball team based on analytics.
Last year, Hollywood heavy hitter Brad Pitt played the role
of Beane in the movie adaptation of Moneyball, which received
some Oscar buzz. “The Simpsons” even poked fun at Moneyball
and sabermetric principles in a 2010 episode.
In 50 Words Or Less • The Oakland A’s were
the first baseball team to implement analyti-cal-based methods to evaluate players, an approach referred to as Moneyball.
• The A’s had limited success with the ap-proach, in part because other areas of the game must be consid-ered as part of an over-all statistical analysis of a team.
statistics
The innovative Moneyballmanagement approach can make a difference—up to a point
by I. Elaine Allen and Julia E. Seaman

QP • www.qualityprogress.com38
Beyond baseball and entertainment, business media
also took note of Moneyball and applied it to the world
beyond balls and strikes. For example, Forbes distilled
the use of Moneyball principles to help businesses hire
employees, and Harvard Business School suggested
Moneyball analytics should play a role in preparing all
business management candidates.3-4
These and other articles on Moneyball offer one main
message to the business world: With analytics, you can do
more with less.5 The success of Moneyball also suggests
there is a way to overcome the odds and field a competi-
tive, championship-level team by understanding the at-
tributes that make the whole team a winner rather than
simply a collection of individuals with unique talents.6
But was this approach actually a winning strategy?
Was it a sustainable strategy for the A’s? Using baseball
data from 1999-2011, which includes pre-Moneyball base-
ball, the Moneyball era and post-Moneyball baseball, we
assessed Beane’s approach as a technique for winning
games, championship playoffs and the World Series.
Specifically, was this analytical management a good
approach or simply a temporary fix? Could the A’s have
stayed within reach of the postseason and World Series
for a longer period of time by employing additional ana-
lytics? Or was a lack of a larger payroll going to inevita-
bly sink the team no matter what scouting strategy the
A’s adopted?
Basing value on oBPAs a general rule, because better players demand and re-
ceive higher salaries, the number of games won tracks
with the team’s payroll. Teams with large payrolls tend
to have more experienced and higher-rated players, and,
therefore, should have greater success in the regular sea-
son and postseason.
In 1999, the A’s ranked 11th of the 14 AL teams in pay-
roll and fifth in games won. By 2002, its total payroll had
fallen to 12th in the league, but the team had moved into
first place in games won. The A’s first-place spot was an
unprecedented outcome.
Going against the assumption that large payrolls
translate into postseason wins, the A’s used analytics—
relying heavily on team on-base percentage (OBP) rather
than individual players’ performances—to acquire and
sign players. Rather than looking to his scouts to recruit
players, Beane put a quantitative analyst in charge, think-
ing this shift in strategy would result in:
• Amorecompetitiveteam.
• Amoreefficientwaytofindanddraftplayers.
• Awayforsmall-budgetteamstoreachtheplayoffs.
Beane’s focus on OBP in his ranking of hitters was key:
The statistic reflects discipline in the batters’ box because
it includes non-hits that may allow a player to reach base
(walks, hit batsmen or, rarely, catcher’s interference). To
evaluate the Moneyball effect, we used some of the same
data analysis, visualization techniques and statistical mod-
els the A’s leveraged. Specifically: Did the effect exist? Was
it sustainable? If not, what should or could the A’s have
done next to sustain success?
data and methodWe created a database that includes all information on
team payroll and performance information for all MLB
teams from 1998-2011. Variables were created to iden-
tify the A’s, teams that made the playoffs, teams that ap-
peared in the World Series and World Series winners.
A categorical variable identified the periods: pre-Mon-
eyball (1998-1999), Moneyball in Oakland (2000-2003)
and post-Moneyball (2004-2011). Other variables includ-
ed dividing the teams into low, medium and high payroll
based on median values, quartiles and rank of the team
in terms of payroll and market size. Performance statis-
tics included standard batting, pitching and defense for
each team.
Data were analyzed using standard statistical tech-
niques, including univariate, bivariate and multivariate
−0.40
−0.20
0
0.20
0.40
0.60
0.80
1
1998
1999
2000
2001
2002
2003
2004
2005
2006
2007
2008
2009
2010
2011
Correlation betweenpayroll and games won
Correlation betweenpayroll and OBP
OBP = on-base percentage
Correlations by years and teams / FIguRE 1

April 2012 • QP 39
methods. These include correlation, regression, time
series analysis and analysis of variance using SPSS Sta-
tistics software (version 19), and plots and multivariate
visualizations using Excel and Tibco Spotfire software.
Payroll, games won and oBPTable 1 and Figure 1 compare the correlations—strength
of the relationship between variables—of MLB payrolls,
games won, payrolls and team’s OBP from 1998-2011.
The A’s implemented its analytic scouting techniques
from 2000-2003 before most other teams did. During
those years, the analysis shows the decline—to a small
extent—in the correlation between payroll and games
won, but to a great extent between payroll and OBP.
In other words, from 2000-2003, while a team’s larger
payroll was still strongly linked to more wins, there was
no longer a strong direct connection between payroll
and OBP, possibly reflecting Beane’s choice to optimize
his team’s OBP with the limited A’s payroll. The analy-
sis in Figure 1 and Table 1 incorporates all MLB teams,
so the change in the correlation also may indicate that
a number of smaller payroll teams had begun to intro-
duce analytics into their strategies. This was becoming
an MLB change, not just something done in Oakland.
While informative, it is impossible to know how much
to translate this change into a true effect of Oakland’s
use of analytics in its scouting. For that, you must exam-
ine individual team statistics.
Plotting payrollTo examine the extent of the OBP effect, we constructed
additional data visualizations. Each successive figure
adds information from other variables and helps fur-
ther explain Moneyball. The plots in Online Figures 1-4
(which can be found on this article’s webpage at www.
qualityprogress.com) show greater degrees of informa-
tion:
• OnlineFigure1isasimplescatterplotofannualpay-
roll by games won for each team over the season.
• OnlineFigure2addsdifferentcolorstotheplot:pre-
Moneyball era teams are in red, and post-Moneyball
era teams are in green. Teams at the time of Oakland’s
introduction of analytics-driven scouting are in blue.
• OnlineFigure3addsshapestoindicateOakland’sval-
ues as circles.
• OnlineFigure4showsthechangingsizeofthemark-
ers to show the values of OBP for each team for each
season.
Online Figure 4 also shows the blue circles (the A’s
during their introduction of analytic scouting tech-
niques) in the upper-left corner of plot, indicating a high-
er number of games won than many other teams during
the A’s initial years of analytic scouting with a lower pay-
roll than many teams.
Note the separation by pre-Moneyball era, post-Mon-
eyball era and the actual Moneyball era shows teams’
payrolls are widely diverse, with some team payrolls in
the pre-Moneyball era higher than team payrolls in the
post-Moneyball era. With the addition of the unique iden-
tifier for Oakland, you can see the team payroll has been
on the low end, but was by no means the lowest.7 With
Online Figure 4, you can ultimately understand Oak-
land’s position compared with all MLB teams and how
it was uniquely successful during the Moneyball years.
These illustrations tell us that Oakland’s 95 wins for
each year in 2000-2003 made them highly competitive.
What they don’t reveal, however, is whether the team
actually succeeded in gaining a postseason berth and
advanced to (or even won) the World Series. One more
dimension can be added to the figures to make this clear.
Adding more dimensions We also can look at the OBP and other team statistics
over time to see a difference in terms of performance be-
tween teams that reach the postseason and other teams.
statistics
Year
Correlation between
payroll and games won
Correlation between
payroll and oBP
1998 0.658 0.659 Pre-Moneyball1999 0.564 0.4972000 0.331 0.045 Moneyball in Oakland2001 0.321 0.1232002 0.442 −0.0482003 0.419 −0.2292004 0.526 0.463 All teams using Moneyball analytics2005 0.491 0.5042006 0.536 0.4912007 0.491 0.5482008 0.327 0.4102009 0.476 0.4292010 0.366 0.3742011 0.372 0.469
OBP = on-base percentage
Payroll, games won and OBP correlation / TABlE 1

QP • www.qualityprogress.com40
Online Figure 5 shows a peak in OBP leading up to the
Moneyball years—perhaps giving the A’s the idea to
maximize this statistic—but this peak was not seen in
the years that followed. However, if the team had ex-
amined other key statistics, such as earned run aver-
age (ERA), it would have seen a similar increase. Note
the ERA for playoff teams post 2000 (shown in Online
Figure 6) shows much greater consistency (smaller
box plot) than nonplayoff teams.
While adding too much information could confuse
the figures, the ability to use three axes, color and size
can actually add more clarity. Moving the OBP variable
from the size dimension to the third axis of the plot,
then using the size dimension to indicate a team’s pres-
ence in the postseason or in the World Series, you can
see how Oakland fared during its initial use of analytic
scouting and whether it was a successful management
implementation.
Figures 2 and 3 give this information in a clear pat-
tern. Figure 2 shows the initial four years of Oakland’s
analytic scouting paid off because the A’s were in the
playoffs each year (blue circles). Unfortunately, as
shown in Figure 3, this did not translate into a World
Series berth in any of these years, and the 95 wins per
year was not sustainable after many MLB clubs started
using analytical scouting techniques.
More than oBPFigures and correlation show the A’s succeeded in
optimizing OBP with a relatively small payroll, which
translated into many more wins initially than would
have been expected for its payroll level using tradi-
tional scouting techniques.
While the A’s did make the postseason during all
four years of the Moneyball era, it never won the
World Series. Moneyball made the A’s successful and
a contender, but this top-ranked team could not over-
come traditionally stacked teams that could sign high-
salary players more proficient in pitching and defense.
It appears that optimizing one scouting statistic—
the OBP offensive statistic—was not enough to win or
even reach the World Series. And Oakland’s apparent
edge quickly diminished after Moneyball techniques
became widespread post 2004. As all MLB teams add-
ed analytics and players responded to the new rank-
ing metrics, the correlation between payroll and OBP
returned almost to the levels it had been before 2000
(Figure 1).
Gam
es w
on
3-D scatter plot
Team payroll (in millions)
OBP
100
80
60
0.360.34
0.320.3
$50 $100 $150 $200
Marking: Marker by (row number)Color by Moneyball group
Pre-Moneyball-era teamsMoneyball-era teamsPost-Moneyball-era teams
Shape by Oakland dummy 0 1
Size by playoffs ≥ 1 ≤ 0
OBP = on-base percentage
Analytics’ impact on games won / FIguRE 2
Gam
es w
on
3-D scatter plot
Team payroll (in millions)OBP = on-base percentage
OBP
100
80
60
0.360.34
0.320.3
$50 $100 $150 $200
Marking: Marker by (row number)Color by Moneyball group
Pre-Moneyball-era teamsMoneyball-era teamsPost-Moneyball-era teams
Shape by Oakland dummy 0 1
Size by World Series ≥ 1 ≤ 0
Analytics’ impact on World Series appearances / FIguRE 3

April 2012 • QP 41
Using successive visualizations of the data gave a
clearer picture of the initial outcomes and lack of ongo-
ing effect of Oakland’s use of OBP to become a top-tier
competing team with a middle to low-tier payroll.8
Would additional analytics have helped Oakland con-
tinue to be competitive or reach the World Series? Or
is having a higher payroll the only way to succeed long
term? An answer can be provided by fitting models to
predict the payroll necessary to win in the postseason,
looking at the minimum required statistics for pitching
and defense, and examining other important offensive
statistics.
statistical analyses of MoneyballTo examine which statistics were most important to
reach postseason play, we calculated and tested the dif-
ferences between playoff teams and nonplayoff teams
from 1998-2011, and looked at Oakland’s statistics dur-
ing that time. Table 2 summarizes batting, pitching and
defensive statistics that are significantly different among
playoff teams and nonplayoff teams, and also includes
Oakland’s statistics in those categories.
Oakland’s statistics resemble the mean and median
values of each group. During its playoff years, its OBP
was much higher than the other playoff teams (indicat-
ing Beane’s preferred choice of statistic to maximize),
but this statistic remained no different from other non-
playoff teams before and after the Moneyball era. From
this analysis, you can infer that when teams with higher
payrolls started looking at players with high OBP, the A’s
were likely priced out of the market for these previously
underrated players who were once considered hidden
gems the A’s could sign.
Another analysis for examining how important other
statistics are in determining postseason and World Series
play is to fit a logistic model predicting these outcomes.
Table 2’s statistics were used in a model to predict each
of these outcomes. For postseason play, Table 3 (p. 42)
shows OBP has the largest odds ratio, although payroll,
team walks (bases on balls or BB), starting pitchers’
ERA and closers’ saves, and team fielding percentages
are also highly significant predictors of teams that will
advance to the playoffs.
However, when World Series play (two teams each
year) is the model’s dependent variable, the only signifi-
cant predictor is the starting pitchers’ ERA (Table 4, p.
42). This appears to indicate a good offense can get a
team into the playoffs, but it needs excellent pitching
to move to the World Series. Maximizing OBP was not
enough to get the A’s beyond the playoffs.
Finally, a linear regression model can indicate how
much each statistic is worth and the incremental payroll
statistics
All MLB teamsGames won
Home runs rBI
Batting average oBP
strike-outs
Bases on balls
stolen bases erA saves errors
Fielding percentage
Not in playoffs Mean 76 167 713 0.263 0.330 1,079 530 95 4.51 39 107 98.22%
Median 76 164 708 0.263 0.330 1,076 527 91 4.50 39 106 98.30%
oakland A’s only
Not in playoffs Mean 80 151 698 0.257 0.332 1,071 580 88 4.13 38 104 98.24%
Median 76 135 711 0.259 0.330 1,080 537 88 4.17 38 99 98.40%
In the playoffs Mean 95 184 771 0.269 0.342 1,055 575 103 4.03 46 97 98.38%
Median 95 179 771 0.269 0.341 1,049 574 100 4.01 46 98 98.40%
oakland A’s only
In the playoffs Mean 97 207 809 0.270 0.348 1,046 625 104 3.94 47 110 98.22%
Median 96 205 833 0.271 0.354 1,035 640 99 3.68 48 107 98.30%
p-value comparing MlB teams in the playoffs and not in the playoffs
0 0 0 0 0 0.045 0 0.018 0 0 0 0
OBP = on-base percentage ERA = earned run averageMlB = Major league Baseball
Playoff teams, nonplayoff teams and the Oakland A’s / TABlE 2

amount needed to boost a team into the playoffs. The base-
ball statistics that were found to be significant (reported in
Table 2), as well as the dummy variables of playoff and
World Series berths, were used as predictors of the team
payroll. Table 5 shows the results of this analysis.
Most interesting is the playoffs coefficient, which in-
dicates reaching the postseason requires an additional
$11.8 million above the mean payroll. Strikeouts are the
most significant variable in the model, again emphasizing
the importance of good pitching.
Although Oakland did make it to the playoffs during
its Moneyball years, its maximization of OBP was not a
significant predictor—positively or negatively—of post-
season success or payroll. Rather, two pitching statis-
tics—ERA and strikeouts by pitching staff—appeared
important.
Figures 4 and 5 focus on these two statistics, compar-
ing teams that made the playoffs with those that didn’t,
along with highlighting the A’s values. Although not al-
ways significant, there is a large gap in the average values
of the playoff-bound teams and those that don’t make it
that far.
Although Oakland did not as actively pursue pitchers
during the Moneyball era, the team’s ERA was among
the lowest in the league, in large part because of start-
ing pitchers it drafted and developed: Barry Zito, Tim
Hudson and Mark Mulder. Although not as good as some
other teams, Oakland still had contender-level values of
strikeouts by its pitchers, especially during Moneyball
years. Nevertheless, these statistics were not enough for
Oakland to ever move on to the World Series during these
years.
Leveling the fieldDid the Moneyball approach work? Oakland was never
able to bring home the MLB Commissioner’s Trophy—
the ultimate measure of success in baseball—during its
inaugural Moneyball years. During that time, however,
Oakland made it to the playoffs, greatly increased its fan
popularity and improved its reputation. The team was
able to be as or more successful than most other teams
with payrolls up to three times larger.
After examining team performances from 1998-2011,
it’s clear the team used analytics as an innovative way
to level the payroll playing field. As recently as October
2011, Oakland’s strategy has been called “challenging the
status quo” and “a lesson that implores us to not settle
with tradition.”9
But Oakland’s success did not last, as Beane’s secret
weapon became well known and other teams began to
copy its methods. The widespread acceptance and use
of sabermetrics in scouting now shows that other teams
realize there is value in tracking individual and team sta-
tistics.
Longer term, the models indicate that focusing exclu-
sively on one statistic or area of the game (offense ver-
QP • www.qualityprogress.com42
dependent variable = playoffs or not
Bstandard
error p-value odds ratio
Payroll 0 0 0.039 1.00
On-base percentage 140.01 40.83 0.001 6.41867E + 60
Bases on balls −0.01 0.01 0.106 0.992
Earned run average −3.12 0.52 0 0.044
Saves 0.11 0.03 0 1.114
Fielding percentage −28.87 9.14 0.002 0
Pseudo r-square = 0.707
dependent variable = world series or not
Bstandard
error p-value odds ratio
Earned run average −2.22 0.62 0 0.109
Saves 0.06 0.03 0.077 1.063
Pseudo r-square = 0.846
Unstandardizedstandardized coefficients
p-valueB standard error Beta
Playoffs 11824359.68 4315127.58 0.079 0.006
Strikeouts −45966.77 16944.88 −0.619 0.007
Strikeouts by pitching
73602.15 17199.31 0.991 0
Errors −250791.45 94879.04 −0.331 0.009
Payroll = dependent variable
r-square = 0.853
Logistic model to predict playoff teams / TABlE 3
Logistic model to predict World Series teams / TABlE 4
Linear regression to predict payroll / TABlE 5

April 2012 • QP
statistics
sus defense or pitching) will not lead a team to a World
Series win and will not provide a sustainable path to the
postseason. All playoff teams have shown the ability to
win games and have nearly equal offensive statistics. The
models show offense can lead the team to the playoffs,
but pitching will provide the edge in the World Series.
If Oakland did not have the payroll to invest in peak
performance players, it might have stayed competitive if
it continued to innovate by using its analytic expertise
to find more hidden gems in the areas of pitching and
defense. While the advantage of Moneyball did eventu-
ally fade for the A’s, its success and universal adoption
showed that analytical-based methods greatly changed
and—some would argue—improved the game.
Lessons for the business worldSome universal lessons from Moneyball apply not only
to business and hiring, but also general project strat-
egies. Beane focused on a simple analytical measure
that was a good indicator of overall success, not just
from game to game or day to day. The OBP statistic is
relatively easy to compute and understand, but it also
accounts for different aspects of how players succeed
at the plate.
Additionally, Beane was willing to risk going against
traditional methods to implement his plan. It is impor-
tant, however, not to optimize a novel statistic such as
OBP at the expense of tried-and-true measures of suc-
cess.
Finally, it is important to know your competitors can
and will use your methods against you. QP
REFERENCES AND NOTES1. Michael Lewis, Moneyball: The Art of Winning an Unfair Game, W.W. Norton &
co., 2003.2. sabermetrics is the specialized analysis of baseball through objective and
empirical evidence, specifically baseball statistics that measure in-game activity. the term is derived from the acronym saBR, which stands for the society for american Baseball Research.
3. coeli carr, “7 ‘Moneyball’ Hiring tips,” Forbes, sept. 23, 2011, www.forbes.com/sites/coelicarr/2011/09/23/data-mining-7-tips-on-hiring-the-moneyball-way.
4. James Heskett, “How Will the ‘Moneyball Generation’ influence Manage-ment?” Working Knowledge, Harvard Business school, Oct. 6, 2011, http://hbswk.hbs.edu/item/6787.html.
5. tim Harvey, “Five important Neuromarketing Lessons From ‘Moneyball,’” Neu-romarketing, Dec. 6, 2011, www.neurosciencemarketing.com/blog/articles/moneyball.htm.
6. catalpha advertising & Design, “the Moneyball strategy: can it Work For Your company?” Oct. 14, 2011, www.catalpha.com/blog/the-moneyball-strategy-can-it-work-for-your-company.
7. complete payroll information can be found at www.stevetheump.com/payrolls.htm.
8. all original figures were generated using tibco/spotfire software. Find more information at http://spotfire.tibco.com/products/overview/analytics- products.aspx.
9. catalpha advertising & Design, “the Moneyball strategy: can it Work For Your company?” see reference 6.
1998 1999 2000 2001 2002 2003 2004 2005 2006 2007 2008 2009 2010 2011
Non-playoff teamsPlayoff teamsOakland A’s
6
5
5
4
3
4Team
ear
ned
ru
n a
vera
ge (
ERA
)
1998 1999 2000 2001 2002 2003 2004 2005 2006 2007 2008 2009 2010 2011
Non-playoff teamsPlayoff teamsOakland A’s
1300
1250
1200
1150
1100
1050
1000
950
850
900
Str
ikeo
uts
by
pit
chin
g
Average and standard deviation of team ERA / FIguRE 4
Average and standard deviation of strikeouts by pitchers / FIguRE 5
43
I. ELAINE ALLEN is research director of the Arthur M. Blank Center for Entrepreneurship, director of the Babson Survey Research Group, and professor of statistics and entrepreneur-ship at Babson College in Wellesley, MA. She earned a doctorate in statistics from Cornell University in Ithaca, NY. Allen is a member of ASQ. She also provides statistical consulting to the Los Angeles Dodgers and has done similar consulting for the Toronto Blue Jays.
JULIA E. SEAMAN is a doctoral student in pharmacogenomics at the University of California-San Francisco, and a statistical consultant for the Babson Survey Research Group at Babson College. She earned a bachelor’s degree in chemistry and math-ematics from Pomona College in Claremont, CA. Along with Allen, Seaman provides statistical consulting to the Dodgers.

QP • www.qualityprogress.com44
3.4 Per Million BY Joseph D. Conklin
next in lineAlways look ahead to the next project for maximum quality gains
In qualIty, the sequel is what usually
makes things better. Who knows how
often savings have been left on the table
because organizations failed to look
ahead to the next project?
My friend Sam knows firsthand the
value of lining up the next quality project
before the first one is over. Just ask him
about his job as a quality facilitator at
Stream Shelter Research. One of his proj-
ects involved improving the visitor-request
process.
“Why do you need a process for that? I
just walk in or out the door, and that’s it,”
I said. It turned out not to be that simple.
Visiting the issueStream Shelter performs contract R&D
for companies in its industry, a market
subjected to government regulation. It
takes ideas that pass proof of concept
and helps determine the next step to
full-scale production. The pace is fast, the
business environment changes rapidly,
and the array of customers is diverse.
Researchers, suppliers, potential
customers and government auditors
are always showing up to look things
over, and that means contact with highly
proprietary products and operations. Sam
convinced me a process was required. He
even showed me the request form (Figure
1) and flowchart (Online Figure 1, which
can be found on this column’s webpage at
www.qualityprogress.com).
A string of lost sales and canceled
orders convinced management some-
thing needed fixing. In finding out why,
one issue repeatedly mentioned was the
cumbersome process
for arranging visits. If it
takes too long, custom-
ers lose interest, and
audit deadlines for
government regulators
might be jeopardized.
Errors in registration
may cause authorized
visitors to be turned
away at the gate. If visi-
tors are also custom-
ers, they rarely return.
Media visitors, too,
might not feel encour-
aged to offer Stream
Shelter good press.
Management asked
for the quality department’s help in
improving the process, and Sam drew the
assignment. He dug through the secu-
rity department’s records for the last 12
months and estimated two important vari-
ables: the length of time to approve a visit
and the percentage of visitor registrations
performed in error.
When management saw the charts in
Figures 2 and 3 for the first time, it was
shocked and incited to take action.
Sam led the first improvement team,
which flowcharted the visitor-request
process, brainstormed possible causes of
error, and developed the cause and effect
diagram in Figure 4 (p. 46). The combina-
tion of the brainstorming and the cause
and effect diagram led to the check sheet
in Online Figure 2. The team wanted
to know which of the possible causes
were the actual ones. Thanks to the data
revealed by the check sheets over several
weeks, the team prepared the Pareto
chart shown in Figure 5 (p. 46).
Turning things around?When the team and Stream Shelter man-
agement saw the Pareto chart, the top
three causes showed low-hanging fruit:
1. “Pass not delivered” was traced to
errors by the post office in reading
handwritten addresses on the enve-
lopes containing the passes. Security
Savings are often left on the table because you fail to look at lining up the next quality project.

April 2012 • QP 45
switched to computer-generated mail-
ing labels to reduce this problem.
2. Warped badge stock was traced to ma-
terial deteriorating after being held too
long in storage. Management purged
the old stock and bought replacement
material under a new policy of discard-
ing material if it was not used by a
certain date.
3. Outdated badge readers were ad-
dressed by purchasing new ones and
maintaining them more diligently.
The team continued to meet monthly
to monitor progress. During the next 12
months, lead time and error percentages
were gradually reduced to about two-
thirds of their initial levels, as shown in
Figures 6 and 7 (p. 47).
During these 12 months, Sam advocat-
ed to move past the low-hanging fruit and
concentrate on material and equipment.
The Pareto chart suggested the possibil-
ity of additional gains in the people and
methods aspects. Sam warned that the
less-tangible parts of the process might
interact in such a way to limit the overall
gains from the new material and equip-
ment.
Attacking the less-tangible parts
required a more holistic, integrated view
of the visitor-request process. At the time,
the process lacked an owner. Its parts
were scattered across multiple functional
groups at Stream Shelter. Under pres-
sure from other urgent business matters,
management concluded the tangible im-
provements were enough and eventually
disbanded the team after it completed
one year of monthly monitoring.
Not surprisingly, the performance pla-
teaued in the next six months, as shown
in Online Figures 3 and 4.
Please try againThe new status quo might have been
sustained longer but for a combination of
events that stimulated a second improve-
ment effort. Even with the equipment
improvements, enough disgruntled visi-
tor stories made it back to the corporate
office that management decided to
compare Stream Shelter with its sister
plants. Stream Shelter’s times remained
the longest—twice as long on average
average visitor processing time in days / figure 2
average registration error percentage / figure 3
3
4
5
6
7
8
9
10
11
12
121110987654321Months before first implementation
Day
s
10.71
11.73
10.53
11.24
10.88
11.30
10.92
11.3510.99
10.02
11.80
10.35
5%
6%
7%
8%
9%
10%
11%
12%
13%
14%
15%
16%
121110987654321Months before first implementation
Erro
r p
erce
nta
ge
14.3%
14.1% 14.4%
15.1%
14.0%
14.1%14.3%
15.4%14.9%
14.5%
15.0%
14.5%
Requestor Type of visitor
Supervisor Sister plant
Visitor name Customer
Visitor organization/contact Auditor
Media
interviewee
Security check Y / n Consultant
Pass issued Y / n government
Pass returned Y / n
Departure sign off Pass number
reason for visit
Visitor request form / figure 1

compared to its sister facilities.
Meanwhile, Stream Shelter began
preparations to achieve ISO 9001:2008
certification to meet government regula-
tions and customer expectations. Because
the goals of certification entailed removing
self-contained functional silos as much as
possible, the scattered responsibility for
the visitor-request process across multiple
departments felt at odds with the new
effort.
When an untrained new hire failed to
follow up on one important request, a
major potential client was turned away at
the gate because security personnel could
not find approval for his visit. The result-
ing loss of a $50,000 contract immediately
focused management’s attention.
Things grew really exciting when
security rejected the request for the ISO
9001:2008 accreditation people the day
before they were scheduled to arrive. The
supervisor who signed the form no longer
worked in Sam’s quality assurance group.
A new request was expedited with notice-
able encouragement and attention from
Stream Shelter’s top management.
The shortcomings of the visitor-re-
quest process caught the attention of the
accreditation people who independently
seconded one of Sam’s standing sugges-
tions: Start a second cross-functional
team that included more operations
employees, in addition to those from the
supervisory and technical ranks.
Enhancements executedWith the benefit of increased management
attention, the team received additional
training in lean Six Sigma improvement
techniques and benchmarking against
sister facilities, and was able to as-
sess several enhancements that, when
implemented, encouraged a more cross-
functional perspective. Ideally, the visitor-
request process needed a single owner.
Senior management identified a few
potential candidates within the company.
In all cases, a month or two was needed
to transition responsibilities to free up
the new process owner for the job.
Until an owner could be established,
Stream Shelter management approved
the second team’s recommendations,
changed some of the team members
and asked it to take charge of the initial
implementation. The most important
enhancements were:
1. Assigning specific individuals as
hand-off points among the requesting
organizations, personnel and security
to ensure a request reached the next
stage of processing.
2. Making visitor-request process train-
ing a mandatory completion item in
new hires’ orientation. This ensured
new employees did not receive their
entrance badges until training was
completed.
3. Clarifying the approval procedure so
security could accept the name of the
supervisor who was in place on the
Visitor process problems cause and effect diagram / figure 4
Warped pass material
Torn/illegible approval form
Torn/illegible/wrong pass
Form incomplete/filled out wrong
Untrained/poorly trained supervisor
Untrained/poorly trained security
Untrained/poorly trained requestor
Unmailed/late/undelivered pass
No follow up by requestor
Obsolete approval lists
Obsolete list of valid ID forms
Obsolete approval procedure
Worn/uncalibrated pass reader
Material Method Measurement
Visitorprocessproblems
EquipmentEnvironmentPeople
No fo
rm fo
r
visito
r rec
eived
Supe
rviso
r not
in
com
pany
dat
abas
e
Supe
rviso
r nam
e not
on ap
prov
al lis
t
Visito
r pre
sent
s no/
unac
cept
able
ID
Reque
stor n
ot in
com
pany
dat
abas
e
Pass
not
ed
Illegib
le fo
rm
Incom
plete
form
Name o
n pa
ss
disag
rees
with
visit
or
Wro
ng fo
rm ve
rsion
use
d
No/wro
ng su
perv
isor
nam
e on
appr
oval
Reade
r una
ble to
read
/log p
ass
War
ped
pass
mat
erial
–
can’
t mak
e pas
s
Pass
not
deli
vere
d0
10
20
30
40
50
60
70
80
Freq
uen
cy
Reason
75
6964
3935
3228
12 11 9 7 5 4 2
Pareto chart of visitor problems / figure 5
QP • www.qualityprogress.com46
3.4 Per Million

average visitor processing time in days / figure 6
average registration error percentage / figure 7
3
4
5
6
7
8
9
10
11
12
121110987654321Months after first implementation
Day
s
11.0310.92
10.07
9.6410.09
10.56
9.86
8.87
9.42 9.30
7.72
8.42
5%
6%
7%
8%
9%
10%
11%
12%
13%
14%
15%
16%
121110987654321Months after first implementation
Erro
r p
erce
nta
ge
15.4%
14.3%
14.2%14.6%
15.7%15.1%
13.9%13.6%
12.4%11.8%
10.9%
11.0%
average registration error percentage / figure 9
5%
6%
7%
8%
9%
10%
11%
12%
13%
14%
15%
16%
302928272625242322212019Months after first implementation
Erro
r p
erce
nta
ge
13.5%
14.2%
13.3%
13.4%
11.8%
10.4%
9.5%9.9%
10.1%
8.5%
6.6%5.6%
date the approval form was signed.
4. Removing the visitor approval list
from the set of items requiring senior
management sign-off for all changes.
This had proved to be a barrier in dis-
seminating the current list to all who
needed it. Instead, senior management
added administration of the approval
list to the annual plant audit so the
responsible employees could demon-
strate they were handling it right.
5. Rotating personnel between the two
key departments—personnel and secu-
rity—so both areas developed a cadre
with more comprehensive knowledge
of how to check the pertinent details
of a pending visitor request.
Figures 8 and 9 show the progress
in the 12 months after the second team
started implementing its recommenda-
tions. By the end of one year, Stream
Shelter’s visitor-request process perfor-
mance aligned with its sister plants. At
this point, Sam and all of Stream Shelter
were proud and relieved at what had been
accomplished. They were poised and
prepared to make the visitor requisition
process even better. QP
eDItOR’S nOteThe column is based on a true story involving a real organi-zation. names and data have been changed to maintain the organization’s confidentiality.
April 2012 • QP 47
JOSEPH D. CONKLIN is a mathematical statistician in Washington, D.C. He earned a master’s degree in statistics from Virginia Tech in Blacksburg and is a senior member of ASQ. Conklin is an ASQ-certified manager, engineer, auditor, reliability engineer and Six Sigma Black Belt.
average visitor processing time in days / figure 8
3
4
5
6
7
8
9
10
11
12
Months after first implementation
Day
s 7.73
6.90
5.76
6.99
5.856.39
7.79
6.82
5.73
5.084.74
3.54
302928272625242322212019

QP • www.qualityprogress.com48
Quality Assurance at HomeDo you have the lime to make your guacamole?
QuAlity in tHe First Person BY LuLa Moon
Recurring grocery list / tAble 1
Earth Fare grocery store and local farmers’ market:
Fruit: Apples, oranges, bananas, pineapples, cherries, watermelon, cantaloupe
berries: blueberries, raspberries
limes, lemons
Avocados
Mushrooms
Ginger
Coconut
Dark green lacinato (dinosaur) kale, chard, spinach, mustard greensCilantro, basil, rosemary, parsley, chives, cumin powdersweet red peppers, broccoli, carrots, okra, peas
tomatoes, sun-dried tomatoes
onions, garlic, jalapenos
sweet potatoes, yukon gold potatoes
seeds for sprouts
Peanut butter, almond butter
Hummus, olives
Kidney beans, black beans
Miso, seaweed
raw nuts
Quinoa
Granola
Almond milk
eggs
rbGH-free cheese, yogurt, cream
Honey
Herbal teas
Chicken
salmon
Walmart:
Coconut oil
toilet paper
epsom salt (or at Dollar tree)
Whole Foods:Citrasolv valencia orange dish soap
Fragrance-free laundry soap
Celtic sea salt
Figs, pears (in season)
Pet Supplies Plus:Cat food—grain-free
Petco:Cat litter in reusable container
HAVING RIPE avocados, garlic, onion,
jalapeno and sea salt but no fresh limes
when I want to make guacamole is
like having various types of conform-
ing widgets in stock but no connecting
hardware. So to run my home efficient-
ly—and never again forget the lime—I’ve
incorporated quality assurance principles.
Quality assurance 5S principles—sort,
set in order, shine, standardize and sus-
tain—benefit my home life in the same
ways that quality assurance principles
benefit the workplace. When I sort and
remove clutter, have my favorite delivery
menus set in order and readily available,
clean and shine household areas and
equipment, make standardized lists to
ensure I have an inventory of necessities
like toilet paper, and sustain my routines,
I simultaneously simplify and shape
home life into a well-oiled machine.
When I make a list of errands to run
and constellate them geographically, I
save time and gas, like lean manufactur-
ing waste elimination (motion, transpor-
tation and waiting).
ISO 9001:2008 requires six written
procedures. My home life operates
more smoothly with written standard
operating procedures (SOP) in the
form of lists designed to eliminate the
human error of forgetfulness. Updated
and current revision status required by
section 4.2.3(b, c) ensures I benefit from
using the newest lists. To illustrate, I’ve
included four lists that may be used to
brainstorm and create your own cus-
tomized home-care SOPs.
List remindersMy recurring grocery list (Table 1)
reminds me to restock frequently used
kitchen, bathroom and pet-care items,
plus it helps me keep track of stores that
have the best price and product selec-
tion. Grouping items on my list in the
same order as the stores display them
maximizes shopping productivity like
lean manufacturing standardized work
maximizes manufacturing productivity.
For example, I love fresh coconut
and peanut butter, but before I added
them to my recurring grocery list, I
often forgot them and ended up buying
and eating less-nutritious snacks food
from the convenience store and vend-
ing machine. An unexpected additional
benefit is that the sound of me cracking
a coconut to remove the coconut flesh
in my front yard has become a neigh-
borhood socializing magnet.
My kayaking gear list (see Online
Table 1, found on this article’s webpage
at www.qualityprogress.com) guarantees
I have electrolytes to replenish my body
fluids, salt and energy while I am

April 2012 • QP 49
exposed on the river on hot sunny days.
It also ensures I have a fleece hat and
long-sleeved shirt for warmth after the
temperature suddenly plummets due to a
summer thundershower (think identifying
potential failures).
My day hiking gear list (Online Table 2)
identifies potential failures and promotes
safety. In case I end up on the trail after
dark, the list ensures I remember to bring
a flashlight, lighter, whistle, jacket and
ground cloth.
My miscellaneous reminders list (Online
Table 3) prompts me to have the gate access
code and condo key when I arrive at my va-
cation destination. It also similarly reminds
me to have the access code and key or
combination for my storage unit, and to take
my reading glasses to help me see menus
and programs during a night on the town.
Another universally helpful list includes one
for the toiletry bag and traveling items.
Quality benefitsMy family and I, as customers of and
stakeholders in our home, deserve the
satisfaction of knowing that our needs are
being remembered and met. Quality assur-
ance principles, when implemented in the
home, provide a process management tool
for home-care continuous improvement.
Advantages of this structure are focus (I
know what needs doing) and increased
productivity (I get it done). As a result, I
enjoy more quality in my personal life. QP
Quality assurance principles benefit my home life the same way they benefit the workplace.
LULA MOON earned a bachelor’s degree from Birmingham-Southern College in Alabama. An ASQ member, she is an ASQ-certified manager of quality/organizational excellence, quality engineer, technician and auditor.
QIHC is this year’s best opportunity to network with quality professionals from all � elds.
This must-attend conference will demonstrate the impact that quality can have on healthcare organizations and offer relevant and clearly measured results from improvement methodologies and processes that your organization can use.
Visit qihc.asq.org to learn more and sign up for conference updates.
2012 Quality Institute for HealthcareMay 21 – 23, 2012 • Anaheim, CA • Anaheim Convention Center
REGIST
ER
REGIST
ER
REGIST
ER
TODAY
!
TODAY
!
TODAY
!
QP • www.qualityprogress.com50
Career Corner BY HenrY J. LindBorg
Should You Blow the Whistle?The career implications of standing up for the truth
Since the advent of stakeholder manage-
ment approaches in the 1980s, for-profit
and not-for-profit organizations have sought
to link their brands not only to improved
products and service, but also to communi-
ty concern and social responsibility. After a
decade of corporate scandals and econom-
ic meltdown, an important risk affecting
brand identity and customer retention is
misconduct or negligence in areas such as
health, safety, environmental protection
and financial integrity.
Law, enterprise risk management, Bald-
rige criteria and global social responsibility
standards (ISO 26000) have attempted to
strengthen corporate ethics. Enterprise risk
management advocates that leaders create
a strong ethical work environment, and the
Baldrige criteria asks for measures of ethi-
cal leadership, corporate awareness and
monitoring systems. The Sarbanes-Oxley
Act1 and ISO 26000 call for whistle-blow-
ers—individuals who discover and expose
wrong-doing in their organizations—to be
protected from retaliation.
But life is not improving for those who
actively respond to misconduct, whether
it’s fraudulent fiscal transactions or activi-
ties, or supply chain risks threatening the
health and safety of employees and the
public. In fact, the “2011 National Business
Ethics Survey” conducted by the Ethics
Resource Center reported a sharp increase
in retaliation against whistle-blowers.2
The retaliation can be devastating for the
individual, irrevocably altering relationships
with management and co-workers. It may
include dismissal accompanied by attacks
on the whistle-blower’s character and pro-
fessional competence that result in dimin-
ished prospects for future employment.
Becoming a whistle-blower is therefore
no easy choice, even for quality profession-
als knowledgeable of organizational behav-
ior and accustomed to audit processes with
clear guidelines for nonconformance and
corrective action. The decision may, in fact,
represent a career crisis with profound
personal and professional consequences.
With other channels exhausted, do you re-
port what you know to those outside your
organization who could help?
To better understand the significance
of whistle-blowing for individuals and
organizations committed to ethical prac-
tices, I consulted Tom Devine, co-author of
The Corporate Whistle-blower’s Survival
Guide: A Handbook for Committing the
Truth,3 the most comprehensive compen-
dium of advice and resources on the topic.
Over the past 33 years, in his work as
legal director of the Government Account-
ability Project, a Washington D.C.-based
nonprofit organization with the mission to
provide protection and advocacy for whis-
tle-blowers,4 Devine has assisted more than
5,000 “persons of conscience”—among
them quality professionals—in making
risky and sometimes life-altering decisions
to tell the truth. Though the project began
with government, it now extends to busi-
nesses of all types.
He wrote the guide because he wanted
to make a difference, share lessons learned
in his practice and overcome the limita-
tions of working case-by-case.
What makes a whistle-blower?
“Truth itself is a motivation,” Devine said.
Whistle-blowers feel compelled to speak
in spite of risking alienation by co-workers
and entering an unequal contest with an
organization.
“It’s David and Goliath, with truth in the
slingshot,” he said. Of course, motives go
beyond pure noble purpose and include
strong emotions, including, at times, resent-
ment.
Where should potential whistle-
blowers begin? Think in terms of quality
process, Devine advised. First, the potential
whistle-blowers need to talk it out and
understand the potential consequences of

April 2012 • QP 51
their actions. The individual needs their
eyes open to the risks they are taking, and
needs to discuss their plans with family
members who may be affected.
Their case and their resolve must be
tested before action is taken. This shouldn’t
be an instance of knee-jerk actions clouded
by emotion. They should seek support,
which may include professional organiza-
tions. Whistle-blowers are damaged, and
sometimes dispirited, by isolation. “Regard-
less of evidence or legal backing, it’s not
enough simply to be right,” Devine said.
How can quality professionals
support the important role of whistle-
blowers in corporate ethics? Qual-
ity professionals are natural allies with
knowledge of social responsibility and
quality standards. They should assist in
promoting the view that employees are
problem-solvers rather than dissidents and
resources rather than threats. According to
Devine, the role of whistle-blower should
move from “traitor to the eyes and ears of
[an organization] that wants to prevent the
consequences of a mistake.”
How about leadership? How lead-
ers embrace whistle-blowers depends on
organizational maturity. Mature organiza-
tions value the flow of information and
transparency. Though leaders are human
and may react defensively, some good
advice is that it’s bad business to kill the
messenger. Leaders should recognize that
it’s a high-risk gamble to suppress the truth.
As Devine put it, “Whistle-blowing may be a
bitter pill, but it’s good medicine.”
Why support whistle-blowers?
“Ultimately, it’s about the duty of citizens
to support whistle-blowers. “It’s not to slay
dragons or prevail in conflicts,” Devine
said. “Rather, it’s no more and no less than
making a difference for the better.” QP
ReFeRenceS AnD nOte1. The Sarbanes-oxley Act is a United States federal law that
set new or enhanced standards for all U.S. public company boards, management and public accounting firms. The bill was enacted as a reaction to a series of major corporate and accounting scandals.
2. ethics resource Center, 2011 National Business Ethics Survey, www.ethics.org/nbes/index.php.
3. Tom devine and Tarek Maassarani, The Corporate Whistle-blower’s Survival Guide: A Handbook for Committing the Truth, Berrett-Koehler, 2011.
4. For more information on the government Accountability Project, visit www.whistleblower.org.
HENRY J. LINDBORG is executive director and CEO of the National Insti-tute for Quality Improvement in Fond du Lac, WI, which provides consulting in strategic planning, organizational development and assessment. He holds a doctorate from the University of Wisconsin-Madison and teaches
in a leadership and quality graduate program. Lindborg is past chair of ASQ’s Education Division and of the Education and Training Board. He also chairs the IEEE-USA’s Career Workforce Policy Committee.
The premier quality training conference is coming to Anaheim, CA, May 21 – 23, 2012. Join more than 2,000 quality professionals for three days � lled with more than 100 sessions.
Visit wcqi.asq.org for up-to-date conference information.
Save the DateASQ’s 66th Annual World Conference on Quality and Improvement Quality and Improvement
R E S U LT S
2012 ASQ WORLD CONFERENCE ON QUALITY AND IMPROVEMENT
Solutions for Today’s Challenging World
R E S U LT SR E S U LT SR E S U LT SR E S U LT SR E S U LT SR E S U LT SR E S U LT SR E S U LT SR E S U LT SR E S U LT SProducing

StatiSticS Roundtable BY Connie M. Borror
on overlappingWhen are there really differences in overlapping confidence intervals?
52 QP • www.qualityprogress.com
while teaching a workshop for a
small manufacturing firm, two of the par-
ticipants approached me to discuss what
seemed to be a simple problem they had
encountered at work. Recently, manage-
ment noticed a decrease in the number
of products coming off the two assembly
lines in their manufacturing plant.
Specific steps in the product’s assembly
were done by hand. The company was inter-
ested in determining whether the perceived
decrease in production was real. Several
studies had been planned. However, man-
agement first wanted to determine whether
there was a significant difference between
the two assembly lines with respect to aver-
age time to complete the task.
Management randomly selected 20 people
from assembly line one (AL1) and 20 people
from assembly line 2 (AL2) to participate in a
designed study in which workers completed
a particular task. The time to complete the
task was recorded in seconds.
Together, the employees carried out the
experiment using all the usual recom-
mendations, such as randomization and
controlling factors that were not of inter-
est in the study. Having some understand-
ing of statistics, the participants realized
the groups of interest were independent
and wanted to test the hypothesis that
mean1 = mean
2 or mean
1 - mean
2 = 0, in
which mean1 was the true average time to
complete the task for all AL1 workers, and
mean2 was the true average time to com-
plete the task for all AL2 workers.
They really wanted to know whether
there was a significant difference in the av-
erage time to complete the task by the two
groups (that is, mean1 ≠ mean
2 or mean
1 –
mean2 ≠ 0). The experiment was carried out,
and results were collected. Table 1 shows
the summary statis-
tics. They decided to
analyze the results
separately but agreed
to use confidence
intervals with a 95%
level of confidence to
reach their conclu-
sions.
They came to me
with their results and
the problem: Using
95% confidence intervals and the same
data, they reached two different conclu-
sions. One reported there was no differ-
ence between the two groups, while the
second reported there was a difference.
After looking at both sets of results,
it was obvious they carried out their
individual analyses carefully and without
error. So what went wrong? How could
two different conclusions be reached using
the same information?
Digging deeperFirst, let’s examine what they did in more
detail. Both employees assumed time to
complete a task for the assembly lines to
be normally distributed, and they did not
assume anything about the population
variances (what they were or whether they
were equal). In addition, both employees
constructed 95% two-sided confidence in-
tervals on the individual population means,
mean1 and mean
2:
18.69 ≤ mean1 ≤ 23.17 and
15.15 ≤ mean2 ≤ 19.76.
Figure 1 shows the individual 95% confi-
dence intervals.
That’s where the similarity between the
two analyses ended. Examining the confi-
dence intervals and realizing they over-
lapped, the first employee concluded there
was no statistically significant difference
in the average time to complete the task
for the two groups. In fact, he noted that
because the confidence interval for mean2
overlapped roughly 24% of the interval on
mean1, there was even stronger evidence
supporting his conclusion.
The second employee, however, recalled
seeing a method for constructing a con-
fidence interval on the difference in two
population means and used it to obtain a
single 95% two-sided confidence interval
0.37 ≤ mean1 – mean
2 ≤ 6.59,
and concluded because 0 was not con-
tained in this interval (although it was just
barely outside), there was a statistically
significant difference between the two
groups. At this point, they were not sure
who was correct. One of them also had
performed a two-sided hypothesis test and
found a p-value = 0.030. Still, they were at
a loss. Let’s examine the two approaches
they used.
Two-interval method
The first participant used a two-interval
method—examining the two confidence
intervals on the individual means and
seeing whether they overlapped. Because
Asembly line one Assembly line two
Mean (in seconds) x̄1 = 20.93 x̄
2 = 17.46
Standard deviation (in seconds)
s1 = 4.79 s2 = 4.92
Sample size n1 = 20 n2 = 20
Standard error (SE) of the mean (in seconds)
Se1 = s
1
√n1
= 4.79
=1.1 Se2 =
s2
√n2
= 4.92
√20 =1.1
assembly line designed study results / table 1
√20
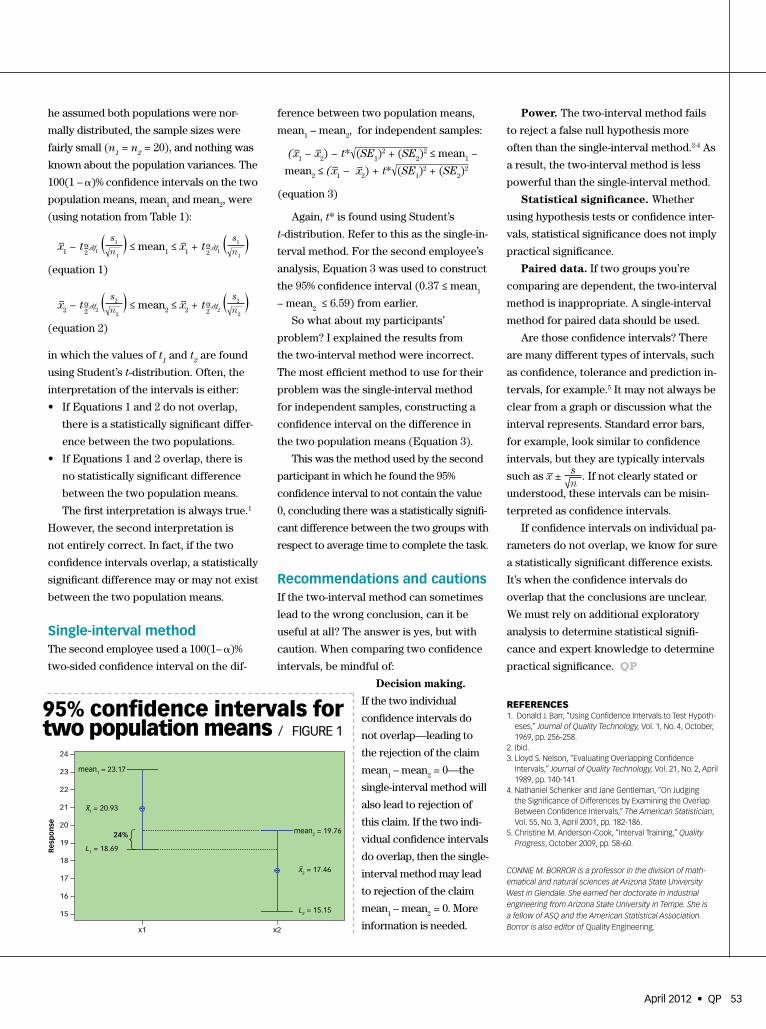
he assumed both populations were nor-
mally distributed, the sample sizes were
fairly small (n1 = n
2 = 20), and nothing was
known about the population variances. The
100(1 – α)% confidence intervals on the two
population means, mean1 and mean
2, were
(using notation from Table 1):
in which the values of t1 and t
2 are found
using Student’s t-distribution. Often, the
interpretation of the intervals is either:
• IfEquations1and2donotoverlap,
there is a statistically significant differ-
ence between the two populations.
• IfEquations1and2overlap,thereis
no statistically significant difference
between the two population means.
The first interpretation is always true.1
However, the second interpretation is
not entirely correct. In fact, if the two
confidence intervals overlap, a statistically
significant difference may or may not exist
between the two population means.
Single-interval methodThe second employee used a 100(1– α)%
two-sided confidence interval on the dif-
ference between two population means,
mean1 – mean
2, for independent samples:
Again, t* is found using Student’s
t-distribution. Refer to this as the single-in-
terval method. For the second employee’s
analysis, Equation 3 was used to construct
the 95% confidence interval (0.37 ≤ mean1
– mean2 ≤ 6.59) from earlier.
So what about my participants’
problem? I explained the results from
the two-interval method were incorrect.
The most efficient method to use for their
problem was the single-interval method
for independent samples, constructing a
confidence interval on the difference in
the two population means (Equation 3).
This was the method used by the second
participant in which he found the 95%
confidence interval to not contain the value
0, concluding there was a statistically signifi-
cant difference between the two groups with
respect to average time to complete the task.
Recommendations and cautionsIf the two-interval method can sometimes
lead to the wrong conclusion, can it be
useful at all? The answer is yes, but with
caution. When comparing two confidence
intervals, be mindful of:
Decision making.
If the two individual
confidence intervals do
not overlap—leading to
the rejection of the claim
mean1 – mean
2 = 0—the
single-interval method will
also lead to rejection of
this claim. If the two indi-
vidual confidence intervals
do overlap, then the single-
interval method may lead
to rejection of the claim
mean1 – mean
2 = 0. More
information is needed.
Power. The two-interval method fails
to reject a false null hypothesis more
often than the single-interval method.2-4 As
a result, the two-interval method is less
powerful than the single-interval method.
Statistical significance. Whether
using hypothesis tests or confidence inter-
vals, statistical significance does not imply
practical significance.
Paired data. If two groups you’re
comparing are dependent, the two-interval
method is inappropriate. A single-interval
method for paired data should be used.
Are those confidence intervals? There
are many different types of intervals, such
as confidence, tolerance and prediction in-
tervals, for example.5 It may not always be
clear from a graph or discussion what the
interval represents. Standard error bars,
for example, look similar to confidence
intervals, but they are typically intervals
such as x̄ ± s√n
. If not clearly stated or
understood, these intervals can be misin-
terpreted as confidence intervals.
If confidence intervals on individual pa-
rameters do not overlap, we know for sure
a statistically significant difference exists.
It’s when the confidence intervals do
overlap that the conclusions are unclear.
We must rely on additional exploratory
analysis to determine statistical signifi-
cance and expert knowledge to determine
practical significance. QP
ReFeRenceS1. Donald J. Barr, “Using Confidence intervals to Test Hypoth-
eses,” Journal of Quality Technology, Vol. 1, no. 4, october, 1969, pp. 256-258.
2. ibid.3. Lloyd S. nelson, “evaluating overlapping Confidence
intervals,” Journal of Quality Technology, Vol. 21, no. 2, April 1989, pp. 140-141.
4. nathaniel Schenker and Jane Gentleman, “on Judging the Significance of Differences by examining the overlap Between Confidence intervals,” The American Statistician, Vol. 55, no. 3, April 2001, pp. 182-186.
5. Christine M. Anderson-Cook, “interval Training,” Quality Progress, october 2009, pp. 58-60.
CONNIE M. BORROR is a professor in the division of math-ematical and natural sciences at Arizona State University West in Glendale. She earned her doctorate in industrial engineering from Arizona State University in Tempe. She is a fellow of ASQ and the American Statistical Association. Borror is also editor of Quality engineering.
April 2012 • QP 53
95% confidence intervals for two population means / figuRe 1
24
23
22
21
20
19
18
17
16
15
x2x1
Res
pon
se
mean1 = 23.17
x̄1 = 20.93
L1 = 18.69
mean2 = 19.76
x̄2 = 17.46
L2 = 15.15
24%
x̄1 − tα
2̄,df
1 ( s
1
√n1) ≤ mean
1 ≤ x̄
1 + tα
2̄,df
1 ( s
1
√n1)
(equation 1)
x̄2 − tα
2̄,df
2 ( s
2
√n2) ≤ mean
2 ≤ x̄
2 + tα
2̄,df
2 ( s
2
√n2)
(equation 2)
(x̄1 − x̄
2) − t* (SE
1)2 + (SE
2)2 ≤ mean
1 −
mean2 ≤ (x̄
1 − x̄
2) + t* (SE
1)2 + (SE
2)2
(equation 3)
√
√

The Lockheed Martin Engineering Management Program (EMP) in the College of Engineering and Applied Sciences (CEAS) at the University of Colorado Boulder is seeking a motivated professional to join our fast-growing program. This professorial position is for a Scholar-in-Residence (official rank) in the EMP and, for the right candidate, may be accompanied by an additional appointment as the Deming Professor of Management. The successful candidate will be capable of teaching the course sequences offered by the EMP in the Quality Sciences (EMEN 5042 and 5043) and Applied Statistics and Research Methods (EMEN 5005, 5900, 5610, and 5620). Sample syllabi for these courses can be found on the EMP website at http://emp.colorado.edu, accompanied by a complete description of this program. This position is a non-tenure track, 4-year, renewable appointment. The successful candidate will possess the following minimum qualifications: a terminal degree (Ph.D. or the equivalent) in a field of study related to the mission of the program and subject matter to be taught; substantial and meaningful experience teaching quality methods, applied research methods, and applied statistics to working engineers, researchers, and scientists either in a higher education setting, in a consulting practice, or (preferably) both arenas; a documented record of successful teaching performance; and significant experience working in business and industry as a quality manager or statistician or in a similar role. Desired qualifications also include: a record of creative or scholarly activity in the subject matter associated with this position; management experience in business and industry; experience in or working with high tech and/or service industries; experience in providing instruction in a distance education environment; experience with a graduate-level Engineering Management Program, or an MBA program.
In order to apply for this position, candidates must apply at: www.jobsatcu.com, posting #816892. Additional information related to this position can be obtained by contacting Dr. Jeffrey Luftig, Chair, Search Committee at [email protected]. The University of Colorado Boulder is an Equal Opportunity Employer.
Professor of ManagementApplied Research and Statistical Methods
The 2012 ASQ World Conference on Quality and Improvement will be held at the Anaheim Convention Center in Anaheim, CA, May 21–23. Read more about the sponsors and exhibitors in this special guide.
For more information, visit wcqi.asq.org/sponsor-exhibits/index.html.
A special thank you to all of our sponsors and exhibitors!
Special Advertising Section
YourQualitY advisorare you in a bind at work? are you looking to
clarify a term or methodology? Have you run into a
problem where nobody seems to have the answer?
do you wish you had a quality mentor? someone
you could turn to when you run into a roadblock?
You do.
QP’s experts will provide answers and insight to
your toughest quality queries. simply email your
situation, question or problem to [email protected],
and QP’s subject matter experts will offer their
sage advice in our Expert answers department.
54 QP • www.qualityprogress.com
2012 asq World conference on quality and improvementGUIde
may 21–23, 2012
anaheim, California
anaheim Convention Center
wcqi.asq.org
Proven Solutions in Today’s Challenging World
R e S u lT Sproducing

Special Advertising Section
Exhibitors as of March 9.
20|20 Integrated Solutions 417
A2LA – American Association for Laboratory Accreditation 610
Accelerated Quality Improvement 716
Actio Software Corporation 611
American Quality Institute 416
AQS Management Systems Inc. 418
ASI Datamyte Inc. 714
ASQ Media Sales 816
ASQ Social Responsibility 703
Baldrige Performance Excellence Program – NIST 515
Boise State University 208
BSI 415
California State University, Dominguez Hills 319
CEBOS Ltd. 309
Creative Healthcare USA 509
EMNS-GSQA 314
Ennov Solutions 614
EtQ Inc. 517
IAQG 318
IBS America Inc. 317
Implementation Partners LLC 618
Indianapolis Convention & Visitors Association 700
InfinityQS International 422
Intelex Technologies Inc. 615
The Juran Institute Inc. 329
Master of Business Operational Excellence – The Ohio State University 629
MasterControl Inc. 402
McGraw-Hill 311
Memory Jogger 419
Minitab Inc. 403
The National Graduate School of Quality Management 429
National Quality Assurance 723
NSF International Strategic Registration 310
Orkin Commercial Services 710
Perry Johnson Consulting Inc. 516
PQ Systems Inc. 414
Productivity Press – Taylor & Francis 619
QI Macros SPC Software for Excel 608
QiSOFT 719
Quality Council of Indiana 408, 409
Quality Institute of America 717
QualiWare Inc. 508
RealityCharting 604
SAS Institute Inc. – JMP Division 303
SGS 518
The Shingo Prize 210
Society of Manufacturing Engineers 616
Sparta Systems 602
StatPoint Technologies Inc. 529
Systems2win 315
Taylor & Francis 617
Thompson Reuters 325
uniPoint Software Inc. 514
University of Michigan College of Engineering 511
University of Scranton 316
Verify Inc. 728
VSC 724
VTR Inc. 729
ASQ SECtIonS, DIvISIonS, AnD ForuMS Booth Audit Division 334
Automotive Division 245
Aviation, Space & Defense Division 639
Biomedical Division 733
Chemical and Process Industries Division 744
Customer-Supplier Division 232
Design and Construction Division 645
Education Division 235
Electronics and Communications Division 747
Energy and Environmental Division 647
Food, Drug, and Cosmetic Division 737
Government Division 734
Booth Healthcare Division 237
Human Development and Leadership Division 139
Inspection Division 143
Lean Enterprise Division 736
Measurement Quality Division 743
Orange Empire Section 0701 745
Quality Management Division 242
Reliability Division 746
Service Quality Division 239
Six Sigma Forum 137
Software Division 635
Statistics Division 236
Team and Workplace Excellence Forum 135
55April 2012 • QP 55
Exhibitor Booth Exhibitor Booth Exhibitor Booth
ExhIBItorS
SponSorS Booth
Platinum Sponsor and Lanyard Sponsor Minitab Inc. 403
Career Fair Sponsor MEIRxRS 328
Silver Sponsor EtQ Inc. 517
Executive Roundtable Sponsor The Boeing Company
Executive Roundtable Sponsor The Coca-Cola Company
CArEEr FAIr ExhIBItorS
Booth
Goodrich Aerostructures 129
Johnson & Johnson 215
MEIRxRS 328
Zimmer 228

power your workforce through Six Sigma and Lean education
Six Sigma and Lean start with education. � e University of Michigan off ers a full suite of Six Sigma and Lean courses. Whether it’s online, in the classroom or a custom off ering, we have a delivery option to fi t the way your people work and learn.
Six Sigma Green Belt and Black Belt Certifi cations: Manufacturing Transactional Healthcare Lean-Six Sigma Design for Six Sigma
Register Online Today: InterPro.engin.umich.edu
Lean Certifi cations: Lean Manufacturing Lean Healthcare Lean Offi ce Lean Product Development Lean Supply Chain for Healthcare We off er more than 8 diff erent
Lean certifi cations
Visit us at booth 511 at the ASQ World Conference on Quality and Improvement.
56 QP • www.qualityprogress.com

A special thank you to these
SponSorS Minitab Inc. – platinum Sponsor and Lanyard Sponsor1829 Pine Hall Road State College, PA 16801 814-238-3280 www.minitab.comBooth 403 Minitab is the leading software provider for Lean Six Sigma and quality improvement. Thousands of organizations trust Minitab for tools that yield bottom-line benefits.
MEIrxrS – Career Fair Sponsor100 North Brand Boulevard, Suite 306 Glendale, CA 91203 Phone: 818-247-1368 www.medexecintl.comBooth 328MEIRxRS offers customized employment service solutions in the clinical research, regulatory affairs, quality assurance/compliance, and medical affairs functions for the pharmaceutical, medical device, biologics, diagnostics, and biotech industries.
EtQ Inc. – Silver Sponsor 399 Conklin Street, Suite 208 Farmingdale, NY 11735 Phone: 516-293-0949 www.etq.com Booth 517EtQ’s quality management software identifies, mitigates, and prevents high-risk events in the quality system. Key modules include CAR/PAR, audits, document control, risk assessment, and more.
the Boeing Company – Executive roundtable Sponsor (non-exhibiting sponsor) 499 Boeing Boulevard Huntsville, AL 35813 Phone: 256-457-2199 www.boeing.comBoeing, one of the world’s largest defense and space businesses, provides customers with best-of-industry, network-enabled systems, services, and solutions.
the Coca-Cola Company – Executive roundtable Sponsor (non-exhibiting sponsor) P.O. Drawer 1734Atlanta, GA 30301Phone: 404-676-4893www.coca-cola.comThe Coca-Cola Company is the world’s largest nonalcoholic beverage company. It strives to refresh the world, inspire moments of optimism and happiness, create value, and make a difference.
A2LA – American Association for Laboratory Accreditation5301 Buckeystown Pike, Suite 350 Frederick, MD 21704 Phone: 301-644-3248 www.a2la.orgBooth 610A2LA’s primary mission is to provide comprehensive accreditation for laboratories, inspection bodies, proficiency testing providers, reference materials producers, and product certification bodies.
AQS Management Systems Inc. 2167 Northdale Boulevard NW Minneapolis, MN 55433 Phone: 763-746-0505 www.aqsperformance.com Booth 418AQS Management Systems provides ISO training, coaching, and project assistance in support of organizational improvement and implementation of international management system standards.
Baldrige performance Excellence program – nISt 100 Bureau Drive, MS 1020 Gaithersburg, MD 20899-1020 Phone: 301-975-8946 www.nist.gov/baldrigeBooth 515The Baldrige Performance Excellence Program promotes organizational improvement and excellence through assessment, feedback, and sharing of best practices. The program manages the Malcolm Baldrige National Quality Award, the highest level of recognition that a U.S. organization can receive for performance excellence.
Ennov Solutions1233 Diablo Way San José, CA 95120 Phone: 650-619-8151 www.ennov.comBooth 614As a global software vendor, Ennov Solutions provides an integrated, flexible, Web-based solution to enhance all quality processes (document life cycle, CAPAs, audit follow-up, and training) in a multitude of industries to customers such as Michelin and Novartis, among others.
EtQ Inc.399 Conklin Street, Suite 208 Farmingdale, NY 11735 Phone: 516-293-0949 www.etq.com Booth 517EtQ’s quality management software identifies, mitigates, and prevents high-risk events in the quality system. Key modules include CAR/PAR, audits, document control, risk assessment, and more.
IBS America Inc.125 Hartwell Avenue Lexington, MA 02421 Phone: 781-862-9002 www.ibs-us.comBooth 317IBS solutions help companies achieve the full benefits of compliance and quality management, including reduced cost and risk and increased customer satisfaction, competitiveness, and profitability.
InfinityQS International14900 Conference Center Drive, Suite 525 Chantilly, VA 20151 Phone: 800-772-7978 www.infinityqs.comBooth 422InfinityQS provides quality control solutions to manufacturers worldwide. As the leading SPC software provider, InfinityQS serves companies such as Kraft Foods, the Pepsi Bottling Group, and other large manufacturers.
McGraw-hill professionalPhone: 212-904-2000 www.mhprofessional.com Booth 311
the national Graduate School of Quality Management186 Jones Road Falmouth, MA 02540 Phone: 800-838-2580 www.ngs.eduBooth 429The National Graduate School of Quality Management offers accelerated, accredited degrees in quality systems management and homeland security. Specializations include homeland security, environmental quality management, and healthcare.
StatSoft Inc.2300 East 14th StreetTulsa, OK 74104Phone: 918-749-1119www.statsoft.comStatSoft Inc. provides industry-specific enterprise solutions for integrating analytics with your company’s data repositories for process improvement, root cause analysis, and ongoing process monitoring and control.
university of Michigan2401 Plymouth Road, Suite A/B Ann Arbor, MI 48105-2193 Phone: 734-674-7200 www.interpro.engin.umich.eduBooth 511The University of Michigan offers an array of lean and Six Sigma certifications and online master degree programs. Choose from online or classroom delivery options designed to fit your specific business application.
And a special thank you to our
ExhIBItorS
57April 2012 • QP
Special Advertising Section

Coca-Cola Quality,Safety & Environment
2012PROUD MEMBERThe Global Voice of Quality™
THE COCA-COLA COMPANY IS PROUD TO PARTNER WITH ASQAt The Coca-Cola Company, our mission is to protect and sustain
our system and the communities that we serve. The Company’s Global Quality, Safety & Environment organization is committed to creating a
high-performance culture in a safe, sustainable workplace.
Monday, May 21st 2012 • 12:15 p.m. – 1:15 p.m.Anaheim Convention Center • Exhibit Hall
800 West Katella Ave.
Anaheim, CA 92802 • www.anaheimconventioncenter.com
ASQ World Conference featured speaker:
Carletta Ooton V.P., Chief Quality, Safety & Sustainable Operations Officer
The Coca-Cola Company
Boeing is proud to sponsor the 2012 World Conference on Quality and Improvement.
World Conf 1_6.875 x 4.875.indd 1 2/9/12 2:23 PM
58 QP • www.qualityprogress.com
WEBSItES20|20 Integrated Solutionswww.2020is.com.au
A2LA – American Association for Laboratory Accreditationwww.a2la.org
Accelerated Quality Improvementwww.aqionline.com
Actio Software Corporationwww.actiio.net
American Quality Institutewww.iso9000conference.com
AQS Management Systems Inc.www.aqsperformance.com
ASI Datamyte Inc.www.asidatamyte.com
ASQ Media Sales/Naylorasq.org/ads/index.html
ASQ Social Responsibilitythesro.org
Baldrige Performance Excellence Program – NISTwww.nist.gov/baldrige
The Boeing Companywww.boeing.com
Boise State Universityhttp://cobe.boisestate.edu/graduate
BSIwww.bsiamerica.com
California State University, Dominguez Hillswww.csudh.edu/msqa
CEBOS Ltd.www.cebos.com
The Coca-Cola Companywww.coca-cola.com
Creative Healthcarewww.creative-healthcare.com
EMNS-GSQAwww.gsqa.com
Ennov Solutionswww.ennov.com
EtQ Inc.www.etq.com
Goodrich Aerostructures (Career Fair)www.goodrich.com
IAQGwww.sae.org/iaqg
IBS America Inc.www.ibs-us.com
Implementation Partners LLCwww.imppart.com
InfinityQS Internationalwww.infinityqs.com
Intelex Technologies Inc.www.intelex.com
Johnson & Johnson (Career Fair)www.careers.jnj.com
The Juran Institute Inc.www.juran.com
Master of Business Operational Excellence – The Ohio State Universityfisher.osu.edu/mboe
MasterControl Inc. www.mastercontrol.com
McGraw-Hill Professionalwww.mhprofessional.com
MEIRxRS (Career Fair) www.medexecintl.com
Memory Jogger www.memoryjogger.org
Minitab Inc. www.minitab.com
The National Graduate School of Quality Managementwww.ngs.edu
National Quality Assurance www.nqa-usa.com
NSF International Strategic Registrationwww.nsf-isr.org
Orkin Commercial Serviceswww.orkincommercial.com
Perry Johnson Consulting Inc.www.pjcinc.com
PQ Systems Inc. www.pqsystems.com
Productivity Presswww.crcpress.com
QI Macros SPC Software for Excelwww.qimacros.com
QiSOFTwww.qisoft.com
Quality Council of Indianawww.qualitycouncil.com
Quality Institute of America Inc.www.qi-a.com
QualiWare Inc. www.qualiware.com
RealityCharting www.realitycharting.com
SAS Institute Inc. – JMP Divisionwww.jmp.com
SGSwww.sgs.com
The Shingo Prizewww.shingoprize.org
Society of Manufacturing Engineerswww.sme.org
Sparta Systemswww.spartasystems.com
StatPoint Technologies Inc.www.statgraphics.com
StatSoft Inc.www.statsoft.com
Systems2winwww.systems2win.com
Taylor & Francis www.tandf.co.uk/journals
Thomson Reuters www.thomsonreuters.com/healthcare
uniPoint Software www.unipointsoftware.com
University of Michigan College of Engineeringhttp://interpro.engin.umich.edu
University of Scrantonwww.scrantonuniversityonline.com
Verify Inc.www.vscnet.com
VSCwww.vscnet.com/vsc/
VTR Inc.www.vtri.net
Zimmer (Career Fair)www.zimmer.com
Use your smartphone to visit the World Conference on Quality and Improvement mobile site during the conference at team.asq.org/wcqi/.
Special Advertising Section
59April 2012 • QP

Join Other ASQ Enrollees Nationwide!Online* Programs Start in the Spring & Fall
Degrees in Quality Systems Management• Bachelor of Science Completion* (12 months)
• Master of Science (12 months)
• Doctor of Business Administration* (DBA) (24 months)
Optional Specializations In: Health Systems | Environmental Quality MgtFood Safety | Homeland Security
Visit us at Booth # 429! At the ASQ World Conference in Anaheim
Incentives for ASQ members include:
• ASQ Tuition Scholarship• Waived Application Fee• Free Books for the First
Course
Visit www.ngs.edu/asq to learn more!
WWW.NGS.EDU/ASQ | 800.838.2580 EXT 107 | [email protected]
NGS is accredited by the New England Association of Schools and Colleges (NEAS&C). NEAS&C may be contacted at [email protected] or 781-271-0022.Certified to Operate by State Council of Higher Education for Virginia (SCHEV). *Not available in Massachusetts. NGS is a not-for-profit institution.
AQS Management Systems, Inc.Your Management Systems Solutions Provider
ISO 9001 | ISO 14001 | ISO 13485 | TS 16949OHS 18001 | AS9100 | AS9110 | ISO 22000 | ISO/TS 29001
AQS Management Systems, Inc. provides ISO training, coaching, and project assistance in support of organizational improvement and implementation of international management
system standards. Our primary focus is to provide cost-effective advice and support to organizations who intend to use their completed management system to generate profit and reduce risks for their organization.
AQS Management Systems, Inc.1 9 8 9 – 2 0 1 2
For more information or for additional offerings…Call 763-746-0505 or 1-800-633-2588 or email: [email protected]
w w w. a q s p e r f o r m a n c e . c o m
The leader in RABQSA Certified
Training
Visit us at booth 418 at the ASQ World Conference on Quality and Improvement.
60 QP • www.qualityprogress.com

April 2012 • QP 61
StandardS OutlOOk BY Sandford LieBeSman
revised thinking Updated guide to internal control keeps you in line with ISO 9001
The SarbaneS-Oxley Act (SOX) was
passed in 2002 in response to scandals at
Enron, Tyco International, Adelphia, World-
Com and other companies. Section 404
requires management and external auditors
to report on the adequacy of the company’s
internal control on financial reporting.1
Early on, guidance from the Committee
of Sponsoring Organizations of the Tread-
way Commission (COSO) was identified
as an effective way of establishing control.
The Securities and Exchange Commission
(SEC) suggests using COSO when firms
review their internal control system.
COSO developed the internal control
integrated framework (ICIF) in 1992 in
response to the savings and loan scandals
in the 1980s.2 COSO is now 20 years old
and is due for an upgrade to incorporate
changes in the financial environment.3
Raising expectationsSince 1992, business and operating envi-
ronments have changed, and stakeholders’
expectations have evolved. In response
to these changes, COSO’s revisions are
designed to accomplish the following:
• Clarifytheroleofobjective-setting.
• Includetheincreasedrelevanceof
technology.
• Enhancegovernanceconceptsrelating
to boards of directors and subcommit-
tees, such as audit committees.
• Expandreportingcategoriesofobjec-
tives beyond financial reporting.
• Containmorediscussionofpotential
causes of fraud and anti-fraud expecta-
tions.
• Considerdifferentbusinessmodelsand
organizational structures, including
outsourcing various functions of the
value chain.
In addition, many organizations have
expanded their reporting efforts, moving
to include other types of external report-
ingbeyondjustfinancialreporting.If
management operates in accordance with
International Organization for Standardiza-
tion (ISO) quality management standards,
it may report publicly on its operations.
For example, the entity may conduct an in-
dependent audit and report on the entity’s
conformance with ISO 9001.
While changes have been made to each
of the original five components of COSO,
they have not changed in name:
1. Control environmentThe control environment is the founda-
tion for all other components of internal
control. The board of directors and senior
management establish the tone regarding
the importance of internal control and ex-
pected standards of conduct. The control
environment provides discipline, process
and structure.4
The control environment has changed
greatly in the past 20 years because of the
greater complexity of business models,
the expanded use of third parties and
business partners, and the globalization
of most industries. Because of the new
complexity, transparency, operations and
internal governance have been extended
beyond financial performance.
Risk-based programs are expected to
be more robust and detailed, corporate
social responsibility is more important to
stakeholders, and regulatory requirements
have expanded the discussion of integrity
and ethical values.
In addition, the new control environ-
ment must include a commitment to com-
petence and a clearer definition of boards
of directors’ and audit committees’ roles,
management’s philosophy and operating
style, organizational structures, assign-
ment of authority and responsibility, and
HR policies and practices.
There are five principles applied to the
control environment:
1. The organization demonstrates a com-
mitment to integrity and ethical values.
2. The board of directors demonstrates
independence of management and ex-
ercises oversight for the development
and performance of internal control.
3. Management establishes—with board
oversight—structures, reporting guide-
lines and responsibilities in the pursuit
ofobjectives.
4. The organization demonstrates a com-
mitment to attract, develop and retain
competent individuals in alignment
withobjectives.
5. The organization holds individuals
accountable for their internal control re-
sponsibilitiesinthepursuitofobjectives.
2. Risk assessmentRisk assessment involves a dynamic and
iterative process for identifying and ana-
lyzing risks to achieving the organization’s
objectives,formingabasisfordetermining
how risks should be managed. Manage-
ment considers possible changes in the
external environment and within the orga-
nization’s business model that may impede
theabilitytoachieveitsobjectives.5
In the past few years, organizations
have increased risk taking as evidenced by
the financial crisis that began in 2008. As
the scandals of 2000 triggered the creation
of SOX, the financial crisis of 2008 led to
the Dodd-Frank Wall Street Reform and
Consumer Protection Act.6
QP • www.qualityprogress.com62
StandardS OutlOOk
Dodd-Frank requires an organization
to perform an expanded assessment of
risks to the financial system and to make
general regulatory recommendations on
risks to government agencies. The result
is that COSO now includes a more risk-
based approach to internal control and
a clearer description of how it considers
risk assessment.
A pre-condition to risk assessment is
theestablishmentofmeasurableobjec-
tives, as required by ISO 9001.7 Also, the re-
vision clarifies risk assessment to include
processes for risk identification, analysis
and response. To protect against fraud risk,
an organization must consider inadequate
safeguarding of assets and corruption as
part of the risk assessment process.
In the four principles applied to risk
assessment, the organization:
1. Specifiesobjectiveswithsufficientclar-
ity to enable the identification and as-
sessmentofrisksrelatingtoobjectives.
2. Identifies risks to the achievement of
itsobjectivesacrosstheentityand
analyzes risks as a basis for determin-
ing how the risks should be managed.
3. Considers the potential for fraud in
assessing risks to the achievement of
objectives.
4. Identifies and assesses changes that
could significantly impact the system of
internal control.
3. Control activitiesControl activities are the actions estab-
lished through policies and procedures that
help ensure the execution of management’s
directives to mitigate risks to the achieve-
mentofobjectives.Controlactivitiesare
performed at all levels of the organization,
at various stages in business processes and
throughout the technology environment.8
The growth of technology has been the
majorchangeaffectingcontrolactivities.
This includes IT and decentralized meth-
ods—such as mobile, intelligence and
web-based tools—that may be operated
by a third party. Today, controls are found
throughout the organization, often in
non-financial environments. For example,
compliance to ISO 9001 requires gathering
numerous sets of data to be used in deci-
sion making.
Control activities are especially impor-
tantinmonitoringthestatusofobjectives
and identifying impending risks. Because
objectivesmustbemeasurable,controls
areusedtogatherdataforeachobjec-
tive that can be used to determine future
efforts. The use of the preventive and cor-
rective action tools of ISO 9001 can act as
supports for the control activities of COSO.
In the three principles applied to the
control activities, the organization:
1. Selects and develops control activities
that help mitigate risks to the achieve-
mentofobjectives.
2. Selects and develops general control
activities over technology to support
theachievementofobjectives.
3. Deploys control activities as mani-
fested in policies that establish what is
expected and in relevant procedures to
affect the policies.
4. Information, communicationInformation is necessary for the organiza-
tion to carry out internal control respon-
sibilities in support of the achievement
ofitsobjectives.Communicationoccurs
internally and externally, and provides the
organization with the information needed
to carry out day-to-day internal control
activities. Communication enables all
personnel to understand internal control
responsibilities and their importance to
theachievementofobjectives.9
There has been an expansion of
information sources and the impact of
technology over the past 20 years, includ-
ing the introduction of Google, Wikipedia
and social networking. Accompanying
this expansion is a greater demand for
information and greater requirements for
quality, protection and communication.
Here again, the use of third-party ser-
vice providers has expanded for internal
processes such as payroll, customer rela-
tions management, data-center operations,
supply chain management and manufac-
turing. Information and communication
with outsourced entities has become
critical to organizations.
In the three principles applied to infor-
mation and communication, the organiza-
tion:
1. Obtains or generates and uses relevant
quality information to support the func-
tioning of other components of internal
control.
2. Internally communicates information
necessary to support the functioning of
other components of internal control,
includingobjectivesandresponsibili-
ties for internal control.
3. Communicates with external parties
regarding matters affecting the func-
tioning of other components of internal
control.
5. Monitoring activitiesOngoing evaluations, separate evaluations
or some combination of the two are used
to ascertain whether each of the five com-
ponents of internal control, including con-
trols to affect the principles within each
component, is present and functioning.
Ongoing evaluations built into business
processes at different levels of the organi-
accompanying the expansion of technology is a greater demand for information.
zation provide timely information. Separate
evaluations, conducted periodically, will
vary in scope and frequency depending on
the assessment of risks, effectiveness of
ongoing evaluations and other management
considerations. Findings are evaluated
against management’s criteria, and deficien-
cies are communicated to management and
the board of directors as appropriate.10
Monitoring is considered in its broader
and intended context—assisting manage-
ment in understanding how all compo-
nents of internal control are being applied
and whether the overall system of internal
control operates effectively.
As part of the monitoring activities,
organizations may conduct ongoing or
separate evaluations. For example, the
quality officer of a medium-sized manufac-
turing company participates in a monthly
production meeting in which he obtains
information regarding approval of product
modifications. The quality officer’s review
includes questions to identify unusual
trends or anomalies, investigations and in-
formation obtained from the investigations
to modify control activities that authorize
other personnel to alter production terms.11
Separate evaluations are usually
conducted by the internal audit function.
Other means of accomplishing separate
evaluations include:
• Otherobjectiveevaluations.
• Cross-operatingunitorfunctional
evaluations.
• Benchmarkingorpeerevaluations.
• Self-assessments.
Outsourced service providers are an-
other monitoring issue. Periodic informa-
tion must be obtained to monitor activities
and controls used by the service provider.
Often, the organization may attain infor-
mation by reviewing an independent audit
or examination report.
After the evaluations are complete,
the findings should be communicated to
the personnel responsible for preventive
or corrective action. Deficiencies that
are categorized as material weaknesses,
significantdeficiencies,majornonconfor-
mities and some minor nonconformities
should be reported to senior management
and the board of directors.
In the two principles applied to the
monitoring activities, the organization:
1. Selects, develops and performs ongoing
or separate evaluations to ascertain
whether the components of internal
control are present and functioning.
2. Evaluates and communicates internal
control deficiencies in a timely manner
to the parties responsible for taking
corrective action, including senior man-
agement and the board of directors.
A few more additionsThe following are specific quality manage-
ment inputs added to the revised COSO
framework:
• Objectivesmustbemeasurableand
may relate to improving quality—such
as avoiding waste and rework—re-
ducing costs and production time,
improving innovation, and improving
customer and employee satisfaction.
• Inareasinwhichmanagementoperates
in accordance with ISO standards for
quality management, it may report
publicly on its operations.
• Apreconditiontoriskassessmentises-
tablishingmeasurableobjectiveslinked
at various levels of the organization.
• Settingtheoveralllevelofacceptable
risk and associated risk appetite is part
of strategic planning and enterprise
risk management.
• Risktoleranceistheacceptablelevelof
variation in performance relative to the
achievementofobjectives.
• Riskappetiteisthebroad-based
amount of risk an organization is will-
ing to accept in pursuit of its mission
and vision.
• Examplesofinternalreportsinclude
results of marketing programs, daily
sales flash reports, production quality,
and employee and customer satisfac-
tion results.
• Communicationtoexternalsuppliers
and customers is critical to establishing
the appropriate control environment.
• Communicationsfromexternalparties
include customer feedback related to
product quality, improper charges and
missing or erroneous receipts.
• Customerinformationonproductqual-
ity may include customer feedback relat-
ed to product quality, improper charges,
and missing or erroneous receipts.
• Examplesofinternalreportsinclude
results of marketing programs, daily
sales flash reports, production quality,
and employee and customer satisfac-
tion results. QP
referenceS and nOTe1. “Sarbanes-oxley act of 2002,” July 30, 2002, www.gpo.gov/
fdsys/pkg/PLaW-107publ204/pdf/PLaW-107publ204.pdf (case sensitive).
2. CoSo was formed in 1985 to sponsor the national Com-mission on fraudulent financial reporting, also known as the Treadway Commission, which consists of the american institute of Certified Public accountants, american ac-counting association, financial executives international, in-stitute of internal auditors and the institute of management accountants. for more information, see www.coso.org.
3. The CoSo advisory panel recently asked Pricewater-houseCoopers LLP to develop the revision to CoSo and J. Stephen mcnally, the institute of management accountants (ima) representative for the iCif, to form an ima advisory panel to review the revision. The team included ima CoSo Board member and Chair emeritus Sandra richterme. i am the quality management member on the team that helped craft the changes to CoSo under public review as of march 2012, including several quality-related aspects..
4. CoSo, “internal Control—integrated framework executive Summary,” december 2011, www.ic.coso.org/download.aspx.
5. ibid.6. “dodd-frank Wall Street reform and Consumer Protec-
tion act,” July 21, 2010, www.gpo.gov/fdsys/pkg/PLaW-111publ203/pdf/PLaW-111publ203.pdf (case sensitive).
7. international organization for Standardization, ISO 9001:2008—Quality management systems—Require-ments, clause 5.4.1.
8. CoSo, “internal Control—integrated framework executive Summary,” see reference 4.
9. ibid.10. ibid.11. ibid.
SandfORd LIebeSman is president of Sandford Quality Consulting in mor-ristown, nJ, following more than 30 years of experience in quality at bell Laboratories, Lucent Technologies and bellcore (Telcordia). He is an aSQ fellow and past chair of the electron-ics and Communications division, and
is a member of ISO technical committee 176 and the anSI Z-1 committee on quality assurance.
April 2012 • QP 63

Data loggerOnset’s Hobo UX90 occupancy and light
logger is a matchbox-sized, LCD-display
data logger that tracks building occupancy
and light usage to pinpoint areas in a
building that could benefit from occupancy
sensors and other energy-saving initia-
tives.
Building owners, facility managers,
energy auditors and lighting contrac-
tors will use the data loggers to collect
time-stamped data documenting each
time room occupancy or lighting status
changes. The UX90 data loggers streamline
energy audits
After data has been recorded with the
logger, it can be viewed in graph form
using accompanying HOBOware software
and printed for use in reports. The data
also can be exported to Microsoft Excel for
more detailed analysis.
• Call:800-564-4377.
•Visit:www.onsetcomp.com.
ClipsMueller Electric has announced models
BU-46A-XLandBU-46C-XL,aseriesof
miniature plier-style clips with long polyvi-
nylchloride(PVC)insulators,designedfor
applications in which additional shielding
may be required, such as testing, trickle
charging and timing.
ThemodelBU-46A-XLisconstructed
ofcopper-platedsteelandisratedto50
amps,andtheBU-46C-XLisconstructedof
solidcopperandisratedto75amps,with
a heavy-duty plated spring and matched
clinching ears to grip the wire securely at
the end of the leg. The clips are assembled
withPVCinsulatorsinredorblackwith
crimp or solder connection. Jaws are also
able to secure solidly on terminals, with
quick and secure wire attachment.
• Call:800-955-2629.
• Visit:www.muellerelectric.com.
SoftwareCHARTrunner Lean from PQ Systems
retrieves data from various sources and
presents it for statistical process con-
trol charting and analysis. Data can be
retrievedfromthefollowing:
• MicrosoftAccess.
• SQLServer.
• MicrosoftExcel.
CHARTrunner Lean updates your charts
in real time. After you create a chart, you
can save and reuse your chart or series
of charts. Each time you open a chart, it
automatically grabs the latest source data
and updates with a new chart. You can
also set a specific refresh interval for any
chart to update with the latest data so you
can make timely decisions.
When browsing created charts, you can
easily find the chart you need by viewing
thumbnail images. Multiple charts can be
displayed on one screen and arranged
with a click of the mouse. CHARTrunner
Lean also can evaluate your data in vari-
ous chart formats.
• Call:800-777-3020.
• Visit:www.pqsystems.com.
QP•www.qualityprogress.com64
QPTOOLBOX

April2012•QP 65
Pressure transducerSetra Systems’ AccuSense model ASM
is a pressure transducer designed to
provide overpressure protection within
demanding test environments.
The pressure transducers are tem-
perature compensated, with a total
errorbandoflessthan±0.25%fullscale,
minimizing thermal errors and making
outputs unaffected by environmental
temperature shifts. A hydrophobic
porous plug at the top of the unit also
protects its recessed air vent from envi-
ronmental contaminants.
The model ASM is ideal for high-tech
industrial, laboratory R&D and test cell
requirements, including engine diag-
nostics, refrigeration testing, engine
dynamometer testing and analysis.
• Call:800-257-3872.
• Visit:www.setra.com.
SoftwareOlympus Stream image analysis software
version1.7streamlinestheprocessso
users can accomplish complex applica-
tions in material
science laboratories.
The latest version of
the software features
high dynamic-range
imaging, streamlined
document storage
and retrieval and im-
aging, data-handling and reporting tools.
Version1.7’shighdynamic-range
imaging is useful when displaying im-
ages with dark and bright areas that
require viewing, measuring or analysis.
Users also can load and save acquisition
parameters directly in the camera con-
trol tool window, batch process images
in macros, analyze multiple images and
output results to a single spreadsheet.
• Call:484-896-5792.
• Visit:www.olympus-ims.com.
Data acquisition moduleIpetronik’s M-RTD compact, four-channel
analog mobile data acquisition module
is designed to support extreme vehicle
testing requirements in an operating
temperaturerangeof-40°Cto+125°C.
It has the capability to accept up to
four resistance temperature detector
(RTD)sensorinputsandfourindividual
RTD current sensor outputs. The M-
RTD features galvanic isolation on all
electrical and data connections, with
components housed within a compact
and lightweight anodized aluminum
Venclosure.Whenusedwiththesupplied
software, it offers real-time analytical
measurements and simultaneous data
storage capabilities of different formats.
TheM-RTDisidealforHVAC,climate
control and thermal systems testing.
• Call:866-777-6220.
• Visit:www.ipetronik.com.
Got a quality product?Send your product description and photo to [email protected].

QP • www.qualityprogress.com66
Medical Device Design and Regulation Carl T. DeMarco, ASQ Quality Press, 2011,
368 pp., $66 member, $110 list (book and
CD-ROM)
This book is a com-
prehensive volume
providing every-
thing you need to
understand medical
devices. It is well or-
ganized and starts
at the design and
regulatory stages,
moves through the regulatory system of
the U.S. Federal Drug Administration (FDA)
and goes further to post-approval market-
ing and surveillance.
The book can be used as a reference
and a teaching text. DeMarco has included
interesting and useful exercises at the end
of each chapter. These are less on testing
and are more informative.
For example, chapter four discusses
clinical trials, their use for devices and the
certification steps necessary in an applica-
tion. The exercises following the chapter
include searching the Codex website to
find out the international regulations for
a device—useful information that is not
covered in-depth in the chapter.
While there are sections on quality and
auditing of devices, and clinical and non-
clinical trials for submiting a new device
for approval, two chapters focus on this
specifically. Chapter seven examines qual-
ity systems and current good manufactur-
ing practice (GMP) guidelines. After ap-
proval, the FDA can, and often will, inspect
manufacturing plants for new medical
devices to ensure compliance with GMPs
and to enforce this with warning letters
or decertifying the facility. Chapter eight,
the final chapter, covers all this informa-
tion in-depth. The author wisely doesn’t
try to cover all the statistical methods for
designing, testing and evaluating medi-
cal devices, which probably would have
doubled the book’s size.
Also included are extensive appendixes
with websites, references and a wonder-
ful lexicon of all the abbreviations used
in the book and by regulatory agencies. A
CD-ROM is supplied with supplementary
reference material.
I. Elaine Allen
Babson College
Wellesley, MA
Insights to Performance Excellence 2011-2012 Mark L. Blazey, ASQ Quality Press, 2011,
384 pp., $56 member, $92 list (book and
CD-ROM).
As America’s
highest recogni-
tion for quality, the
Malcolm Baldrige
National Quality
Award sets high
standards. Reach-
ing such lofty levels
of performance
can be a long and daunting challenge
for any organization. Blazey has written
a clear and approachable text on the
Baldrige award and how to use the criteria
to achieve organizational performance
excellence.
The book represents far more than just
a how-to reference manual on the Bald-
rige award criteria. The Baldrige frame-
work is well developed; however, translat-
ing the criteria into actionable items and
honestly evaluating your systems is not
easy. This book clearly translates the
criteria language, the requirements and
provides help in getting started, best prac-
tices, implementation and assessments.
Because the criteria are constantly
evolving, this edition also addresses crite-
ria changes for 2011-2012. An accompa-
nying CD-ROM references the 2011-2012
changes and provides additional informa-
tion and tools.
The Baldrige criteria apply to every or-
ganization regardless of size or interest in
receiving the award. Blazey has compiled
a well organized and salient compendium
of organizational assessment knowledge
that will help organizations improve
performance. This is the book’s greatest
value.
If you’re planning to go for the Baldrige
gold, this is your book. But even if you’re
not, this is a good manual on how to
improve your organization.
James Kotterman
Michigan Manufacturing
Technology Center
Plymouth, MI
101 Project Management Problems and How to Solve ThemTom Kendrick, Amacom, 2010, 272 pp.,
$19.95 (book).
A project manager
can be faced with
an infinite number
of issues even while
working on a small
project. Managing
project challenges,
as well as surviving
in today’s world,
QPRevIeWS

requires skill, experience and the willing-
ness to listen to other people. This book
offers lessons and tips in avoiding issues,
problems, overruns, delays and personnel
matters. Kendrick offers his own experi-
ence and lessons learned in every chapter.
The primary and unexpected feature
is the author’s focus on people and hu-
man resources. He discusses employees
throughout the book; he treats them care-
fully and with respect and offers tips on
motivation, communication and listening
skills, and ultimately covers monitoring
and performance.
The book is well written. It’s direct and
formatted similarly to areas of the project
management body of knowledge. Sections
open with a project-related question. This
additional framing of a question adds a
quick way for the reader to gauge how to
use the author’s insights and whether to
use his advice.
This book is nicely written and unwav-
ering in its focus. Readers will find it to
be a useful tool to keep around for a long
time.
Frank Pokrop
Carefusion
San Diego
Quality Function Deployment and Lean Six Sigma Applications in Public Health Grace L. Duffy, John W. Moran and William
J. Riley, ASQ Quality Press, 2010, 195 pp.,
$38 member, $63 list (book).
The purpose of this book is to introduce
quality function deployment (QFD) and
lean Six Sigma (LSS) methods to public
health professionals so that they can
implement quality improvements within
their own agencies. The authors have
modified the methods so they are aligned
with the needs in the public health sector.
Using QFD is a way to translate
customer requirements into appropriate
features at each development stage. The
aim is to ensure
that the voice of
the customer is
fully understood
and incorporated
throughout the
design and develop-
ment of a product
or service. LSS is a
natural partner to QFD.
The concepts are illustrated at different
levels:
• Macro: Addresses the strategic
integration of long-term approaches to
meet overall priority outcomes.
• Meso: Contains planning and deploy-
ment of programs that translate the
strategic vision into specific programs
and departments.
• Micro: encompasses the health depart-
ment projects and programs instituted
at the functional unit level.
• Individual: Uses tools that support the
specific task.
Overall, I really like this book, even
though it does contain a mistake. For ex-
ample, the description of the Kano model
is not good.
This is a structured and balanced book
written on a suitable level and is motivat-
ing and inspiring. There are also many
examples and illustrations from the public
health sector supporting the discussion.
Bengt Klefsjö
Luleå University of Technology
Sweden
REcEnT RELEASES
Lean Management Principles for Information Technology, Series on Resource Management
Gerhard J. Plenert, CRC Press, 2011, 368
pp., $79.95 (book).
A career in StatisticsGerald J. Hahn and Necip Doganaksoy,
Wiley, 2011, 360 pp., $69.95 (book).
April 2012 • QP 67
Advertisers IndexADvERTISER PAgE PHonE WEbAQS Management Systems, Inc. 60 763-746-0505 www.aqsperformance.com The Boeing Company 58 256-457-2199 www.boeing.comThe Coca-Cola Company 58 404-676-4893 www.coca-cola.cometQ Inc. 1 516-293-0949 www.etq.comThe Harrington Group 2 800-476-9000 www.harrington-group.comMeIRxRS 56 800-507-5277 www.medexecintl.comMinitab Inc. IFC 800-448-3555 www.minitab.comThe National Graduate School 60 800-838-2580 www.ngs.edu of Quality ManagementQuality Council of Indiana 10, 11 812-533-4215 www.qualitycouncil.comStatSoft Inc. OBC 918-749-1119 www.statsoft.comUniversity of Colorado Boulder 54 303-492-2570 emp.colorado.eduThe University of Michigan 56 734-615-5698 www.interpro.engin.umich.edu College of engineering

QPcalendarmay
8-10 Spacecraft Technology Expo.
los angeles. call Steve Bryan at 877-842-
6289 or visit www.spacetechexpo.com.
15-17 The 10th annual Front End
of Innovation: Innovate in a Networked
Ecosystem. Orlando, Fl. Visit FeI at www.
iirusa.com/feiusa.
15-18 11th annual Lean Six Sigma
and Process Improvement in Healthcare
Summit. new Orleans. call the Worldwide
conventions and Business Forums at
800-959-6549 or visit www.wcbf.com.
15-18 SCOR Framework and
Project. chicago. call the Supply chain
council at 202-962-0440, visit www.
supply-chain.org or email info@supply-
chain.org.
16 Lean manufacturing and Process
Improvement for the Food and Beverage
Industry: Introductory. Guelph, Ontario.
call the Guelph Food Technology center at
519-821-1246 or visit www.gftc.ca.
aSQlearnInGInSTITUTe UPCOmING CLaSSROOm-BaSEd TRaINING
maymilwaukee
7-8 certified Quality auditor certification Preparation
7-9 Internal auditor Training for aS9100
7-10 Guide to Process Improvement and change
7-11 certified Quality engineer certification Preparation
7-11 Introduction to Quality Management
7-11 ISO 9001:2008 lead auditor Training (raBQSa certified)
7-11 Software Quality engineering
9-10 Systematic Problem Solving for Sustained Improvements With Quality
10-11 customer Supplier Partnerships—an Introduction
10-11 16-hour ISO 9001:2008 lead auditor Training (raBQSa certified)
jUNEatlanta
18-19 lean enterprise
18-20 Internal auditing to ISO/Iec 17025
18-20 ISO 13485:2003 Internal audi-tor Training (raBQSa certified)
18-20 ISO 9001:2008 Internal auditor Training (raBQSa certified)
18-22 aS9100:2009 lead auditor Training (rev. c) (raBQSa certified)
18-22 Introduction to Quality engineering
20 lean Kaizen: a Simplified approach to Process Improvement
20-22 Practical Measurement Uncertainty
21-22 auditing for Improvement
VISIT WWW.aSQ.ORG/LEaRNINGINSTITUTE FOR dETaILS.
QP • www.qualityprogress.com 68
21-23 aSQ conference. Institute for
Software Excellence. anaheim, ca. Visit
http://asq.org/conferences/institute-for-
software-excellence.
21-23 aSQ conference. Quality
Institute for Healthcare. anaheim, ca.
Visit http://qihc.asq.org.
21-23 aSQ conference. World
Conference on Quality and Improvement.
Anaheim, CA. Visit http://wcqi.asq.org.
21-25 New Product Innovation,
development and Implementation
Strategies. chicago. call the University of
chicago Booth School of Business at 312-
464-8732 or email exec.ed@chicagobooth.
edu.
22-24 Fundamentals of machinery
Lubrication. Houston. call noria at 800-
597-5460 or visit www.noria.com.
22-25 RaPId 2012 Conference and
Exposition. atlanta. Visit the Society of
Manufacturing engineers at www.sme.org
or call 866-635-4692.
23-24 assuring Product Safety,
Supplier Control and Risk management
and Production Liability Prevention.
Irvine, ca. Visit randall Goodden Inter-
national at www.randallgoodden.com or
e-mail [email protected].
If you’d like your event included in QP
Calendar, submit information at least three
months in advance to [email protected].
Non-ASQ organizations may list one event
per issue.

April 2012 • QP 69
ProfessionAlservicesfor information on placing an ad, contact Media sales at 866-277-5666.
UHRIG CONSULTING
Cus tomized ser v i ces in qua l i t y management systems: Documentation Development, Process Improvement, Training, Auditing and Problem Solving
•ISO9001•AS9100/9110/9120•ISO13485/21CFR820
•ISO14001•TL9000•6SigmaTools
RedondoBeach,CA310-798-8442
The source for flash card study aids for certification exams:
CQE, CSSBB, STATS, and more.www.qualityreviewinaflash.com
QUALITY & PRODUCTIVITY SOLUTIONS, INC.Global Training and Consulting
•LeanEnterprise•SixSigma/DFSS• ISOandRelatedSystems—allindustriesincludingmedical,pharm.,foods,nuclear
•ProjectManagement/Agile/Risk•SupplyChain,Outsourcing•ASQ,APICS,SME,PMICertifications•Customizedon-sitetrainingavailablebesidespublictrainingon50+topics
Email: [email protected] Website: www.qpsinc.com Toll-free 877-987-3801
Keynote Presentations
• Corporate events• Conferences and conventions• Dr. Deming impersonation• Integrating lean and quality• Principles first – tools last!• Power of root cause analysis
Mike MicklewrightCSSBB, CQMgr, CQA, CQEArlington Heights, ILPH: [email protected]; www.mikemick.com
aging gracefully
Eugene A. Razzetti,Management Consultant,Auditor, Problem Solver
Get real help right away with:• ISO9000,14000,17024,28000,31000• BenchmarkingandAuditing (includingchecklistdevelopment)
• RiskManagementandGapAnalysis• StrategicPlanningandMeaningfulGoalsandObjectives
• DueDiligenceandAccountability• CorporateResponsibilityand
CompanyCharacter
Place a Recruitment Ad in Quality Progress and reach more than 100,000
readers from all over the world!
Contact Media Sales at 800-248-1946 or email [email protected].
Looking for Quality Professionals?
Creating Standout Individuals and Organizations!
10% Training Discount
❏ Millions of dollars in impacts!❏ International reputation❏ Applied training and coaching❏ Thousands trained worldwide❏ Hundreds of organizations and individuals coached
Training and coaching provided:• InternationalLeanSixSigma Master, Black or Green Belts• ISOandrelatedstandards• InternalandLeadAuditor• Projectmanagement• Manyothers
Call Corporate and Career Development at 864-250-8094 for information
or visit our website at www.gvltec.edu/ccd/
Greenville Tech CCD

QP • www.qualityprogress.com70
ProfessionAlservicesfor information on placing an ad, contact Media sales at 866-277-5666.
For Accredited Certification Look for the Symbols of Quality
Highest Ranked Registrar in an independent customer survey!
EAGLE Registrations Inc. EAGLE Food Registrations Inc.
ISO 9001 · AS 9100 · ISO/TS 16949 ISO 14001 · ISO 13485 · OHSAS 18001
Safe Quality Food (SQF) · ISO 22000 FSSC 22000 · SQF Ethical Sourcing
Call 800-795-3641 | www.eagleregistrations.com
ISO 9001, AS 9100, ISO 13485, ISO 20000 FDA QSR, Canadian MDR, European MDD Planning, Implementation, Training Process Improvements, Process Validation QMS Internal Audits, Mini-audits
Camille Delmotte, MBA, President Phone and fax: 410-426-2269 [email protected]
www.QualityEdgeConsulting.com
TQM AssociATes inc.“we’re here to support you”
• Established in 1994• Women-Owned
• Quality Assurance Professionals• Across the U.S. and Worldwide
• Temporary or Permanent• Source Inspection
• Surveys• Audits
• Expediting
800-424-4729 3990 Old Town Ave. #C109Fax 619-297-3251 San Diego, CA 92110tqmassociates.com email: [email protected]
Classroom Training Aids…g Quincunx Boardsg Sampling Bowlsg Catapults g Deming Funnelsg And lots more …
Visit us at: www.qualitytng.comEmail [email protected] for brochure
Ph: 248-641-7030 Fax 248-641-7031PO Box 611 Troy, MI 48099-0611
Quafsi Chile, your partner in QA and Food Safety in Chile and South AmericaMore than 20 years of experience both in feed and food.
Supplier audits-inspections-training-representations
Visit us at www.quafsi.cl or contact us by email: [email protected]
IMDS Data• Wecancreateyourdataandsubmitwithin72hours
• Wedotheworkandinvoiceyou• Referencesfoundonourwebsite• BasedintheUnitedStates
www.imdsdata.org
SQS Consulting Inc.For ISO 9001 and AS 9100
+ 9110 + 9120 CertificationsServices Provided:
• Training • Process Documentations
• Audit/GAP Analysis
Contact: [email protected]
Voicemail: 623-505-8387
Services: Consulting, Coaching, Auditing, Facilitation, and Implementations
Standards: ISO 9001, TS 16949, AS 9100cAuditing: Internal Audits, Second-Party AuditsProblem Solving: 8D, A3, Six Sigma ToolsProcess: 5S, Visual Controls, and New Product Development
Certifications Held: RABQSA Lead Auditor, Six Sigma Black Belt
ANTHONY ROARKSE Michigan • 734-732-6320
[email protected] www.sigmasolutionsllc.net
We provide calibration services of mechanical, dimensional, and electrical gages.
We are now offering inspection services.
We offer on-site services, repair, recall reports, pick-up and delivery, and five-day turnaround service. Some of the items we calibrate are micrometers, surface plates, plugs and rings, torque, pressure, comparators, and meters.
Our website is www.qualtechlabs.com.
Process Tek - Sterility by DesignFor sterile products, packages and processes
Kailash S. Purohit, Ph. D.www.processtek.net
Management System ConsultantsConsulting with a personal touch.• Outsourcing• Certification Prep• Business Processes• Policies, Manuals and Procedures• Documentation Reduction• Internal and Supplier Audits• Training• Keynote Speaking/Presentations
API-Q1 | API-Q2 | ISO 9001 | ISO 14001 ISO 17025 | OHSAS 18001
www.iso9001group.com | 281-402-6800
Need Help With Process & Quality?Lean • Six Sigma • CMMI® • ITIL • ISO9000
Lean Documentation • TL9000 • AS9100 Organization Change Management
SERVICESConsulting • Staffing • Training • Outsourcing • Support Assessments (Six Sigma, ISO, SCAMPI) • Rent-a-MBB Problem Solving • PMP® online training • Free Webinars
SEI Partner • Offices: USA, Israel, Indiawww.aqionline.com, [email protected], 623-878-0906
Credentials: Six Sigma MBB, Multiple ASQ Certs, ISO LA Authors of three bestsellers on Six Sigma, QMS, and ISO
Awarded Feigenbaum Medal by ASQ
ShareYour QualitY JourneYQP occasionally includes an interesting, personal quality story in its “Quality in the First Person” column. If you are interested in sharing your story—how you got into the quality field, how it has helped your organization or your career or how quality has enhanced your personal life— email [email protected].
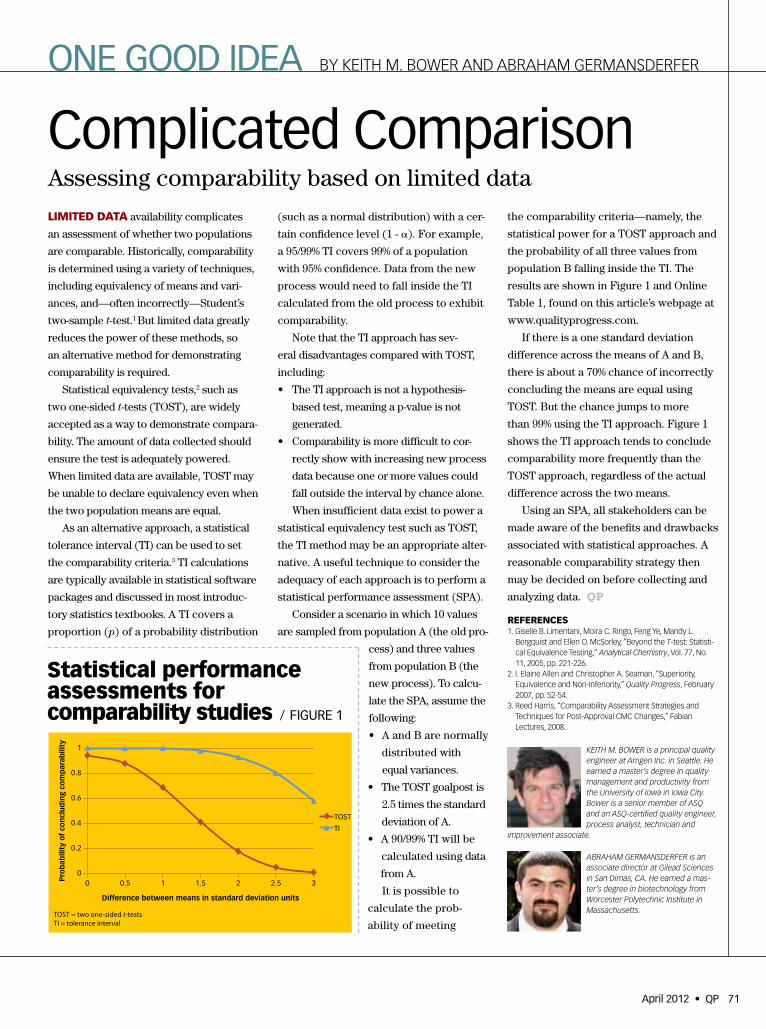
Complicated ComparisonAssessing comparability based on limited data
LIMITED DATA availability complicates
an assessment of whether two populations
are comparable. Historically, comparability
is determined using a variety of techniques,
including equivalency of means and vari-
ances, and—often incorrectly—Student’s
two-sample t-test.1 But limited data greatly
reduces the power of these methods, so
an alternative method for demonstrating
comparability is required.
Statistical equivalency tests,2 such as
two one-sided t-tests (TOST), are widely
accepted as a way to demonstrate compara-
bility. The amount of data collected should
ensure the test is adequately powered.
When limited data are available, TOST may
be unable to declare equivalency even when
the two population means are equal.
As an alternative approach, a statistical
tolerance interval (TI) can be used to set
the comparability criteria.3 TI calculations
are typically available in statistical software
packages and discussed in most introduc-
tory statistics textbooks. A TI covers a
proportion (p) of a probability distribution
(such as a normal distribution) with a cer-
tain confidence level (1 - α). For example,
a 95/99% TI covers 99% of a population
with 95% confidence. Data from the new
process would need to fall inside the TI
calculated from the old process to exhibit
comparability.
Note that the TI approach has sev-
eral disadvantages compared with TOST,
including:
• The TI approach is not a hypothesis-
based test, meaning a p-value is not
generated.
• Comparability is more difficult to cor-
rectly show with increasing new process
data because one or more values could
fall outside the interval by chance alone.
When insufficient data exist to power a
statistical equivalency test such as TOST,
the TI method may be an appropriate alter-
native. A useful technique to consider the
adequacy of each approach is to perform a
statistical performance assessment (SPA).
Consider a scenario in which 10 values
are sampled from population A (the old pro-
cess) and three values
from population B (the
new process). To calcu-
late the SPA, assume the
following:
• A and B are normally
distributed with
equal variances.
• The TOST goalpost is
2.5 times the standard
deviation of A.
• A 90/99% TI will be
calculated using data
from A.
It is possible to
calculate the prob-
ability of meeting
the comparability criteria—namely, the
statistical power for a TOST approach and
the probability of all three values from
population B falling inside the TI. The
results are shown in Figure 1 and Online
Table 1, found on this article’s webpage at
www.qualityprogress.com.
If there is a one standard deviation
difference across the means of A and B,
there is about a 70% chance of incorrectly
concluding the means are equal using
TOST. But the chance jumps to more
than 99% using the TI approach. Figure 1
shows the TI approach tends to conclude
comparability more frequently than the
TOST approach, regardless of the actual
difference across the two means.
Using an SPA, all stakeholders can be
made aware of the benefits and drawbacks
associated with statistical approaches. A
reasonable comparability strategy then
may be decided on before collecting and
analyzing data. QP
REfEREncEs1. Giselle B. Limentani, Moira C. Ringo, Feng Ye, Mandy L.
Bergquist and Ellen O. McSorley, “Beyond the T-test: Statisti-cal Equivalence Testing,” Analytical Chemistry, Vol. 77, No. 11, 2005, pp. 221-226.
2. I. Elaine Allen and Christopher A. Seaman, “Superiority, Equivalence and Non-Inferiority,” Quality Progress, February 2007, pp. 52-54.
3. Reed Harris, “Comparability Assessment Strategies and Techniques for Post-Approval CMC Changes,” Fabian Lectures, 2008.
One GOOd Idea BY KEITH M. BOwER ANd ABRAHAM GERMANSdERFER
ABRAHAM GERMANSDERFER is an associate director at Gilead Sciences in San Dimas, CA. He earned a mas-ter’s degree in biotechnology from Worcester Polytechnic Institute in Massachusetts.
statistical performance assessments for comparability studies / fIGure 1
0
0.2
0.4
0.6
0.8
1
0 0.5 1 1.5 2 2.5 3Pro
bab
ility
of
con
clu
din
g co
mp
arab
ility
Difference between means in standard deviation units
TOST
TI
TOST = two one-sided t-testsTI = tolerance interval
KEITH M. BOWER is a principal quality engineer at Amgen Inc. in Seattle. He earned a master’s degree in quality management and productivity from the University of Iowa in Iowa City. Bower is a senior member of ASQ and an ASQ-certified quality engineer, process analyst, technician and
improvement associate.
April 2012 • QP 71

Creative Combination3 tools to jump-start a lean Six Sigma project
SINCE 2002, I have been facilitating lean
Six Sigma projects and coaching other
belts through their projects. Combining
tools is a technique I use with teams when
potential root cause analysis through a
fishbone diagram does not show any obvi-
ous direction.
Fishbone diagramFrom using the fishbone diagram, most
quality professionals know there are usu-
ally three outcomes:
1. One of the bones in the diagram is full
of potential causes, leading a team to
focus on a particular area (Figure 1).
2. The same potential root causes appear
in several bones of the diagram,
indicating a systemic cause that, if
eliminated, will address several areas
of concern (see Online Figure 1, found
on this article’s webpage at www.
qualityprogress.com).
3. No common cause is seen throughout
the diagram, and all bones show sev-
eral potential causes (Online Figure 2).
In the first two cases, the team has
some direction by strategically focusing
on the particular bone, shown by the cir-
cle in Figure 1, or the recurring systemic
causes showing up in multiple locations,
shown in Online Figure 1. But what do we
do in the case of Online Figure 2?
By combining the completed fishbone
diagram with two other tools from our
Six Sigma tool kit, we can take a strategic
approach to proceed.
SIPOC diagramUsing a suppliers, inputs, process, outputs
and customers (SIPOC) diagram, map the
high-level flow for the process to which
the fishbone diagram is tied. The key
items we will use from this tool are the list
of outputs (Online Figure 3).
Cause and effect matrixThe cause and effect matrix shown in
Online Table 1 is what ties together the
outputs of the fishbone diagram with the
outputs from the SIPOC diagram. Part of
the quality function deployment house of
quality, the cause and effect matrix is the
center section of the house and is also
known as a relationship matrix.
The details of completing a cause and
effect matrix are beyond the scope of this
column. But the basic
process uses a cross-
multiplication method
in which each row and
column intersection is
scored by the team for the
degree of relationship and
is multiplied with a rating
of importance provided
by the customer. Each of
these multiplications is
added across the horizon-
tal row, providing the final
score at the far right.
Putting the causes from a fishbone on
the left side of the matrix and the outputs
from the SIPOC diagram along the top
allows teams to rate the relationship each
cause has with each output, helping to
rank and prioritize potential causes the
team should investigate first.
A completed cause and effect matrix is
shown in Online Table 2. The top portion
shows the outputs from a SIPOC diagram
for making a hamburger. The left side
shows the results of a fishbone diagram.
In this example, only main causes are
shown, but it is recommended that a team
use the five whys and display the lowest-
level causes on the diagram.
In this generic example, overcooking
the hamburger has the greatest relation-
ship with our SIPOC outputs, indicating
the team should focus on that cause
first.
Tool teamworkWhile the SIPOC diagram focuses on de-
sired outcomes and the fishbone diagram
focuses on the undesired causes of a
problem, creatively combining these tools
provides the team with more options on
how to proceed with the project.
As a lean Six Sigma practitioner, you
should begin to see how many of the tools
and techniques naturally work together
to provide a more focused approach on
process improvement. QP
SCOTT FORCE is a Six Sigma Master Black Belt trained by Sigma Break-through Technologies Inc. with more than 20 years of quality improve-ment experience in the healthcare, automotive and power equipment industries. He earned a bachelor’s degree in manufacturing engineering
from Miami University in Oxford, OH. A senior member of ASQ, Force is an ASQ-certified quality technician, engineer and Six Sigma Black Belt.
BaCk to BasiCs BY Scott Force
Several potential causes on one bone / figure 1
Effect
MachineMan
MaterialMethod
QP • www.qualityprogress.com72

Certifiably Improving Quality Professionals
ASQ senior member Bill Hooper holds multiple certifications. Since 2005, he has taught certification bodies of knowledge to more than 80 individuals with a 95 percent pass rate, developing his own process improvement skills along the way.
An Introduction to the Seven Basic Quality Control Tools
In this introduction to one of ASQ’s most popular series of webcasts, Dr. Jack ReVelle provides an overview and example for each of the seven basic quality control tools: data tables, Pareto analysis, scatter analysis, cause and effect analysis, trend analysis, histograms, and control charts.
Don’t Miss This in the ASQ Knowledge CenterThe ASQ Knowledge Center is your online resource for everything related to quality. Explore hot topics, tools, and real stories about quality improvement.
asq.org/knowledge-center
FEATURED CASE STUDY FEATURED WEBCAST
ASQ members are building the future of quality. Show your commitment to quality and give yourself a strong competitive advantage. Join today at asq.org/membership and help raise the voice of quality.
BENCHMARKING STUDYState of Benchmarking
Learn how organizations view and implement benchmarking activities. This report is a collection of key findings from the American Productivity and Quality Council’s (APQC) State of Benchmarking study. Full ASQ members can access more APQC content through the ASQ Knowledge Center.
Access this month’s featured content and more Web-exclusives in the ASQ Knowledge Center at asq.org/knowledge-center/featured.html.

Australia: StatSoft Pacific Pty Ltd.Brazil: StatSoft South America Ltda.Bulgaria: StatSoft Bulgaria Ltd.Chile: StatSoft South America Ltda.China: StatSoft China
Czech Rep.: StatSoft Czech Rep. s.r.o.Egypt: StatSoft Middle EastFrance: StatSoft FranceGermany: StatSoft GmbHHungary: StatSoft Hungary Ltd.
India: StatSoft India Pvt. Ltd.Israel: StatSoft Israel Ltd.Italy: StatSoft Italia srlJapan: StatSoft Japan Inc.Netherlands: StatSoft Benelux
Norway: StatSoft Norway ASPoland: StatSoft Polska Sp. z o.o.Portugal: StatSoft Iberica LdaRussia: StatSoft RussiaS. Africa: StatSoft S. Africa (Pty) Ltd.
Spain: StatSoft Iberica Lda Sweden: StatSoft Scandinavia ABTaiwan: StatSoft TaiwanUnited Kingdom: StatSoft Ltd.USA: StatSoft, Inc.
Headquarters: StatSoft, Inc. • 2300 E 14 St • Tulsa, OK 74104 • USA • +1 (918) 749-1119 • [email protected] • www.statsoft.com
StatSoft, STATISTICA is a trademark of StatSoft, Inc. © StatSoft, Inc 1984-2012