Phosphorus Digestibility of Inorganic Phosphorus Sources ...

Quality of Phosphorus
Sources
Ken Bruerton
Protea Park Nutrition Services
2009

Phosphate Supplements
• There are many phosphorus supplements available for feeding to cattle, ranging from 24% P to 14% P.
• Monosodium phosphate - benchmark
• Monocalcium phosphate (MCP)
• Monodicalcium phosphate (MDCP)
• Dicalcium phosphate dihydrate (DCPh)
• Dicalcium phosphate anhydrous (DCPa)
• Tricalcium phosphate (TCP)
• Rock Phosphate
• Fertilizer forms (superphosphate, MAP, DAP)

Phosphate Supplements
DCP MCP MDCP
European

DCP

MDCP

MCP
Kynofos

Composition of P supplements
Name Calcium % Phosphorus % Other Content %
Monosodium phosphate 0 24 Na - 19
Monocalcium phosphate 15 23 F < 0.2%
Monodicalcium phosphate 16 21 F <0.2%
Dicalcium phosphate dihydrate 24 18 Mg, F <2%
Dicalcium phosphate anhydrous 24 18 Mg, F <2%
Tricalcium phosphate 32 16 Mg, F
Rock phosphate 32 14 F 3-4%, Mg 3-5%

What about P from bone meal?
• If it is imported it is absolutely not to be
used for ruminants because of the risk of
transmission of BSE.
• BSE prions are not destroyed by rendering
temperatures,
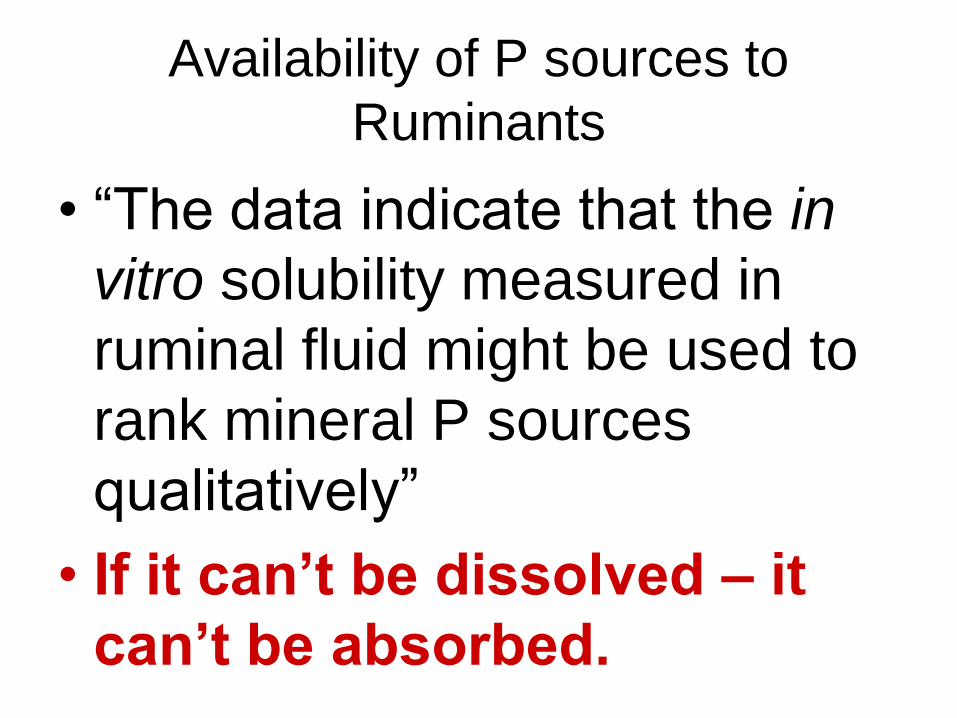
Availability of P sources to
Ruminants
• “The data indicate that the in
vitro solubility measured in
ruminal fluid might be used to
rank mineral P sources
qualitatively”
• If it can’t be dissolved – it
can’t be absorbed.
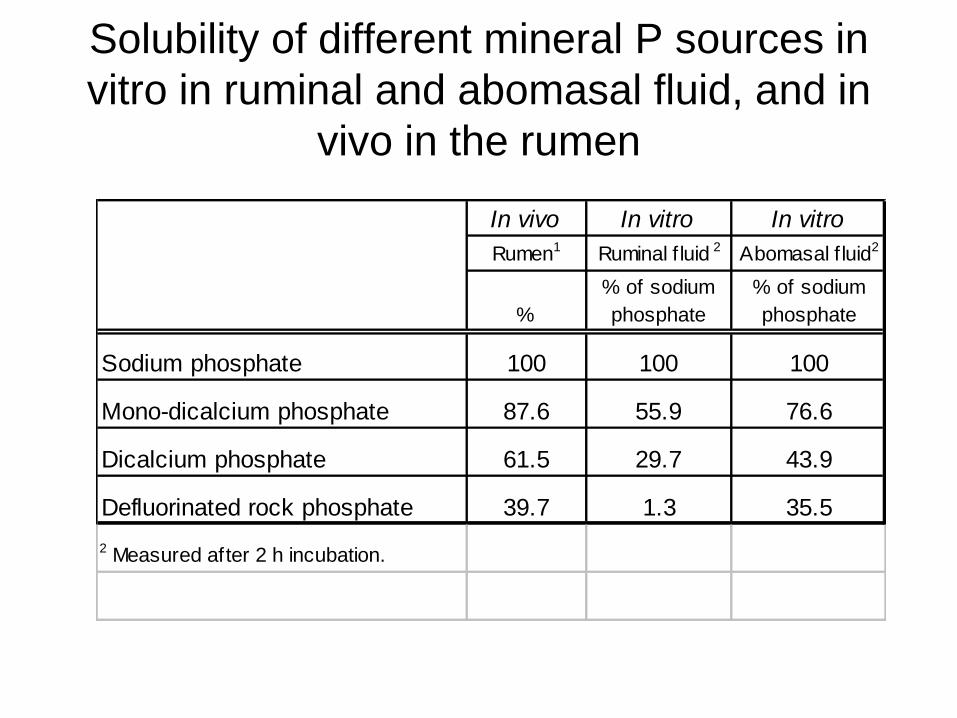
Solubility of different mineral P sources in
vitro in ruminal and abomasal fluid, and in
vivo in the rumen
In vivo In vitro In vitro
Rumen1 Ruminal f luid 2 Abomasal f luid2
%
% of sodium
phosphate
% of sodium
phosphate
Sodium phosphate 100 100 100
Mono-dicalcium phosphate 87.6 55.9 76.6
Dicalcium phosphate 61.5 29.7 43.9
Defluorinated rock phosphate 39.7 1.3 35.5
2 Measured after 2 h incubation.

Balance trials Mobile nylon bag
Feed True absorption of P (%) Total availability of P (%)
Roughages 64-76 83-97
67-80
84-94
Oilseeds meal/cake 70-81
Grain and peas 71-79
Milling products 64 1 78�/93 7 64 78-93
Mineral P* 29-100
Monosodium phosphate 62 100
Monocalcium phosphate 74
Dicalcium phosphate 62 30
Dicalcium phosphate 68
Tricalcium phosphate 65
Superphosphate 70
65
Monoammunium phosphate 59
58
Urea phosphate 62
Modified from: Sehested, J. Animal Sci. 54: 169-180 (2004)
Total availability (%), and true absorption of P

Analysis of MDCP and Kynofos 21
samples from Brisbane Export
Phosphorus (P) 20.2 21.17 %
Calcium (Ca) 16.5 16.54 %
Magnesium (Mg) 0.7 1.7
Rel. solubility of P in water 66 74 %
Rel. solubility of P in citric acid 94 99 %
Fluorine (F) 0.19 0.07 max 0.2 %
Arsenic (As) 13 1.75 max 10 ppm
Cadmium (Cd) 4.5 1.43 max 10 ppm
Lead (Pb) 3 13 max 15 ppm
X-ray diffraction
CaCO3 12 6-Sep %
DCP anhydrate 22 17-33 %
MCP 44 52 - 68 %
CaSO4 / Bassanite 11 7 %
Potassium Al Hydrogen P 3 - %
UnitMDCP Kynofos
21
EU
Standards

What do we see from Analysis?
• BEC Feedsolutions over the years have
conducted over 14,000 tests on minerals.
• On Phosphate supplements, over 220
tests for Ca, P and Mg have been done
since 2005.
• The method used is ICP
• Tests for Fluorine cannot be done by this
method – hence no results.

MDCP Analyses
10.0
12.0
14.0
16.0
18.0
20.0
22.0
24.0
Cus
t sam
ple
GR26
635
GR28
337
R29
496
Cus
t sam
ple
ex stoc
k
Mar
-07
1641
5
2766
8
2742
6
2743
4
2765
6
2766
0
2850
6
2851
7
1405
08
HH02
1208
2009
0401
Samples
%
%Ca
%P
Ca Spec
P SpecKynofos

DCP Analyses
0.0
5.0
10.0
15.0
20.0
25.0
30.0
35.0
40.0
45.0
GR26
750
(Chine
se orig
in)
GR29
061
R265
5
RTL24
28
Mar-0
7
2343
7101
516
2008
0304
7103
73
2008
0425
6448
5
2008
6640
2008
0506
2008
215
2008
0610
6100
8
2008
0628
2008
0072
7
2008
0628
2008
215
2991
Samples
%
%Ca
%P
Ca Spec
P Spec

DCP Analyses
0.0
5.0
10.0
15.0
20.0
25.0
30.0
35.0
40.0
45.0
GR26
750
(Chine
se orig
in)
GR29
061
R265
5
RTL24
28
Mar-0
7
2343
7101
516
2008
0304
7103
73
2008
0425
6448
5
2008
6640
2008
0506
2008
215
2008
0610
6100
8
2008
0628
2008
0072
7
2008
0628
2008
215
2991
Samples
%
%Ca
%P
Ca Spec
P Spec
TCP??
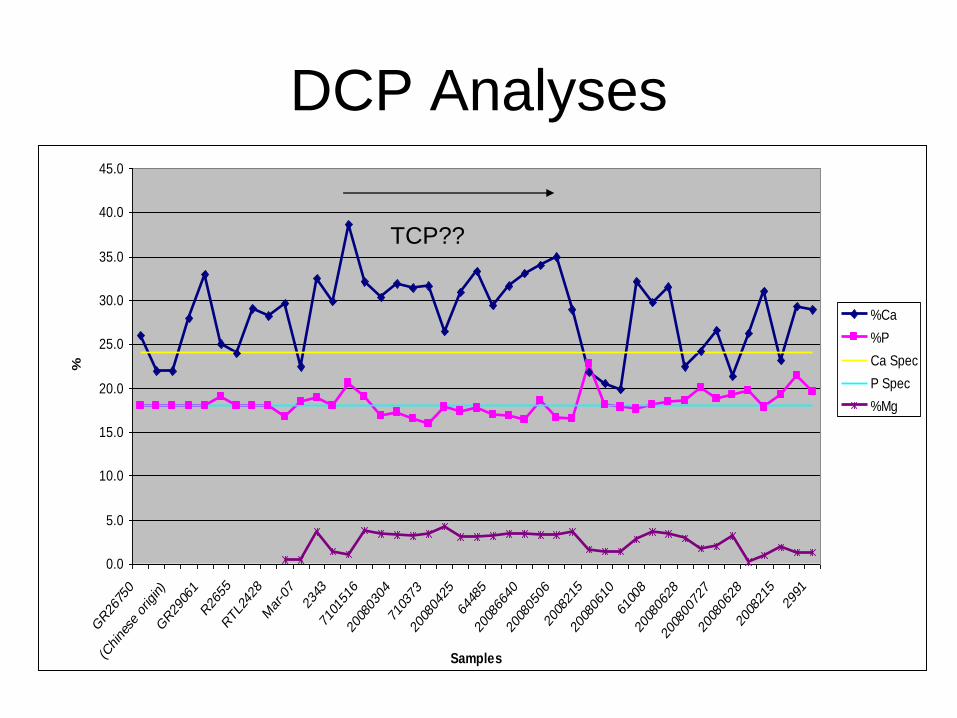
DCP Analyses
0.0
5.0
10.0
15.0
20.0
25.0
30.0
35.0
40.0
45.0
GR26
750
(Chine
se orig
in)
GR29
061
R26
55
RTL2
428
Mar-0
7
2343
7101
516
2008
0304
7103
73
2008
0425
6448
5
2008
6640
2008
0506
2008
215
2008
0610
6100
8
2008
0628
2008
0072
7
2008
0628
2008
215
2991
Samples
%
%Ca
%P
Ca Spec
P Spec
%Mg
TCP??
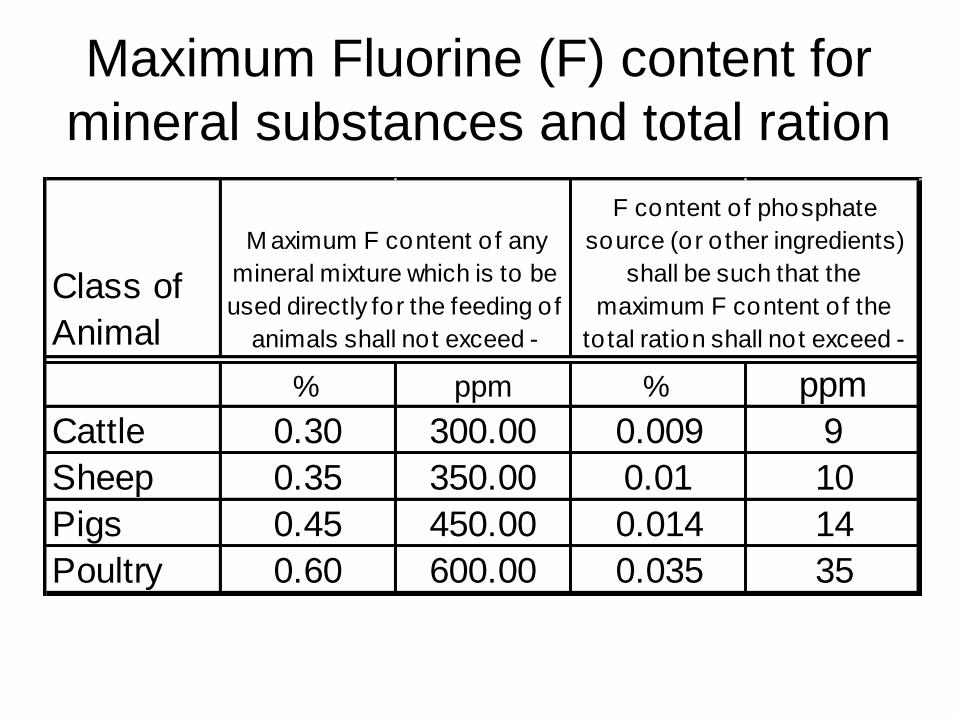
Maximum Fluorine (F) content for
mineral substances and total ration
Class of
Animal
% ppm % ppm
Cattle 0.30 300.00 0.009 9
Sheep 0.35 350.00 0.01 10
Pigs 0.45 450.00 0.014 14
Poultry 0.60 600.00 0.035 35
F content of phosphate
source (or other ingredients)
shall be such that the
maximum F content of the
total ration shall not exceed -
M aximum F content of any
mineral mixture which is to be
used directly for the feeding of
animals shall not exceed -

Is fluorine a potential Problem?
• A typical lick intake is 200 g/h/d and delivers ~4 g of P.
• Therefore a lick must contain 19g of kynofos /200g (9.5%)
• Rock phosphate contains 14% P and requires 28.6g in 200 g of lick to deliver 4 g of P.
• Rock phosphate can be up to 2-4% F
• = 20-40 g F/kg = 20-40 mg F/g
• Assuming the rock phos is 2% F, at 28.6 g/200 g, the F content would be 570 mg/200g or 2850 mg/kg, which is >9 times the US limit
• Kynofos is 0.13% F = 1.3 g/kg = 1.3 mg/g. At 9.5% inclusion the concentration of F in the kynofos lick <125 mg/kg

Cost Effectiveness
Phosphate source Price P content
P
digestibility Dig. P
Cost/g
Dig P
c/kg g/kg % g/kg c/g
MDCP (kynofos) 130 210 75.00% 157.5 0.825
DCP 90 180 60.00% 108 0.833
TCP 60 160 45.00% 72 0.833
Rock Phosphate 48 140 30.00% 42 1.143
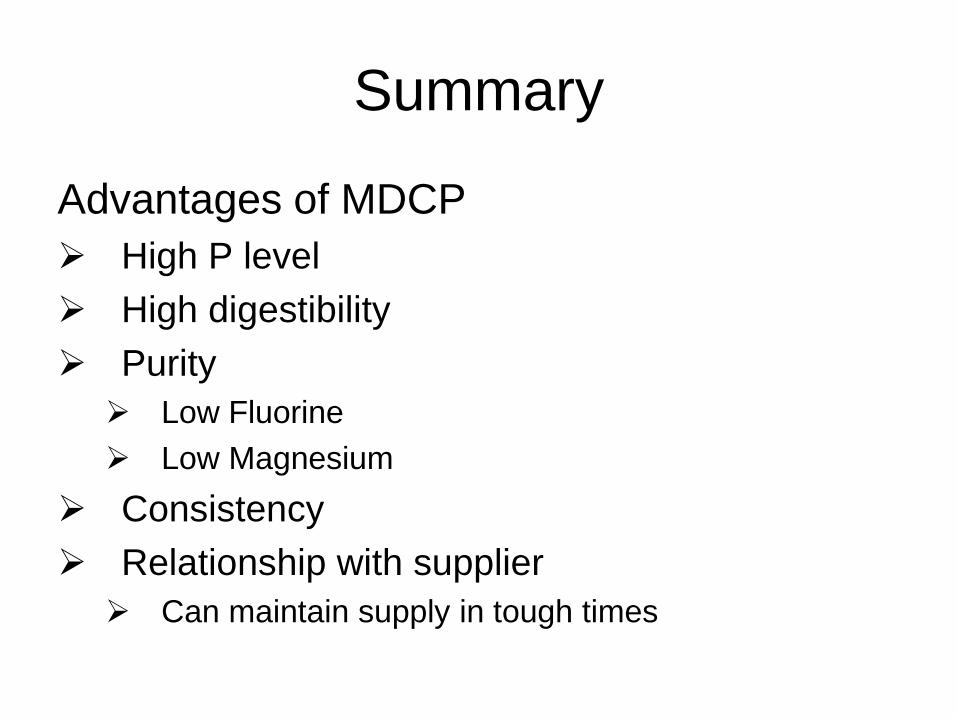
Summary
Advantages of MDCP
High P level
High digestibility
Purity
Low Fluorine
Low Magnesium
Consistency
Relationship with supplier
Can maintain supply in tough times