Quality of Labor, Capital, and Productivity Growth in … RIETI Discussion Paper Series 11-E-036...
30
DP RIETI Discussion Paper Series 11-E-036 Quality of Labor, Capital, and Productivity Growth in Japan: Effects of employee age, seniority, and capital vintage SHINADA Naoki Development Bank of Japan The Research Institute of Economy, Trade and Industry http://www.rieti.go.jp/en/
Transcript of Quality of Labor, Capital, and Productivity Growth in … RIETI Discussion Paper Series 11-E-036...

DPRIETI Discussion Paper Series 11-E-036
Quality of Labor, Capital, and Productivity Growth in Japan: Effects of employee age, seniority, and capital vintage
SHINADA NaokiDevelopment Bank of Japan
The Research Institute of Economy, Trade and Industryhttp://www.rieti.go.jp/en/

1
RIETI Discussion Paper Series 11-E-036
March 2011
Quality of Labor, Capital, and Productivity Growth in Japan: Effects of employee age, seniority, and capital vintage
SHINADA Naoki
Development Bank of Japan
Abstract
An aging population, low fertility rate, and suppressed corporate investment have left
Japan with an older workforce and older vintages of fixed capital. To restore economic
dynamism, Japan must encourage productivity growth.
Using panel data of listed Japanese firms in FY 1977–2008, this paper demonstrates
how both employee age and capital vintage affect the quality of labor and capital that
influence productivity. Our research contributes three significant findings. (1) The older
the average age of a firm’s employees or the longer their seniority, the higher the firm’s
productivity growth, but it is unclear if the effects peak at specific ages. (2) The positive
effects of employees’ increasing age and seniority and the negative effect of older capital
on Japan’s productivity growth have declined since the 1990s. (3) These effects have been
larger among manufacturers than non-manufacturers.
Negative effects of increasing non-regular workers should be addressed, and it is
further important for Japanese firms to organize and manage labor skills and enhance
knowledge, rather than depend on technology accumulated over time.
Keywords: productivity, labor, capital, employee age, seniority, and capital vintage.
JEL classification: D24; E22; E23; E24; J24
RIETI Discussion Paper Series aims at widely disseminating research results in the form of professional
papers, thereby stimulating lively discussion. The views expressed in the papers are solely those of the
author and do not represent those of the Research Institute of Economy, Trade and Industry.
The author thanks many supporters from RIETI and is grateful for comments and suggestions by
Masahisa Fujita, Hiroshi Yoshikawa, Masayuki Morikawa, and seminar participants at RIETI.

2
1. Introduction
Faced with a rapidly aging population and low fertility rate, Japan must
enhance productivity growth to maintain economic dynamism. Previous literature has
mentioned Japan’s historical trends in productivity growth, and numerous empirical
studies have suggested that deterioration in productivity growth is a factor in Japan’s
long-term recession and lower economic growth since the 1990s. Within the framework
of growth accounting analysis, this means that contributions other than changes in
quantities of production inputs such as labor, capital, and intermediate goods to overall
growth in output—i.e., total factor productivity (TFP)—have weakened since the 1990s.
Many previous studies examined the problem of lower productivity growth, and some
attribute its causes to slowdowns in technological progress, declining quality of labor,
and reduced performance of capital equipment.
Japan’s aging population makes any decline in labor quality a greater detriment
to productivity growth. Technology, skills, and job experience embodied in the labor
force are related to employee productivity, and their contributions to productivity have
changed due to aging of Japan’s working population, revisions in Japan’s traditional
seniority system, and deregulation of contract employees. That results not only in more
flexibility and mobility in labor force but also in changing the effects of labor input
quality on corporate productivity.
Quality of capital inputs also influences productivity. Japan’s economic
slowdown has been prolonged, corporate fixed investment has been suppressed, and
firms are reluctant to renew capital equipment. As a result, Japan’s capital stock ages,
and its contribution to productivity declines.
Changes in quality of labor and capital inputs are related to job experience,

3
firm-specific skills, and fixed productive equipment. These factors are time
dependent—they accumulate or decrease over time. Structural changes in Japan’s
economy have considerably influenced time-dependent labor and capital input quality
and the relationship of changes in quality to productivity growth. This study aims to
capture changes in quality of these production inputs by measuring employee age,
seniority, and capital vintage and by examining their effects on productivity growth.
Previous studies have analyzed separate effects of changes in quality of labor
and capital input, including the age of employees and capital, using macro-, industry-,
and firm-level data. This study uses a single dataset compiled from financial statements
for FY 1976–2008 of Japan’s publicly listed manufacturing and non-manufacturing
firms. It demonstrates the effects of changes in quality of labor and capital inputs,
particularly average age and seniority of employees and capital vintage, on TFP growth.
An advantage of this study is that a single dataset captures the comprehensive effects of
quality changes relevant to employees’ age and seniority, sampled period, and industry.
Our findings extend the results and implications of previous literature.
This paper proceeds as follows. Section 2 reviews previous literature
concerning the relationships among productivity and employee age, seniority, and
capital vintage, focusing on firm-level empirical studies of Japanese firms. Section 3
defines specifications of the models we estimate for our sample panel data. Section 4
explains the data construction for estimating the models. Section 5 explains descriptive
statistics and trends of variables used for the estimation. Section 6 demonstrates the
estimation results of our panel data analysis. Section 7 concludes with a summary of our
findings and comments on their implications.

4
2. Previous literature
2-1. Age- and seniority-productivity profiles
Influenced by the theoretical background of human capital that stems from
Becker (1964), many economists have studied the relationship between employee age
and productivity growth. Firms invest in job education and training of their employees,
and the employees take time enough to acquire general or firm-specific skills and
knowledge. They use their skills and knowledge to earn profits, and are able to increase
profitability if they succeed in developing their skills and knowledge over time.
Economists generally consider that higher wages reflect increased profitability
generated by the skills and knowledge that employees develop. Mincer (1974) and
related studies demonstrate a positive relationship between wages and the extent of
education and job experience.
On the other hand, Hellerstein and Neumark (1995) considered the relationship
between employees’ age and productivity or wages rather than the direct relationship
between wages and productivity. They estimated marginal productivity differentials
between employees of different ages through a production function approach to firms'
technologies. Using 1998 data from 933 Israeli firms, they demonstrated an upward
slope in productivity profiles and earnings against age classes, which means that the
relative marginal productivity of unskilled employees (age 35–54) is greater than that
for younger skilled employees but less than that for employees 55 or older.
However, Hellerstein and Neumark (2004) used a larger individual-level
dataset of 26,031 employees in the U.S. in 1990 to find that the estimated productivity
and wage profiles are concave with respect to age, with the age-productivity profile
peaking among employees aged 35–54 years. Using matched employer–employee data

5
from Finnish manufacturers in 1988–1994, Ilmakunnas, Maliranta, and Vainiomäki
(2004) examined the relationships of employees’ age and seniority and plant
characteristics to plant performance such as productivity and wages. They found that
age-productivity and seniority-productivity profiles are concave with respect to age. The
age-productivity profile peaks at 33 years, and the seniority-productivity profile peaks at
2.5 years.
Kawaguchi et al. (2006) constructed a Japanese employer–employee-matched
dataset from 1993 to 2003. They also demonstrated that the seniority-productivity
profile is concave, peaking at about 20 years of experience, corresponding to 40 years of
age. They also demonstrated that the slope of the profile for 20 years or less is steeper
than the slope for 20 years or more. Ochiai (2008) divided a dataset into two groups of
employees—younger and older than age 40—to demonstrate that the older group has
higher productivity. Shirakawa (2009) used industry-level data from the Japan Industrial
Productivity (JIP) database compiled by RIETI and also found that TFP peaks at an
average employee age of 45.8 years. Jinno (2009) conducted a similar industry-level
study to show that employee maximum productivity is attained at age 35–54 years, the
second-highest at age 55 years or older, and the lowest at age 35 years or younger.
Thus, empirical studies have adopted varying approaches toward
age-productivity and seniority-productivity profiles, but the consensus is that
productivity is concave with respect to age and that productivity peaks for employees in
their thirties and forties.
2-2. Capital vintage
Previous literature has also investigated the effect of changes in quality of

6
capital. Scholars are of the opinion that certain types of technological progress are
embodied in capital and contribute to productivity growth. Among the popular
frameworks for investigating embodied technological change is to capture decay of
capital by estimating ages of production facilities. According to the concept of vintage
capital proposed by Solow (1960) and Nelson (1964), an installation of new capital
equipment increases productivity, and firm-level productivity will be higher as the
average vintage of capital decreases.
Many industry- and firm-level studies have empirically examined relationships
between vintages of capital and productivity. Sakellaris (2001) introduced a framework
around Nelson’s (1964) concept that negative effects of the average age of capital stock
on productivity provide evidence of embodiment. Using a plant-level dataset from U.S.
manufacturing plants in 1974–1988, he demonstrated that an increase in the average age
of equipment stock, indicating the rate of embodied technological change, has a positive
influence on economic growth. Similarly, Bahk and Gort (1993) used data of 2,150 U.S.
plants in 1972–1986 to show that technical change embodied in capital as measured by
average vintage is associated with a 2.5 to 3.5 percent change in output for each
one-year change in average vintage.
Using the JIP and Japan Center for Economic Research (JCER) databases
released by JCER, Miyagawa and Hamagata (2006) estimated vintages of Japanese
capital at the industry level and demonstrated that a change in vintages of machinery has
a larger positive elasticity versus a change in capital quality than that of buildings. Tokui,
Inui, and Kim (2007) studied the relationship between decay of capital and vintages.
Using Japan’s firm-level panel data in 1997–2002 obtained from the Basic Survey of
Japanese Business Structure and Activities by the Ministry of Economy, Trade and
7
Industry (METI), they estimated undecided capital for each vintage and the rate of
technological progress embodied in equipment as 0.2–0.4 percent. Tokui, Inui, and
Ochiai (2008) introduced a new dummy variable for capital decay, estimated from
Japanese firm-level panel data about investment spikes generated by large-scale
investment projects. They showed that the dummy variable for decay exposes a
slowdown in productivity growth, but the negative effect is weakened three years after
investment spikes.
3. Model specification
This study aims to capture the impact of changes in quality of labor and capital
on productivity growth by measuring average employee age and capital vintage at the
firm level. First, we define the concept of firm-level productivity that we seek to
measure. OECD (2001) offers two ways to measure productivity: by gross output and
by value added. Productivity is generally obtained from dividing gross output or value
added by production inputs, and, especially for firm-level measurement, revenue is used
for computing output basis. Value added is calculated from net profit and other items.
On the other hand, inputs such as labor, capital, and intermediate goods involve
several types of productivity. Assuming a standard production function in which firms
use multiple inputs to produce output, we obtain labor productivity, capital productivity,
intermediate goods productivity, and other productivity that contribute to output. In the
concept of growth accounting, other productivity is the Solow residual as TFP.
This study focuses on the effects of changes in quality of labor and capital on
TFP growth because labor productivity is affected by factors such as capital quality and
technological change included in TFP growth. In addition, output is calculated on a

8
value-added basis to address data limitations and difficulties estimating the contribution
of firm-level intermediate goods to output.
Assume the following Cobb–Douglas production function:
1,, ttKttLtt KQLQAY (1)
Y: Output, L: Labor input, K: Capital input, QL: Quality of labor, QK: Quality of
capital, α: Labor share.
To estimate effects of changes in employee age on productivity, previous
literature, such as Shirakawa (2009) and Jinno (2009), used datasets of proportions by
age cohort and applied them in Cobb–Douglas or general form production functions.
However, due to data limitation, we obtain only average age and seniority in each year
at a firm level, and we must define a single variable function that expresses quality of
labor input.
To express changes in vintage as quality of capital stock, Wolff (1996) and
Miyagawa and Hamagata (2006) used an exponential function with vintage. We adopt
this procedure for employee age on labor quality as well as for vintage of capital. Thus,
QL and QK, including time-variant variables that indicate quality of labor and capital
such as employees’ ages or seniority (W) and capital vintage (V), are defined as follows:
pttL WQ , (2)
qttK VQ , (3)
gtt eAA (4)

9
Equation (1) is transformed as follows:
ttKttLtt KQLQAY ln)1(ln)1(lnlnlnln ,, (5)
tKtLtt QQAA ,, ln)1(lnlnln (6)
ttt VqWpA ln)1(lnln (7)
A with a dot is TFP unadjusted by effects of quality changes of labor and capital.
Considering assumption (4) and α, which is labor share directly calculated from
corporate financial statements, a basic form for estimation is set as ln A.
t = C + β t + γ ln
Wt + δ ln Vt + ε (8).
4. Dataset and construction
4-1. Sampled firms
Our sample consists of listed Japanese companies in FY 1976–2008, financial
statement data for which come from the Corporate Financial Databank of the
Development Bank of Japan (DBJ). This database covers all listed Japanese firms,
excluding financial institutions, from FY 1956, but our sample covers FY 1976–2008
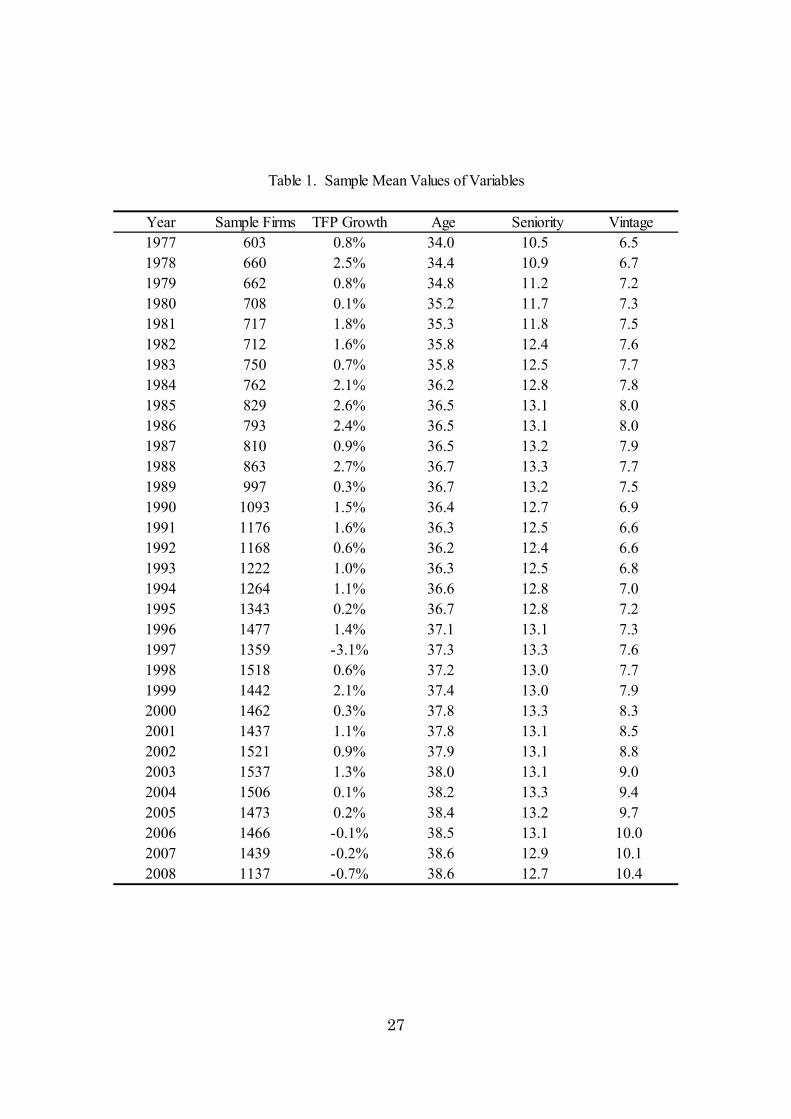
due to limited availability of data pertinent to all variables in this study. As Table 1
shows, our unbalanced panel dataset includes 600–1,500 firms, enough to cover most
listed firms.
4-2. Labor input
10
Labor input is calculated by multiplying firm-level numbers of employees and
industry-level working hours per employee. Employees include full-time and part-time
employees disclosed in the sampled firms’ financial statements. Working hours,
obtained from the Monthly Labour Survey by the Ministry of Health, Labour and
Welfare (MHLW), include scheduled and non-scheduled hours worked.
4-3. Capital input
We estimate capital input by multiplying industry-level capacity utilization
rates and firm-level real capital stock constructed from time-series data of fixed
investment in non-residential buildings, structures, machinery, transportation equipment,
and instruments and tools. For each asset, nominal gross investment is calculated as the
change in book value of net capital stock plus accounting depreciation. Real investment
is calculated by dividing nominal investment by the producer price index for the firm’s
industry.
Capital stock is calculated as follows:
1(1 )t t tK K I (9)
where Kt denotes real capital stock at the end of year t, It denotes real capital investment
in year t, and δ denotes depreciation rates. According to the method suggested by
Hayashi and Inoue (1991), we estimate real capital stock by considering physical
depreciation rates suggested by Hulten and Wykoff (1981), then we calculate capital
input by multiplying industry-level utilization rates and firm-level real capital stock.
Industry-level capacity utilization rates for manufacturing industries are
11
obtained from Reports on Industrial Production by METI, and we adjust its
industry-level categories to match the medium-level categories of the DBJ database.
Non-manufacturing capacity utilization rates are estimated by the method proposed in
Kamada and Masuda (2001). Their method uses production capacity given in the
Business Survey Index, a diffusion index of sufficiency of equipment, in the Business
Outlook Survey by the Ministry of Finance. Electricity power units for commercial
power in non-manufacturing sectors are regressed on a linear trend and on the
production capacity BSI, and utilization rates are obtained by removing the linear trend
and residuals.
4-4. TFP
TFP, derived from the firm’s production function, accounts for effects on total
output other than those caused by inputs. A Cobb–Douglas-type firm production
function is assumed as follows:
aa KLAY 1 (10)
Y denotes real output, K denotes capital input, and L denotes labor input. Real
output is defined as a firm’s nominal value added deflated by a wholesale price index
for a corresponding industry. Because the DBJ database contains information on factor
incomes from companies’ financial statements, a measure of nominal value added at
factor cost is constructed as the sum of expenditures on labor, rent, depreciation,
operating profits before interest, taxes and public charges, and patent licensing fees.
Assuming constant returns of scale, we calculate labor share, α, as the

12
average ratio of compensation in nominal value added during the sampled periods, and
obtain TFP, A.. It should be noted that A
. could include changes in quality of labor and
capital inputs other than those related to physical depreciation and changes in capacity
utilization rates and working hours.
4-5. Age and seniority of employees
Data for age and seniority of employees are obtained from the DBJ database,
which covers averages for age and seniority of each firm’s employees in each fiscal
year.
4-6. Capital vintage
Vintage of capital stock is estimated by the method proposed in Miyagawa and
Hamagata (2006) as follows:
tttttt KIRKVV /5.011 (11)
Vt is vintage of capital at period t, and Rt is the amount of depreciation in year t.
Vt is defined as a weighted average of years of undecayed capital stock from the
previous year and one-half of capital investment made in a current year.
Vi,1, a benchmark for capital vintage of firm i, is calculated as
1,1,1, 1ln/ln iii DRRMV (12)
1,1,
1,1,
ii
ii CUMNK
NKRM
(13)

13
1,1,
1,1,
ii
ii NKDP
DPDR
(14)
RMi,1 denotes the rate of assets of firm i not yet depreciated in a benchmark
year, DR1 is a depreciation rate in the benchmark year, NK1 is nominal assets in the
benchmark year, CUM1 is depreciated assets accumulated in the benchmark year, DP1 is
the amount of depreciated assets in the benchmark year. The benchmark year is the year
a firm is listed; i.e., capital vintage in the benchmark year is an approximation based on
accounting-based depreciation.
5. Descriptive statistics
5-1. TFP
Table 1 and Figure 1 show an average TFP growth rate of our sampled firms by
year. The growth rate remains around 1.0–1.5 percent during the late 1970s, increases
from the 1980s, and exceeds 2.0 percent in the late 1980s. After that, the rate starts to
decline, although it remains at 1.0 percent until the bubble era in the early 1990s. It
turns negative in the late 1990s following Japan’s banking crisis. In the early 2000s, the
growth rate recovers to around 1.0 percent, but it decreases again from the mid-2000s.
The year-on-year growth rate turns negative again since 2007.
Previous literature measures TFP by various methods, and figures for growth
rates depend on how they are measured. As one typical example, Jorgenson and
Motohashi (2005) estimate Japan’s macro-level TFP growth rate from 1975 to 2003.
Their estimates are 1.57 percent of the average TFP growth rate in 1975–1990 and 0.59
percent in 1990–2003. Our estimates of 1.48 percent in 1977–1990 and 0.74 percent in
14
1990–2003, although based on a different micro-level approach, are similar to theirs.
5-2. Employee age and seniority
According to annual averages for our sampled firms in Figure 2, the average
age of employees increased from around 34 years in the late 1970s to 36 years or older
in the early 1980s. Average age remained stable until the early 1990s, although it
declined during the bubble era from the late 1980s to early 1990s due to a surge in
employment. During the recession of the late 1990s, average age increased to 37 or
older, then continued to increase gradually, reaching approximately 38.5 years in 2008.
From the late 1970s to late 1990s, average seniority of employees displayed a
trend similar to average age: seniority increased from around 10.5 years in the late
1970s to 13 years in the early 1980s. It slowed in the late 1980s and declined to 12.5
years during the bubble era. Afterward, however, the trend differs from the trend in
average age. Until the mid-2000s, seniority generally remained unchanged, then it
decreased since 2005.
As described in Figure 3, these average trends from our sampled firms are
broadly consistent with macro-level trends obtained from the Basic Survey on Wage
Structure by MHLW. The background of the characteristic trends in the 2000s was as
follows: (a) Employment increased during the economic recovery phase. (b) Because
Japan’s employment situation has been more flexible and mobile since the early 2000s,
hiring of experienced mid-career employees has increased. (c) Non-regular employment
has increased due to deregulation.
Figure 4 describes average ratios for the number of non-regular employees,
including contract employees, versus all employees in our sampled firms and

15
macro-level data from the Labour Force Survey by the Ministry of Internal Affairs and
Communications. Both ratios trend upward from the 1980s; the ratio for the sampled
firms greatly increased in the early 2000s. The worker dispatching law revised in 1999
allowed hiring of more dispatched workers. This could explain the trends in average age
and seniority in our sample during the 2000s.
5-3. Capital vintage
Figure 5 shows that average capital vintage of our sampled firms increased
from around 6.5 years in the late 1970s to 8 in the mid-1980s. Thereafter, as corporate
fixed investment was encouraged, the vintage declined to around 6.5 years during the
bubble era. Following the bubble’s collapse in the early 1990s, the vintage of capital
stock consistently increased while flow-based capital expenditures followed the
pro-cyclical trend. The growth rate of investment continued to slow, and capital vintage
reached approximately 11 years in 2008.
6. Estimation results
For estimating the basic form of Equation (8), we adopt the method of GMM
estimation of dynamic panel models proposed by Arellano Bond (1991). The equation is
transformed to the first-difference form as ln at = C + γln wt + δln vt + ε (15),
removing a time trend and time-invariant firm characteristics (fixed effects)1, and ln at −
1 is included as an independent variable. According to Arellano and Bond (1991), we
use ln at − 2, ln Wt − 2, and ln Vt − 2 as instrument variables.
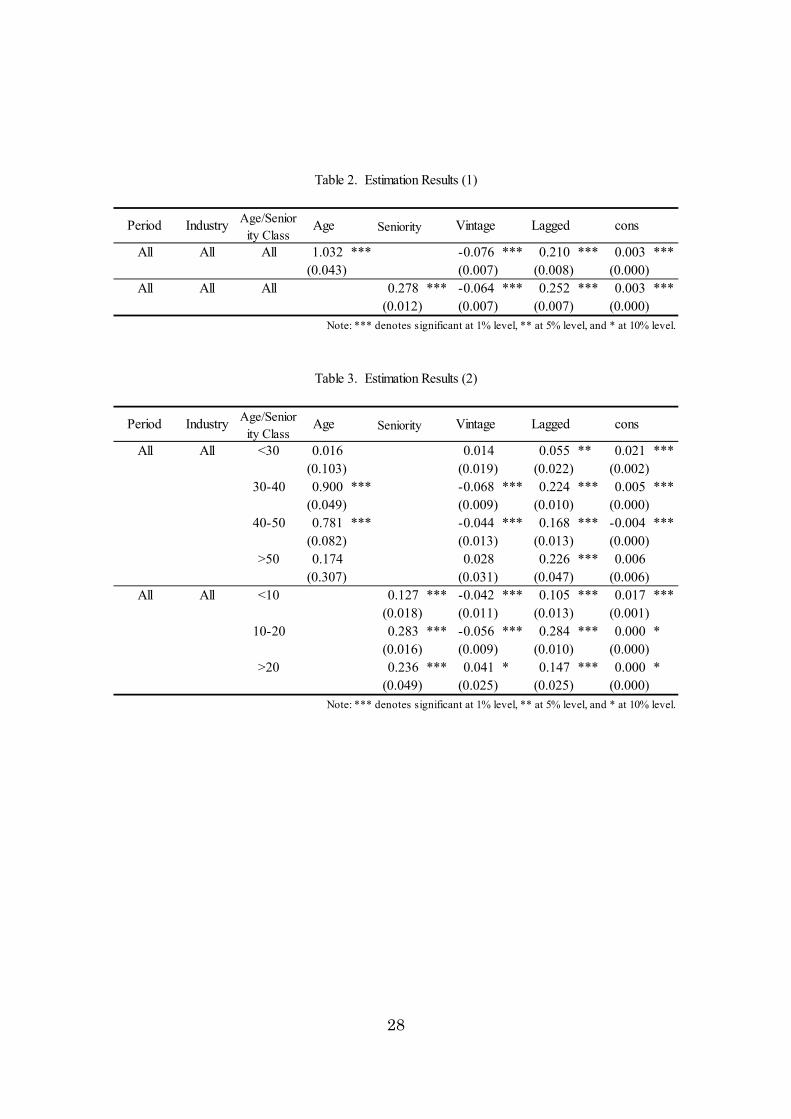
Table 2 shows the estimation result of our full sample for all periods within
1 In addition, industrial dummy variables are dropped because they have no significant effects on the dependent variable or show some collinearity.

16
FY 1977–2008. The estimated coefficient for average employee age is significantly
positive, while that for average capital vintage is significantly negative. This means the
TFP growth rate increases as average employee age rises, and the TFP growth rate
decreases as capital vintage extends. These findings coincide with the hypothesis and
empirical results of previous literature.
A similar significant relationship between average employee seniority and
TFP growth appears in the table. In the full sample, changes in seniority have a similar
positive effect on the productivity growth rate.
In terms of elasticity of changes in variables, it is estimated that the TFP
growth rate rises about 0.5 percent as average employee age increases one percent.2
TFP growth also rises about 0.13 percent as employees’ average seniority increases one
percent. On the other hand, TFP growth declines 0.04 percent as the vintage of capital
increases one percent.
Next, we divide our sample into multiple groups according to employees’
average age and seniority. In Table 3, the sample is divided into four age cohorts: <30,
30–40, 40–50, and >50 years. For the cohorts 30–40 and 40–50 years, the estimated
coefficient for average age is significantly positive, and that for capital vintage is
significantly negative. However, the results for employees <30 and >50 years indicate
that average age has a positive but insignificant influence on productivity growth. This
implies that employees <30 years had not accumulated job experience, knowledge, and
skills sufficient to enhance productivity growth apart from increases in their labor input
(such as hours worked). On the other hand, it could be more difficult for employees >50
to exercise their creativity in business, and their contribution from human capital to
2 The elasticity is calculated assuming the overall average labor share in the full sample and the overall average age that rises by one percent.

17
productivity growth could diminish. Because we use data of average employee age, not
detailed data for cohorts or individuals, the marginal effects of age on productivity
growth are unclear. However, the trend of our results generally coincides with previous
literature even though analytical approaches of previous studies differ from ours:3
productivity peaks around age 40.
Table 3 also shows subsamples for three seniority cohorts: <10, 10–20, and
>20 years. Among all three cohorts, coefficients for average seniority are significantly
positive, although the coefficient for the >20 cohort does not have the expected sign.
The seniority is positively correlated with human capital accumulation that contributes
to the productivity growth, unless mobility and flexibility of mid-career labor market is
considered.
Compared with average employee age, seniority has a consistent positive
influence on productivity over time. Numbers of contract employees have recently
grown rapidly, and labor mobility has increased. These are plausible reasons why
average seniority of sampled firms has been nearly flat or slightly declining in recent
years. If it is assumed that length of seniority reflects accumulated knowledge and skills
unique to a firm, a positive correlation between seniority and productivity growth would
weaken as labor mobility increases. This might decrease the size of the coefficient for
seniority in FY 1993–2008.
In Table 4, the sample is divided into two groups corresponding to business
cycles: FY 1977–1993 and FY 1993–2008. Concerning the estimation involving
average age and capital vintage, all coefficients of independent variables are significant
3 Previous studies observe a U-shaped curve in the distribution of TFP growth rates and employee ages, but they do not demonstrate significant negative effects of the older ages on the productivity growth from the panel analysis. Similarly, our results do not show such a significant negative effect, but they demonstrate that the positive effect is not significant.

18
with the expected signs. The coefficient for age in FY 1977–1993 is larger than that in
FY 1993–2008. This suggests that time-dependent human capital accumulation had
greater influence on productivity growth before Japan’s bubble than afterward. The
same relationship holds between higher seniority and productivity growth. In addition,
the effect of capital vintage on productivity growth after FY 1993 is smaller than before.
In general, it is said that the marginal effects of time-dependent endowments in labor
and capital become smaller.
The final sample is divided into two industry groups: manufacturing and
non-manufacturing. In both estimations, all variables have significant coefficients, and
signs are as expected. However, the coefficients are larger for manufacturing than for
non-manufacturing industries, suggesting that time-dependent accumulations of human
capital—job experience, knowledge, and skills—could be more easily embodied in
manufacturers’ capital equipment than among non-manufacturing industries. It also
implies that the negative effect of capital vintage on productivity growth is larger for
manufacturing industries, because manufacturers’ capital stock includes a large share of
machinery that depreciates quickly, while non-manufactures’ capital stock includes a
large share of buildings that depreciates slowly.
7. Conclusion
The estimation results are summarized as follows. Overall, a firm’s
productivity growth increases as its employees’ average age or seniority increases.
However, the relationship is unclear once average employee age exceeds a certain level.
The positive effect of Japanese employees’ increasing age and seniority and the negative
effect of older capital on Japanese productivity growth have been smaller since the

19
1990s. These effects are greater on productivity growth among manufacturers than
non-manufacturers.
Due to an aging population and low fertility rate, the average employee age in
Japan should continue to rise. Our empirical results suggest that the positive effect of
time-dependent human capital accumulation on productivity growth would wane, and
firms must enhance productivity without depending on employees simply accumulating
knowledge and skills over time.
The recent increase in numbers of contract employees challenges management
to maintain and enhance productivity. We find that the positive effect of seniority on
productivity growth is weaker among employees with less seniority, i.e., <10 years.
Deregulation of non-regular employees, including contract employees, since 1999 has
enhanced the flexibility of the labor market. In the short run, this presents firms with the
advantage of adjusting employment faster during recessions. In the long run, however, it
could be more difficult for firms to maintain some skills embodied in their labor force,
and that would tend to constrain productivity growth. Our empirical findings suggest
that the recent seniority effect is smaller than before. If the ratio of non-regular
employees continues to increase, problems such as intergenerational technology transfer
could spread over multiple industries.
It is also claimed that the number of younger non-regular employees has
increased. Our study implies that contract employees’ non-firm-specific knowledge and
skills have been more important and/or that firm-specific skills are maintained by
rehiring regular employees as contract employees. However, this situation presents
difficulties if the share of less mature, inexperienced, non-regular employees becomes
excessive. In the long run, policies are needed to handle these problems of non-regular

20
employees and productivity growth.
Apart from policy measures, as working population declines and it becomes
more difficult for firms to hire a younger labor force, firms should not depend
excessively on time-dependent accumulated human capital, which is often firm-specific.
Firms need to enhance productivity by organizing employees’ knowledge and skills and
managing them efficiently.
In addition, since the marginal positive effects of human capital accumulation
weaken over time among older employees, firms must deal with less flexibility in the
labor force. It is increasingly important for management to make optimal use of
employee innovation.
Moreover, the empirical results suggest that older vintages of capital
significantly decrease productivity growth. Therefore, efficient and effective investment
is important if firms are to maintain technological progress that leads to productivity
growth. According to our empirical findings, productivity growth in non-manufacturing
industries is less influenced by changes in quality of production factors over time than
manufacturing industries, so strategic investment is the key to enhancing productivity in
non-manufacturing industries.
To spur productivity growth, Japanese firms must organize and manage
enhanced labor skills and knowledge, not simply depend on technology accumulated
over time, and select and concentrate on efficient investment projects.

21
References
Bahk, Byong-Hyong and Michael Gort (1993), “Decomposing Learning by Doing in
New Plants,” Journal of Political Economy, 101-4, pp. 561-583.
Becker, Gary S. (1964), Human Capital: A Theoretical and Empirical Analysis with
Special Reference to Education, University of Chicago Press.
Hayashi, Fumio and Toru Inoue (1991), “The Relation between Firm Growth and Q
with Multiple Capital Goods: Theory and Evidence from Panel Data on Japanese
Firms,” Econometrica, 50, pp. 213-224.
Hellerstein, Judith K. and David Neumark (1995), “Are Earnings Profiles Steeper Than
Productivity Profiles? Evidence from Israeli Firm-Level Data,” The Journal of
Human Resources, 30, pp. 89-112.
Hellerstein, Judith K. and David Neumark (2004), “Production Function and Wage
Equation Estimation with Heterogeneous Labor: Evidence from a New Matched
Employer-Employee Data Set,” NBER Working Paper, 10325.
Hulten, Charles R. and Frank C. Wykoff (1981), “The Measurement of Economic
Depreciation,” in C. R. Hulten ed. Depreciation, Inflation and the Taxation of Income
from Capital, The Urban Institute Press.
Ilmakunnas, Pekka, Mika Maliranta, and Jari Vainiomaki (2004), “The roles of
employer and employee characteristics for plant productivity,” Journal of
Productivity Analysis, 21-3, pp. 249–276.
Jinno, Masatoshi (2009), “Estimates of Labor Productivity from the Perspective of Age
Groups,” Is the Aging of Society a Threat to Japan?: Increasing Productivity in the
Next Decade is the Key, NIRA Report.

22
Kamada, Koichiro and Kazuto Masuda (2001), “Effects of Measurement Error on the
Output Gap in Japan,” Bank of Japan Monetary and Economic Studies, 19-2, pp.
109-54.
Kawaguchi, Daiji, Ryo Kambayashi, Young Gak Kim, Heog Ug Kwon, Satoshi
Shimizutani, Kyoji Fukao, Tatsuji Makino and Izumi Yokoyama (2006), “Does
Seniority-based Wage Differ from Productivity? (in Japanese),” Hi-Stat Discussion
Paper Series, 189.
Mincer, Jacob A. (1974), Schooling, Experience and Earning, Columbia University
Press.
Miyagawa, Tsutomu and Sumio Hamagata (2006), “Vintage Capital and Replacement
Investment Cycle (in Japanese),” JCER Discussion Paper, 94.
Nelson, Richard R. (1964) “Aggregate Production Functions and Medium-Range
Growth Projections,” The American Economic Review, 54, pp. 575-606.
Ochiai, Katsuaki (2008), “Where is the Key to Improve Productivity?: An Analysis on
Gender, Education, and Seniority (in Japanese),” Human Capital for the Future in
Japan (in Japanese), JCER Report, pp. 29-47.
OECD (2001), Measuring Productivity OECD Manual: Measurement of Aggregate and
Industry-level Productivity Growth, OECD Publishing.
Sakellaris, Plutarchos (2001), “Production Function Estimation with Industry Capacity
Data,” Finance and Economics Discussion Series, Board of Governors of the Federal
Reserve System, 2001-06.
Shirakawa, Hiromichi (2009), “Empirical Analysis of Relationship between Worker Age,
Productivity, and Real Wages,” Is the Aging of Society a Threat to Japan?:
Increasing Productivity in the Next Decade is the Key, NIRA Report.

23
Solow, Robert M. (1960), “Investment and Technical Progress,” in Arrow, K., Karlin, S.,
and Suppes, P. eds. Mathematical Methods in the Social Sciences. Stanford
University Press, pp. 89–104.
Tokui, Joji, Tomohiko Inui, and Young Gak Kim (2007), “Embodied Technological
Progress and Average Capital Vintage (in Japanese),” RIETI Discussion Paper Series,
07-J-035.
Tokui, Joji, Tomohiko Inui, and Katsuaki Ochiai (2008), “Capital Vintage, R&D, and
Productivity: Investment Spike Analysis for Multiple Capital Goods (in Japanese),”
JCER Economic Journal, 59, pp. 1-21.
Wolff, Edward N. (1996), “The Productivity Slowdown: The Culprit at Last?:
Follow-Up on Hulten and Wolff,” The American Economic Review, 86-5, pp.
1239-1252.

24
-1.0%
-0.5%
0.0%
0.5%
1.0%
1.5%
2.0%
2.5%
3.0%
1977 1981 1985 1989 1993 1997 2001 2005
Figure 1: TFP growth rate, 3-year moving avg.(Sample firms)
10.0
10.5
11.0
11.5
12.0
12.5
13.0
13.5
32.0
33.0
34.0
35.0
36.0
37.0
38.0
39.0
1977 1981 1985 1989 1993 1997 2001 2005
Figure 2: Average age and seniority of employees(Sample firms, years)
Age Seniority (RHS)

25
9.0
9.5
10.0
10.5
11.0
11.5
12.0
12.5
36.0
37.0
38.0
39.0
40.0
41.0
42.0
43.0
1981 1985 1989 1993 1997 2001 2005
Figure 3: Average age and seniority of employees(Macro-level, years)
Age Seniority (RHS)
0%
5%
10%
15%
20%
25%
30%
35%
1977 1981 1985 1989 1993 1997 2001 2005
Figure 4: Non-regular employees ratio(Sample firms & macro-level, percent)
Sample firms Macro-level

26
6.0
7.0
8.0
9.0
10.0
11.0
12.0
1977 1981 1985 1989 1993 1997 2001 2005
Figure 5: Average vintage of capital(Sample firms, years)
27
Year Sample Firms TFP Growth Age Seniority Vintage1977 603 0.8% 34.0 10.5 6.51978 660 2.5% 34.4 10.9 6.71979 662 0.8% 34.8 11.2 7.21980 708 0.1% 35.2 11.7 7.31981 717 1.8% 35.3 11.8 7.51982 712 1.6% 35.8 12.4 7.61983 750 0.7% 35.8 12.5 7.71984 762 2.1% 36.2 12.8 7.81985 829 2.6% 36.5 13.1 8.01986 793 2.4% 36.5 13.1 8.01987 810 0.9% 36.5 13.2 7.91988 863 2.7% 36.7 13.3 7.71989 997 0.3% 36.7 13.2 7.51990 1093 1.5% 36.4 12.7 6.91991 1176 1.6% 36.3 12.5 6.61992 1168 0.6% 36.2 12.4 6.61993 1222 1.0% 36.3 12.5 6.81994 1264 1.1% 36.6 12.8 7.01995 1343 0.2% 36.7 12.8 7.21996 1477 1.4% 37.1 13.1 7.31997 1359 -3.1% 37.3 13.3 7.61998 1518 0.6% 37.2 13.0 7.71999 1442 2.1% 37.4 13.0 7.92000 1462 0.3% 37.8 13.3 8.32001 1437 1.1% 37.8 13.1 8.52002 1521 0.9% 37.9 13.1 8.82003 1537 1.3% 38.0 13.1 9.02004 1506 0.1% 38.2 13.3 9.42005 1473 0.2% 38.4 13.2 9.72006 1466 -0.1% 38.5 13.1 10.02007 1439 -0.2% 38.6 12.9 10.12008 1137 -0.7% 38.6 12.7 10.4
Table 1. Sample Mean Values of Variables
28
Period Industry Age/Seniority Class
Age Seniority Vintage Lagged cons
All All All 1.032 *** -0.076 *** 0.210 *** 0.003 ***(0.043) (0.007) (0.008) (0.000)
All All All 0.278 *** -0.064 *** 0.252 *** 0.003 ***(0.012) (0.007) (0.007) (0.000)
Note: *** denotes significant at 1% level, ** at 5% level, and * at 10% level.
Period Industry Age/Seniority Class
Age Seniority Vintage Lagged cons
All All <30 0.016 0.014 0.055 ** 0.021 ***(0.103) (0.019) (0.022) (0.002)
30-40 0.900 *** -0.068 *** 0.224 *** 0.005 ***(0.049) (0.009) (0.010) (0.000)
40-50 0.781 *** -0.044 *** 0.168 *** -0.004 ***(0.082) (0.013) (0.013) (0.000)
>50 0.174 0.028 0.226 *** 0.006(0.307) (0.031) (0.047) (0.006)
All All <10 0.127 *** -0.042 *** 0.105 *** 0.017 ***(0.018) (0.011) (0.013) (0.001)
10-20 0.283 *** -0.056 *** 0.284 *** 0.000 *(0.016) (0.009) (0.010) (0.000)
>20 0.236 *** 0.041 * 0.147 *** 0.000 *(0.049) (0.025) (0.025) (0.000)
Note: *** denotes significant at 1% level, ** at 5% level, and * at 10% level.
Table 2. Estimation Results (1)
Table 3. Estimation Results (2)

29
Period Industry Age/Seniority Class
Age Seniority Vintage Lagged cons
1977-1993 All All 1.201 *** -0.071 *** 0.324 *** -0.001 **(0.070) (0.016) (0.014) (0.000)
1993-2008 0.507 *** -0.030 *** 0.128 *** 0.006 ***(0.058) (0.009) (0.009) (0.000)
1977-1993 All All 0.396 *** -0.149 *** 0.357 *** -0.001 *(0.023) (0.021) (0.014) (0.000)
1993-2008 0.127 *** -0.014 * 0.147 *** 0.006 ***(0.016) (0.008) (0.009) (0.000)
Note: *** denotes significant at 1% level, ** at 5% level, and * at 10% level.
Period Industry Age/Seniority Class
Age Seniority Vintage Lagged cons
All Manufacturing All 1.115 *** -0.062 *** 0.239 *** -0.002 ***(0.056) (0.011) (0.009) (0.000)
Non-manufacturing 0.741 *** -0.065 *** 0.143 *** 0.008 ***(0.056) (0.009) (0.011) (0.000)
All Manufacturing All 0.360 *** -0.072 *** 0.253 *** -0.001 ***(0.018) (0.011) (0.009) (0.000)
Non-manufacturing 0.165 *** -0.041 *** 0.176 *** 0.008 ***(0.015) (0.008) (0.011) (0.000)
Note: *** denotes significant at 1% level, ** at 5% level, and * at 10% level.
Table 4. Estimation Results (3)
Table 5. Estimation Results (4)