Quality of Financial Sector Regulation and Supervision Around · PDF fileQuality of Financial...
47
Quality of Financial Sector Regulation and Supervision Around the World Martin Čihák and Alexander Tieman WP/08/190
Transcript of Quality of Financial Sector Regulation and Supervision Around · PDF fileQuality of Financial...

Quality of Financial Sector Regulation andSupervision Around the World
Martin Čihák and Alexander Tieman
WP/08/190


© 2008 International Monetary Fund WP/08/190 IMF Working Paper Monetary and Capital Markets Department
Quality of Financial Sector Regulation and Supervision Around the World
Prepared by Martin Čihák and Alexander Tieman1
Authorized for distribution by Mark W. Swinburne
August 2008
Abstract
This Working Paper should not be reported as representing the views of the IMF. The views expressed in this Working Paper are those of the author(s) and do not necessarily represent those of the IMF or IMF policy. Working Papers describe research in progress by the author(s) and are published to elicit comments and to further debate.
The paper analyzes the quality of financial sector regulation and supervision around the globe. Unlike studies that collect and analyze data on regulation and supervision “on the books,” this study also analyzes available information on supervisory implementation, making use of data from IMF-World Bank assessments of compliance with international standards and codes. Incorporating supervisory implementation into the study provides an improved means of assessing countries’ regulatory systems. We find that countries’ regulatory frameworks score on average one notch below full compliance with the standards (on a 4-notch scale). There are substantial differences in the quality of regulatory and supervisory frameworks across countries, with the income level being a major factor. JEL Classification Numbers: G18; G28 Keywords: Regulation, supervision, financial stability Authors’ E-Mail Addresses: [email protected]; [email protected]
1 We would like to thank, without implicating, Jörg Decressin, Jennifer Elliott, Alessandro Giustiniani, Bernard Laurens, Jan-Willem van der Vossen, and Graham Colin-Jones for useful comments, Mark Swinburne for guidance, and Kalin Tintchev for research assistance. All remaining errors are our own.

2
Contents Page
I. Introduction ............................................................................................................................4
II. Data and Methodology..........................................................................................................6
III. An Introductory Analysis of the Quality of Supervision .....................................................8 A. Overall Findings........................................................................................................8 B. Differences by Income Level and Geographic Region ...........................................10 C. Main Strengths and Areas for Improvement ...........................................................12
IV. Regression Analysis...........................................................................................................13
V. Analysis of Other FSAP Recommendations.......................................................................16
VI. Conclusions........................................................................................................................20
References................................................................................................................................44 Tables 1. Banking Supervision ‘Dictionary’ .......................................................................................25 2. Insurance Supervision ‘Dictionary’ .....................................................................................26 3. Securities Regulation ‘Dictionary’ ......................................................................................27 4. Financial Sector Standards and Their Four Main Components ...........................................28 5. Supervisory Quality by Level of Development ...................................................................33 6. Supervisory Quality by Geographic Region ........................................................................34 7. Correlation of Standards and Codes Assessments with the BCL Database.........................35 8. Correlation of Standards and Codes Assessments with KKM 2002 Database....................35 9. Correlation of Standards and Codes Assessments with KKM 2006 Database....................36 10. Regressions of Standards and Codes on KKM 2002 Variables and GDP Per Capita .......37 11. Regressions of Standards and Codes on KKM 2006 Variables and GDP Per Capita .......38 12. Regressions of Standards and Codes on BCL Variables and GDP Per Capita..................39 Figures 1. Overall Compliance with Standards and Codes.....................................................................9 2. Overall Compliance by Income Level .................................................................................10 3. Overall Compliance by Geographic Region ........................................................................11 4. Coverage of BCP, IAIS, and IOSCO Assessments, as of December 31, 2007 ...................22 5. Compliance in Detail: Basel Core Principles.......................................................................29 6. Compliance in Detail: IAIS Principles ................................................................................30 7. Compliance in Detail: IOSCO’s Objectives and Principles ................................................31 8. Regressions of Compliance on Income Per Capita..............................................................32

3
Box 1. Cross-Border Issues in FSAPs for EU Countries: A Survey ...............................................19 Appendix Main Areas for Improvements in Banking, Insurance, and Securities ....................................40

4
I. INTRODUCTION
How good is financial sector regulation and supervision around the world? That is a rather grand question, given that there are many different regulatory frameworks around the world, operating in different institutional environments. But it is a valid and important question, because the ongoing financial globalization makes individual country financial systems much more closely linked, and substantial differences in regulatory and supervisory quality can become exposed in a cross-border crisis. This paper addresses the question about the quality of regulation and supervision around the globe by using data from IMF-World Bank assessments of countries’ compliance with international standards and codes.2 Unlike some of the existing databases and studies that collect only information on regulation and supervision “on the books,” this study, by making use of the underlying data, can also assess the practical implementation of regulation and supervision.3 Our main findings are that (i) on average, countries’ regulatory frameworks score one notch below full compliance with the standards (on a 4-notch scale); (ii) per capita income is significantly linked to cross-country differences in regulatory quality; (iii) higher regulatory quality in banking is correlated with better banking sector performance; and (iv) there are substantial differences in regulatory quality across regions, some but not all of which can be explained by differences in economic development. The finding that high-income countries are characterized by better supervisory structures needs to be put in a context. These countries usually have more developed and more complex financial systems. It is therefore possible that, despite the higher grades, the supervisory frameworks in high-income countries may still leave something to be desired. Indeed, the developments in the global financial system in 2007–08 suggest that the higher quality of supervisory systems in high-income countries may not have been sufficient given the complexity of their financial systems. Measuring regulatory quality is a Herculean task. Regulation should aim at supporting the efficient allocation of resources across the economy in normal times. Arguably, the ultimate test of a well-functioning regulatory framework is whether it contributes to the financial system’s intermediation capacity, while decreasing the likelihood and costs of systemic financial crises. However, achievement of these goals is next to impossible to measure, because they are either very broad (“efficient allocation”) or involve analyzing causality in “tail events.” This paper uses an alternative approach to measuring regulatory quality: it analyzes the data from assessments of
2 As used in this paper, the term “country” does not in all cases refer to a territorial entity that is a state as understood by international law and practice. As used here, the term also covers some territorial entities that are not states but for which statistical data are maintained on a separate and independent basis. 3 To economize on words, the subsequent text sometimes refers only to “supervision” or “supervisors” as a shorthand expression for “regulation and supervision” and “regulators and supervisors.”

5
compliance with international standards and codes aimed at identifying good supervisory practices. Specifically, we examine a unique dataset derived from assessments of regulatory and supervisory frameworks around the globe carried out under the IMF-World Bank Financial Sector Assessment Program (FSAP). The FSAP has so far covered about two-thirds of the IMF’s 185 member countries, and is therefore an important source of broadly comparable information on the quality of supervisory frameworks. This paper analyzes the findings from the FSAP assessments in a comprehensive way, relying on a combination of quantitative and qualitative approaches.
Are international standards and codes good measures of supervisory quality? A full theoretical discussion of what constitutes an optimal supervisory framework would go well beyond the scope of this paper. In fact, rigorous theoretical work on what constitutes good prudential regulation and supervision is limited, especially for non-bank financial institutions, and remains a topic for future research.4 For the purpose of this paper, let us just say that we acknowledge at the outset that compliance scores do not necessarily give the full picture of supervisory quality, but nevertheless: (i) the standards assessments are results of detailed consultations among top international experts; (ii) the gradings have proven useful in previous research that tried to explain cross-country differences in financial sector performance (e.g., Podpiera, 2004).
The paper contributes to the literature in two important ways: (i) it provides an analysis of prudential frameworks around the world that covers the practical implementation of regulation; and (ii) it covers all the key segments, i.e., banking, insurance, and securities regulation. Substantial work has been done on analyzing banking sector laws and regulations (in particular, through the work of Barth, Caprio, and Levine, 2006). However, that work has focused only on regulations “on the books” and on those pertaining to banks. Regulatory quality is assessed in the World Bank governance database (see Kaufman, Kraay, and Mastruzzi, 2007), but this is a survey-based broad measure of regulation in general, and does not specifically focus on financial sector regulation. A global analysis of the quality of regulation in the securities area was carried out by Carvajal and Elliot (2007); our paper uses a similar dataset, but in addition to securities regulation also covers banking and insurance supervision.
The structure of the paper is as follows. Section II explains the data and methodology being used. Section III provides a basic overview of the data on compliance with the various core principles. Section IV presents the results of the regression analysis that tries to explain the factors behind cross-country differences in regulatory quality. Section V analyzes some additional relevant findings from the FSAP program, which were not captured in the assessments of standards and codes. Section VI concludes.
4 For banks, Dewatripont and Tirole (1994) provide an interesting analysis of an optimal “outside intervention policy,” focusing on solvency ratios. A somewhat more general discussion of what constitutes optimal regulation is contained in Henning and Santomero (2000).

6
II. DATA AND METHODOLOGY
To analyze the quality of regulation and supervision, this paper uses data on countries’ observance of internationally accepted standards in banking, insurance, and securities regulation (“standards”). The data are unique, because they reflect not only the laws and regulations “on the books” (data on that are widely available, for example, through the work of Barth, Caprio, and Levine, 2006); their key feature is that they reflect also detailed expert assessments of the practical implementation “in the field.”
The standards covered in this analysis are the Basel Core Principles for Effective Banking Supervision (BCP); the Insurance Core Principles (ICP), issued by the International Association of Insurance Supervisors (IAIS); and the International Organization of Securities Commissions’s (IOSCO’s) Objectives and Principles of Securities Regulation.5 The BCP contains 25 Core Principles and the ICP and IOSCO standards also comprise a number of principles (Tables 1, 2, and 3). Although the terminology differs, the extent to which each principle in the three standards is observed is rated on a four-point scale, ranging from fully observed to nonobserved.6 Most of the assessments used in the analysis were prepared as part of an FSAP, under which the gradings are normally confidential, and therefore the analysis in this paper is presented so as to respect this confidentiality.7 The sample comprises all countries for which formal assessments are available (see Figure 4 for an overview).
Following the previous literature on this subject (e.g., IMF, 2004; Čihák and Podpiera, 2006, 2008; and Čihák and Tieman, 2007), we have used these calculations to process the input data:
• Principle-by-principle gradings. For each standard and each principle, there is a grading on a four-point scale. This grading was transformed into a numeric value from 0 percent (nonobserved) to 100 percent (fully observed). The value of 67 percent corresponds to the “largely compliant” rating and the value of 33 percent to the “materially noncompliant” rating in the BCP assessment.
• Summary grading. An unweighted average of the principle-by-principle gradings was calculated to arrive at a summary grading for each standard. This summary grading is also a number between 0 percent (nonobserved) and 100 percent (fully observed).
5 See http://www.imf.org/external/standards/index.htm for a full listing of the standards and other relevant materials. 6 In addition to the principles for effective supervision, the standard-setters have also identified a number of “preconditions,” which include the general policy, environmental conditions, and institutional infrastructure. In the BCP, these are discussed separately from the individual core principles, while in the ICP and IOSCO, they are incorporated into the code. We have not explicitly incorporated the banking system preconditions into the core principle gradings, but our subsequent analysis of governance variables suggests that incorporating cross-country differences in the preconditions into the analysis would reinforce our results. 7 For the published assessments, see http://www.imf.org/external/standards/index.htm.

7
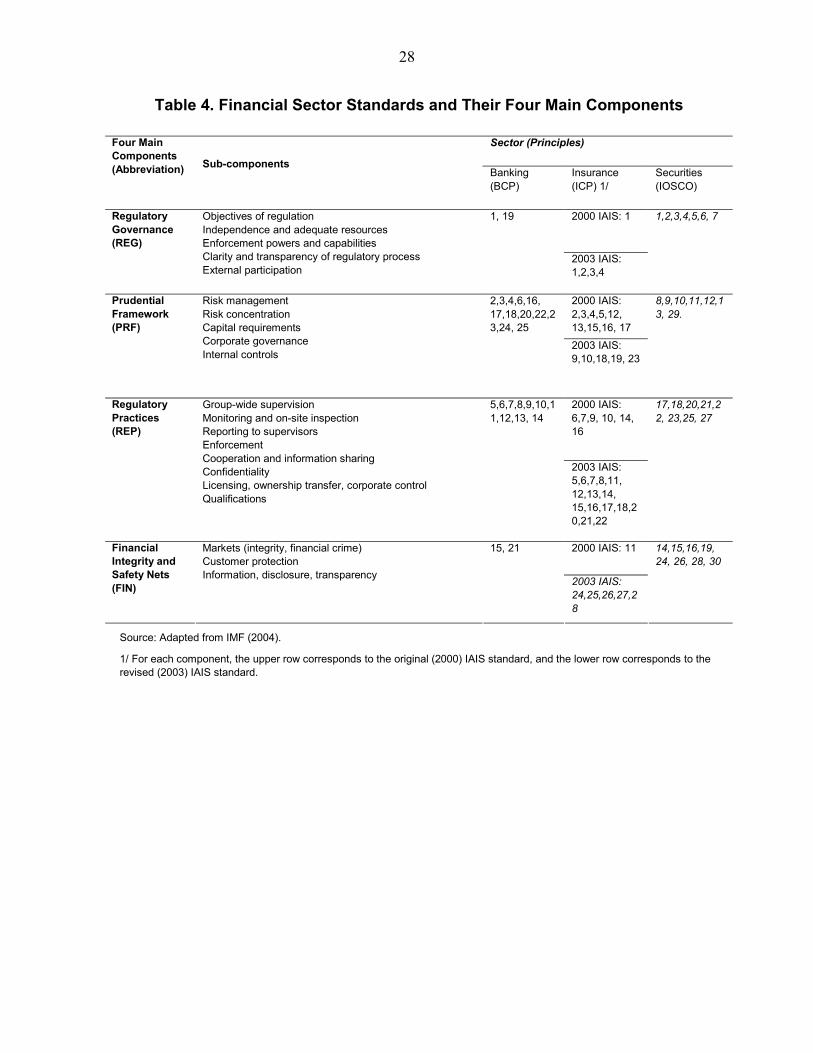
• Component gradings. Given that the individual principles cover different subjects and that the composition of the principles differs for the three standards, it is easier to carry out cross-sectoral comparisons if the principles are aggregated into comparable groups that cover similar topics. As in IMF (2004), the principles are grouped into the following four components of a good supervisory framework: (i) regulatory governance, which includes the aims, independence, and accountability of regulators; (ii) prudential framework, which consists of regulations covering risk management, capital adequacy, internal controls, and corporate governance; (iii) regulatory practices, which include monitoring and supervision, enforcement, conglomerates, and licensing; and (iv) financial integrity and safety nets, including consumer protection and addressing financial crimes. Table 4 maps the individual principles into the four components. For each of the four components, an observance index was calculated as an unweighted average of the individual principles included in that component.
It is important to emphasize that we did not originate the underlying gradings. The information used in this paper is a result of coordinated work by the IMF, the World Bank, and other cooperating institutions and their experts over a number of years. The only thing that we are doing as far as the input data are concerned is to convert them from the gradings on a 4-notch scale into gradings on a 0–100 scale and aggregating. All the underlying methodology for the assessments and some of the principle-by-principle gradings are available at the IMF’s website at http://www.imf.org/external/np/fsap/fsap.asp. The full principle-by-principle grading information is available for countries that agreed to publication of the detailed assessments;8 for other countries that have undergone the assessments, the data are not publicly available on an individual country basis, but are included in our calculations and presented on aggregate basis.
How precise are these assessment gradings? Grading is not an exact science, and there are some obvious limitations. In particular, individual assessments may be influenced by factors such as the assessors’ experience and the regulatory culture they are most familiar with. For each standard, there are methodology documents and assessors’ templates, which add a degree of direction to the assessments, but the assessments still have an element of subjectivity and require exercise of judgment on the part of the individual assessor. Also, standards and codes assessments are not designed to address political economy issues, or issues associated with financial regulation such as crisis management, the bankruptcy code, or deposit insurance. Finally, the assessments are a one-time measurement of the regulatory system and are therefore limited by time.
8 Australia is an example of a country that agreed to the publication of the full gradings. The relevant input data can be found on the above website or directly by going to http://www.imf.org/external/pubs/ft/scr/2006/cr06415.pdf. Tables 2, 5, and 8 in that document contain the principle-by-principle gradings for BCP, IAIS, and IOSCO, respectively, which we have used as input data for our calculations.
8
While we need to be mindful of these limitations, there are also reasons to be confident that these assessments capture relevant information. Each assessment is based on a standardized methodology and carried out by a team of senior international assessors, assembled by the IMF and the World Bank. The assessors are from a diversified pool of experts with different backgrounds, which limits the effect of individual assessors’ experience and background. The team spends several weeks in the assessed country, and several more months preparing a detailed report. To help ensure internal consistency and cross-country comparability, all assessments go through review at the IMF and World Bank headquarters. The review may not eliminate all inconsistencies, but it limits them substantially. And, as mentioned above, the gradings have been successfully used in previous literature (e.g., Podpiera, 2004; Carvajal and Elliott, 2007).
The gradings are relatively robust with respect to time. When interpreting the results, one must bear in mind that the gradings are a series of country-by-country snapshots. The individual assessments were undertaken at different points during 2000–07, and some of the earlier gradings may have become outdated subsequent to the FSAP. The existence of lags between regulatory developments and a reassessment of the gradings means that older assessments are likely to underestimate the true quality of current regulation and supervision in a country. Interestingly, statistical tests do not suggest a strong link between the “vintage” of an assessment and the overall grading (specifically, we did not find a significant relationship between the year of the assessment and the overall grading, controlling for the country’s income per capita). Nonetheless, to address this concern, updated gradings were taken into account for those countries for which reassessments took place in the context of FSAP Updates; for others, the FSAP gradings represent the most recent assessment information available.
Supervisory frameworks include elements that are not easy to quantify, and information may be lost if the focus is solely on quantitative analysis. Each assessment therefore contains a rich set of underlying, qualitative information from the FSAPs. Moreover, not all principles are equally relevant in all countries, and there are issues that may not be captured by the standards assessments. To address this, the FSAP reports use the standards assessments in combination with other analytical tools to form an integrated analysis of the financial sector. The key messages from these overall analyses are surveyed in the next section of this paper.
III. AN INTRODUCTORY ANALYSIS OF THE QUALITY OF SUPERVISION
A. Overall Findings
Based on the overall results for all economies in the sample (Figure 1 and Table 5), the regulatory quality seems to be remarkably similar in the three sectors. Both in banking and in insurance supervision, the average overall level of compliance is 67 percent, in both cases with a standard deviation of 19 percent. The average for securities is marginally (insignificantly) higher, with the same standard deviation. Given that a value of 67 percent corresponds to the third point

9
on the four-point scale used in the three standards, it is possible to say that on average, the regulatory systems are “largely compliant.”9
Figure 1. Overall Compliance with Standards and Codes
0102030405060708090
100
All principles Regulatorygovernance
Prud.framework
Reg. practices Fin. integrity,safety nets
Obs
erva
nce
(100
=ful
l; 0=
none
)
BankingInsurance Securities
Overall findings (all countries)
Source: Authors’ calculations, based on IMF’s standards and codes database. This overall assessment overlooks important differences among banking, insurance, and securities regulation in terms of the main regulatory components. Specifically, insurance regulation lags behind both banking and securities regulation in terms of regulatory governance. This reflects the fact that many insurance supervisory agencies lack clear autonomy from the government. In terms of prudential framework, banking scores somewhat higher than insurance and securities regulation, but the difference is small compared to the cross-country variation. Finally, in terms of both regulatory practices as well as financial integrity and safety nets, securities regulation is more aligned with international standards than banking and insurance. These general comparisons, however, should not overlook important cross-country differences, which are indicated by the high standard deviation. In the next sub-section, we therefore focus on groups of countries by income level and region.
9 To be precise, “largely compliant” is the rating that corresponds to 67 percent in the BCP terminology; the corresponding ICP and IOSCO terms are “largely observed” and “broadly implemented,” respectively.

10
B. Differences by Income Level and Geographic Region
Differences by income level There are important differences in the level of compliance based on a country’s income level (Figure 2).10 In all the three sectors, wealthy economies have clearly higher levels of compliance than poorer ones; the difference is bigger between high-income and medium-income economies than between medium-income and low-income economies.11 The text chart illustrates the relationship between compliance and income level for the overall gradings; Table 5 shows the numbers and confirms that this general conclusion also applies when one looks at the four main regulatory components (regulatory governance, prudential framework, regulatory practices, and financial integrity and safety nets).
Figure 2. Overall Compliance by Income Level
30
40
50
60
70
80
90
100
Banking Insurance Securities
Obs
erva
nce
(100
=ful
l; 0=
none
)
Overall findings, by income level (all principles)
High-income
Medium income
Low income
Source: Authors’ calculations, based on IMF’s standards and codes database.
10 The standards were designed to be universal. In principle, therefore, economic development does not need be taken into account. However, in practice, the level of compliance is positively correlated with economic development. It is thus useful to analyze the gradings not only for all countries, but also by peer groups of countries. 11 We use here the World Bank’s classification of economies into high-income (those with GDP per capita above USD 11,115), low-income (those with GDP per capita below USD 906), and medium-income (those in between).

11
30
40
50
60
70
80
90
100
Banking Insurance Securities
Obs
erva
nce
(100
=ful
l; 0=
none
) Overall findings, by region (all principles)
EUR
AFR
APD
WHDMCD
Differences by geographical region There are also notable regional differences in supervisory quality (Figure 3 and Table 6). In particular, European economies show, on average, higher levels of observance than economies in all the other four regions.12 A large part of this difference can be attributed to differences in income levels: the average (unweighted) GDP per capita in the European sample is $19,566, compared to $5,800 in the non-European sample. Figure 3. Overall Compliance by Geographic Region The difference in regulatory quality is even more notable if one compares European Union (EU) countries with non-EU countries, both European and non-European. The degree of observance of the three standards and their subcomponents was on average about 8 percentage points higher in the EU countries than in the non-EU countries (for details, see Čihák and Tieman, 2007).
Source: Authors, based on IMF’s standards and codes database. EU member countries also show a more even level of observance than non-EU countries. Usual measures of cross-country variability (such as the standard deviation or the difference between minimum and maximum) suggest that EU member countries have a lower variability in quality of regulation and supervision. Cross-country variability in the EU tended to be higher in regulatory governance than in other aspects of the supervisory framework. Both in banking and in insurance, regulatory governance showed higher cross-country variability than the prudential framework, regulatory practices, or financial integrity and safety nets. In securities regulation, the prudential framework was the component with the highest cross-country variability.
Despite the relatively favorable performance vis-à-vis non-EU countries, compliance in the EU countries was far from perfect. The overall level of compliance ranged from 79 percent in insurance to 85 percent in securities regulation.13 For example, in banking, two EU countries observed all core principles, but no principle was observed fully across the EU. On average,
12 The definitions of the five regions follow the country classification in the IMF’s World Economic Outlook. 13 As mentioned, the value of 67 percent corresponds to the “largely compliant” grading, and so it could be said that on average, the EU regulatory systems were more than “largely compliant.” However, they were significantly less than “fully compliant” (100 percent), and some were not even “largely compliant.”

12
there were about nine less-than-fully-compliant EU countries for each principle. For some principles, more than half of EU countries were less than fully compliant. Looking at the other regions, Europe is followed (in terms of supervisory quality) by Asia and the Pacific, the Middle East and Central Asia, the Western Hemisphere, and Africa. Again, one should note that these aggregate differences are driven to a large extent by differences in income per capita, and also that there is substantial variability within each of the regions.
The lowest values are generally reached in the area of financial integrity and safety nets. This is particularly true in African banking supervision (42 percent), in Middle East and Central Asian insurance supervision (40 percent), and in African securities regulation (45 percent). The highest levels of observance are generally reached in Europe, in particular in regulatory governance in banking (82 percent) and in regulatory practices in securities regulation (83 percent).
C. Main Strengths and Areas for Improvement
This section highlights the main strengths and the main areas for improvement that are relatively consistently highlighted in the BCP, ICP, and IOSCO assessments. The discussion is based on a detailed principle-by-principle analysis of the results, a summary of which is provided in Figure 5 (banking), Figure 6 (insurance), and Figure 7 (securities). A more detailed discussion is provided in the Appendix.
Each of the figures consists of the following two closely related charts: the first one shows the average degree of compliance for each principle across all the countries in the sample; the second one shows the percentage of countries that were less-than-fully compliant with the particular principle.14 So, for example, for the first Basel core principle (objectives, autonomy, powers, and resources of banking supervisors), the first chart in Figure 5 illustrates that the average degree of compliance over the whole sample was 73 percent, while the second chart illustrates that 61 percent of countries were less than fully compliant with this principle (the exact numbers are available upon request).15 As one could expect, there is a negative correlation between the average degree of compliance and the percentage of less-than-fully compliant countries, but the correlation is lower (in absolute value) than 1, so each of the charts has a separate informational value.
The specific strengths and areas for attention include the following:
14 An exception is Figure 6, which contains two charts for the 2000 IAIS standard, and two for the 2003 standard. 15 We have also carried out this analysis by peer groups of countries in terms of income level and regions. However, these breakdowns do not yield much additional useful information to that reported in Section III.B.

13
• In banking regulation, the strongest observance has been recorded in the area of licensing, specifically in the principle that deals with definition of permissible activities for the licensed institutions. In contrast, the areas most in need of improvement included supervision of other risks; connected lending; issues related to money laundering; supervisory objectives, autonomy, powers, and resources; remedial measures; and consolidated supervision.
• In insurance regulation, the highest degree compliance has been recorded in the areas of confidentiality and winding-up. In contrast, areas with low observance include market conduct issues to internal controls, derivatives and off-balance-sheet items, organization of the supervisor, corporate governance, assets, onsite inspection, and licensing.
• In securities regulation, the areas of strength include clarity and consistency of the regulatory process, professional standards, the appropriate use of self-regulatory organizations, and the rules on transparency of trading. The areas for improvement relate to enforcement powers and compliance program; capital and other prudential requirements; powers, resources, and capacity; and operational independence and accountability.
IV. REGRESSION ANALYSIS
Quality of regulation and supervision is positively correlated with the level of economic development. This finding, indicated in previous literature (e.g., Čihák and Podpiera, 2006, 2008), has been confirmed by our study (Figure 8). We have calculated correlations between the “supervisory quality” data studied here, and the regulatory database by Barth, Caprio, and Levine (2006, henceforth BCL). The main difference between the two is that the latter focuses on regulations “on the books,” while the former includes both regulations on the books and their actual implementation in practice. We have found correlations between the two datasets low, all below 50 percent, and many in the 20–30 percent range (Table 7). This is consistent with the notion that the two datasets describe different phenomena, given that the standards and codes database incorporates also practical implementation of regulations.
We have calculated correlations between all BCP, IAIS, and IOSCO categories, and the World Bank governance database by Kaufman, Kraay, and Mastruzzi (2007, henceforth KKM) as of 2002 and 2006. This database reflects the views on governance by experts from the public sector, private sector, and non-government organizations, as well as thousands of citizen and firm survey respondents worldwide. With many correlations between 50 and 60 percent, a few readings higher than 60 percent, and about half below 50 percent, the correlation between these

14
survey data and our regulatory quality indicators is higher than the correlation between the regulatory database of BCL and our supervisory quality data (Tables 8 and 9).16 Apparently, as both our dataset and the KKM governance data aim to measure implementation and actual practice, the relationship between these data is closer than the relationship between implementation and regulation on the books, as measured by BCL. We tested which macroeconomic variable best explained standards and codes. As expected, we found this to be gross domestic product per capita. It performed better than alternative variables, such as domestic credit and claims to the private sector, or proxies for the size of the financial sector,17 which all exhibited lower explanatory power. Subsequently, we gauged whether information embedded in the standards and codes add information to that contained in a country’s level of development (as measured by its GDP per capita), and its governance regime (as measured by the individual KKM indicators). To do so, we regressed all standards and codes on the individual KKM governance variables and per capita GDP, using OLS, i.e. we estimated:18
,εγβα +⋅+⋅+= jiij GDPKKMSC with SCij = standards and codes variable i for country j, i = regulatory governance, prudential
framework, regulatory practice, financial integrity, for all three standards (BCP, IAIS, and IOSCO),
KKMi = KKM variable i for country j, i = Voice and Accountability, Political Stability, Government Effectiveness, Regulatory Quality, Rule of Law, Control of Corruption,
GDPj = GDP per capita in country j. We ran these regressions for all standards and codes being considered, and for the KKM data from both 2002 and 2006. For GDP per capita we use the value from the same years as the KKM data (i.e. either 2002 or 2006).19 This results in matrices of coefficients and t-values (Tables 10 and 11), discussed below:20 16 We have also calculated correlations between the KKM governance data of 2002 and 2006. Somewhat surprisingly, about half of these correlations are below 90 percent, with many of between 70 and 80 percent. Slightly below half of the changes in these variables between 2002 and 2006 were improvements. 17 As we do not have data about the size of the financial sector for all countries in the sample, we employed the ratios of domestic credit and claims to the private sector over GDP as simple proxies. 18 Even though the KKM variables do correlate with GDP per capita, the correlation is far from perfect, and mutlicollinearity problems do not seem to arise in the regressions. 19 It is not always the exact year in which the standards assessment was performed, but it is reasonably close. 20 One explanatory variable not included in the above regression is the degree of sectoral integration of supervision in a country, which has found to be significant in previous research (Čihák and Podpiera, 2006, 2008).

15
• For the BCP, the coefficient estimates for GDP per capita always exhibit the expected
positive sign, and are often significant at the 5 percent uncertainty level (in 80 percent of the cases, both for the 2002 and the 2006 data). At the same time, the KKM governance variables are also significant most of the time. We interpret this as indication that the BCP captures information contained in the level of development, which is not contained in the World Bank governance data. We paid specific attention to KKM’s “regulatory quality” variable, which comes closest to our BCP data. For the BCP regressions including this explanatory variable, significance at the 5 percent uncertainty level for this variable is found in about 50 percent of the cases for 2006 data, and about 75 percent of the cases for 2002 data, while the GDP per capita variable is almost always significant. Taken together, these results suggest rather clearly that the BCP contains information beyond the regulatory governance data.
• For IAIS and IOSCO, the results are less strong. Still, around a half of the regressions featured GDP per capita with a coefficient with the expected sign and significantly different from zero at the 5 percent uncertainty level. In particular, this is the case for IAIS Regulatory Practice, and IOSCO Prudential Framework and Financial Integrity. The KKM governance variables were not significant most of the time. We interpret this as the BCP “core” banking regulations being better reflected in the general regulatory quality variable of KKM, whereas the ‘more obscure’ insurance and securities regulations feature less prominently in the survey responses of the KKM study.
We have also performed the above regressions for regions (following the IMF’s World Economic Outlook classification, i.e., Europe, Middle East and Central Asia, Asia and Pacific, Africa, and Western Hemisphere)21 and by income level (following the World Bank country classification through the Atlas method,22 and adding the OECD as a separate group). The results generally show less significance, reflecting the much smaller samples. For the BCP regression, however, the GDP per capita variable is significant at the 5 percent uncertainty level in a number of cases, specifically for both the low income and the high income (and OECD) countries. It therefore seems that the results for the BCP are driven in particular by low- and high-income countries. A similar approach for the BCL regulation and supervision database shows even more striking results (Table 12). For the questions that we consider, in almost all cases GDP per capita is another significant variable. This is the counterpart of the fact that many of the variables from the BCL database turn out not to be significant in the regression. This is at least partly due to the fact that, in this WB database, there are many missing values. Still, the regression analysis
21 See, for example, http://www.imf.org/external/pubs/ft/weo/2008/01/pdf/statapp.pdf. 22 See http://go.worldbank.org/K2CKM78CC0.

16
identifies several interesting patterns. First, while higher government ownership of banks is associated with a lower BCP ranking (significant in 2 out of 4 regressions), higher foreign ownership is weakly associated with a better BCP ranking (not significant). This indicates that market discipline, in the form of bank ownership by parties not directly under the influence of government has a positive relationship with banking supervision quality, as measured by BCP. Second, the supervisor’s authority to ask a bank to change its structure is associated with higher BCP scores (significant). A possible explanation is that this is probably the case in only the better regulated systems. Third, a higher ratio of nonperforming loans to total assets is associated with lower BCP scores (significant in only 1 out of 4 regressions). This could be because systems with high nonperforming loan ratios are generally the ones that are less well-run.
V. ANALYSIS OF OTHER FSAP RECOMMENDATIONS
In addition to the quantitative findings derived from gradings, several recurrent themes emerge from a qualitative survey of the main overall messages in the FSAP assessments on EU countries. To complement the quantitative analysis above, this section reviews the available Financial System Stability Assessment (FSSA) reports, and presents the results of a survey of IMF leaders of FSAP missions.
A majority of the available FSSAs described the country’s financial system to be well supervised. However, issues and gaps were identified in virtually all cases. In a minority of countries, “substantial weaknesses” or “important shortcomings” were identified. This is consistent with the findings of the quantitative analysis, which finds a majority of countries in the high-compliance range, but a relatively small minority with very low levels of compliance For instance, in securities regulation, more than a half of the countries had an overall grading in the 80–100 percent range, but some 5 percent of the countries had overall gradings lower than 40 percent.
Most FSSAs highlighted the need to adjust the supervisory frameworks to meet new challenges, in particular those relating to cross-sector and cross-border financial integration. A majority of FSSAs stressed that the consolidation of the financial markets has increased the importance of effective cooperation within and across national jurisdictions. In several countries, this issue was raised in the context of strengthening consolidated supervision.23 Additionally, a number of the FSSAs urged continued work, both domestically and internationally, in the areas of crisis management, deposit insurance, cross-border payment and settlement systems, and day-to-day cross-border supervisory cooperation. As a recent example, the 2006 FSAP for Belgium recommended that the supervisory agency position itself to meet new challenges stemming from the following cross-sector and cross-border issues: (i) the dominant role of conglomerates in the
23 This is consistent with the finding of Section III.C that the principles on consolidated supervision have been among those with the lowest level of observance.

17
domestic market and their increasingly international character; (ii) the demands of Basel II and Solvency II; (iii) the implementation of the Financial Services Action Plan and the ongoing integration within the European market; and (iv) the changes in, and special requirements of, new cross-border financial market infrastructures, such as Euronext and Euroclear. As another example, the 2004 FSAP for the Netherlands included key recommendations on cross-border securities settlement and cross-border crisis management, both of which require close cooperation with foreign counterparts, and a recommendation on the deposit guarantee system, suggesting that it take into account the broader European context of depositor/investor protection arrangements.
Although the FSAPs often note the importance of cross-border issues, the process offers only limited scope to analyze them. In particular, FSAP missions have limited or no interaction with relevant foreign parties (both public and private), which means that the perspective of such parties is often not analyzed in depth.24 A survey of IMF FSAP mission leaders (Box 1) suggests that this is primarily due to resource constraints and to a lesser extent to constraints on access to data and people abroad. FSAPs have also been able to give only limited coverage to important cross-border issues relating to crisis management, lender-of-last-resort support, safety nets, and risk management in international conglomerates, because their country focus does not lend itself to studying such supranational issues.25 A study that specifically focused on these cross-border issues was done for the Nordic-Baltic region in 2006-07 (Wajid and others, 2007).
With respect to domestic prudential issues, several themes emerged:
• Improving the monitoring of systemwide risks. Virtually all FSSAs highlighted the need to improve the monitoring of new systemwide risks. This was typically worded in terms of a need to improve macroprudential surveillance processes and outputs, related to monitoring and analyzing new risks, implementing stress tests, and collecting and disseminating additional or more timely indicators.
• Strengthening of regulations in specific segments. Substantial improvements in insurance regulation were recommended most frequently (in about half of the surveyed FSSAs), which is consistent with the relatively lower level of compliance in this area.
24 However, the U.K. FSAP team met with the German supervisory agency BaFin and U.S. supervisors, and the Belgian FSAP team held discussions with Euroclear entities and customers abroad. 25 In a sense, the FSAPs for euro area countries are only partial, because they could not fully assess important elements of the financial stability framework that are wholly or partially determined at the European level. The FSAP’s country-based format also limits its ability to assess vulnerabilities related to cross-border conglomerates if an important part of the risk management of these conglomerates takes place abroad. Bottom-up stress tests of such conglomerates might not reflect the full nature of the risks presented by a particular scenario when the foreign risk management team has not been involved in the exercise.

18
In some FSSAs, regulators were urged to focus on certain types of activities, for example, risks related to large and growing portfolios of residential mortgage loans.
• Strengthening of regulatory governance. The need to strengthen regulatory governance was raised in a majority of FSSAs. This is consistent with the quantitative findings of the previous section. The exact recommendations ranged from the need to reduce the potential for political interference in day-to-day supervision, to issues such as the need to strengthen the legal protection of supervisors or the lack of budgetary independence.
• Improving corporate governance and disclosures. This was also a recurrent theme, with about one-third of the FSSAs highlighting the need for improvements in corporate governance of financial institutions and their public disclosures.
Other issues not explicitly covered by the standards have been prominent in some country FSAPs. This includes the role of public ownership in the financial sector (for example, in Germany) and the relationship between concentration, competition, and stability (for example, in France and Italy). Prudential regulation can play a role, but only a secondary one, in addressing these issues.

19
Box 1. Cross-Border Issues in FSAPs for European Union Countries: A Survey
A survey of FSAP mission leaders for EU countries suggests that cross-border issues have received some attention in FSAPs, but FSAP missions generally had limited resources, preventing in-depth coverage of these issues. In most cases, the attention was driven by the presence of systemically important foreign banks, substantial foreign exposure of domestic banks, and in some new member states by foreign ownership of the banking system. In most FSAPs, coverage of cross-border issues was limited by resource constraints and access to data.
The United Kingdom FSAP (2003) focused on the role of London as an international financial center. Cross-border supervisory coordination was an important issue for the mission. The mission met with US and German supervisors to get their perspectives on coordination with the U.K. supervisors. There was no substantial emphasis on cross-border crisis management.
The Lithuania FSAP mission (2002) saw cross-border issues as central to the financial system of this small, open economy, with considerable foreign ownership of financial sector assets. The prominence of these issues was emphasized by the (then) run-up to EU accession. However, the mission did not meet foreign supervisors or private sector representatives.
In the Netherlands (2004) and Belgium (2006) FSAPs, cross-border supervisory issues were important topics for the standards assessments. In addition, in the Netherlands, the general discussions and the vulnerability analysis focused on the substantial foreign operations of Dutch banks. Some FSAP recommendations related to the area of international coordination. In Belgium, both the issue of foreign operations of large Belgian banks and foreign ownership of some large Belgian banks were discussed. As the foreign operations of Belgian banks are mainly in Central and Eastern Europe, the systemic importance for the Belgian system was judged to be limited and no in-depth analysis was performed. The mission looked into the issue of cooperation with the Dutch supervisor, but did not meet foreign supervisors or private sector representatives.
The FSAPs for Norway (2005), Sweden (2002), and Finland (2001) saw the scope for spillovers among the Nordic countries as an important issue, and highlighted this in the standard assessments. Given the prominence of Swedish banks throughout the region, the stress tests and scenario analyses for the Swedish FSAP were based on the Nordic area. However, the mission was somewhat constrained by its limited capacity to analyze the exposures in the Nordic region in detail. In Finland and Norway, one of the key issues was the foreign ownership of a systemically important bank. In Norway, an additional issue was the cross-border implications of the relatively generous deposit insurance system. No meetings with foreign supervisors took place.
The Greece FSAP (2006) mentioned the lack of a cross-border crisis management framework, weak cooperation between Greek supervisors and the supervisors of other southeastern European countries and the associated lack of clarity on lender of last resort issues for Greek branches operating in southeastern European countries. In addition, differences in regulatory frameworks across the region raised concerns about regulatory arbitrage. After considering the costs and benefits, the mission decided not to meet with foreign supervisors or private sector representatives.
The Poland FSAP Update (2006) mentioned that cross-border issues were important given that about three quarters of the banking system is foreign-owned. Cross-border issues were addressed as part of the stress tests, a follow-up on standards assessments, and more general discussions on the role of foreign-owned banks. However, the analysis was to some extent overshadowed by domestic issues, and limited by time and resource constraints. The mission did not meet with foreign supervisors and representatives of the foreign owners of the local banks.

20
VI. CONCLUSIONS
We find that on average, countries’ regulatory frameworks score one notch below full compliance with the international supervisory standards (on a 4-notch scale). At the same time, there is substantial cross-country differentiation.
Perhaps the main finding of this paper is a confirmation that there are significant differences in the quality of regulatory and supervisory frameworks across countries, and that the level of economic development is an important explanatory factor. This is evident from an analysis of the data by country peer groups (which is consistent with previous findings for smaller or narrower samples in IMF, 2002; IMF, 2004), and confirmed by regression analysis.
The regression analysis finds that banking supervision quality can be explained by governance variables and by income level (GDP per capita). For insurance supervision and securities regulation, the conclusion is similar, even though less strong. Also, we find that datasets focusing only on regulations “on the books” have low correlation with the standard and codes assessments used in this paper. When we break down our analysis by geographic regions, we find substantial differences in regulatory quality across regions, some (but not all) of which can be explained by differences in economic development. The analysis suggests that financial supervisory systems in high-income economies are generally of higher quality than those in medium- or low-income economies. However, supervision in high-income countries also faces bigger challenges, as they are characterized by more complex financial systems. On balance, therefore, our research cautions that despite the higher grades obtained by high-income countries, the supervisory knowledge about the financial strength of their institutions may not be higher than that for low- or middle-income countries. Indeed, the developments in the global financial system in late 2007 and early 2008 suggest that the higher quality of supervisory systems in high-income countries may not have been sufficient given the complexity of their financial systems.
Many of the gaps identified in the assessments have been recognized by country authorities and are being addressed as part of their reform plans. Progress in regulatory frameworks was confirmed by recent FSAP updates and other IMF surveillance work (FSAP updates have so far been completed for some 1/10 of the countries assessed under the original FSAP); however, the updated assessments also indicated that the financial environment has changed substantially in recent years, presenting new challenges.
The analysis of the assessments points out a need to close gaps in existing frameworks and also to adjust them to meet emerging challenges. Some of the gaps are relatively small and may have already been closed since the respective assessments were carried out, but new challenges have emerged as financial systems have become more integrated. These include those posed by the growing role of conglomerates and their increasingly international character, ongoing financial

21
integration, and in some cases the emergence of cross-border financial market infrastructures. To a substantial extent, international standards are evolving to take these new challenges into account. The Basel Core Principles, for example, have recently been revised in part to better address cross-border banking and the increased importance of supervisory cooperation, as well as to ensure consistency with Basel II. Such evolution of best practices and standards ensures that compliance with the standards will to some extent always remain a moving goal. Therefore, attention for compliance with international standards should remain an important aspect of financial sector surveillance.
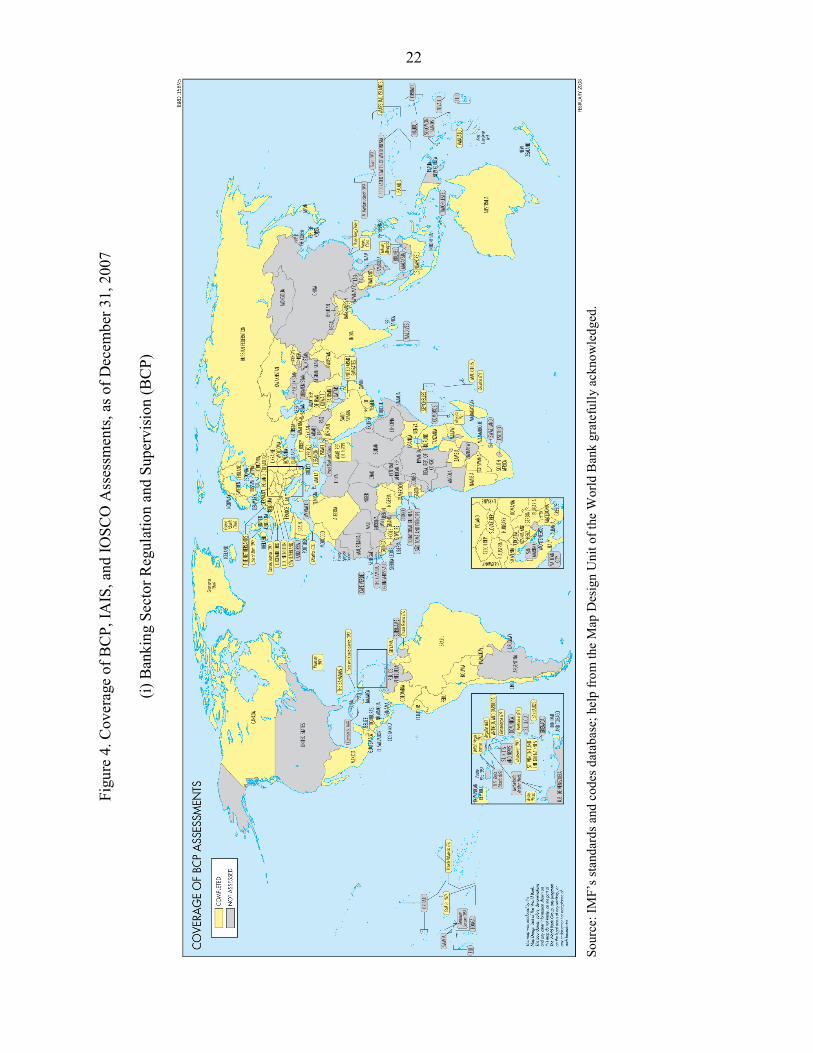
22
Figu
re 4
. Cov
erag
e of
BC
P, IA
IS, a
nd IO
SCO
Ass
essm
ents
, as o
f Dec
embe
r 31,
200
7
(i) B
anki
ng S
ecto
r Reg
ulat
ion
and
Supe
rvis
ion
(BC
P)
So
urce
: IM
F’s s
tand
ards
and
cod
es d
atab
ase;
hel
p fr
om th
e M
ap D
esig
n U
nit o
f the
Wor
ld B
ank
grat
eful
ly a
ckno
wle
dged
.

23
(ii) I
nsur
ance
Sec
tor R
egul
atio
n an
d Su
perv
isio
n (IA
IS)
So
urce
: IM
F’s s
tand
ards
and
cod
es d
atab
ase;
hel
p fr
om th
e M
ap D
esig
n U
nit o
f the
Wor
ld B
ank
grat
eful
ly a
ckno
wle
dged
.

24
(ii
i) Se
curit
ies R
egul
atio
n an
d Su
perv
isio
n (IO
SCO
)
Sour
ce: I
MF’
s sta
ndar
ds a
nd c
odes
dat
abas
e; h
elp
from
the
Map
Des
ign
Uni
t of t
he W
orld
Ban
k gr
atef
ully
ack
now
ledg
ed.

25
Standard:
Principle No. Topic Component 2/
1 Objectives, Autonomy, Powers, And Resources REG2 Permissible Activities PRF3 Licensing Criteria PRF4 Ownership PRF5 Investment Criteria REP6 Capital Adequacy REP7 Credit Policies REP8 Loan Evaluation and Loan-Loss Provisioning REP9 Large Exposure Limits REP
10 Connected Lending REP11 Country Risk REP12 Market Risks REP13 Other Risks REP14 Internal Control and Audit REP15 Money Laundering FIN16 On-Site and Off-Site Supervision PRF17 Bank Management Contact PRF18 Off-Site Supervision PRF19 Validation of Supervisory Information REG20 Consolidated Supervision PRF21 Accounting Standards FIN22 Remedial Measures PRF23 Globally Consolidated Supervision PRF24 Host Country Supervision PRF25 Supervision Over Foreign Banks' Establishment PRF
2/ See IMF (2004) for more details. REG is regulatory governance, PRF is prudential framework, REP are regulatory practices, and FIN is financial integrity and safety nets.
1/ See http://www.imf.org/external/standards/index.htm for details on assessment methodology.
Table 1. Banking Supervision 'Dictionary' 1/
Basel Core Principles for Effective Banking Supervision (BCP)

26
Standard:
Principle No. Topic Component 2/
2000 IAIS standard1 Organisation of the supervisor REG2 Licensing PRF3 Changes in control PRF4 Corporate governance PRF5 Internal controls PRF6 Assets REP7 Liabilities REP8 Capital adequacy and solvency PRF9 Derivatives and off-balance sheet items REP
10 Reinsurance REP11 Market conduct FIN12 Financial reporting PRF13 On-site inspection PRF14 Sanctions REP15 Cross-border business operations PRF16 Coordination and cooperation REP17 Confidentiality PRF
2003 IAIS standard1 Conditions for effective insurance supervision REG2 Supervisory objectives REG3 Supervisory authority REG4 Supervisory process REG5 Supervisory cooperation and information sharing REP6 Licensing REP7 Suitability of persons REP8 Changes in control and portfolio transfers REP9 Corporate governance PRF
10 Internal control PRF11 Market analysis REP12 Reporting to supervisors and off-site monitoring REP13 On-site inspection REP14 Preventive and Corrective Measures REP15 Enforcement or sanctions REP16 Winding-up and exit from the market REP17 Group-wide supervision REP18 Risk assessment and management PRF19 Insurance activity PRF20 Liabilities REP21 Investments REP22 Derivatives and similar commitments REP23 Capital adequacy and solvency PRF24 Intermediaries FIN25 Consumer protection FIN26 Information, disclosure & transparency towards the market FIN27 Fraud FIN28 Anti-money laundering, combating the financing of terrorism (AML/CFT) FIN
Table 2. Insurance Supervision 'Dictionary' 1/
1/ See http://www.imf.org/external/standards/index.htm for details on assessment methodology.
International Association of Insurance Supervisors Insurance Core Principles (ICP)
2/ See IMF (2004) for more details. REG is regulatory governance, PRF is prudential framework, REP are regulatory practices, and FIN is financial integrity and safety nets.

27
Standard:
Principle No. Topic Component
1 Responsibilities of the regulator REG2 Operational independence and accountability REG3 Powers, resources, and capacity to perform the functions and exercise the powers. REG4 Clear and consistent regulatory processes. REG5 Professional standards including standards of confidentiality REG6 Appropriate use of Self-Regulatory Organizations (SROs) REG7 Standards for SROs REG8 Comprehensive inspection, investigation and surveillance powers PRF9 Comprehensive enforcement powers PRF
10 Effective and credible use of inspection, investigation, surveillance and enforcement powers and implementation of an efective compliance program. PRF
11 Authority to share both public and non-public information with domestic and foreign counterparts PRF12 Setting up information sharing mechanisms PRF13 Assistance foreign regulators who need to make inquiries in the discharge of their functions and exercise of their
powers. PRF14 Full, accurate and timely disclosure of financial results and other information that is material to investors' FIN15 Fair and equitable treatment of holders of securities in a company FIN16 High and internationally acceptable quality of accounting and auditing standards FIN17 Standards for the eligibility and the regulation of those who wish to market or operate a collective investment
scheme REP18 Rules governing the legal form and structure of collective investment schemes and the segregation and
protection of client assets REP19 Disclosure necessary to evaluate the suitability of a collective investment scheme for a particular investor and
the value of the investor's interest in the scheme FIN20 Proper and disclosed basis for asset valuation and the pricing and the redemption of units in a collective
investment scheme REP21 Minimum entry standards for market intermediaries REP22 There should be initial and ongoing capital and other prudential requirements for market intermediaries that REP23 Standards for internal organization and operational conduct REP24 Procedure for dealing with the failure of a market intermediary FIN25 Regulatory authorization and oversight of the establishment of trading systems REP26 Ongoing regulatory supervision of exchanges and trading systems FIN27 Transparency of trading. REP28 Detecting and detering manipulation and other unfair trading practices. FIN29 Proper management of large exposures, default risk and market disruption. PRF30 Systems for clearing and settlement of securities transactions FIN
1/ See http://www.imf.org/external/standards/index.htm for further details on the assessment methodology.2/ See IMF (2004) for details. REG=regulatory governance, PRF=prudential framework, REP=reg. practices, and FIN=financial integrity, safety
Table 3. Securities Regulation 'Dictionary' 1/
International Organization of Securities Commissions (IOSCO) Objectives and Principles of Securities Regulation
28
Table 4. Financial Sector Standards and Their Four Main Components
Sector (Principles) Four Main Components (Abbreviation) Sub-components
Banking (BCP)
Insurance (ICP) 1/
Securities (IOSCO)
2000 IAIS: 1 Regulatory Governance (REG)
Objectives of regulation Independence and adequate resources Enforcement powers and capabilities Clarity and transparency of regulatory process External participation
1, 19
2003 IAIS: 1,2,3,4
1,2,3,4,5,6, 7
2000 IAIS: 2,3,4,5,12, 13,15,16, 17
Prudential Framework (PRF)
Risk management Risk concentration Capital requirements Corporate governance Internal controls
2,3,4,6,16, 17,18,20,22,23,24, 25
2003 IAIS: 9,10,18,19, 23
8,9,10,11,12,13, 29.
2000 IAIS: 6,7,9, 10, 14, 16
Regulatory Practices (REP)
Group-wide supervision Monitoring and on-site inspection Reporting to supervisors Enforcement Cooperation and information sharing Confidentiality Licensing, ownership transfer, corporate control Qualifications
5,6,7,8,9,10,11,12,13, 14
2003 IAIS: 5,6,7,8,11, 12,13,14, 15,16,17,18,20,21,22
17,18,20,21,22, 23,25, 27
2000 IAIS: 11 Financial Integrity and Safety Nets (FIN)
Markets (integrity, financial crime) Customer protection Information, disclosure, transparency
15, 21
2003 IAIS: 24,25,26,27,28
14,15,16,19, 24, 26, 28, 30
Source: Adapted from IMF (2004).
1/ For each component, the upper row corresponds to the original (2000) IAIS standard, and the lower row corresponds to the revised (2003) IAIS standard.

29
Figure 5. Compliance in Detail: Basel Core Principles
0102030405060708090
100
CP1
CP2
CP3
CP4
CP5
CP6
CP7
CP8
CP9
CP1
0C
P11
CP1
2C
P13
CP1
4C
P15
CP1
6C
P17
CP1
8C
P19
CP2
0C
P21
CP2
2C
P23
CP2
4C
P25
Deg
ree
of c
ompl
ianc
e (a
vera
ge)
0102030405060708090
100
CP1
CP2
CP3
CP4
CP5
CP6
CP7
CP8
CP9
CP1
0C
P11
CP1
2C
P13
CP1
4C
P15
CP1
6C
P17
CP1
8C
P19
CP2
0C
P21
CP2
2C
P23
CP2
4C
P25
Less
-than
-fully
com
plia
nt c
ount
ries
(% o
f tot
al)
Source: authors’ calculations, based on IMF’s standards and codes database.

30
Figure 6. Compliance in Detail: IAIS Principles (i) 2000 IAIS Standard
0102030405060708090
100
CP1
CP2
CP3
CP4
CP5
CP6
CP7
CP8
CP9
CP1
0
CP1
1
CP1
2
CP1
3
CP1
4
CP1
5
CP1
6
CP1
7
Deg
ree
of c
ompl
ianc
e (a
vera
ge)
0102030405060708090
100
CP1
CP2
CP3
CP4
CP5
CP6
CP7
CP8
CP9
CP1
0
CP1
1
CP1
2
CP1
3
CP1
4
CP1
5
CP1
6
CP1
7
Less
-than
-ful
ly com
pliant
cou
ntrie
s
(% o
f tot
al)
(ii) 2003 IAIS Standard
0102030405060708090
100
CP1
CP2
CP3
CP4
CP5
CP6
CP7
CP8
CP9
CP1
0C
P11
CP1
2C
P13
CP1
4C
P15
CP1
6C
P17
CP1
8C
P19
CP2
0C
P21
CP2
2C
P23
CP2
4C
P25
CP2
6C
P27
CP2
8Deg
ree
of c
ompl
ianc
e (a
vera
ge)
0102030405060708090
100
CP1
CP2
CP3
CP4
CP5
CP6
CP7
CP8
CP9
CP1
0C
P11
CP1
2C
P13
CP1
4C
P15
CP1
6C
P17
CP1
8C
P19
CP2
0C
P21
CP2
2C
P23
CP2
4C
P25
CP2
6C
P27
CP2
8Less
-than
-fully
com
plia
nt c
ount
ries
(%
of t
otal
)
Source: authors’ calculations, based on IMF’s standards and codes database.

31
Figure 7. Compliance in Detail: IOSCO’s Objectives and Principles
0102030405060708090
100
Q01
Q02
Q03
Q04
Q05
Q06
Q07
Q08
Q09
Q10
Q11
Q12
Q13
Q14
Q15
Q16
Q17
Q18
Q19
Q20
Q21
Q22
Q23
Q24
Q25
Q26
Q27
Q28
Q29
Q30
Deg
ree
of c
ompl
ianc
e (a
vera
ge)
0102030405060708090
100
Q01
Q02
Q03
Q04
Q05
Q06
Q07
Q08
Q09
Q10
Q11
Q12
Q13
Q14
Q15
Q16
Q17
Q18
Q19
Q20
Q21
Q22
Q23
Q24
Q25
Q26
Q27
Q28
Q29
Q30
Less
-than
-ful
ly c
ompl
iant
cou
ntrie
s(%
of t
otal
)
Source: authors’ calculations, based on IMF’s standards and codes database.

32
Figure 8. Regressions of Compliance on Income Per Capita
Compliance w ith BCP (in Percent)
0
10,000
20,000
30,000
40,000
50,000
60,000
70,000
80,000
90,000
100,000
0 10 20 30 40 50 60 70 80 90 100
GD
P pe
r cap
ita (i
n U
.S.
dolla
rs)
Compliance w ith IAIS (in Percent)
0
10,000
20,000
30,000
40,000
50,000
60,000
70,000
80,000
0 10 20 30 40 50 60 70 80 90 100
GD
P pe
r cap
ita (i
n U
.S. d
olla
rs)
Compliance w ith IOSCO (in Percent)
0
10,000
20,000
30,000
40,000
50,000
60,000
70,000
80,000
90,000
100,000
0 10 20 30 40 50 60 70 80 90 100
GD
P pe
r cap
ita (i
n U
.S. d
olla
rs)
Source: authors’ calculations, based on IMF’s standards and codes database.

33
Table 5. Supervisory Quality by Level of Development
Banking Insurance SecuritiesAverage St.dev. Average St.dev. Average St.dev.
All economies 67 19 67 19 71 19Regulatory governance 73 20 60 27 74 19Prud. framework 70 19 67 21 67 24Reg. practices 61 24 68 22 76 22Fin. integrity, safety nets 63 27 61 32 69 23
High income 86 10 79 14 85 16Regulatory governance 90 12 76 20 84 18Prud. framework 88 10 75 21 83 18Reg. practices 84 15 81 14 86 18Fin. integrity, safety nets 85 14 76 24 85 17
Middle income 60 17 57 17 62 17Regulatory governance 66 20 49 25 67 17Prud. framework 62 18 57 18 55 20Reg. practices 52 20 57 20 68 22Fin. integrity, safety nets 56 27 47 31 59 18
Low income 56 13 54 15 52 9Regulatory governance 69 17 58 17 60 25Prud. framework 59 12 56 18 42 16Reg. practices 49 15 48 19 64 8Fin. integrity, safety nets 40 23 58 32 44 18
Source: Authors' calculations based on IMF's standards and codes database.Note: Standard deviation of the relevant index across the country sample.

34
Table 6. Supervisory Quality by Geographic Region
Banking Insurance SecuritiesAverage St.dev. Average St.dev. Average St.dev.
All economies 67 19 67 19 71 19Regulatory governance 73 20 60 27 74 19Prud. framework 70 19 67 21 67 24Reg. practices 61 24 68 22 76 22Fin. integrity, safety nets 63 27 61 32 69 23
Africa 56 10 61 22 54 17Regulatory governance 67 20 61 25 64 33Prud. framework 59 12 64 23 45 18Reg. practices 48 12 56 26 68 19Fin. integrity, safety nets 42 24 61 33 45 24
Asia and Pacific 67 23 78 14 76 15Regulatory governance 73 23 65 21 80 12Prud. framework 69 24 77 13 70 24Reg. practices 60 29 76 24 78 19Fin. integrity, safety nets 58 23 84 17 76 21
Europe 78 16 74 16 81 17Regulatory governance 82 18 67 25 81 17Prud. framework 81 15 71 20 80 21Reg. practices 73 21 76 17 83 21Fin. integrity, safety nets 78 22 64 31 78 20
Middle East and Central Asia 64 14 53 17 53 15Regulatory governance 77 13 53 34 57 20Prud. framework 67 16 52 13 46 11Reg. practices 57 18 53 18 59 22Fin. integrity, safety nets 54 28 40 36 51 16
Western Hemisphere 58 19 57 20 62 14Regulatory governance 61 20 41 20 67 10Prud. framework 60 19 60 24 48 14Reg. practices 49 24 56 22 67 20Fin. integrity, safety nets 59 27 55 31 64 19
Source: Authors' calculations based on IMF's standards and codes database.

35
Table 7. Correlation of Standards and Codes Assessments with the BCL Database1/
Barth, Caprio, Levine Database
Q3.4 Q 3.8.1 Q 3.8.2 Q 6.1 Q 6.2 Q 9.4 Q 12.4 Q 12.5
Regulatory governance -0.18 -0.20 -0.08 0.32 0.24 -0.06 -0.10 -0.10
Prudential Framework -0.13 -0.33 0.08 0.27 0.07 -0.31 -0.07 0.14
Regulatory Practice -0.19 -0.25 -0.01 0.29 0.13 -0.26 0.04 0.06BIS Financial Integrity -0.15 -0.34 0.09 0.19 0.13 -0.39 -0.07 -0.10
Regulatory governance -0.35 -0.17 -0.23 0.18 0.17 -0.35 0.05 0.31
Prudential Framework -0.15 -0.28 0.05 0.06 -0.22 -0.37 -0.09 0.19
Regulatory Practice -0.30 -0.30 -0.07 0.15 0.00 -0.47 -0.17 0.30IAIS Financial Integrity 0.05 -0.12 0.05 0.07 -0.33 -0.13 -0.09 0.06
Regulatory governance -0.10 -0.18 0.02 0.21 0.09 -0.33 -0.04 0.12
Prudential Framework -0.21 -0.25 0.08 0.32 0.11 -0.34 -0.07 0.15
Regulatory Practice -0.27 -0.04 0.01 0.07 0.19 -0.23 -0.02 -0.01
Sta
ndar
ds &
Cod
es
IOSCO Financial Integrity -0.15 -0.10 -0.01 0.20 0.05 -0.43 -0.10 0.12
Sources: IMF standards codes database and World Bank BCL Database
1/ Explanatory Note. The questions used from the BCL database are: Q 3.4 “What is the actual risk-adjusted capital ratio in banks as of yearend 2005, using the 1988 Basel Accord
definitions?” Q 3.8.1 “What fraction of the banking system's assets is in banks that are 50 percent or more government owned as
of yearend 2005?” Q 3.8.2 “What fraction of the banking system's assets is in banks that are 50 percent or more foreign owned as of
yearend 2005?” Q 6.1 “Can the supervisory authority force a bank to change its internal organizational structure?1=Yes, 0 = No” Q 6.2 “Has this power been utilized in the last 5 years? 1=Yes, 0 = No” Q 9.4 “What is the ratio of nonperforming loans to total assets as of year-end 2005?” Q 12.4 “How many professional bank supervisors are there in total?” Q 12.5 “How many onsite examinations per bank were performed in the last five years?”
Table 8. Correlation of Standards and Codes Assessments with KKM 2002
Database 1/
Sources: IMF’s standards and codes database, and World Bank’s KKM database. 1/ The KKM data relate to Voice and Accountability, Political Stability, Government Effectiveness, Regulatory Quality, the Rule of Law, and the Control of Corruption.
Kaufman, Kraay, and Mastruzzi Database 2002
Voice and Acc. Pol. Stability Gov.
Effectiveness Reg. Quality Rule of Law Control of Corruption
Regulatory governance 0.29 0.32 0.47 0.51 0.42 0.46 Prudential Framework 0.49 0.50 0.65 0.67 0.60 0.60
Regulatory Practice 0.52 0.51 0.68 0.71 0.64 0.65 BIS Financial Integrity 0.57 0.56 0.67 0.67 0.64 0.63
Regulatory governance 0.25 0.31 0.36 0.41 0.40 0.41 Prudential Framework 0.37 0.41 0.49 0.51 0.50 0.51
Regulatory Practice 0.47 0.47 0.58 0.61 0.59 0.59 IAIS Financial Integrity 0.30 0.22 0.38 0.37 0.39 0.43
Regulatory governance 0.44 0.38 0.50 0.44 0.43 0.41 Prudential Framework 0.61 0.55 0.56 0.56 0.56 0.54
Regulatory Practice 0.35 0.29 0.37 0.38 0.37 0.34
Sta
ndar
ds &
Cod
es
IOSCO Financial Integrity 0.56 0.47 0.60 0.61 0.59 0.58

36
Table 9. Correlation of Standards and Codes Assessments with KKM 2006 Database 1/
Kaufman, Kraay, and Mastruzzi Database 2006
Voice and Acc. Pol. Stability Gov. Effectiveness Reg. Quality Rule of Law
Control of Corruption
Regulatory governance 0.34 0.29 0.49 0.51 0.42 0.46
Prudential Framework 0.52 0.43 0.63 0.64 0.55 0.60
Regulatory Practice 0.49 0.36 0.62 0.64 0.54 0.57 BIS Financial Integrity 0.56 0.48 0.65 0.66 0.59 0.63
Regulatory governance 0.31 0.11 0.37 0.41 0.40 0.40
Prudential Framework 0.39 0.39 0.52 0.51 0.49 0.50
Regulatory Practice 0.52 0.36 0.60 0.61 0.58 0.59 IAIS Financial Integrity 0.27 0.12 0.31 0.31 0.38 0.33
Regulatory governance 0.47 0.27 0.45 0.45 0.41 0.41
Prudential Framework 0.63 0.48 0.57 0.59 0.56 0.55
Regulatory Practice 0.38 0.19 0.33 0.35 0.33 0.32
Sta
ndar
ds &
Cod
es
IOSCO Financial Integrity 0.55 0.39 0.59 0.59 0.57 0.57
Sources: IMF’s standards and codes database; and World Bank’s KKM database
1/ The KKM data relate to Voice and Accountability, Political Stability, Government Effectiveness, Regulatory Quality, the Rule of Law, and the Control of Corruption.

37
Table 10. Regressions of Standards and Codes on KKM 2002 Variables and GDP Per Capita
Voice and Acc. Pol. Stability Gov. Effectiveness Reg. Quality Rule of Law Control of Corruption
RegGov 67.30 67.66 58.99 53.97 61.58 60.14Prud 54.11 56.61 45.91 42.76 49.76 50.80RegPract 43.57 47.24 33.67 29.21 37.73 38.44FinInt 35.54 38.84 24.85 21.87 29.12 31.87RegGov 52.53 49.86 38.26 34.12 36.44 36.91Prud 53.77 50.18 41.49 41.25 43.26 43.30RegPract 50.92 52.02 38.45 37.36 41.55 43.28FinInt 45.66 53.23 27.50 30.67 29.50 26.09RegGov 52.63 60.11 42.75 49.40 53.08 56.09Prud 34.30 42.49 30.96 35.30 39.27 41.60RegPract 59.56 65.99 53.23 55.65 59.12 62.17FinInt 44.02 52.41 33.03 35.44 41.54 42.46
RegGov 16.17 18.44 12.59 11.07 13.92 14.66Prud 15.12 17.78 11.91 10.69 13.38 14.61RegPract 11.11 13.48 8.07 6.85 9.36 10.26FinInt 6.85 8.41 4.48 3.75 5.47 6.36RegGov 5.30 5.84 3.03 3.21 3.54 3.90Prud 6.95 7.51 4.24 4.95 5.47 5.79RegPract 7.38 8.69 4.46 5.16 5.95 6.49FinInt 3.78 4.94 1.75 2.20 2.25 2.25RegGov 8.55 11.07 5.34 6.38 7.78 8.54Prud 5.44 7.56 3.59 4.31 5.43 6.00RegPract 8.97 11.51 6.07 6.74 8.13 8.92FinInt 7.07 9.56 4.12 4.69 6.14 6.60
RegGov -0.04 -0.06 0.15 0.25 0.10 0.14Prud 0.12 0.07 0.31 0.36 0.24 0.22RegPract 0.15 0.07 0.37 0.45 0.31 0.30FinInt 0.33 0.29 0.57 0.61 0.52 0.46RegGov -0.04 0.02 0.25 0.35 0.34 0.33Prud 0.01 0.09 0.24 0.27 0.25 0.25RegPract 0.05 0.03 0.28 0.33 0.26 0.23FinInt 0.08 -0.10 0.42 0.38 0.45 0.55RegGov 0.29 0.15 0.44 0.32 0.28 0.22Prud 0.37 0.23 0.39 0.31 0.27 0.22RegPract 0.17 0.03 0.26 0.22 0.18 0.11FinInt 0.25 0.08 0.43 0.39 0.31 0.29
RegGov -0.53 -0.76 1.55 2.61 1.00 1.52Prud 1.66 1.00 3.88 4.56 2.91 2.84RegPract 1.88 0.92 4.37 5.38 3.45 3.58FinInt 3.17 2.88 5.01 5.27 4.41 4.15RegGov -0.20 0.14 1.07 1.75 1.57 1.69Prud 0.05 0.71 1.39 1.72 1.55 1.65RegPract 0.38 0.24 1.85 2.43 1.89 1.71FinInt 0.34 -0.44 1.50 1.47 1.68 2.29RegGov 2.51 1.32 3.13 2.33 2.12 1.71Prud 3.18 2.00 2.57 2.16 1.91 1.63RegPract 1.33 0.25 1.72 1.53 1.25 0.82FinInt 2.17 0.73 3.05 2.93 2.36 2.35
RegGov 6.3E-04 6.6E-04 4.1E-04 3.1E-04 4.6E-04 4.0E-04Prud 5.9E-04 6.3E-04 3.6E-04 3.3E-04 4.2E-04 4.3E-04RegPract 6.8E-04 7.5E-04 4.1E-04 3.5E-04 4.6E-04 4.5E-04FinInt 5.7E-04 5.6E-04 2.6E-04 2.6E-04 2.7E-04 3.2E-04RegGov 6.1E-04 5.4E-04 3.2E-04 1.8E-04 1.6E-04 1.5E-04Prud 5.5E-04 4.5E-04 3.1E-04 2.7E-04 2.7E-04 2.5E-04RegPract 6.7E-04 6.9E-04 4.3E-04 3.7E-04 4.1E-04 4.3E-04FinInt 5.1E-04 7.1E-04 1.8E-04 2.0E-04 6.4E-05 -6.6E-05RegGov 1.5E-04 2.6E-04 1.8E-05 1.3E-04 1.2E-04 1.8E-04Prud 4.1E-04 5.1E-04 4.1E-04 4.8E-04 4.8E-04 5.3E-04RegPract 3.1E-04 4.4E-04 2.2E-04 2.6E-04 2.7E-04 3.4E-04FinInt 4.5E-04 6.1E-04 3.0E-04 3.3E-04 3.5E-04 3.6E-04
RegGov 4.8 4.7 2.8 2.2 2.9 2.6Prud 5.2 5.3 3.0 2.8 3.2 3.3RegPract 5.5 5.7 3.1 2.8 3.2 3.2FinInt 3.5 3.2 1.5 1.5 1.4 1.7RegGov 2.2 2.0 1.1 0.7 0.5 0.5Prud 2.6 2.2 1.4 1.3 1.1 1.1RegPract 3.6 3.7 2.2 2.0 2.0 2.1FinInt 1.5 2.1 0.5 0.6 0.2 -0.2RegGov 0.9 1.4 0.1 0.7 0.6 0.9Prud 2.3 2.7 2.1 2.5 2.3 2.5RegPract 1.7 2.2 1.1 1.3 1.3 1.6FinInt 2.6 3.3 1.6 1.8 1.8 1.9
Coefficient Estimates for Per Capita GDP
t-values for Coefficient Estimates for Per Capita GDP coefficient
Coefficient Estimates for Constant
t-values for Coefficient Estimates for Constant
Coefficient Estimates for KKM coefficient
t-values for Coefficient Estimates for KKM coefficient
IOSCO
BIS
IAIS
IOSCO
BIS
IAIS
IOSCO
IAIS
IOSCO
BIS
IAIS
Kaufman, Kraay, and Mastruzzi Database 2002
IAIS
IOSCO
BIS
BIS
IAIS
IOSCO
BIS
Source: Authors’ estimates.

38
Table 11. Regressions of Standards and Codes on KKM 2006 Variables and GDP Per Capita
Voice and Acc. Pol. Stability Gov. Effectiveness Reg. Quality Rule of Law Control of Corruption
RegGov 63.9 66.4 55.5 52.4 59.4 58.0Prud 51.8 56.9 45.3 43.6 50.6 49.3RegPract 41.9 48.9 33.0 30.6 38.4 38.9FinInt 34.4 40.8 22.0 20.2 30.4 27.2RegGov 49.6 60.9 38.4 30.5 36.6 36.9Prud 53.3 50.4 36.7 37.9 43.5 43.2RegPract 48.2 54.3 34.9 34.3 41.7 41.1FinInt 43.0 54.5 33.3 35.5 27.4 33.6RegGov 50.8 63.6 45.0 45.5 54.1 54.6Prud 32.7 46.0 29.9 28.9 38.3 39.1RegPract 58.7 70.0 58.4 57.4 61.9 63.4FinInt 44.1 56.8 33.3 33.5 41.5 41.9
RegGov 15.3 18.1 11.7 10.7 13.4 13.1Prud 14.6 17.9 11.4 10.6 13.4 13.1RegPract 10.7 13.9 7.7 6.9 9.4 9.4FinInt 6.6 8.7 3.9 3.5 5.6 5.1RegGov 4.9 7.1 2.9 2.4 3.3 3.5Prud 6.7 7.3 3.7 3.8 5.1 5.2RegPract 6.8 8.8 3.9 4.0 5.6 5.6FinInt 3.5 5.1 2.1 2.1 2.0 2.6RegGov 8.1 11.4 5.0 5.1 7.4 7.6Prud 5.1 7.9 3.1 3.1 5.0 5.2RegPract 8.6 12.1 6.0 5.9 7.9 8.3FinInt 6.9 10.2 3.7 3.8 5.7 5.9
RegGov 0.0 0.0 0.2 0.3 0.2 0.2Prud 0.2 0.1 0.3 0.3 0.2 0.2RegPract 0.2 0.0 0.4 0.4 0.3 0.3FinInt 0.4 0.2 0.6 0.6 0.5 0.5RegGov 0.0 -0.2 0.2 0.4 0.3 0.3Prud 0.0 0.1 0.3 0.3 0.2 0.2RegPract 0.1 0.0 0.4 0.4 0.3 0.3FinInt 0.1 -0.1 0.3 0.3 0.5 0.4RegGov 0.3 0.1 0.4 0.4 0.2 0.2Prud 0.4 0.1 0.4 0.4 0.3 0.3RegPract 0.2 -0.1 0.2 0.2 0.1 0.1FinInt 0.2 0.0 0.4 0.4 0.3 0.3
RegGov 0.4 -0.3 2.3 3.0 1.6 1.9Prud 2.5 0.9 3.9 4.2 2.6 3.0RegPract 2.4 0.3 4.4 4.9 3.2 3.0FinInt 3.4 2.3 5.5 5.6 4.0 4.8RegGov 0.1 -1.4 1.0 1.7 1.4 1.5Prud 0.1 0.6 1.9 1.8 1.4 1.5RegPract 0.8 -0.2 2.2 2.4 1.7 1.8FinInt 0.6 -0.6 1.1 0.9 1.8 1.3RegGov 2.8 0.5 2.5 2.4 1.8 1.8Prud 3.4 1.2 2.4 2.6 1.9 1.8RegPract 1.4 -0.6 0.9 1.1 0.7 0.5FinInt 2.1 -0.3 2.7 2.7 2.2 2.2
RegGov 5.5E-04 6.1E-04 3.3E-04 2.7E-04 4.0E-04 3.6E-04Prud 5.3E-04 6.5E-04 3.7E-04 3.4E-04 4.6E-04 4.3E-04RegPract 6.4E-04 8.1E-04 4.2E-04 3.8E-04 5.0E-04 5.2E-04FinInt 5.3E-04 6.7E-04 2.3E-04 2.2E-04 3.5E-04 2.6E-04RegGov 5.4E-04 7.9E-04 3.2E-04 1.7E-04 2.0E-04 2.0E-04Prud 5.4E-04 4.8E-04 2.2E-04 2.5E-04 3.0E-04 2.8E-04RegPract 6.0E-04 7.4E-04 3.7E-04 3.6E-04 4.4E-04 4.1E-04FinInt 4.4E-04 7.1E-04 2.9E-04 3.4E-04 4.9E-05 2.0E-04RegGov 1.1E-04 3.7E-04 9.8E-05 9.7E-05 1.7E-04 1.8E-04Prud 3.7E-04 6.3E-04 4.3E-04 4.1E-04 4.8E-04 5.0E-04RegPract 2.9E-04 5.5E-04 3.3E-04 3.1E-04 3.5E-04 3.9E-04FinInt 4.5E-04 7.4E-04 3.4E-04 3.4E-04 3.9E-04 3.9E-04
RegGov 4.1 4.7 2.3 1.9 2.7 2.4Prud 4.7 5.8 3.1 2.9 3.6 3.4RegPract 5.1 6.5 3.2 2.9 3.6 3.7FinInt 3.2 4.0 1.3 1.3 1.9 1.4RegGov 1.8 3.3 1.1 0.6 0.6 0.7Prud 2.4 2.5 1.0 1.1 1.3 1.2RegPract 3.1 4.4 1.8 1.8 2.1 2.0FinInt 1.2 2.4 0.8 0.9 0.1 0.5RegGov 0.6 2.0 0.5 0.5 0.9 0.9Prud 2.1 3.3 2.2 2.1 2.3 2.4RegPract 1.5 2.9 1.6 1.5 1.7 1.9FinInt 2.6 4.0 1.8 1.8 2.0 2.0
Kaufman, Kraay, and Mastruzzi Database 2006
IAIS
IOSCO
BIS
BIS
IAIS
IOSCO
BIS
IAIS
IOSCO
BIS
IAIS
IOSCO
BIS
IAIS
IOSCO
BIS
IAIS
IOSCO
Coefficient Estimates for Per Capita GDP
t-values for Coefficient Estimates for Per Capita GDP coefficient
Coefficient Estimates for Constant
t-values for Coefficient Estimates for Constant
Coefficient Estimates for KKM coefficient
t-values for Coefficient Estimates for KKM coefficient
Source: Authors’ estimates.

39
Table 12. Regressions of Standards and Codes on BCL Variables and GDP Per Capita
Q3.4 Q 3.8.1 Q 3.8.2 Q 6.1 Q 6.2 Q 9.4 Q 12.4 Q 12.5 1/ Explanatory Note. The questions used from the BCL database are: Q 3.4 “What is the actual risk-adjusted capital ratio in banks as of yearend 2005,
RegGov 64.3 68.0 65.5 55.4 61.8 63.0 66.9 64.5 using the 1988 Basel Accord definitions?”Prud 56.3 63.2 56.6 54.1 60.4 62.4 60.8 60.4 Q 3.8.1 “What fraction of the banking system's assets is in banks that are RegPract 53.4 54.3 49.1 41.0 49.5 53.4 50.7 52.7 50 percent or more government owned as of year end 2005?” FinInt 54.8 59.9 49.4 48.0 52.3 60.8 55.8 53.0 Q 3.8.2 “What fraction of the banking system's assets is in banks that are RegGov 70.7 57.1 53.5 43.4 48.4 60.5 49.2 38.1 50 percent or more foreign owned as of year end 2005?”Prud 64.3 57.9 52.1 55.3 58.1 60.6 52.8 52.0 Q 6.1 “Can the supervisory authority force a bank to change its internal RegPract 69.4 59.3 54.4 52.3 55.2 63.4 55.7 52.8 organizational structure?1=Yes, 0 = No” FinInt 44.1 51.0 47.7 47.1 50.9 51.3 47.9 43.8 Q 6.2 “Has this power been utilized in the last 5 years? 1=Yes, 0 = No”RegGov 68.1 64.9 64.2 58.6 62.2 70.5 64.2 64.0 Q 9.4 “What is the ratio of nonperforming loans to total assets as of year-end 2005?” Prud 66.4 54.4 51.4 41.1 51.5 57.2 50.2 51.3 Q 12.4 “How many professional bank supervisors are there in total?” RegPract 84.2 66.2 67.0 67.0 66.2 72.4 67.0 66.6 Q 12.5 “How many onsite examinations per bank were performed in the last five years?” FinInt 70.8 57.2 57.6 51.0 56.8 65.7 57.6 56.2
RegGov 8.0 19.1 15.6 13.8 19.0 18.2 18.9 18.0Prud 8.0 22.4 16.7 15.5 21.3 22.0 20.5 20.4RegPract 6.5 16.4 12.5 10.6 15.5 16.5 15.5 16.4FinInt 5.6 15.1 10.3 9.1 12.8 15.6 13.4 12.6RegGov 4.8 7.6 5.5 5.3 6.9 8.0 6.4 4.6Prud 5.1 11.1 7.6 8.5 10.2 9.8 7.8 8.1RegPract 6.8 13.0 8.8 9.7 11.6 12.7 10.1 9.1FinInt 2.4 5.6 4.1 4.5 6.5 5.4 4.6 3.9RegGov 6.6 14.5 13.3 8.3 12.4 14.8 12.7 11.5Prud 6.2 10.3 9.1 5.9 9.7 10.3 9.3 8.5RegPract 7.9 13.4 12.4 9.4 12.7 13.7 12.7 11.1FinInt 8.0 13.7 12.6 7.8 12.8 14.8 12.9 12.0
RegGov 0.8 -12.2 1.9 14.9 8.7 29.7 0.0 0.0Prud 23.1 -19.1 9.4 9.9 1.8 -52.7 0.0 0.0RegPract -13.0 -15.0 7.8 15.1 3.9 -38.9 0.0 0.0FinInt 9.0 -29.2 13.7 7.9 5.4 -120.7 0.0 0.0RegGov -113.9 -34.5 -2.4 10.4 5.1 -122.7 0.0 0.0Prud -63.4 -25.6 8.3 -2.0 -6.0 -92.1 0.0 0.0RegPract -77.5 -28.0 6.0 2.8 2.4 -112.8 0.0 0.0FinInt 30.0 -6.9 3.6 -0.9 -14.9 5.2 0.0 0.0RegGov -12.7 -4.2 1.4 8.6 1.4 -78.6 0.0 0.0Prud -84.2 -11.8 2.8 14.9 4.1 -68.5 0.0 0.0RegPract -97.2 9.2 3.7 1.4 5.7 -64.4 0.0 0.0FinInt -70.3 2.6 1.9 6.1 0.1 -104.3 0.0 0.0
RegGov 0.0 -1.0 0.3 3.3 2.1 0.8 -0.7 -1.4Prud 0.6 -2.0 1.7 2.6 0.5 -1.7 -0.1 0.5RegPract -0.3 -1.4 1.2 3.5 1.0 -1.1 1.0 -0.2FinInt 0.2 -2.2 1.7 1.4 1.0 -2.7 -0.3 -1.4RegGov -1.4 -1.0 -0.2 1.2 0.7 -1.6 0.6 0.2Prud -0.9 -1.1 0.8 -0.3 -1.0 -1.4 0.2 0.0RegPract -1.4 -1.4 0.7 0.5 0.5 -2.2 -0.3 0.2FinInt 0.3 -0.2 0.2 -0.1 -1.8 0.1 0.1 -0.3RegGov -0.2 -0.3 0.2 1.2 0.2 -1.5 0.2 0.4Prud -1.3 -0.6 0.3 2.0 0.7 -1.1 0.3 0.5RegPract -1.5 0.5 0.4 0.2 1.0 -1.1 0.1 -0.2FinInt -1.3 0.2 0.3 0.9 0.0 -2.1 0.0 0.3
RegGov 6.3E-04 5.3E-04 5.4E-04 5.1E-04 5.5E-04 6.1E-04 5.3E-04 6.5E-04Prud 6.9E-04 6.1E-04 6.6E-04 6.3E-04 6.4E-04 6.3E-04 6.4E-04 6.3E-04RegPract 7.8E-04 7.0E-04 7.4E-04 7.4E-04 7.7E-04 7.2E-04 7.7E-04 7.7E-04FinInt 7.3E-04 6.7E-04 7.6E-04 7.6E-04 7.5E-04 6.6E-04 7.3E-04 8.2E-04RegGov 3.8E-04 4.5E-04 5.5E-04 5.7E-04 5.7E-04 3.3E-04 7.7E-04 1.1E-03Prud 4.4E-04 4.8E-04 5.5E-04 5.5E-04 5.0E-04 3.6E-04 4.4E-04 5.9E-04RegPract 5.1E-04 6.0E-04 6.6E-04 6.7E-04 6.1E-04 4.5E-04 5.7E-04 8.7E-04FinInt 5.7E-04 4.7E-04 5.3E-04 6.5E-04 6.5E-04 4.3E-04 5.1E-04 6.7E-04RegGov 3.8E-04 4.7E-04 4.9E-04 4.2E-04 4.7E-04 3.6E-04 3.8E-04 2.9E-04Prud 6.5E-04 6.9E-04 7.5E-04 7.1E-04 6.9E-04 6.7E-04 7.3E-04 6.8E-04RegPract 3.5E-04 4.5E-04 4.4E-04 4.4E-04 3.9E-04 3.5E-04 3.6E-04 2.8E-04FinInt 5.3E-04 6.2E-04 6.1E-04 6.7E-04 6.2E-04 4.6E-04 5.6E-04 5.1E-04
RegGov 5.0 4.2 4.6 4.9 4.9 4.9 3.9 3.9Prud 6.3 6.1 7.0 6.9 6.6 6.2 5.7 4.5RegPract 6.0 6.0 6.8 7.4 7.1 6.2 6.2 5.1FinInt 4.7 4.8 5.6 5.6 5.4 4.7 4.6 4.1RegGov 1.6 2.0 2.4 3.0 2.8 1.4 3.1 2.8Prud 2.2 3.0 3.3 3.5 3.0 1.9 2.0 1.9RegPract 3.0 4.3 4.3 5.0 4.4 3.0 3.1 3.1FinInt 1.9 1.7 1.9 2.8 3.0 1.5 1.5 1.3RegGov 2.4 3.2 3.6 2.8 3.1 2.4 2.3 1.3Prud 3.9 4.0 4.7 4.8 4.3 3.7 4.2 2.9RegPract 2.1 2.8 2.9 2.9 2.4 2.0 2.1 1.2FinInt 3.9 4.5 4.8 4.8 4.6 3.3 3.8 2.8
IAIS
IOSCO
BIS
BIS
IAIS
IOSCO
BIS
IAIS
IOSCO
BIS
IAIS
IOSCO
BIS
IAIS
IOSCO
BIS
IAIS
IOSCO
Coefficient Estimates for Per Capita GDP
t-values for Coefficient Estimates for Per Capita GDP coefficient
Barth, Caprio, Levine Database 1/
Coefficient Estimates for Constant
t-values for Coefficient Estimates for Constant
Coefficient Estimates for BCL coefficient
t-values for Coefficient Estimates for BCL coefficient
Source: Authors’ estimates.

40
APPENDIX: MAIN AREAS FOR IMPROVEMENTS IN BANKING, INSURANCE, AND SECURITIES REGULATION
Banking Regulation and Supervision
Based on the analysis summarized in Figure 5, the areas most in need of improvement in banking included supervision of other risks; connected lending; issues related to money laundering; supervisory objectives, autonomy, powers, and resources; remedial measures; and consolidated supervision.
• Supervision of other risks: The relevant Core Principle (CP13) requires that banking supervisors be satisfied that banks have in place a comprehensive risk management process to identify, measure, monitor, and control all other material risks and, where appropriate, to hold capital against these risks. The reasons for less-than-full compliance varied from country to country; in some cases the reason was lack of specific guidelines on interest rate risk and operational risk, and in other cases, the reason was weak guidelines on liquidity risk.
• Connected lending: The relevant principle (CP10) requires that—to prevent abuses arising from connected lending—banking supervisors have in place requirements that banks lend to related companies and individuals on an arm’s-length basis, that such extensions of credit are effectively monitored, and that other appropriate steps are taken to control or mitigate the risks. The most frequent issues include absence of legal prohibition to lend to connected parties on more favorable terms than to nonrelated counterparts, absence of a limit above which exposures to connected parties are subject to board approval, absence of supervisory power to deem that a connection exists in cases other than those specified in the law, and absence of power to deduct connected lending from capital or require it to be collateralized.
• Money laundering: The relevant principle (CP15) requires that banking supervisors determine that banks have adequate policies, practices, and procedures in place (including strict know-your-customer rules) that promote high ethical and professional standards in the financial sector and prevent the bank being used, intentionally or unintentionally, by criminal elements. One of the common issues was low frequency of the relevant onsite inspections.
• Supervisory objectives, autonomy, powers, and resources: The relevant principle (CP1) requires clear responsibilities and objectives for each agency involved in the supervision of banks. The most frequent weaknesses related to the potential for political interference in day-to-day supervision, the lack of budgetary independence, and the need to strengthen the legal protection of supervisors.
• Remedial measures: The relevant principle (CP22) requires that banking supervisors have at their disposal adequate supervisory measures to bring about timely corrective action when banks fail to meet prudential requirements, when there are regulatory

41
violations, or when depositors are threatened in any other way. The most frequent problems included limited powers to remove individuals, lack of statutory “prompt corrective action” procedures, and lack of powers to restrict dividend payments.
• Consolidated supervision: The relevant principle (CP20) notes that an essential element of banking supervision is the ability to supervise a banking group on a consolidated basis. The assessments often noted that supervisors need to rise to the challenge posed by the conglomerization of systems, which can provide systems with more stability, but can also pose additional challenges resulting from possible draining of capital from one type of institution to another. It can also create opportunities for arbitrage when prudential requirements are not well aligned across the different business lines. The most common issues include insufficient resources in insurance supervision or the absence of a fully articulated structure for sharing of information and assessments.
Insurance Regulation and Supervision In insurance regulation, areas with low observance (Figure 6) ranged from market conduct issues to internal controls, derivatives and off-balance-sheet items, organization of the supervisor, corporate governance, assets, onsite inspection, licensing, and cross-border business operations. Specifically:
• Market conduct issues: The relevant principle (CP11)26 requires insurance supervisors to ensure that insurers and intermediaries exercise the necessary knowledge, skills, and integrity in dealings with their customers. The most frequent weaknesses relate to ensuring that market conduct issues are better handled at the point of sale when the agent is actually selling the product. Some assessments noted that this is especially relevant for unit-linked products, which may not be suitable for all customers (from a risk tolerance perspective) and may be purchased on the basis of unrealistic expectations.
• Internal controls: The relevant principle (CP5) requires the insurance supervisor to be able to: review the internal controls that the board of directors and management approve and apply; request strengthening of the controls where necessary; and require the board of directors to provide suitable prudential oversight, such as setting standards for underwriting risks and setting qualitative and quantitative standards for investment and liquidity management. The reasons for less-than-full compliance usually included lack of legislative support for internal controls in the operations of insurance companies.
26 For simplicity, the references to individual ICP principles are based on the 2000 IAIS standard, which has so far been used for a majority of EU countries that had the ICP assessment. ICP assessments based on the 2003 IAIS standards were also included in the analysis and are reflected in this summary.

42
• Derivatives and off-balance-sheet items: The relevant principle (CP9) requires the insurance supervisor to be able to set requirements with respect to the use of derivatives and off-balance-sheet items. In many cases, the assessments concluded that the onsite inspection programs generally need to be amended to state more precisely the work that has to be done by supervisors with regard to derivatives.
• Organization of the supervisor: The relevant principle (CP1) requires that the insurance supervisor be organized so as to be able to accomplish its primary task, which is to maintain efficient, fair, safe, and stable insurance markets for the benefit and protection of policyholders. The most common reasons behind less-than-full compliance were potential political interference in supervision and lack of adequate resources.
• Corporate governance: The relevant principle (CP4) requires establishing standards to deal with corporate governance. The most frequent reasons for less-than-full compliance were insufficient powers of the supervisory agency.
• Assets: The relevant principle (CP6) requires that standards be established with respect to the assets of companies licensed to operate in the jurisdiction. The most common reason for less-than-full compliance was the lack of specificity in the standards for establishing internal controls for managing assets in accordance with the overall investment policy.
• On-site inspection: The relevant principle (CP13) requires that the insurance supervisor be able to conduct onsite inspections to review the business activities and affairs of the company, including the books, records, accounts, and other documents. In most countries, the main reason for less-than-full compliance was the extended period between inspections for most companies and less than full implementation of a risk-based approach.
• Licensing: The relevant principle (CP2) requires that companies wishing to underwrite insurance in the domestic insurance market be licensed.
• Cross-border business operations: The relevant principle (CP15) notes that the insurance supervisor should ensure that all foreign insurance establishments and all insurance establishments of international insurance groups and international insurers are subject to effective supervision; that all newly created cross-border insurance establishments are subject to consultation between host and home supervisors; and that all foreign insurers providing insurance coverage on a cross-border services basis are subject to effective supervision. The reasons for less-than-full compliance varied from country to country, but one main concern was a lack of resources for supervisors to actively supervise branches of financial institutions abroad.

43
Securities Regulation and Supervision In securities regulation, the number of low-compliance areas was relatively smaller than in banking and insurance. The main areas for improvement (Figure 7) relate to enforcement powers and the compliance program; capital and other prudential requirements; powers, resources, and capacity; and operational independence and accountability.
• Enforcement powers and compliance program: The relevant principle (Q10) requires an effective and credible use of inspection, investigation, surveillance, and enforcement powers as well as implementation of an effective compliance program. The most frequent reason for less-than-full compliance was the limited ability of the supervisor to carry out full inspections, investigations, surveillance, and enforcement.
• Capital and other prudential requirements: The relevant principle (Q22) requires that there be initial and ongoing capital and other prudential requirements for market intermediaries that reflect the risks these intermediaries undertake. A common issue under this principle was that capital requirements have insufficient risk component, because regulators had a weak understanding of market intermediary operations.
• Powers, resources, and capacity: The relevant principle (Q03) requires that the regulator has adequate powers, proper resources, and the capacity to perform its functions and exercise its powers. Most of the countries less-than-fully compliant with this criterion were found needing more supervisory resources and some clarification of supervisory powers and institutional arrangements.
• Operational independence and accountability: The relevant principle (Q02) requires that the regulator be operationally independent and accountable in the exercise of its functions and powers. The most frequent reasons for less-than-full compliance were a lack of budgetary independence and the potential for political interference.

44
REFERENCES
Barth, James R., Gerard Caprio, and Ross Levine, 2006, Rethinking Bank Regulation: Till Angels Govern (Cambridge, MA: Cambridge University Press).
Carmichael, Jeffrey, Alexander Fleming, and David T. Llewellyn, 2004, Aligning Financial
Supervisory Structures with Country Needs (Washington, DC: World Bank). Carvajal, Ana, and Jennifer Elliott, 2007, “Strengths and Weaknesses in Securities Market
Regulation: A Global Analysis,” IMF Working Paper No. 07/259 (Washington: International Monetary Fund).
Čihák, Martin, and Alexander Tieman, 2007, “Assessing Current Prudential Arrangements,”
In Jörg Decressin, Hamid Faruqee, and Wim Fonteyne (eds.), Integrating Europe’s Financial Markets (Washington: International Monetary Fund).
Čihák, Martin, and Richard Podpiera, 2006, “Is One Watchdog Better Than Three?
International Experience with Integrated Financial Sector Supervision,” IMF Working Paper No. 06/57 (Washington: International Monetary Fund).
Čihák, Martin, and Richard Podpiera, 2008, “Integrated Financial Supervision: Which
Model?,” North American Journal of Economics and Finance, doi:10.1016/j.najef.2008.03.003.
Das, Udaibir S., Marc Quintyn, and Kina Chenard, 2004, “Does Regulatory Governance
Matter for Financial System Stability? An Empirical Analysis.” IMF Working Paper 04/89 (Washington, DC: International Monetary Fund).
Dewatripont, M. and Jean Tirole, 1994, The Prudential Regulation of Banks (Cambridge:
MIT Press). Herring, Richard, and Anthony Santomero, 2000, “What is Optimal Regulation?”
(Pennsylvania: Financial Institution Center, University of Pennsylvania). International Monetary Fund, 2002, Implementation of the Basel Core Principles for
Effective Banking Supervision, Experiences, Influences, and Perspectives (Washington, D.C.: International Monetary Fund). Available at http://www.imf.org/external/np/mae/bcore/2002/092302.pdf.
International Monetary Fund, 2004, Financial Sector Regulation: Issues and Gaps.
(Washington, D.C.: International Monetary Fund) Available at http://www.imf.org/external/np/mfd/2004/eng/080404.pdf.
Kaufmann, Daniel, Aart Kraay, and Massimo Mastruzzi, 2003, “Governance Matters III:
Governance Indicators for 1996–2002” (Washington, D.C.: World Bank). Available at www.worldbank.org.
45
Kaufmann, Daniel, Aart Kraay, and Massimo Mastruzzi, 2007, “Governance Matters IV: Governance Indicators for 1996–2006” (Washington, D.C.: World Bank). Available at www.worldbank.org.
Podpiera, Richard, 2004, “Does Compliance with Basel Core Principles Bring Any
Measurable Benefits?” IMF Working Paper No. 04/204. (Washington, D.C.: International Monetary Fund).
Wajid, S. Kal, Alexander Tieman, May Khamis, Francois Haas, Dirk Schoenmaker, Plamen
Iossifov, and Kalin Tintchev, 2007, Financial Integration in the Nordic-Baltic Region (Washington, D.C.: International Monetary Fund).