Quality of Care Delivered by General Internists who...
19
1 Quality of Care Delivered by General Internists who Graduated from Foreign versus U.S. Medical Schools in U.S. Hospitals: Observational Study (Online-Only Material) Tsugawa Y, Jena AB, Orav EJ, and Jha AK. Contents: Supplementary Appendix 1 Table A. ICD-9 (International Classification of Diseases, 9th Edition) codes Table B. Patient outcomes between USMGs and IMGs, by primary diagnosis Table C. Characteristics of patients treated by hospitalist physicians, international versus U.S. medical graduates Table D. Patient outcomes between USMGs and IMGs, among hospitalists Table E. Patient mortality rates between USMGs and IMGs, additional analyses Table F. Patient readmission rates between USMGs and IMGs, additional analyses Table G. Patient costs of care between USMGs and IMGs, additional analyses Table H. Stratified analysis by teaching status of hospitals Fig A. Adjusted patient mortality rates by country Fig B. Adjusted patient readmission rates by country Fig C. Adjusted patient costs of care by country
Transcript of Quality of Care Delivered by General Internists who...

1
Quality of Care Delivered by General Internists who Graduated from Foreign versus U.S. Medical
Schools in U.S. Hospitals: Observational Study
(Online-Only Material)
Tsugawa Y, Jena AB, Orav EJ, and Jha AK.
Contents:
Supplementary Appendix 1
Table A. ICD-9 (International Classification of Diseases, 9th Edition) codes
Table B. Patient outcomes between USMGs and IMGs, by primary diagnosis
Table C. Characteristics of patients treated by hospitalist physicians, international versus U.S. medical
graduates
Table D. Patient outcomes between USMGs and IMGs, among hospitalists
Table E. Patient mortality rates between USMGs and IMGs, additional analyses
Table F. Patient readmission rates between USMGs and IMGs, additional analyses
Table G. Patient costs of care between USMGs and IMGs, additional analyses
Table H. Stratified analysis by teaching status of hospitals
Fig A. Adjusted patient mortality rates by country
Fig B. Adjusted patient readmission rates by country
Fig C. Adjusted patient costs of care by country

2
Supplementary Appendix 1
Licensure process for international medical graduates to practice in the U.S.
In order for the international medical graduates (IMGs) to practice medicine in the U.S., they are
required to pass United States Medical Licensing Examination (USMLE) (Step 1, Step 2 Clinical
Knowledge [CK], and Step 2 Clinical Skills [CS]) and complete residency training in the U.S.1 USMLE
examinations cost them more than $3,000 including international test delivery surcharges.2 While Step
1 and Step 2 CK can be taken at examination centers outside the U.S., IMGs are usually required to
travel to the U.S. to take Step 2 CS, which puts additional financial burden on IMGs. Even if IMGs have
successfully passed USMLE examinations and acquired Educational Commission for Foreign Medical
Graduates (ECFMG) certification, IMGs who would like to practice in the U.S. should complete a
residency program accredited by Accreditation Council for Graduate Medical Education (ACGME) in the
U.S. or Canada, often in addition to the residency training they have already received in their home
country. In general, IMGs enter residency programs through the National Resident Matching Program.
Physician database collected by Doximity
Physician characteristics were obtained by linking the National Provider Identifier (NPI) to a database
assembled by Doximity, a company that provides online professional networking services for U.S.
physicians. Doximity has collected information on physicians for all U.S. physicians – including
registered members of the service and non-registered physicians – from multiple sources and data
partnerships, including the National Plan and Provider Enumeration System NPI Registry, the American
Board of Medical Specialties, other specialty societies, state licensing boards, and collaborating
hospitals and medical schools. Approximately 95% of physicians who were treating Medicare
beneficiaries in our data could be found in the Doximity database. Details and validation of the
Doximity database are described elsewhere.3-5
Assignment of patients to physicians
For each hospitalization, we assigned a physician who accounted for the largest Part B spending. We
focused on Part B spending because it encompasses professional and other services at the discretion of
physicians; and for hospitalized patients, Part A spending is largely invariant to physician decisions on

3
an individual patient’s treatment because of the fixed DRG payment (only 1.0% of hospitalizations in
our data received an outlier payment). It is also possible that a patient was admitted on a weekend or
during the night but most of the clinical decisions about that patient’s care happened in subsequent
days by a different physician. In this case, the practice style of the second physician, not the admitting
physician, should be responsible for the outcomes of that patient. Similar methods have been used by
other studies.5-8 As a sensitivity analysis, we used two alternative methods for assigning physicians to
patients, (1) assigning physicians who accounted for the largest number of
evaluation-and-management (E&M) claims and (2) assigning physicians who billed the first E&M claim,
and found that they produce nearly identical results. For patients transferred to other acute care
hospitals, we attributed patient outcomes to the physician of the initial hospitalization.9 10
Statistical analysis
We examined whether patient mortality rates differed between IMGs and U.S. medical graduates
(USMGs). To create a homogeneous group of physicians who underwent similar medical school training,
we restricted to graduates of allopathic medical schools. We constructed three models. First, we
compared patient outcomes between IMGs and USMGs after adjusting for patient characteristics using
a multivariable logistic regression model. Second, we adjusted for both patient and physician
characteristics, thereby comparing adjusted outcomes of patients treated by IMGs versus USMGs
across hospitals. Third, because IMGs may practice in hospitals with otherwise higher rates of mortality
and readmissions (e.g., rural hospitals11 12), we estimated the above multivariable regression model
with the additional inclusion of hospital fixed effects, effectively comparing IMGs and USMGs within
the same hospital.13-15 To account for potential correlation of outcomes among patients treated by the
same physician, we clustered standard errors at the physician level.16 We presented risk-adjusted
patient mortality rates, calculated by estimating predicted probabilities of death for each
hospitalization averaged over the distribution of covariates in our national sample and fixing the
indicator variable for IMG at either one or zero (known as the marginal standardization form of
predictive margins17). We used similar methods for the analyses of readmissions (using multivariable
logistic regression models) and costs (using multivariable ordinary least squares regression models).

4
Sensitivity analyses
We conducted a series of sensitivity analyses. First, to address the possibility that IMGs may treat
patients with lesser or greater unmeasured illness severity, we restricted the study population to
patients treated by hospitalist physicians. Hospitalists are physicians who specialize in the care of
hospitalized patients. The specialty of hospitalist in the U.S. health system, which began in mid-1990s,
is fast emerging; it is estimated that approximately 21,100 to 22,900 hospitalists were practicing in the
U.S. in 2010.18 Hospitalists typically work in shifts, and therefore, within the same hospital, patients
treated by hospitalists are plausibly quasi-randomized to a given physician based on that physician’s
work schedule.5 19 We used a previously validated definition of hospitalist as general internists with at
least 20 E&M claims in a given year (equivalent to 5 or more E&M claims in a 5% sample), who filed at
least 90% of their total E&M claims in an inpatient setting as defined by Current Procedural
Terminology [CPT] codes 99221-99223, 99231-99233, and 99251-99255. This approach had been
validated with a high sensitivity (84.2%) specificity (96.5%), and a positive predictive value (88.9%) for
identifying hospitalists in the Medicare sample.20
Second, to test sensitivity of our findings to how we attributed patients to physicians, we attributed
patients to physicians using 2 alternative methods: (1) attributing to physicians who had largest
number of evaluation and management (E&M) claims and (2) attributing to physicians who billed the
first E&M claim for a given hospitalization. Similar methods have been used in previous studies.5-8
Third, while U.S. citizens who go abroad for medical school (U.S. citizen IMGs) constitute about
one-fifth of all IMGs,21 we could not distinguishing U.S. citizen IMGs from non-U.S. citizen IMGs in our
data. Studies have suggested that U.S. citizen IMGs who attend medical schools in Central America and
the Caribbean countries may not perform well.22 23 In order to minimize the influence of these U.S.
citizen IMGs, we reanalyzed the data after excluding IMGs who graduated from medical schools
located in Central America and the Caribbean countries (because three quarters of U.S. citizen IMGs
graduated from medical schools in these countries23-25).

5
Fourth, as differences in length of stay (LOS), utilization of care (total Part B spending per
hospitalization), or in discharge location may explain the difference in patient outcomes between IMGs
and USMGs, we further adjusted our regression models for these variables. LOS and utilization of care
were modeled as continuous variables with quadratic and cubic terms to allow for a non-linear
relationship. Discharge location was used as a categorical variable: home, skilled nursing facilities
(SNFs), rehabilitation facility, hospice, and others.
Fifth, in order to address the possibility that unobserved care preferences of patients such as
do-not-resuscitate (DNR) directives may confound our findings, we reanalyzed the data after excluding
patients with cancer (as cancer is one of the strongest predictors of DNR directives26) and patients who
were discharged to hospice.
Sixth, it is possible that IMGs may be more or less likely to work in ICUs as intensivists and have
severely ill patients. To address this issue, we reanalyzed the data after excluding hospitals with a
medical ICU.
Seventh, it is possible that residents are billing Medicare claims on behalf of their attending physicians
at teaching hospitals, and differences in patient outcomes may be due to the quality of care delivered
by residents. To address this, we stratified our sample by teaching status of hospitals (major teaching,
minor teaching, and non-teaching hospitals), and within each group, we compared IMGs and USMGs
(adjusted for patient and physician characteristics and hospital fixed effects).
Finally, we investigated whether patient outcomes varied by countries where IMGs were trained. We
restricted to eight countries that had the largest number of hospitalized patients in our sample (India,
Pakistan, Philippines, Syria, Nigeria, Mexico, Egypt, and China) to avoid unstable estimates.
Data preparation was conducted using SAS, version 9.4 (SAS Institute), and analyses were performed
using Stata, version 14 (Stata-Corp).

6
REFERENCES
1. American Medical Association. International Medical Graduates Chicago, IL [Available from:
https://www.ama-assn.org/life-career/international-medical-graduates accessed January 19
2017.
2. Educational Commission for Foreign Medical Graduates (ECFMG). [Available from:
http://www.ecfmg.org/fees/index.html accessed January 25 2017.
3. Jena AB, Khullar D, Ho O, et al. Sex Differences in Academic Rank in US Medical Schools in 2014.
JAMA 2015;314(11):1149-58. doi: 10.1001/jama.2015.10680
4. Jena AB, Olenski AR, Blumenthal DM. Sex Differences in Physician Salary in US Public Medical Schools.
JAMA Intern Med 2016 doi: 10.1001/jamainternmed.2016.3284
5. Tsugawa Y, Jena AB, Figueroa JF, et al. Comparison of Hospital Mortality and Readmission Rates for
Medicare Patients Treated by Male vs Female Physicians. JAMA Intern Med 2016 doi:
10.1001/jamainternmed.2016.7875
6. McWilliams JM, Hatfield LA, Chernew ME, et al. Early Performance of Accountable Care
Organizations in Medicare. N Engl J Med 2016;374(24):2357-66. doi: 10.1056/NEJMsa1600142
7. McWilliams JM, Landon BE, Chernew ME, et al. Changes in Patients' Experiences in Medicare
Accountable Care Organizations. N Engl J Med 2014;371(18):1715-24.
8. Mehrotra A, Adams JL, Thomas JW, et al. The effect of different attribution rules on individual
physician cost profiles. Ann Intern Med 2010;152(10):649-54. doi:
10.7326/0003-4819-152-10-201005180-00005 [published Online First: 2010/05/19]
9. Ross JS, Normand SL, Wang Y, et al. Hospital volume and 30-day mortality for three common medical
conditions. N Engl J Med 2010;362(12):1110-8. doi: 10.1056/NEJMsa0907130
10. Drye EE, Normand SL, Wang Y, et al. Comparison of hospital risk-standardized mortality rates
calculated by using in-hospital and 30-day models: an observational study with implications for
hospital profiling. Ann Intern Med 2012;156(1 Pt 1):19-26. doi:
10.7326/0003-4819-156-1-201201030-00004
11. Thompson MJ, Hagopian A, Fordyce M, et al. Do international medical graduates (IMGs) "fill the
gap" in rural primary care in the United States? A national study. J Rural Health
2009;25(2):124-34. doi: 10.1111/j.1748-0361.2009.00208.x

7
12. Fordyce MA, Doescher MP, Chen FM, et al. Osteopathic physicians and international medical
graduates in the rural primary care physician workforce. Fam Med 2012;44(6):396-403.
13. Gunasekara FI, Richardson K, Carter K, et al. Fixed effects analysis of repeated measures data. Int J
Epidemiol 2014;43(1):264-9. doi: 10.1093/ije/dyt221
14. Allison PD. Fixed effects regression methods for longitudinal data using SAS: Sas Institute 2005.
15. Kaufman JS. Commentary: Why are we biased against bias? Int J Epidemiol 2008;37(3):624-6. doi:
10.1093/ije/dyn035
16. Arellano M. PRACTITIONERS’CORNER: Computing Robust Standard Errors for Within-groups
Estimators. Oxford bulletin of Economics and Statistics 1987;49(4):431-34.
17. Williams R. Using the margins command to estimate and interpret adjusted predictions and
marginal effects. Stata Journal 2012;12(2):308.
18. Harbuck SM, Follmer AD, Dill MJ, et al. Estimating the number and characteristics of hospitalist
physicians in the United States and their possible workforce implications. Washington DC:
Association of American Medical Colleges 2012.
19. Hinami K, Whelan CT, Miller JA, et al. Job characteristics, satisfaction, and burnout across hospitalist
practice models. J Hosp Med 2012;7(5):402-10. doi: 10.1002/jhm.1907
20. Kuo YF, Sharma G, Freeman JL, et al. Growth in the care of older patients by hospitalists in the
United States. N Engl J Med 2009;360(11):1102-12. doi: 10.1056/NEJMsa0802381
21. Boulet JR, Norcini JJ, Whelan GP, et al. The international medical graduate pipeline: recent trends in
certification and residency training. Health Aff (Millwood) 2006;25(2):469-77. doi:
10.1377/hlthaff.25.2.469
22. Boulet JR, Swanson DB, Cooper RA, et al. A comparison of the characteristics and examination
performances of U.S. and non-U.S. citizen international medical graduates who sought
Educational Commission for Foreign Medical Graduates certification: 1995-2004. Acad Med
2006;81(10 Suppl):S116-9.
23. Norcini J, Anderson MB, McKinley DW. The medical education of United States citizens who train
abroad. Surgery 2006;140(3):338-46. doi: 10.1016/j.surg.2006.06.001
24. McAvinue MB, Boulet JR, Kelly WC, et al. U.S. citizens who graduated from medical schools outside
the United States and Canada and received certification from the Educational Commission for

8
Foreign Medical Graduates, 1983-2002. Acad Med 2005;80(5):473-8.
25. Eckhert NL, van Zanten M. U.S.-citizen international medical graduates--a boon for the workforce?
N Engl J Med 2015;372(18):1686-7. doi: 10.1056/NEJMp1415239
26. Covinsky KE, Fuller JD, Yaffe K, et al. Communication and decision-making in seriously ill patients:
findings of the SUPPORT project. The Study to Understand Prognoses and Preferences for
Outcomes and Risks of Treatments. J Am Geriatr Soc 2000;48(5 Suppl):S187-93.

9
Table A. ICD-9 (International Classification of Diseases, 9th Edition) codes
Condition ICD-9 codes
Sepsis 0031, 0202, 0223, 0362, 0380, 0381, 03810, 03811, 03812, 03819, 0382, 0383, 03840, 03841, 03842, 03843, 03844, 03849, 0388, 0389, 0545, 449, 77181, 7907, 99591, 99592
Pneumonia
00322, 0203, 0204, 0205, 0212, 0221, 0310, 0391, 0521, 0551, 0730, 0830, 1124, 1140, 1144, 1145, 11505, 11515, 11595, 1304, 1363, 4800, 4801, 4802, 4803, 4808, 4809, 481, 4820, 4821, 4822, 4823, 48230, 48231, 48232, 48239, 4824, 48240, 48241, 48242, 48249, 4828, 48281, 48282, 48283, 48284, 48289, 4829, 483, 4830, 4831, 4838, 4841, 4843, 4845, 4846, 4847, 4848, 485, 486, 5130, 5171
Congestive heart failure
39891, 4280, 4281, 42820, 42821, 42822, 42823, 42830, 42831, 42832, 42833, 42840, 42841, 42842, 42843, 4289
Chronic obstructive pulmonary disease
490, 4910, 4911, 4912, 49120, 49121, 49122, 4918, 4919, 4920, 4928, 494, 4940, 4941, 496
Urinary tract infection
03284, 59000, 59001, 59010, 59011, 5902, 5903, 59080, 59081, 5909, 5950, 5951, 5952, 5953, 5954, 59581, 59582, 59589, 5959, 5970, 59780, 59781, 59789, 59800, 59801, 5990
Arrhythmia 4270, 4271, 4272, 42731, 42732, 42760, 42761, 42769, 42781, 42789, 4279, 7850, 7851

10
Table B. Patient outcomes between USMGs and IMGs, by primary diagnosis
No. of hospitalizations
(No. of physicians)
Adjusted patient outcomes (95%CI)
Adjusted OR/difference
(95%CI) IMG vs USMG
p-value
IMGs USMGs
30-day mortality rate
Sepsis 107,778 (26,273)
24.8% (24.4% to 25.2%)
25.0% (24.6% to 25.4%)
0.99 (0.95 to 1.03)
0.52
Pneumonia 85,959 (24,877)
11.1% (10.8% to 11.4%)
11.8% (11.5% to 12.2%)
0.92 (0.87 to 0.97)
0.004
CHF 81,497 (24,226)
12.2% (11.9% to 12.5%)
12.8% (12.4% to 13.1%)
0.94 (0.89 to 0.99)
0.03
COPD 50,856 (17,152)
6.6% (6.3% to 6.9%)
7.0% (6.6% to 7.3%)
0.94 (0.86 to 1.03)
0.19
UTI 51,125 (18,047)
7.5% (7.1% to 7.8%)
7.3% (6.9% to 7.6%)
1.03 (0.94 to 1.12)
0.57
Arrhythmia 26,618 (12,621)
8.0% (7.6% to 8.5%)
8.5% (8.0% to 9.0%)
0.93 (0.83 to 1.05)
0.26
30-day readmission rate
Sepsis 93,080 (24,548)
16.6% (16.2% to 16.9%)
16.3% (15.9% to 16.7%)
1.02 (0.97 to 1.06)
0.42
Pneumonia 85,328 (25,161)
15.1% (14.8% to 15.5%)
15.6% (15.2% to 15.9%)
0.96 (0.92 to 1.01)
0.13
CHF 81,331 (24,531)
21.4% (21.0% to 21.8%)
21.0% (20.5% to 21.4%)
1.03 (0.99 to 1.07)
0.18
COPD 62,590 (20,969)
19.5% (19.0% to 19.9%)
19.8% (19.3% to 20.3%)
0.98 (0.93 to 1.03)
0.39
UTI 59,332 (20,876)
15.6% (15.2% to 16.0%)
15.6% (15.1% to 16.1%)
1.00 (0.95 to 1.06)
0.93
Arrhythmia 34,402 (16,036)
16.1% (15.5% to 16.6%)
16.3% (15.7% to 17.0%)
0.98 (0.91 to 1.05)
0.56
Costs of care
Sepsis 115,325 (27,308)
$1634 ($1617 to $1650)
$1552 ($1534 to $1571)
+$82 (+$54 to +$109)
<0.001
Pneumonia 94,851 (26,812)
$1077 ($1065 to $1088)
$1024 ($1012 to $1036)
+$52 (+$34 to +$71)
<0.001
CHF 89,363 (26,044)
$1188 ($1177 to $1199)
$1138 ($1126 to $1151)
+$49 (+$31 to +$67)
<0.001
COPD 67,934 (22,519)
$899 ($889 to $908)
$866 ($856 to $876)
+$33 (+$17 to +$48)
<0.001
UTI 65,000 (22,802)
$791 ($783 to $798)
$754 ($746 to $763)
+$36 (+$24 to +$49)
<0.001
Arrhythmia 40,808 (18,862)
$1000 ($988 to $1011)
$946 ($933 to $958)
+$54 (+$35 to +$73)
<0.001
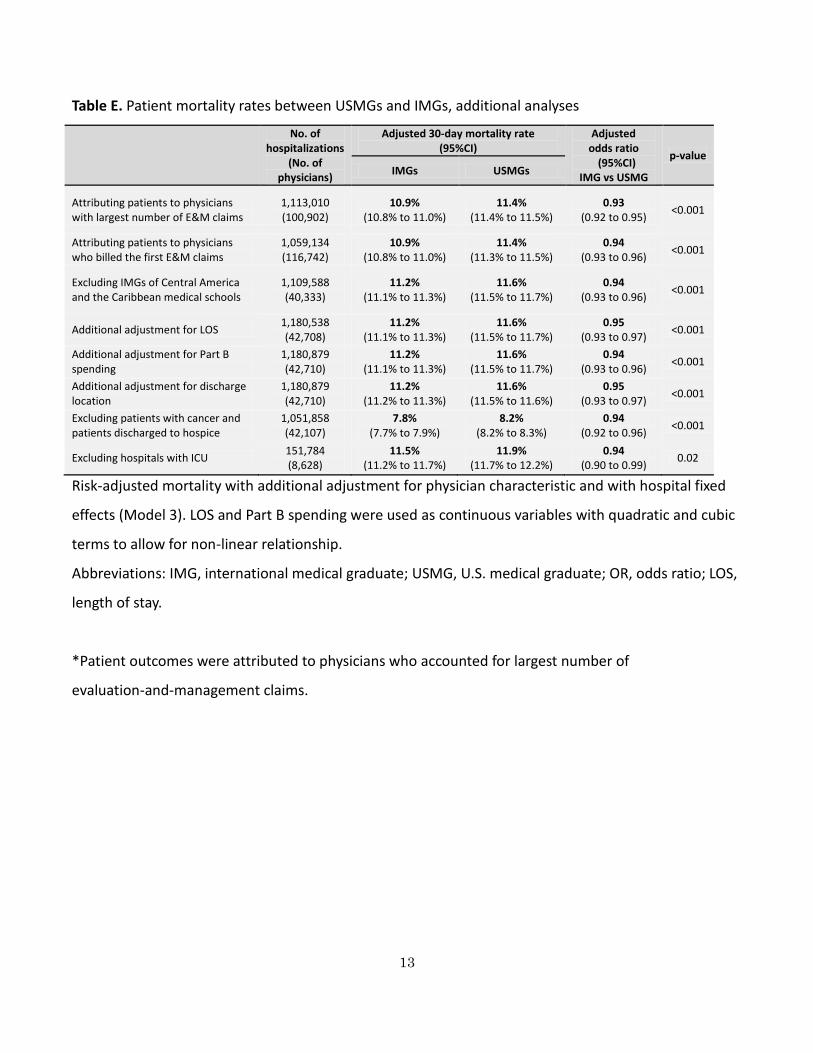
Risk-adjusted mortality with additional adjustment for physician characteristic and with hospital fixed
effects (Model 3). Costs of care are defined as an average total Part B spending per hospitalization.
Abbreviations: IMG, international medical graduate; USMG, U.S. medical graduate; OR, odds ratio; CHF,
congestive heart failure; COPD, chronic obstructive pulmonary disease.

11
Table C. Characteristics of patients treated by hospitalist physicians, international versus U.S. medical
graduates. Values are numbers (percentages) unless stated otherwise.
International Medical Graduates
(n=8,975) U.S. Medical Graduates
(n=8,786)
Number of patients, n 383,137 307,681
Patient's age, y, mean (SD) 80.4 (8.5) 80.7 (8.5)
Female 232,370 (60.7%) 186,162 (60.5%)
Race
White 315,242 (82.3%) 254,904 (82.9%)
Black 38,761 (10.1%) 30,041 (9.8%)
Hispanic 19,029 (5.0%) 12,394 (4.0%)
Other races 10,105 (2.6%) 10,342 (3.4%)
Household income, $, mean (SD) 56,561 (22,155) 57,955 (23,196)
Medicaid status 92,246 (24.1%) 69,269 (22.5%)
Coexisting condition
CHF 76,305 (19.9%) 60,643 (19.7%)
COPD 97,307 (25.4%) 76,279 (24.8%)
Diabetes 123,314 (32.2%) 95,599 (31.1%)
Renal failure 85,582 (22.3%) 68,555 (22.3%)
Neurological disorders 59,397 (15.5%) 48,073 (15.6%)
Cancer 26,415 (6.9%) 22,361 (7.3%)
Mental illness 57,734 (15.1%) 47,042 (15.3%)
Discharge location
Home 225,047 (58.7%) 180,297 (58.6%)
Skilled nursing facility 100,843 (26.3%) 79,830 (26.0%)
Rehabilitation facility 9,756 (2.6%) 6,912 (2.3%)
Hospice 17,273 (4.5%) 15,276 (5.0%)
Others 30,218 (7.9%) 25,366 (8.2%)
Abbreviations: CHF, congestive heart failure; COPD, chronic obstructive pulmonary disease

12
Table D. Patient outcomes between USMGs and IMGs, among hospitalists
No. of hospitalizations
(No. of physicians)
Adjusted patient outcomes (95%CI)
Adjusted OR/difference
(95%CI) IMG vs USMG
p-value
IMGs USMGs
30-day mortality rate
Model 1: Risk-adjusted 30-day mortality*
690,818 (17,761)
10.9% (10.8% to 11.0%)
11.3% (11.2% to 11.4%)
0.95 (0.93 to 0.97)
<0.001
Model 2: Model 1 + physician characteristics
670,969 (17,216)
11.0% (10.8% to 11.1%)
11.2% (11.0% to 11.3%)
0.97 (0.95 to 0.99)
0.02
Model 3: Model 2 + hospital fixed effects
669,564 (17,188)
10.8% (10.7% to 10.9%)
11.4% (11.2% to 11.5%)
0.94 (0.91 to 0.96)
<0.001
30-day readmission
rate
Model 1: Risk-adjusted 30-day readmissions*
678,155 (17,766)
15.3% (15.1% to 15.4%)
14.6% (14.4% to 14.7%)
1.06 (1.04 to 1.07)
<0.001
Model 2: Model 1 + physician characteristics
658,762 (17,221)
15.2% (15.0% to 15.3%)
14.7% (14.5% to 14.8%)
1.04 (1.02 to 1.06)
<0.001
Model 3: Model 2 + hospital fixed effects
658,019 (17,187)
14.9% (14.8% to 15.0%)
15.1% (14.9% to 15.2%)
0.99 (0.97 to 1.01)
0.18
Total Part B costs per
hospitalization
Model 1: Risk-adjusted spending*
730,421 (17,834)
$1079 ($1069 to $1089)
$960 ($952 to $968)
+$119 (+$106 to +$132)
<0.001
Model 2: Model 1 + physician characteristics
709,363 (17,233)
$1076 ($1067 to $1086)
$964 ($955 to $973)
+$113 (+$100 to +$126)
<0.001
Model 3: Model 2 + hospital fixed effects
709,359 (17,233)
$1044 ($1039 to $1049)
$1005 ($999 to $1010)
+$39 (+$31 to +$47)
<0.001
Abbreviations: IMG, international medical graduate; USMG, U.S. medical graduate; OR, odds ratio.
*Risk-adjustment using patients’ age, sex, race, primary diagnosis, coexisting conditions (Elixhauser
comorbidity index), median household income, Medicaid status, year indicators, and day of the week.
13
Table E. Patient mortality rates between USMGs and IMGs, additional analyses
No. of hospitalizations
(No. of physicians)
Adjusted 30-day mortality rate (95%CI)
Adjusted odds ratio (95%CI)
IMG vs USMG
p-value
IMGs USMGs
Attributing patients to physicians with largest number of E&M claims
1,113,010 (100,902)
10.9% (10.8% to 11.0%)
11.4% (11.4% to 11.5%)
0.93 (0.92 to 0.95)
<0.001
Attributing patients to physicians who billed the first E&M claims
1,059,134 (116,742)
10.9% (10.8% to 11.0%)
11.4% (11.3% to 11.5%)
0.94 (0.93 to 0.96)
<0.001
Excluding IMGs of Central America and the Caribbean medical schools
1,109,588 (40,333)
11.2% (11.1% to 11.3%)
11.6% (11.5% to 11.7%)
0.94 (0.93 to 0.96)
<0.001
Additional adjustment for LOS 1,180,538 (42,708)
11.2% (11.1% to 11.3%)
11.6% (11.5% to 11.7%)
0.95 (0.93 to 0.97)
<0.001
Additional adjustment for Part B spending
1,180,879 (42,710)
11.2% (11.1% to 11.3%)
11.6% (11.5% to 11.7%)
0.94 (0.93 to 0.96)
<0.001
Additional adjustment for discharge location
1,180,879 (42,710)
11.2% (11.2% to 11.3%)
11.6% (11.5% to 11.6%)
0.95 (0.93 to 0.97)
<0.001
Excluding patients with cancer and patients discharged to hospice
1,051,858 (42,107)
7.8% (7.7% to 7.9%)
8.2% (8.2% to 8.3%)
0.94 (0.92 to 0.96)
<0.001
Excluding hospitals with ICU 151,784 (8,628)
11.5% (11.2% to 11.7%)
11.9% (11.7% to 12.2%)
0.94 (0.90 to 0.99)
0.02
Risk-adjusted mortality with additional adjustment for physician characteristic and with hospital fixed
effects (Model 3). LOS and Part B spending were used as continuous variables with quadratic and cubic
terms to allow for non-linear relationship.
Abbreviations: IMG, international medical graduate; USMG, U.S. medical graduate; OR, odds ratio; LOS,
length of stay.
*Patient outcomes were attributed to physicians who accounted for largest number of
evaluation-and-management claims.

14
Table F. Patient readmission rates between USMGs and IMGs, additional analyses
No. of hospitalizations
(No. of physicians)
Adjusted 30-day readmission rate (95%CI)
Adjusted odds ratio (95%CI)
IMG vs USMG
p-value
IMGs USMGs
Attributing patients to physicians with largest number of E&M claims
1,084,888 (99,271)
15.4% (15.3% to 15.5%)
15.5% (15.4% to 15.6%)
1.00 (0.98 to 1.01)
0.58
Attributing patients to physicians who billed the first E&M claims
1,031,604 (116,093)
15.3% (15.1% to 15.4%)
15.5% (15.4% to 15.6%)
0.98 (0.97 to 0.99)
0.002
Excluding IMGs of Central America and the Caribbean medical schools
1,080,263 (40,295)
15.4% (15.3% to 15.5%)
15.4% (15.3% to 15.6%)
1.00 (0.98 to 1.01)
0.49
Additional adjustment for LOS 1,148,653 (42,665)
15.4% (15.3% to 15.5%)
15.5% (15.4% to 15.6%)
0.99 (0.98 to 1.01)
0.43
Additional adjustment for Part B spending
1,149,023 (42,667)
15.3% (15.2% to 15.4%)
15.6% (15.5% to 15.7%)
0.98 (0.97 to 0.99)
0.003
Additional adjustment for discharge location
1,149,024 (42,667)
15.4% (15.3% to 15.5%)
15.5% (15.4% to 15.6%)
0.99 (0.98 to 1.01)
0.39
Excluding patients with cancer and patients discharged to hospice
1,026,949 (42,065)
15.7% (15.6% to 15.8%)
15.7% (15.6% to 15.8%)
1.00 (0.98 to 1.01)
0.58
Excluding hospitals with ICU 145,814 (8,074)
15.8% (15.5% to 16.0%)
16.0% (15.7% to 16.3%)
0.98 (0.95 to 1.02)
0.31
Risk-adjusted readmission rates with additional adjustment for physician characteristic and with
hospital fixed effects (Model 3). LOS and Part B spending were used as continuous variables with
quadratic and cubic terms to allow for non-linear relationship.
Abbreviations: IMG, international medical graduate; USMG, U.S. medical graduate; OR, odds ratio; LOS,
length of stay.
*Patient outcomes were attributed to physicians who accounted for largest number of
evaluation-and-management claims.

15
Table G. Patient costs of care between USMGs and IMGs, additional analyses
No. of hospitalizations
(No. of physicians)
Adjusted total Part B spending (95%CI)
Adjusted difference (95%CI)
IMG − USMG p-value
IMGs USMGs
Attributing patients to physicians with largest number of E&M claims
1,168,915 (103,634)
$1138 ($1134 to $1143)
$1104 ($1100 to $1109)
+$34 (+$27 to +$40)
<0.001
Attributing patients to physicians who billed the first E&M claims
1,111,028 (120,779)
$1099 ($1095 to $1103)
$1117 ($1113 to $1121)
-$18 (-$24 to -$12)
<0.001
Excluding IMGs of Central America and the Caribbean medical schools
1,185,852 (41,184)
$1143 ($1138 to $1148)
$1096 ($1091 to $1101)
+$47 (+$39 to +$55)
<0.001
Additional adjustment for LOS
1,240,491 (42,943)
$1143 ($1140 to $1147)
$1099 ($1094 to $1103)
+$44 (+$39 to +$50)
<0.001
Additional adjustment for discharge location
1,240,867 (42,944)
$1145 ($1140 to $1149)
$1098 ($1093 to $1104)
+$46 (+$39 to +$54)
<0.001
Excluding patients with cancer and patients discharged to hospice
1,105,865 (42,434)
$1114 ($1110 to $1119)
$1069 ($1063 to $1074)
+$46 (+$38 to +$53)
<0.001
Excluding hospitals with ICU
158,580 (9,039)
$1147 ($1135 to $1159)
$1111 ($1096 to $1125)
+$36 (+$16 to +$57)
<0.001
Risk-adjusted spending with additional adjustment for physician characteristic and with hospital fixed
effects (Model 3). LOS was used as a continuous variable with quadratic and cubic terms to allow for
non-linear relationship.
Abbreviations: IMG, international medical graduate; USMG, U.S. medical graduate; LOS, length of stay.
*Patient outcomes were attributed to physicians who accounted for largest number of
evaluation-and-management claims.

16
Table H. Stratified analysis by teaching status of hospitals
No. of hospitalizations
(No. of physicians)
Adjusted patient outcomes (95%CI)
Adjusted OR/difference
(95%CI) IMG vs USMG
p-value
IMGs USMGs
30-day mortality rate
Major teaching hospitals
183,383 (13,242)
10.2% (9.9% to 10.4%)
10.8% (10.5% to 11.0%)
0.93 (0.88 to 0.97)
0.001
Minor teaching hospitals
408,108 (18,734)
11.3% (11.1% to 11.4%)
11.7% (11.5% to 11.8%)
0.95 (0.93 to 0.98)
0.002
Non-teaching hospitals
580,542 (21,911)
11.5% (11.3% to 11.6%)
11.9% (11.3% to 11.6%)
0.95 (0.93 to 0.97)
<0.001
30-day readmission
rate
Major teaching hospitals
184,352 (13,418)
16.7% (16.5% to 17.0%)
16.7% (16.4% to 16.9%)
1.01 (0.98 to 1.04)
0.71
Minor teaching hospitals
400,402 (18,390)
15.1% (15.0% to 15.3%)
15.2% (15.1% to 15.4%)
0.99 (0.97 to 1.01)
0.51
Non-teaching hospitals
556,810 (20,760)
15.2% (15.0% to 15.3%)
15.2% (15.1% to 15.4%)
0.99 (0.97 to 1.01)
0.54
Total Part B costs per
hospitalization
Major teaching hospitals
199,626 (14,313)
$1224 ($1212 to $1237)
$1172 ($1159 to $1185)
+$52 (+$33 to +$72)
<0.001
Minor teaching hospitals
431,304 (19,191)
$1167 ($1159 to $1175)
$1118 ($1110 to $1126)
+$49 (+$37 to +$61)
<0.001
Non-teaching hospitals
601,845 (22,188)
$1103 ($1096 to $1109)
$1061 ($1054 to $1069)
+$41 (+$30 to +$52)
<0.001
Abbreviations: IMG, international medical graduate; USMG, U.S. medical graduate; OR, odds ratio.
*Risk-adjustment using patients’ age, sex, race, primary diagnosis, coexisting conditions (Elixhauser
comorbidity index), median household income, Medicaid status, year indicators, and day of the week.

17
Fig A. Adjusted patient mortality rates by country
Risk-adjusted mortality rates with additional adjustment for physician characteristic and with hospital
fixed effects (Model 3).
*Statistically significantly different from the outcomes of patients treated by U.S. medical graduates
with p<0.05.

18
Fig B. Adjusted patient readmission rates by country
Risk-adjusted readmission rates with additional adjustment for physician characteristic and with
hospital fixed effects (Model 3).
The readmission rates for all countries studied were not statistically significantly different (p>0.05) from
patients treated by U.S. medical graduates.

19
Fig C. Adjusted patient costs of care by country
Risk-adjusted costs of care with additional adjustment for physician characteristic and with hospital fixed effects
(Model 3).
*Statistically significantly different from the outcomes of patients treated by U.S. medical graduates with p<0.05.