Using Google Forms as a tool to Expedite the Marking of Examinations
Upload
dr-thomas-kropmansCategory
view
339download
7
RUBRICS USED TO ASSESS COMMUNICATION SKILLS OF UImprove the Quality of E-OSCEs Using An Online Marking Tool, Instant Psychometric Analysis and Borderline Regression Analysis
Thomas Kropmans; Enda Griffin
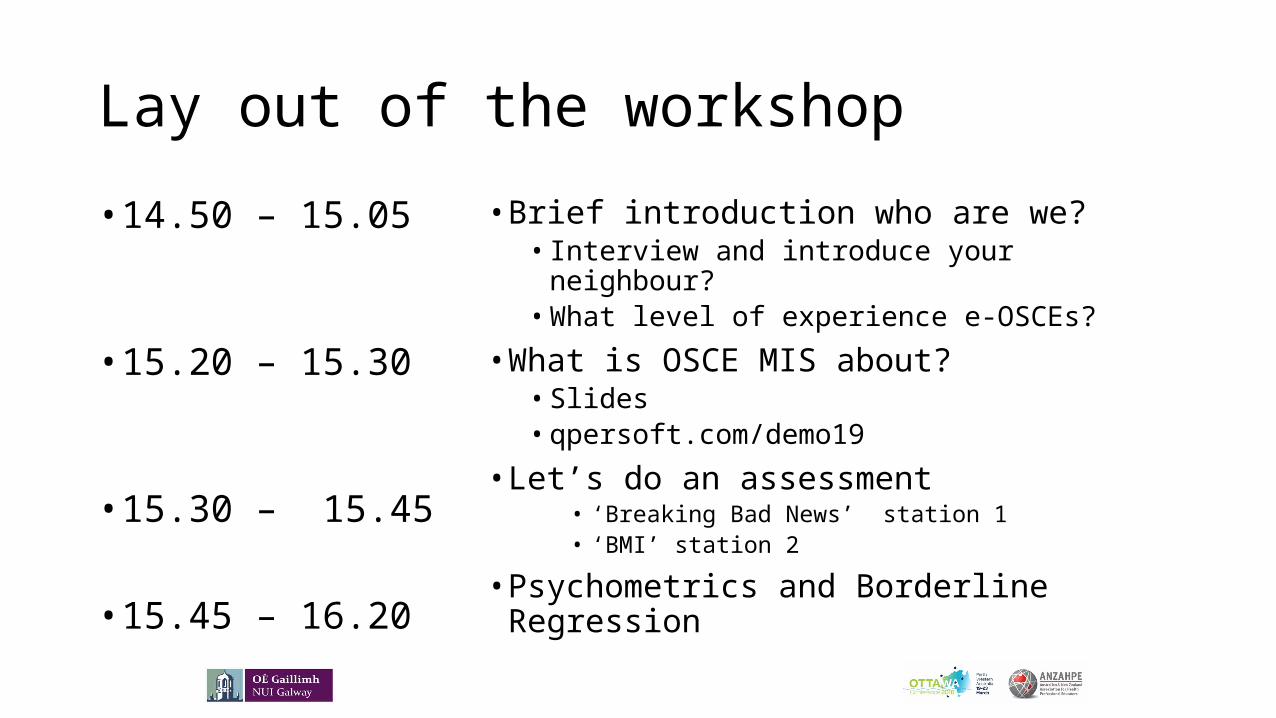
Lay out of the workshop• 14.50 – 15.05
• 15.20 – 15.30
• 15.30 – 15.45
• 15.45 – 16.20
• Brief introduction who are we?• Interview and introduce your neighbour?• What level of experience e-OSCEs?
• What is OSCE MIS about?• Slides• qpersoft.com/demo19
• Let’s do an assessment• ‘Breaking Bad News’ station 1• ‘BMI’ station 2
• Psychometrics and Borderline Regression

14.50 – 15.20• Interview your neighbour
• Where is he/she from?• What is his/her experience with electronic administered OSCEs• What are his/her expectations of an OSCE Management Information System
• Real time data retrieval• Online psychometrics• Feedback to students• Export of data
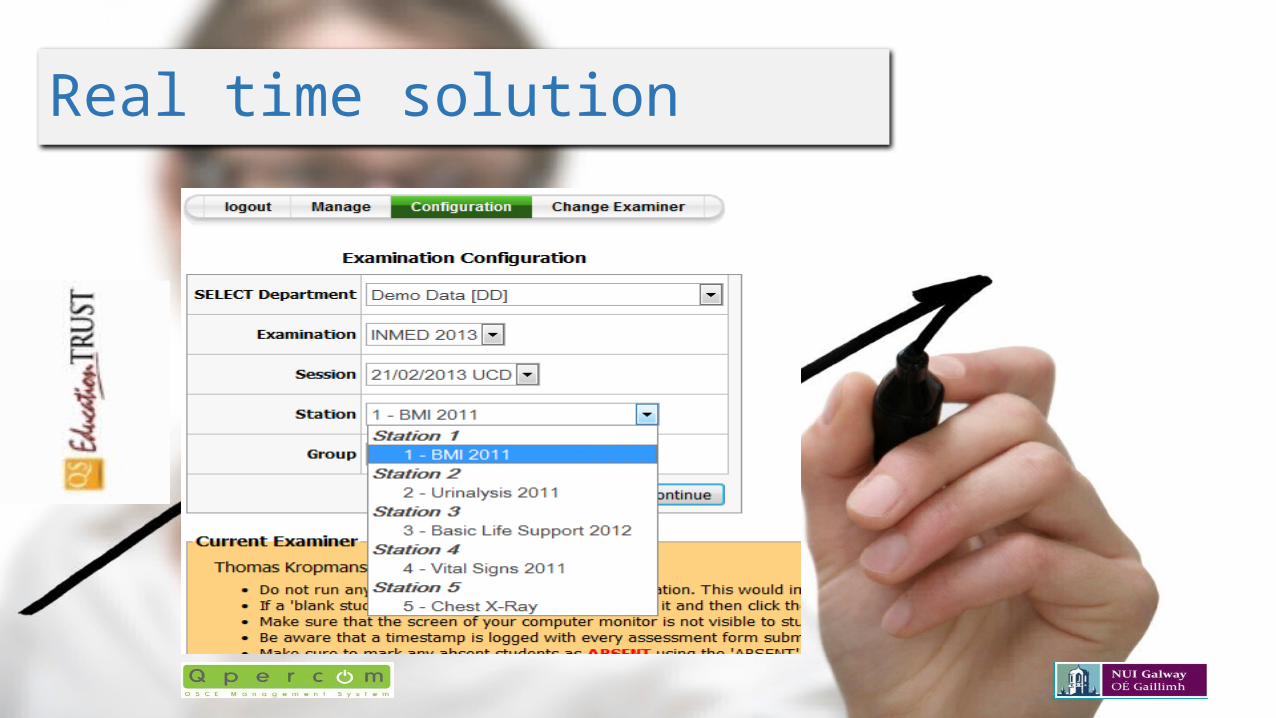
Real time solution

Objective Structured Clinical Examinations e.g. OSCE/MMI
Station 4
Station 1 Station 2 Station 3ExaminerPatient Student
Waiting Area – To be Examined
Student
Station 5Station 6Station 7Waiting Area - Examined
Secretary
Desk
StudentStudentStudent
Student
StudentStudentPatient Student Patient Student
Patient StudentPatient StudentPatient StudentPatient Student
Student Examiner Patient Secretary Flow of Students
Examiner Examiner
Examiner Examiner Examiner Examiner
Tablet/PDA
Web Server/Database
Web Server/Central Database

Internal Consistency Stations
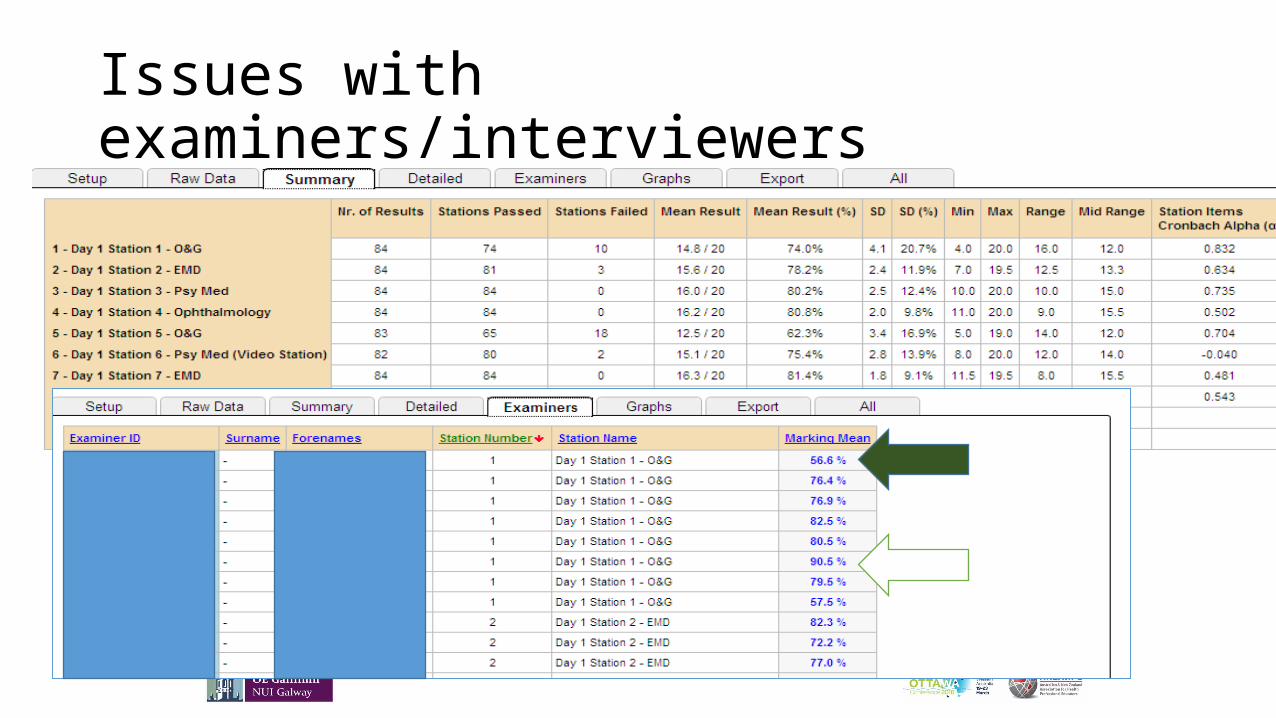
Issues with examiners/interviewers
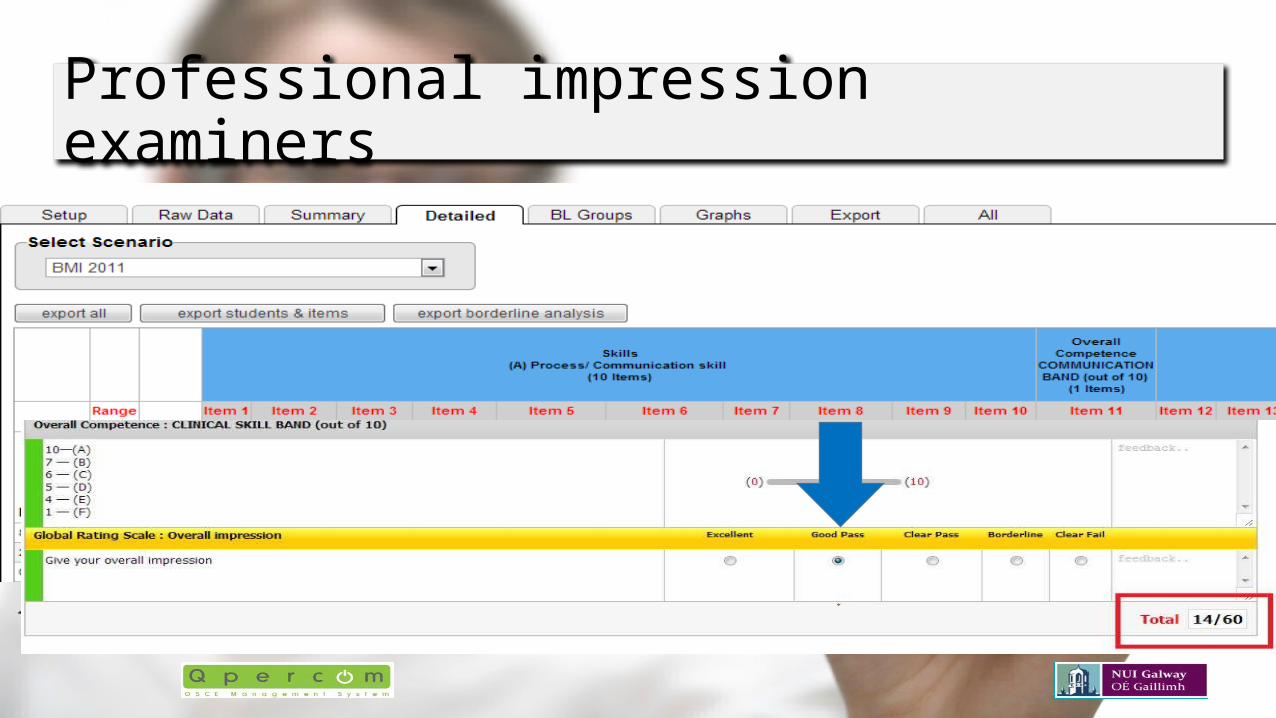
Professional impression examiners

0 1 2 3 40.0
1.0
2.0
3.0
4.0
5.0
6.0
7.0
8.0
9.0
10.0
Method 1 Single borderline score
Method 1: Global score (Fail=0, Borderline=1, Clear Pass=2, Good Pass=3, Excellent=4)
Stat
ion
scor
es
Borderline Regression Analysis

Lay out of the workshop• 15.20 – 15.30
• 15.30 – 15.45
• 15.45 – 16.20
• Let’s do an assessment• ‘Breaking Bad News’ station 1• ‘BMI’ station 2
• qpersoft.com/demo19• exam1 – ottawa16• exam2 – ottawa16• Exam3 – ottawa16• Exam 24 - ottawa16
• Psychometrics and Borderline Regression

Improved pass/fail decisions

19 prestigious universities>200 OSCE/MMIs successfully administeredStudent and Examiner results being analysedCost reduction of 70% Error reduction by 30%
19% MORE NUIG students fail after introducing BRAInternal consistency varies from 0.45 – 0.85Cut-off score varies between stations from 40 – 75%Generalisability Kappa between departments 0.4 – 0.9
Overview & Discussion