QUALITY EVALUATION OF MALTOSE SYRUP ......QUALITY EVALUATION OF MALTOSE SYRUP PRODUCED FROM...
35
QUALITY EVALUATION OF MALTOSE SYRUP PRODUCED FROM HYDROLYSIS OF CASSAVA STARCH AND MALTED RICE SREY THEAVY MSc. In Food Science October 19, 2017
Transcript of QUALITY EVALUATION OF MALTOSE SYRUP ......QUALITY EVALUATION OF MALTOSE SYRUP PRODUCED FROM...
QUALITY EVALUATION OF MALTOSE SYRUP
PRODUCED FROM HYDROLYSIS OF
CASSAVA STARCH AND MALTED RICE
SREY THEAVY
MSc. In Food Science October 19, 2017
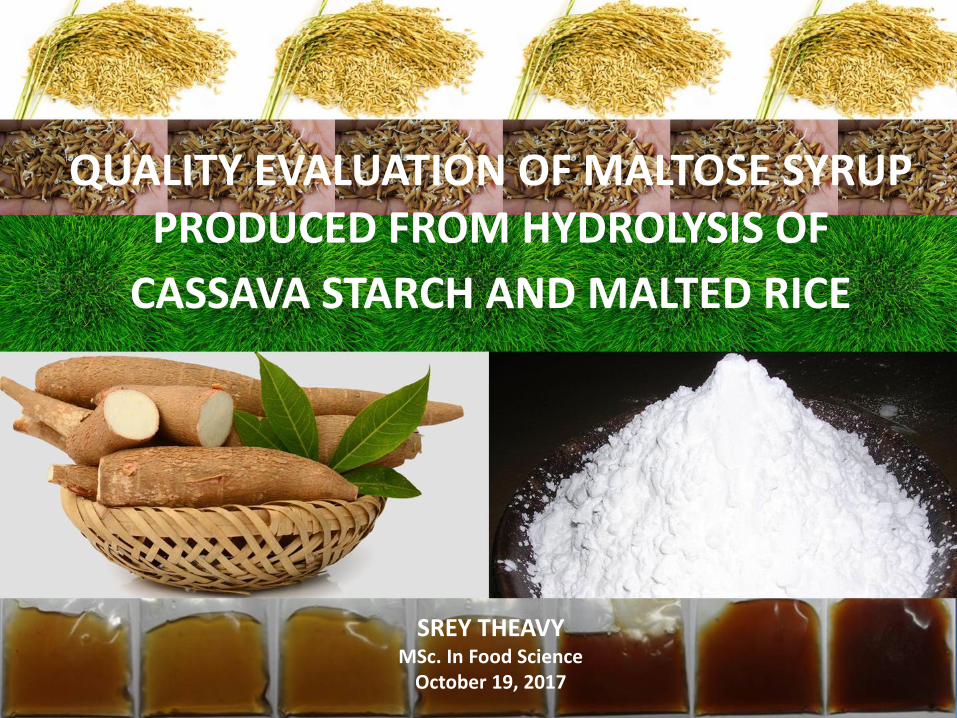
Objectives of the Study
1. determine the proximate composition of fresh cassava and cassava starch;
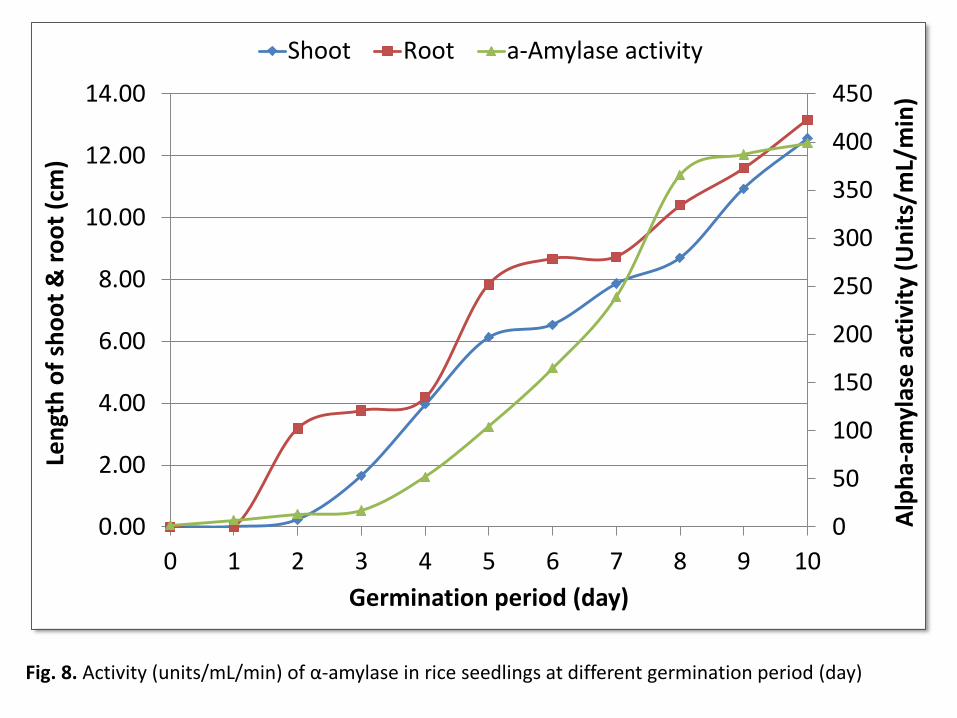
2. identify the best germination time of paddy rice to obtain the highest amylase production;
3. determine the best processing parameters such as pH, saccharification time, and ratio of substrate (cassava starch) to enzyme (malted rice) for maltose syrup production;
4. evaluate the physicochemical properties [color, pH, % moisture content, total soluble solids (TSS), % reducing sugar, % dextrose equivalent, % crude ash content and % crude protein] and yield (%) of the resulting maltose syrups; and
5. determine the acceptability and sensory properties of maltose syrups from cassava starch.
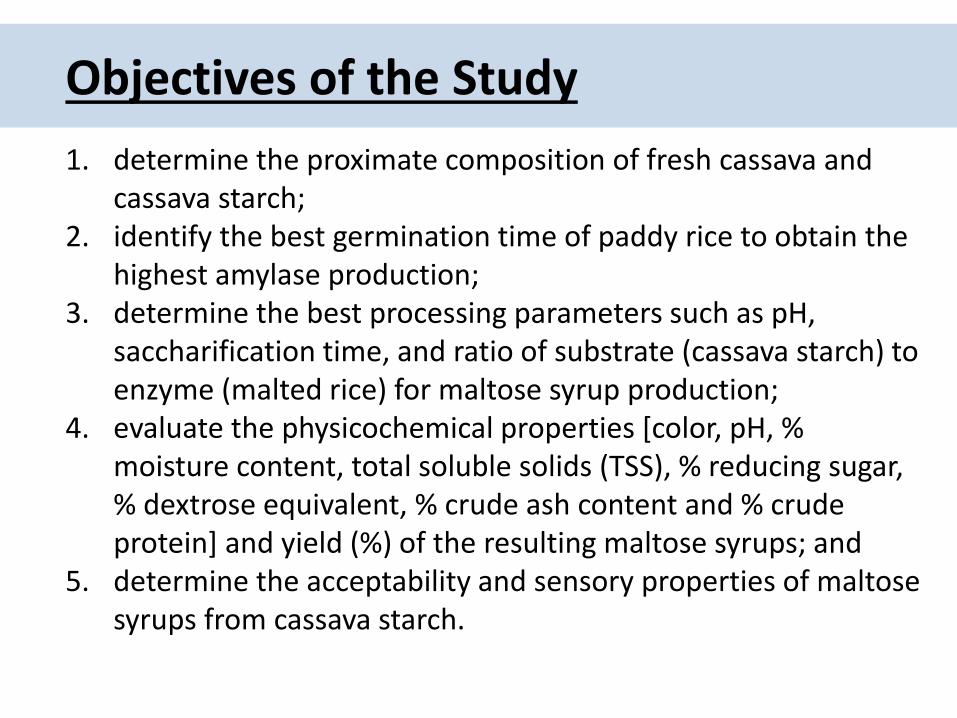
Experimental Materials
Fig.1. Cassava (Rayong cv.) roots
harvested at the age of 12 month
Fig. 2. Paddy rice (Sen Pidao cv.)
MATERIALS AND METHODS
Experimental Set-up
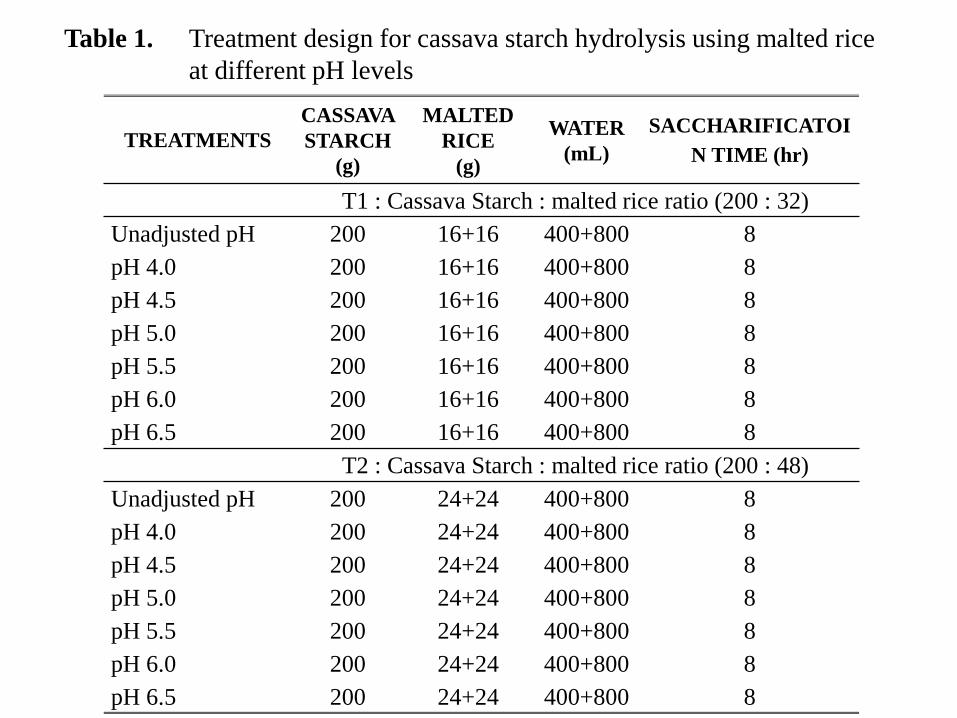
Table 1. Treatment design for cassava starch hydrolysis using malted rice
at different pH levels
TREATMENTS CASSAVA
STARCH
(g)
MALTED
RICE
(g)
WATER
(mL)
SACCHARIFICATOI
N TIME (hr)
T1 : Cassava Starch : malted rice ratio (200 : 32)
Unadjusted pH 200 16+16 400+800 8
pH 4.0 200 16+16 400+800 8
pH 4.5 200 16+16 400+800 8
pH 5.0 200 16+16 400+800 8
pH 5.5 200 16+16 400+800 8
pH 6.0 200 16+16 400+800 8
pH 6.5 200 16+16 400+800 8
T2 : Cassava Starch : malted rice ratio (200 : 48)
Unadjusted pH 200 24+24 400+800 8
pH 4.0 200 24+24 400+800 8
pH 4.5 200 24+24 400+800 8
pH 5.0 200 24+24 400+800 8
pH 5.5 200 24+24 400+800 8
pH 6.0 200 24+24 400+800 8
pH 6.5 200 24+24 400+800 8
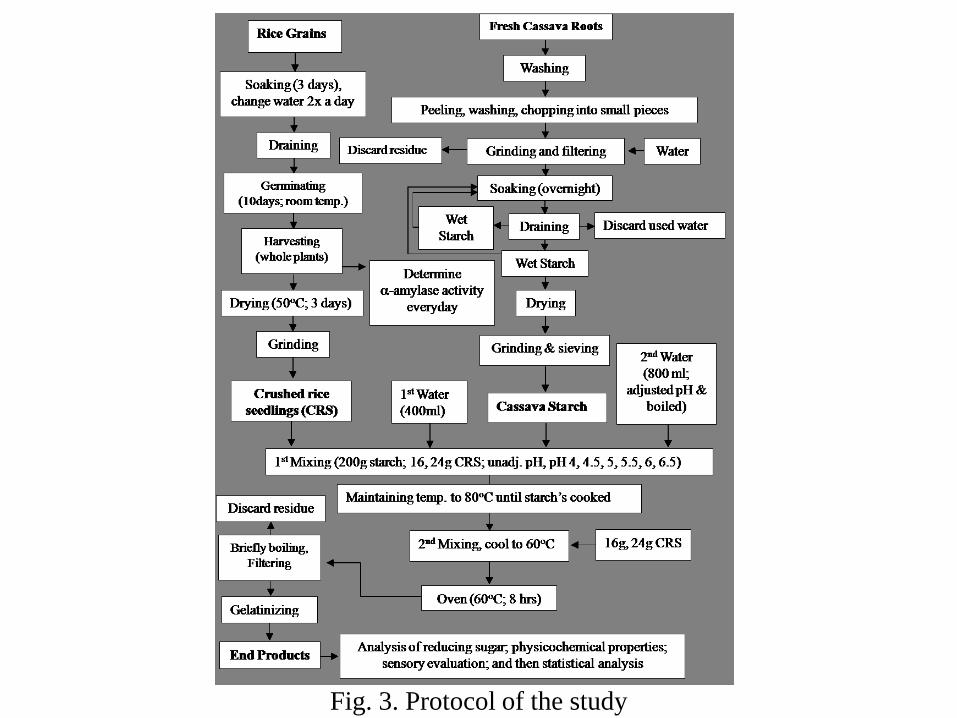
Fig. 3. Protocol of the study
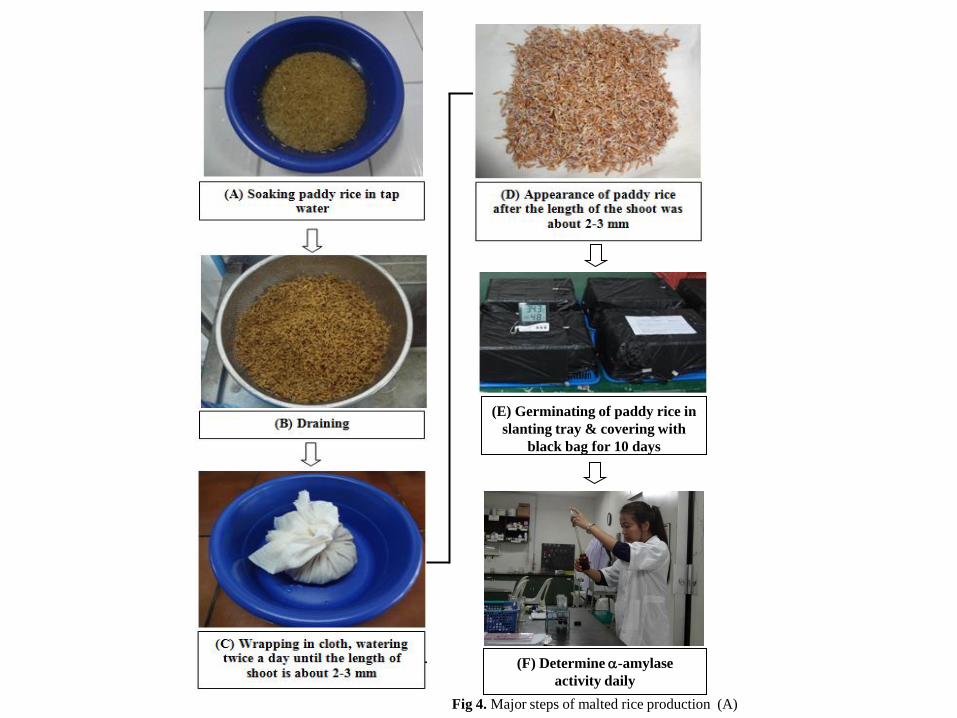
(F) Determine -amylase
activity daily
(E) Germinating of paddy rice in
slanting tray & covering with
black bag for 10 days
Fig 4. Major steps of malted rice production (A)
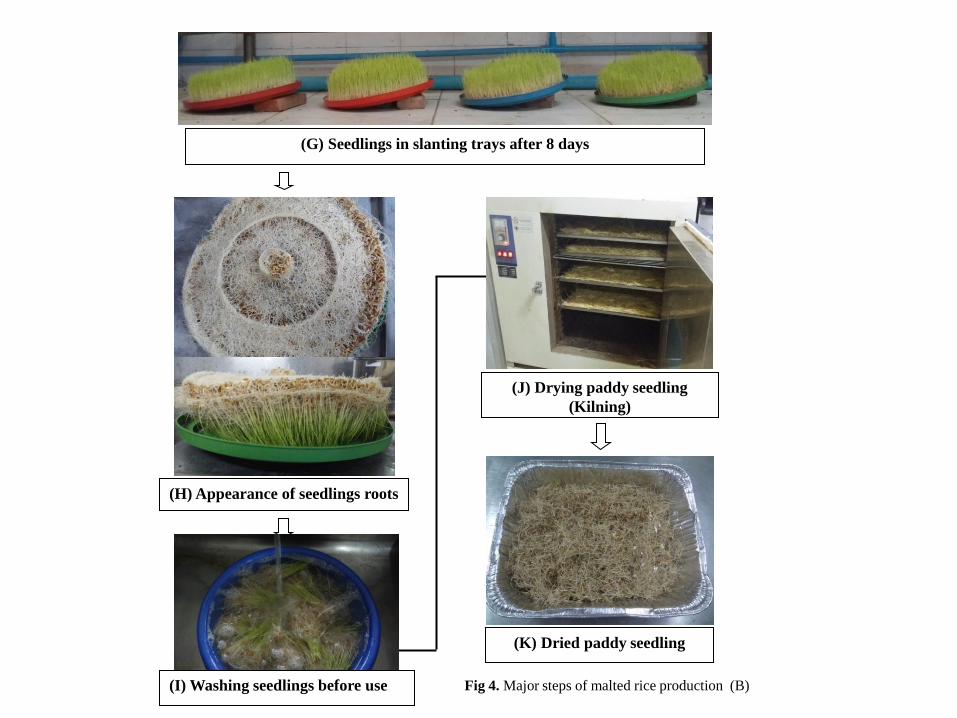
(G) Seedlings in slanting trays after 8 days
(H) Appearance of seedlings roots
(J) Drying paddy seedling
(Kilning)
(K) Dried paddy seedling
(I) Washing seedlings before use Fig 4. Major steps of malted rice production (B)
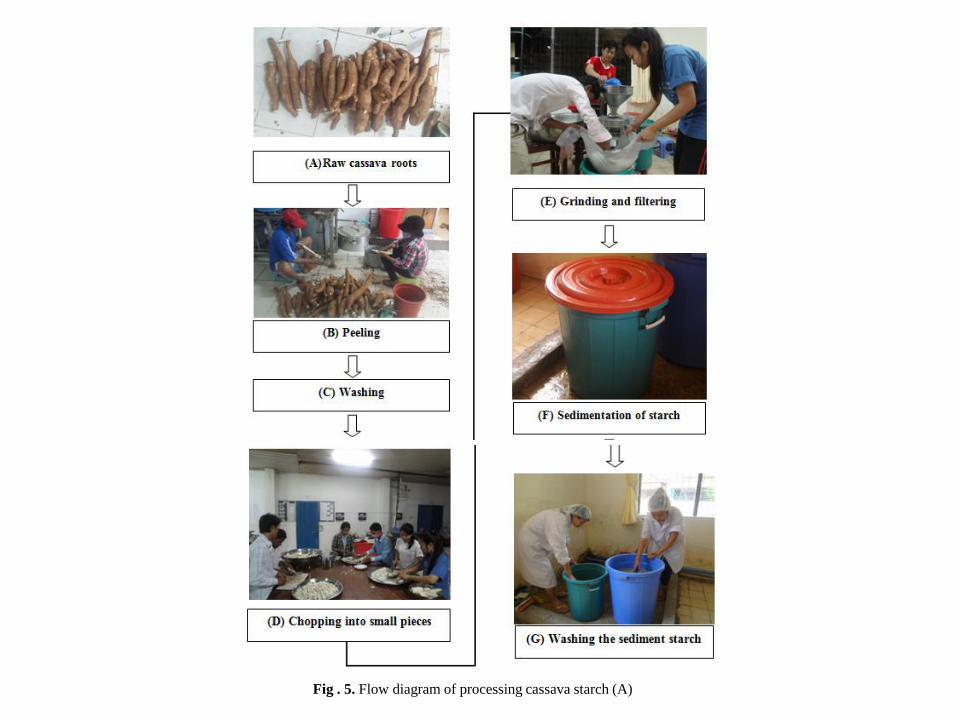
Fig. 9. Flow diagram of processing cassava starch (A) Fig . 5. Flow diagram of processing cassava starch (A)
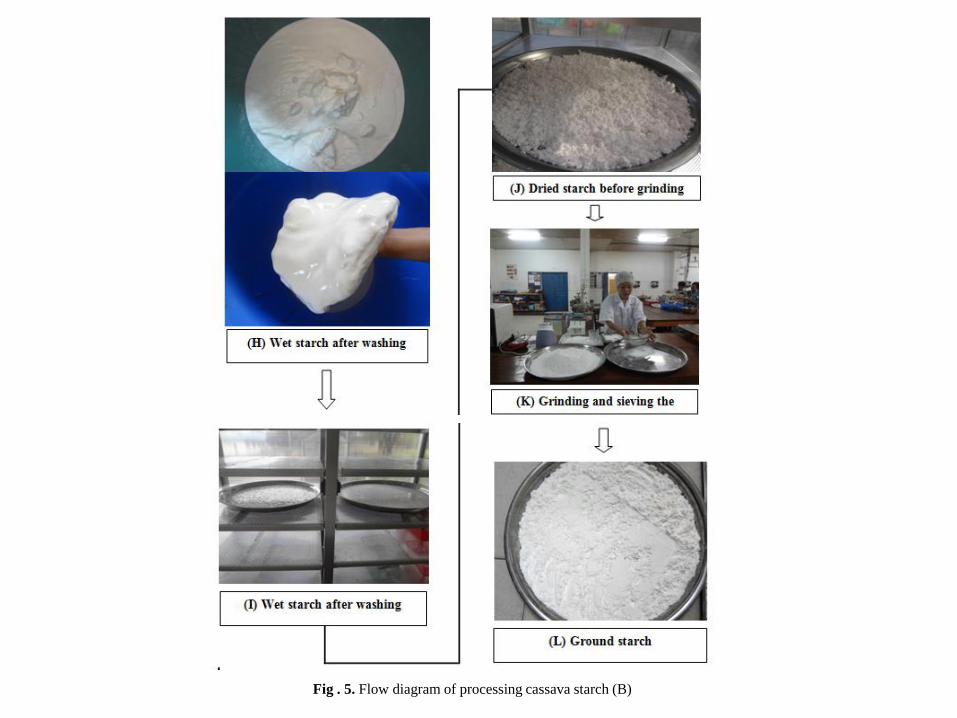
Fig. 9. Flow diagram of processing cassava starch (B) Fig . 5. Flow diagram of processing cassava starch (B)
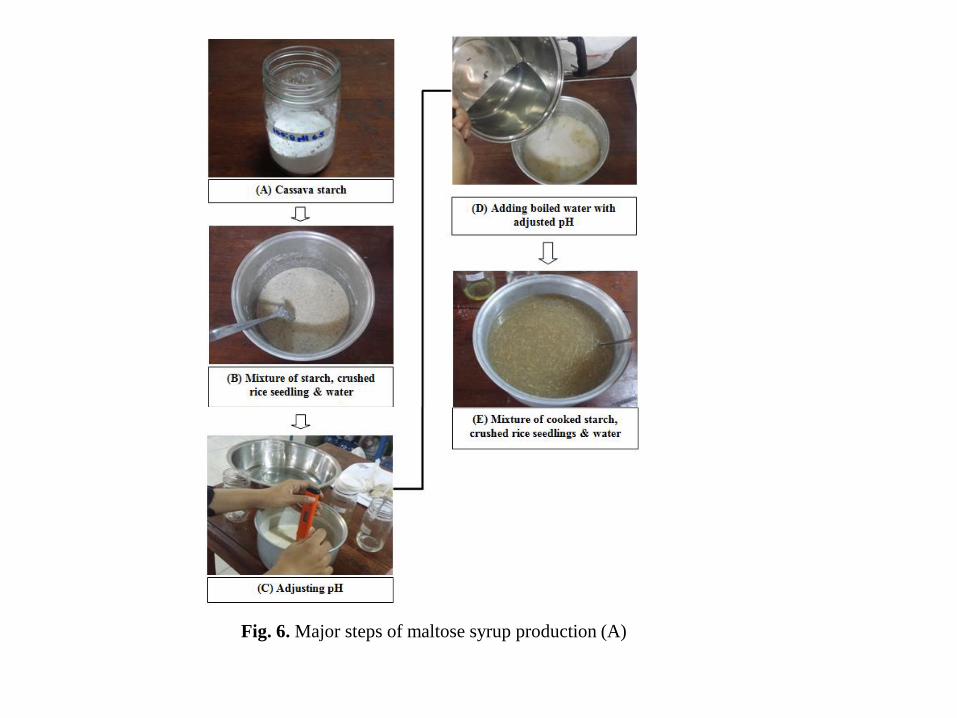
Fig. 6. Major steps of maltose syrup production (A)
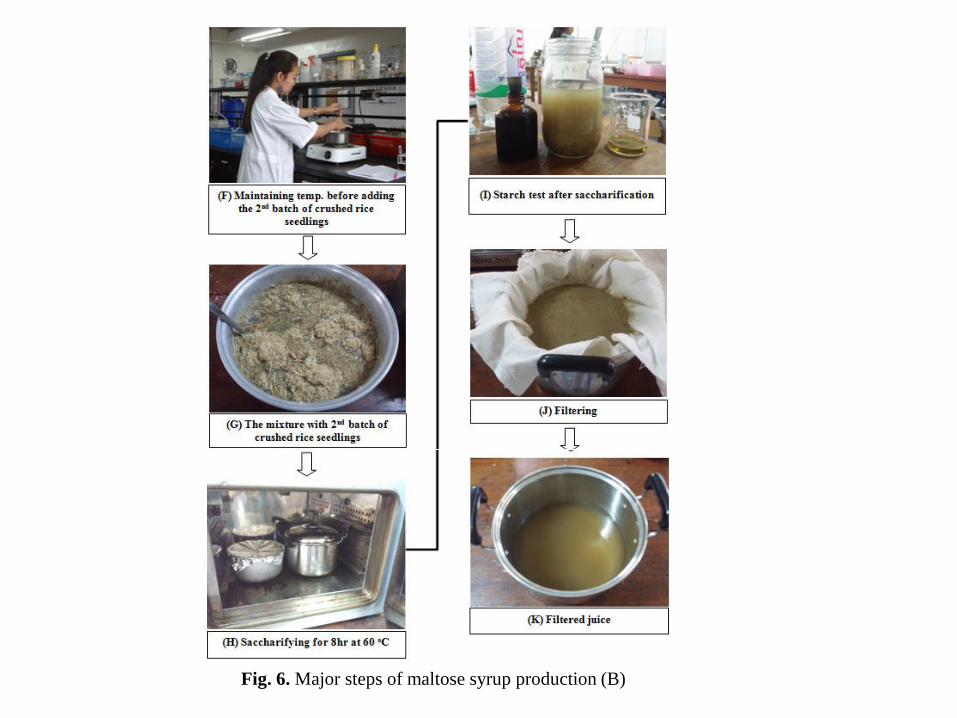
Fig. 6. Major steps of maltose syrup production (B)
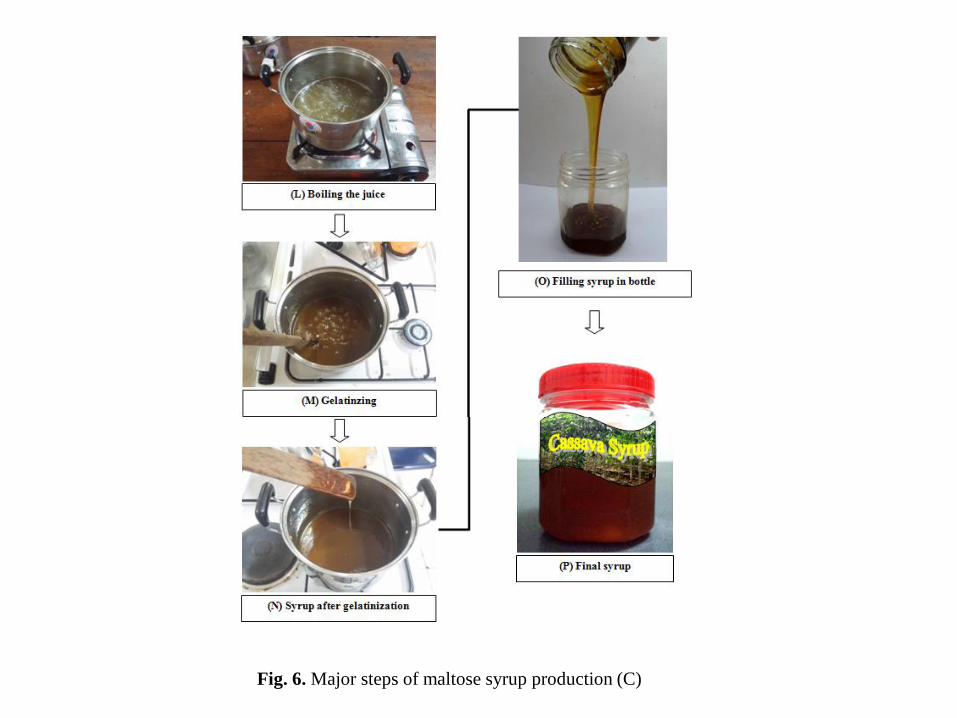
Fig. 6. Major steps of maltose syrup production (C)

RESULTS AND DISCUSSION
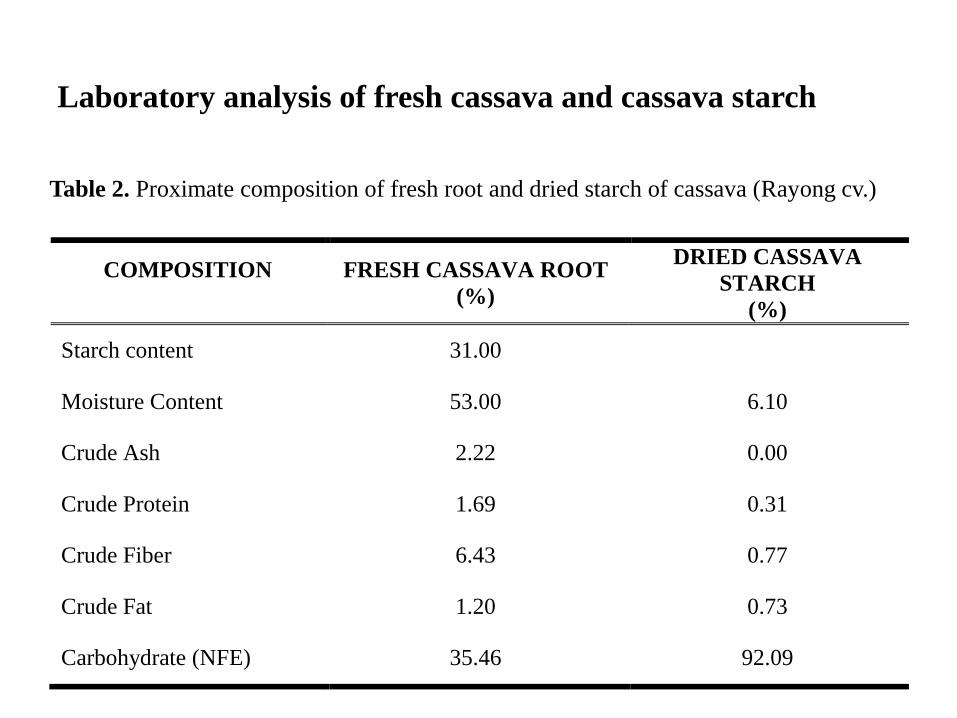
Table 8. Proximate composition of fresh root and dried starch of Rayong cassava
variety.
COMPOSITION
FRESH CASSAVA ROOT
(%)
DRIED CASSAVA
STARCH
(%)
Starch content 31.00
Moisture Content 53.00 6.10
Crude Ash 2.22 0.00
Crude Protein 1.69 0.31
Crude Fiber 6.43 0.77
Crude Fat 1.20 0.73
Carbohydrate (NFE) 35.46 92.09
Table 2. Proximate composition of fresh root and dried starch of cassava (Rayong cv.)
Laboratory analysis of fresh cassava and cassava starch
0
5
10
15
20
25
30
35
40
45
50
55
60
65
70
0 1 2 3 4 5 6 7 8 9 10
Tem
pe
ratu
re (
oC
)/R
ela
tive
Hu
mid
ity
(%)
Germination period (day)
Temperature (˚C) RH (%)
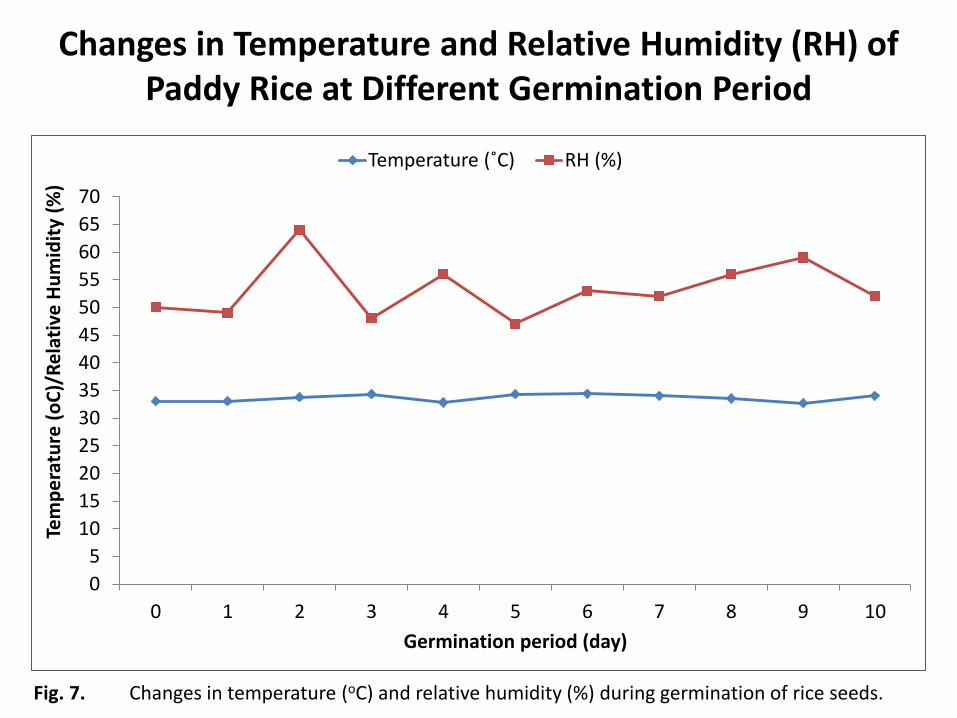
Fig. 7. Changes in temperature (oC) and relative humidity (%) during germination of rice seeds.
Changes in Temperature and Relative Humidity (RH) of Paddy Rice at Different Germination Period
0
50
100
150
200
250
300
350
400
450
0.00
2.00
4.00
6.00
8.00
10.00
12.00
14.00
0 1 2 3 4 5 6 7 8 9 10
Alp
ha-
amyl
ase
act
ivit
y (U
nit
s/m
L/m
in)
Len
gth
of
sho
ot
& r
oo
t (c
m)
Germination period (day)
Shoot Root a-Amylase activity
Fig. 8. Activity (units/mL/min) of α-amylase in rice seedlings at different germination period (day)

Table 9. Percent reducing sugar (%) and dextrose equivalent (%) of maltose syrup made
from different combination of cassava starch and rice seedlings at different pH
levels.
COMBINATION
OF CASSAVA
STARCH AND
RICE
SEEDLINGS
pH
REDUCING
SUGAR*
(%)
DEXTROSE
EQUIVALENT*
(%)
T1: Cassava
Starch (g) : Rice
Seedlings (g)
(200 : 16+16)
Unadjusted ( pH 5.3) 91.75 ± 0.50b 83.28 ± 2.04
bc
pH 4 82.67 ± 0.38d 79.12 ± 1.88
cd
pH 4.5 68.83 ± 3.19f 64.46 ± 3.01
f
pH 5 87.92 ± 5.35bc
81.36 ± 11.29bc
pH 5.5 87.83 ± 2.89bc
80.38 ± 1.41bc
pH 6 75.58 ± 3.32e 71.29 ± 3.60
e
pH 6.5 87.42 ± 1.38bc
80.21 ± 1.59bc
T2: Cassava
Starch (g) : Rice
Seedlings (g)
(200 : 24+24)
Unadjusted (pH 5.3) 106.83 ± 0.80a 97.07 ± 0.44
a
pH 4 75.75 ± 0.25e 86.61 ± 1.88
b
pH 4.5 66.67 ± 0.63f 64.77 ± 2.85
f
pH 5 88.83 ± 3.76bc
85.76 ± 3.80bc
pH 5.5 89.58 ± 0.14bc
80.71 ± 1.34bc
pH 6 77.33 ± 0.29e 73.16 ± 0.81
de
pH 6.5 86.58 ± 0.14c 80.40 ± 1.54
bc
Values are means ± SD (n=14).
Means in the same column followed by the same superscripts (a–f) are not significantly
different (P < 0.05) by Duncan’s Multiple Range Test;
*Significantly different at P < 0.01; a b c …
Table 3.
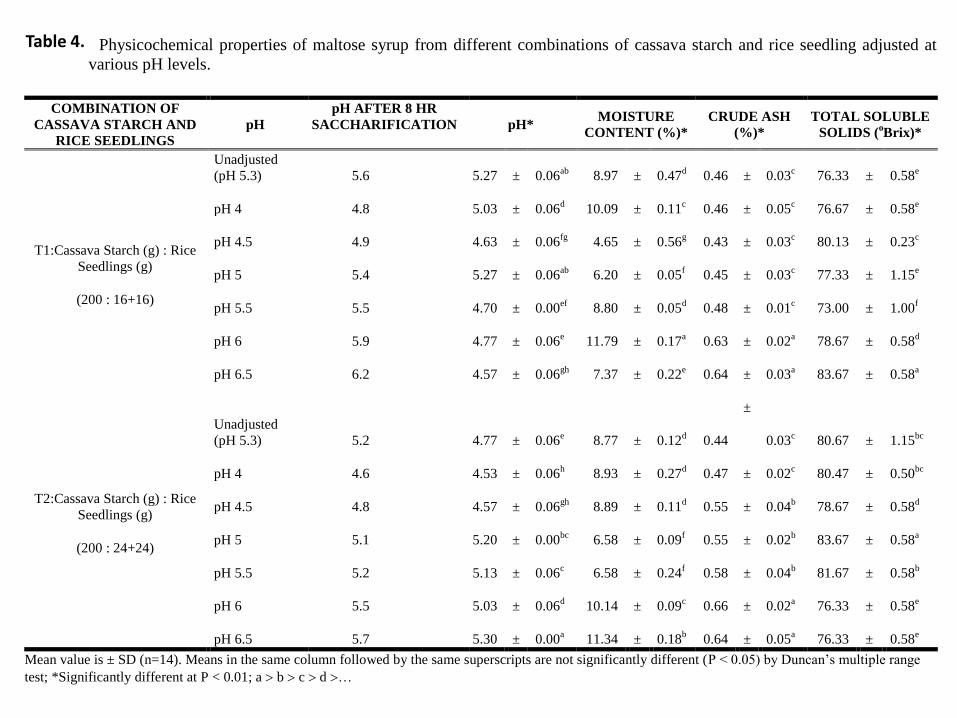
Table 10. Physicochemical properties of maltose syrup from different combinations of cassava starch and rice seedling adjusted at
various pH levels.
COMBINATION OF
CASSAVA STARCH AND
RICE SEEDLINGS
pH
pH AFTER 8 HR
SACCHARIFICATION
pH* MOISTURE
CONTENT (%)*
CRUDE ASH
(%)*
TOTAL SOLUBLE
SOLIDS (oBrix)*
T1:Cassava Starch (g) : Rice
Seedlings (g)
(200 : 16+16)
Unadjusted
(pH 5.3) 5.6 5.27 ± 0.06ab 8.97 ± 0.47
d 0.46 ± 0.03
c 76.33 ± 0.58
e
pH 4 4.8 5.03 ± 0.06d 10.09 ± 0.11
c 0.46 ± 0.05
c 76.67 ± 0.58
e
pH 4.5 4.9 4.63 ± 0.06fg
4.65 ± 0.56g 0.43 ± 0.03
c 80.13 ± 0.23
c
pH 5 5.4 5.27 ± 0.06ab
6.20 ± 0.05f 0.45 ± 0.03
c 77.33 ± 1.15
e
pH 5.5 5.5 4.70 ± 0.00ef 8.80 ± 0.05
d 0.48 ± 0.01
c 73.00 ± 1.00
f
pH 6 5.9 4.77 ± 0.06e 11.79 ± 0.17
a 0.63 ± 0.02
a 78.67 ± 0.58
d
pH 6.5 6.2 4.57 ± 0.06gh
7.37 ± 0.22e 0.64 ± 0.03
a 83.67 ± 0.58
a
T2:Cassava Starch (g) : Rice
Seedlings (g)
(200 : 24+24)
Unadjusted
(pH 5.3)
5.2 4.77 ± 0.06e 8.77 ± 0.12
d 0.44
±
0.03c 80.67 ± 1.15
bc
pH 4 4.6 4.53 ± 0.06h 8.93 ± 0.27
d 0.47 ± 0.02
c 80.47 ± 0.50
bc
pH 4.5 4.8 4.57 ± 0.06gh
8.89 ± 0.11d 0.55 ± 0.04
b 78.67 ± 0.58
d
pH 5 5.1 5.20 ± 0.00bc
6.58 ± 0.09f 0.55 ± 0.02
b 83.67 ± 0.58
a
pH 5.5 5.2 5.13 ± 0.06c 6.58 ± 0.24
f 0.58 ± 0.04
b 81.67 ± 0.58
b
pH 6 5.5 5.03 ± 0.06d 10.14 ± 0.09
c 0.66 ± 0.02
a 76.33 ± 0.58
e
pH 6.5 5.7 5.30 ± 0.00a 11.34 ± 0.18
b 0.64 ± 0.05
a 76.33 ± 0.58
e
Mean value is ± SD (n=14). Means in the same column followed by the same superscripts are not significantly different (P < 0.05) by Duncan’s multiple range
test; *Significantly different at P < 0.01; a b c d …
Table 4.
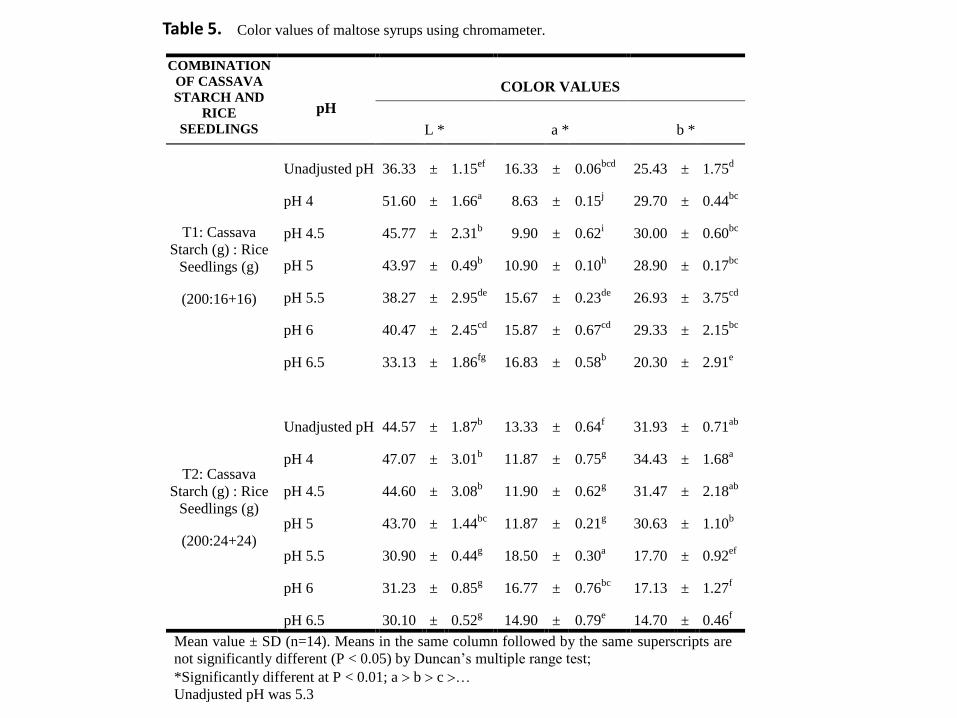
Table 11. Color values of maltose syrups using chromameter.
COMBINATION
OF CASSAVA
STARCH AND
RICE
SEEDLINGS
pH
Val COLOR VALUES
L * a * b *
T1: Cassava
Starch (g) : Rice
Seedlings (g)
(200:16+16)
Unadjusted pH 36.33 ± 1.15ef
16.33 ± 0.06bcd
25.43 ± 1.75d
pH 4 51.60 ± 1.66a 8.63 ± 0.15
j 29.70 ± 0.44
bc
pH 4.5 45.77 ± 2.31b 9.90 ± 0.62
i 30.00 ± 0.60
bc
pH 5 43.97 ± 0.49b 10.90 ± 0.10
h 28.90 ± 0.17
bc
pH 5.5 38.27 ± 2.95de
15.67 ± 0.23de
26.93 ± 3.75cd
pH 6 40.47 ± 2.45cd
15.87 ± 0.67cd
29.33 ± 2.15bc
pH 6.5 33.13 ± 1.86fg
16.83 ± 0.58b 20.30 ± 2.91
e
T2: Cassava
Starch (g) : Rice
Seedlings (g)
(200:24+24)
Unadjusted pH 44.57 ± 1.87b 13.33 ± 0.64
f 31.93 ± 0.71
ab
pH 4 47.07 ± 3.01b 11.87 ± 0.75
g 34.43 ± 1.68
a
pH 4.5 44.60 ± 3.08b 11.90 ± 0.62
g 31.47 ± 2.18
ab
pH 5 43.70 ± 1.44bc
11.87 ± 0.21g 30.63 ± 1.10
b
pH 5.5 30.90 ± 0.44g 18.50 ± 0.30
a 17.70 ± 0.92
ef
pH 6 31.23 ± 0.85g 16.77 ± 0.76
bc 17.13 ± 1.27
f
pH 6.5 30.10 ± 0.52g 14.90 ± 0.79
e 14.70 ± 0.46
f
Mean value ± SD (n=14). Means in the same column followed by the same superscripts are
not significantly different (P < 0.05) by Duncan’s multiple range test;
*Significantly different at P < 0.01; a b c …
Unadjusted pH was 5.3
Table 5.
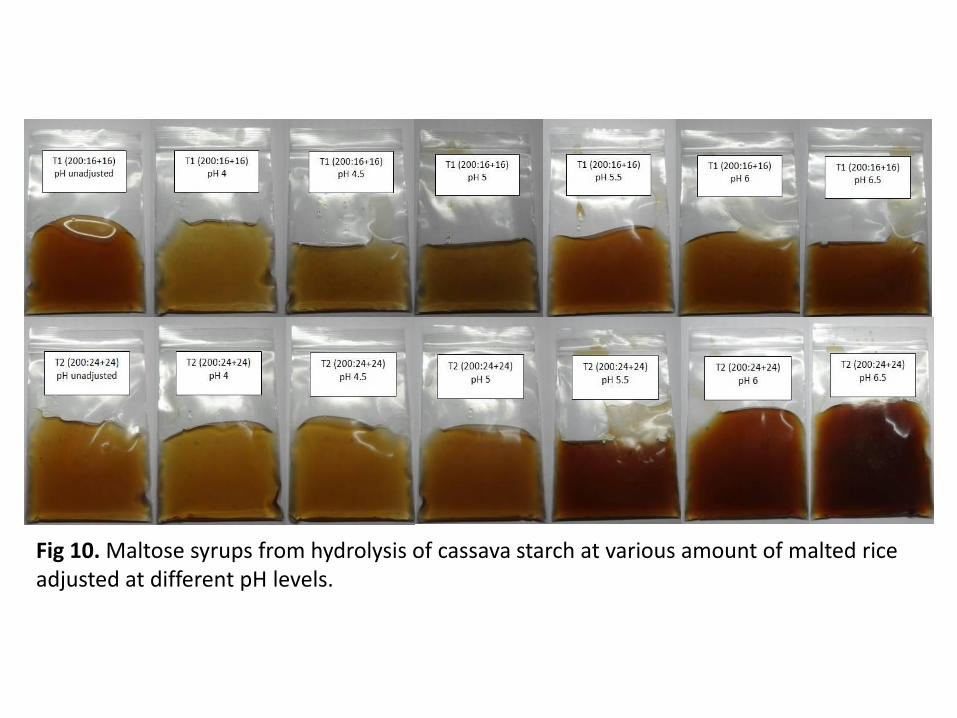
Fig 10. Maltose syrups from hydrolysis of cassava starch at various amount of malted rice adjusted at different pH levels.

Table 15. Percent yield of maltose syrup from different treatments
COMBINATION OF CASSAVA
STARCH AND RICE
SEEDLINGS
pH YIELD*
(%w/w)
T1: Cassava Starch (g) :
Rice Seedlings (g)
(200 : 16+16)
Unadjusted (pH 5.3) 93.50 ± 2.50de
pH 4 100.50 ± 2.50bc
pH 4.5 98.50 ± 7.26bcd
pH 5 94.00 ± 6.14cde
pH 5.5 92.17 ± 2.52de
pH 6 96.50 ± 1.00bcde
pH 6.5 95.17 ± 4.51cde
T2: Cassava Starch (g) :
Rice Seedlings (g)
(200 : 24+24)
Unadjusted (pH 5.3) 94.50 ± 1.00cde
pH 4 122.33 ± 2.25a
pH 4.5 102.00 ± 4.00b
pH 5 97.50 ± 1.00bcde
pH 5.5 91.00 ± 1.50e
pH 6 96.50 ± 1.00bcde
pH 6.5 97.50 ± 2.00bcde
Mean values ± SD (n=14).
Means in the same column followed by the same superscripts are not significantly different
(P < 0.05) by Duncan’s Multiple Range Test;
*Significantly different at P < 0.01; a b c …
Table 6.
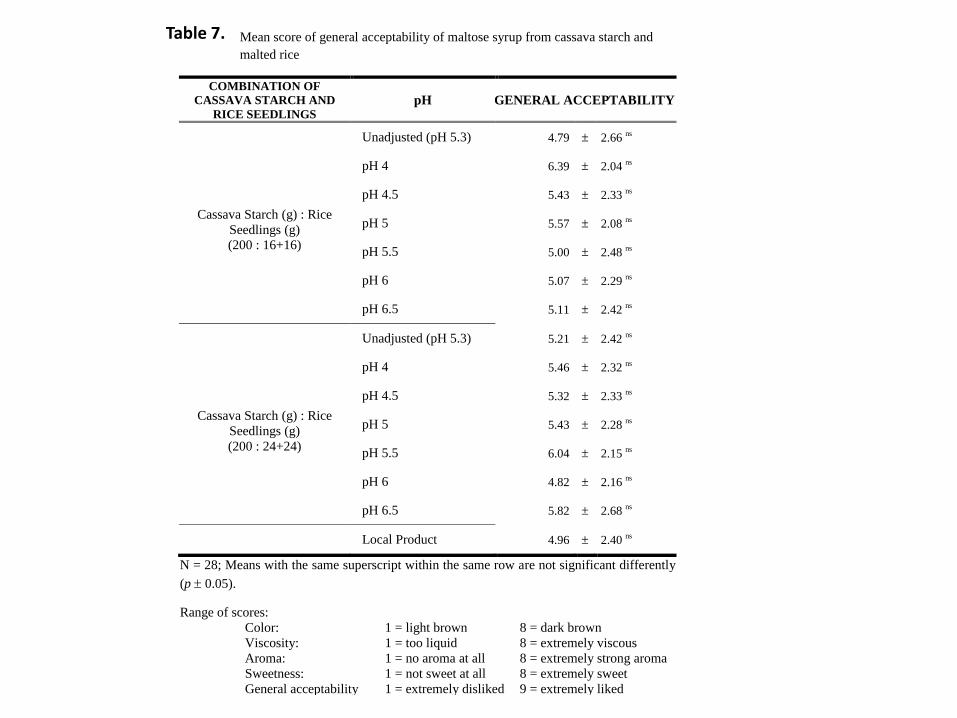
Table 19. Mean score of general acceptability of maltose syrup from cassava starch and
malted rice
COMBINATION OF
CASSAVA STARCH AND
RICE SEEDLINGS pH GENERAL ACCEPTABILITY
Cassava Starch (g) : Rice
Seedlings (g)
(200 : 16+16)
Unadjusted (pH 5.3) 4.79 ± 2.66 ns
pH 4 6.39 ± 2.04 ns
pH 4.5 5.43 ± 2.33 ns
pH 5 5.57 ± 2.08 ns
pH 5.5 5.00 ± 2.48 ns
pH 6 5.07 ± 2.29 ns
pH 6.5 5.11 ± 2.42 ns
Cassava Starch (g) : Rice
Seedlings (g)
(200 : 24+24)
Unadjusted (pH 5.3) 5.21 ± 2.42 ns
pH 4 5.46 ± 2.32 ns
pH 4.5 5.32 ± 2.33 ns
pH 5 5.43 ± 2.28 ns
pH 5.5 6.04 ± 2.15 ns
pH 6 4.82 ± 2.16 ns
pH 6.5 5.82 ± 2.68 ns
Local Product 4.96 ± 2.40
ns
N = 28; Means with the same superscript within the same row are not significant differently
(p 0.05).
Range of scores:
Color: 1 = light brown 8 = dark brown
Viscosity: 1 = too liquid 8 = extremely viscous
Aroma: 1 = no aroma at all 8 = extremely strong aroma
Sweetness: 1 = not sweet at all 8 = extremely sweet
General acceptability 1 = extremely disliked 9 = extremely liked
Table 7.
SUMMARY & CONCLUSION
• Germination time had effect on enzyme production in malted rice. Enzyme activity of malted rice Sen Pidao cv. was high at day 8. Therefore, it is recommended that best germination time for Sen Pidao rice is at day 8.
SUMMARY & CONCLUSION
• Results suggested that T1 without all pH adjustment, pH 5.3 had the highest RS content (91.75 ± 0.50%).
• Likewise, RS of maltose syrup from higher amount of malted rice (T2) also registered significantly higher value in unadjusted pH samples (106.83±0.80%).
• However, samples with higher amount of malted rice obtained significantly higher RS(%).
• The highest values of RS(%) among samples was observed in samples with pH ranged of pH 5-5.5 regardless of the amount of malted rice added in the mixtures.
SUMMARY & CONCLUSION
• Dextrose equivalent of both T1 (83.28 ± 2.04%) and T2 samples (97.07 ± 0.44%) from unadjusted pH obtained the highest values.
• However, there was no clear trend observed on the effect of pH levels on the values obtained for DE.
• Nonetheless, results suggest that pH adjustment within the range of 5.0-5.5 and the use of higher malted rice is necessary to obtain high DE of maltose syrup.
SUMMARY & CONCLUSION
• An 8-hour saccharification period of extracted juice with additional overnight storage resulted in increased pH values for both T1 and T2 before gelationization.
• Overall, it can be concluded that the pH and the proportion of cassava starch to rice seedlings have no substantial effect on the moisture content of the maltose syrup.
• Moisture content of maltose syrups ranged from 4.65 – 11.79% . The final moisture content of the syrup depends on the length of evaporation process.
SUMMARY & CONCLUSION
• Results of crude ash analysis show that regardless of the treatment, samples with pH 6.0 and 6.5 obtained significantly higher crude ash content from the rest of the samples which can be contributed by the amount of NaOH added during pH adjustment.
• In general, maltose syrups from Treatment 1 obtained TSS ranging from 73 ± 1.00oBrix to 83.67 ± 0.58 oBrix, while samples from Treatment 2 had TSS ranging from 76.33 ± 0.58 oBrix to 83.67 ± 0.58 oBrix.
• Results show that the treatments with different pH levels and concentration of rice seedlings did not show any significant effect on the TSS of the final maltose syrups.
SUMMARY & CONCLUSION
• Chromameter, CapSureTM, was used to determine the color of the maltose syrup samples.
• This shows that the more acidic the sample, the lighter is the color. However, varying the amount of malted rice did not affect the color lightness of the products.
• Obviously, the maltose syrup has no tinge of green color hence most of the values obtained refer to the slight redness of the samples.
• The higher the pH value, the higher is the amount of redness detected on the product (dark brown).
SUMMARY & CONCLUSION
• Excessive heating of starch-derived sweeteners will result in partial caramelization and development of undesirable flavors. The b value is for yellow (+) and blue (−) color.
• The values obtained signified that maltose syrup has slight yellow color and not on the blue color side.
• Visual observations of the maltose syrups show less yellow color intensity at low pH values.
• The higher is the b-value, the more intense is the yellow color of the syrup.
• Maltose syrups from T2 show that as the pH values increased, the color of the samples became darker.
SUMMARY & CONCLUSION
• The yield of maltose syrup from both treatments 1 and 2 adjusted to pH 4 obtained significantly higher yield than with unadjusted pH.
• However, samples from T2 exhibited higher yield than T1.
• This loss or reduction in the amount of the filtrate is possibly due to evaporation of moisture during boiling of the mixture before extraction and also on the efficiency of juice filtration.
RECOMMENDATIONS
• The processing parameters for maltose syrup production such as germination time of rice seedling for malted rice production, time for maximum α- amylase production, and the right proportion of cassava starch to malted rice were determined.
• However, there are still areas of research that needs further investigation in order to be competitive in the existing commercial products such as:
RECOMMENDATIONS
• Optimize all other processing parameters for production of consistent quality products using the Response Surface Methodology;
• Use of microbial enzymes for cassava starch hydrolysis;
• Determine the storage shelf life of the most acceptable treatment;
• Develop packaging design of the product;

RECOMMENDATIONS
• Conduct market study to determine the acceptability of the product by the target clients; and
• Determine the production cost or profitability of the maltose syrup in comparison to the existing similar products in the market.