Quality evaluation of fermented sausages as...
12
Journal of Meat Science and Technology | July-September, 2014 | Vol 2 | Issue 3 | Pages 51-62 © 2014 Jakraya Publications (P) Ltd JOURNAL OF MEAT SCIENCE AND TECHNOLOGY Journal homepage: www.jakraya.com/journal/jmst ORIGINAL ARTICLE Quality evaluation of fermented sausages as influenced by different fat levels and temperature of fermentation Saghir Ahmad* and Qasim Nawab Department of Post Harvest Engineering and Technology, Faculty of Agricultural Science, Aligarh Muslim University, Aligarh, India. *Corresponding Author: Saghir Ahmad Email: [email protected] Received: 22/07/2014 Revised: 11/08/2014 Accepted: 11/08/2014 Abstract The investigations were carried out to study the effect of different fat and temperature levels for fermentation on various physico-chemical and microbiological characteristics of developed Semi Dried Fermented Sausage (SDFS). The response surface methodology was applied to study the effect of dependable variables on various physico-chemical and sensory properties. The quality of semi dry fermented sausage was based on physico-chemical characteristics (pH, moisture content, fat content, protein content, ash content, moisture protein ratio, TBA number ) and sensory characteristics (colour, flavour, texture, taste, mouth coating and juiciness). The pH of Semi Dried Fermented Sausage was found in the range of 4.8- 5.4 for the samples prepared with 33.1 0 C and 20 % fat content and 11.89 0 C. Moisture content and protein content of fresh SDFS were found in the following ranges 39.5-51.8 %, 17.0-18.87 % respectively. The fat incorporation significantly affected the physico-chemical and sensory properties of FDFS. The value of Moisture Protein Ratio ranged between 2.24 and 2.75 for the sample prepared with 15 0 C of temperature and 25% fat and 22.50 0 C temperatures and 12.93 % fat. It was found that increasing fat levels and a medium temperature of 20 0 C improved the sensory characteristics like juiciness, tenderness and texture of SDFS. The score values of these attributes varied from 8.21-8.5 when fat level increased to 20 % and temperature of fermentation remained 15 0 C. Samples were packed in combination film and for shelf life study was conducted under ambient condition. Progress of fermentation (carried out by mixed culture of Lactic Acid Bacteria, LAB) was recorded by drop of pH with respect to time. Increasing temperature was found to be function of drop in pH value. The time for completion of fermentation varied from two to five days. Thus fermentation, smoking and drying reduced the pH and moisture content. The reduced moisture content and low pH was the criteria for extended the shelf life of SDFS. Keyword: Fermented sausage, response surface methodology, moisture protein ratio, fat levels. Introduction Meat and meat products play an important role in human nutrition. However, being highly perishable, their storage and marketing demands considerable amount of energy input, in the form of refrigeration and freezing, which is costly and scantly in India and other developing countries. Development of simple technologies for the manufacture of shelf stable ready- to-eat meat products would not only save energy, bring better returns and provide consumer convenience but would also be a valuable contribution to the growth of meat industry. The role of fermentation as a means of food preservation and food conservation is well established. Stanton (1985) listed the virtues of food fermentation as: it preserves the raw materials at low cost; reduces fuel demand by reducing cooking time and temperature; enhances nutritional quality, by improving digestibility, protein value, vitamin content; destroys toxic or undesirable components and harmful biota, protects against re-infection and adds positive antibacterial components; and improves appearance, aroma, flavour and texture. UN (1679) recommended
Transcript of Quality evaluation of fermented sausages as...

Journal of Meat Science and Technology | July-September, 2014 | Vol 2 | Issue 3 | Pages 51-62 © 2014 Jakraya Publications (P) Ltd
JOURNAL OF MEAT SCIENCE AND TECHNOLOGY
Journal homepage: www.jakraya.com/journal/jmst
ORIGINAL ARTICLE
Quality evaluation of fermented sausages as influenced by different fat levels and temperature of fermentation Saghir Ahmad* and Qasim Nawab
Department of Post Harvest Engineering and Technology, Faculty of Agricultural Science, Aligarh Muslim University, Aligarh, India. *Corresponding Author: Saghir Ahmad
Email: [email protected]
Received: 22/07/2014 Revised: 11/08/2014 Accepted: 11/08/2014
Abstract The investigations were carried out to study the effect of different fat
and temperature levels for fermentation on various physico-chemical and microbiological characteristics of developed Semi Dried Fermented Sausage (SDFS). The response surface methodology was applied to study the effect of dependable variables on various physico-chemical and sensory properties. The quality of semi dry fermented sausage was based on physico-chemical characteristics (pH, moisture content, fat content, protein content, ash content, moisture protein ratio, TBA number ) and sensory characteristics (colour, flavour, texture, taste, mouth coating and juiciness). The pH of Semi Dried Fermented Sausage was found in the range of 4.8-5.4 for the samples prepared with 33.1 0C and 20 % fat content and 11.89 0C. Moisture content and protein content of fresh SDFS were found in the following ranges 39.5-51.8 %, 17.0-18.87 % respectively. The fat incorporation significantly affected the physico-chemical and sensory properties of FDFS. The value of Moisture Protein Ratio ranged between 2.24 and 2.75 for the sample prepared with 15 0C of temperature and 25% fat and 22.50 0C temperatures and 12.93 % fat. It was found that increasing fat levels and a medium temperature of 20 0C improved the sensory characteristics like juiciness, tenderness and texture of SDFS. The score values of these attributes varied from 8.21-8.5 when fat level increased to 20 % and temperature of fermentation remained 15 0C. Samples were packed in combination film and for shelf life study was conducted under ambient condition. Progress of fermentation (carried out by mixed culture of Lactic Acid Bacteria, LAB) was recorded by drop of pH with respect to time. Increasing temperature was found to be function of drop in pH value. The time for completion of fermentation varied from two to five days. Thus fermentation, smoking and drying reduced the pH and moisture content. The reduced moisture content and low pH was the criteria for extended the shelf life of SDFS. Keyword: Fermented sausage, response surface methodology, moisture protein ratio, fat levels.
Introduction Meat and meat products play an important role
in human nutrition. However, being highly perishable, their storage and marketing demands considerable amount of energy input, in the form of refrigeration and freezing, which is costly and scantly in India and other developing countries. Development of simple technologies for the manufacture of shelf stable ready-to-eat meat products would not only save energy, bring better returns and provide consumer convenience but would also be a valuable contribution to the growth of
meat industry. The role of fermentation as a means of food preservation and food conservation is well established. Stanton (1985) listed the virtues of food fermentation as: it preserves the raw materials at low cost; reduces fuel demand by reducing cooking time and temperature; enhances nutritional quality, by improving digestibility, protein value, vitamin content; destroys toxic or undesirable components and harmful biota, protects against re-infection and adds positive antibacterial components; and improves appearance, aroma, flavour and texture. UN (1679) recommended
Ahmad and Nawab… Quality evaluation of fermented sausages as influenced by fat levels and temperature
Journal of Meat Science and Technology | July-September, 2014 | Vol 2 | Issue 3 | Pages 51-62 © 2014 Jakraya Publications (P) Ltd
52
that future research should include more work on application of fermentation to meat, milk, sea-food etc. Sharma (1987) also indicated about the scope of development of fermented meat products in India. Ahmad and Srivastavas (2007) conducted studies on fermented sausage using culture of Lactic Acid Bacteria (LAB) and the product was found to be shelf stable. A combined culture of LAB further glorified the quality of fermented sausage with respect to colour, texture, juiciness (Ahmad and Amer, 2012). Materials and Methods
Experimental work was carried out to study the effect of different fat level and temperature for fermentation on quality characteristics of semi dry fermented sausage. Various physico-chemical and sensory properties of fresh samples were evaluated and different levels of fat and temperature (for fermentation) was combined using response surface methodology. Experimental design
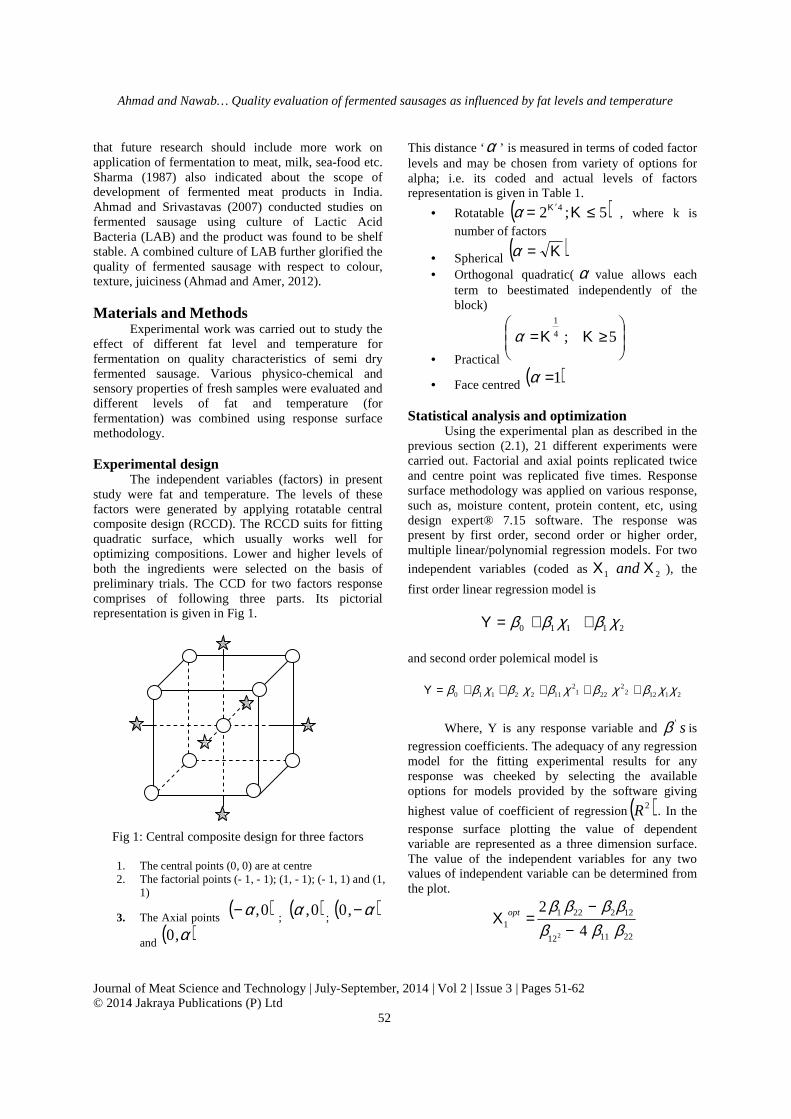
The independent variables (factors) in present study were fat and temperature. The levels of these factors were generated by applying rotatable central composite design (RCCD). The RCCD suits for fitting quadratic surface, which usually works well for optimizing compositions. Lower and higher levels of both the ingredients were selected on the basis of preliminary trials. The CCD for two factors response comprises of following three parts. Its pictorial representation is given in Fig 1.
Fig 1: Central composite design for three factors
1. The central points (0, 0) are at centre 2. The factorial points (- 1, - 1); (1, - 1); (- 1, 1) and (1,
1)
3. The Axial points ( )0,α− ;
( )0,α ; ( )α−,0
and ( )α,0
This distance ‘α ’ is measured in terms of coded factor levels and may be chosen from variety of options for alpha; i.e. its coded and actual levels of factors representation is given in Table 1.
• Rotatable( )5;2 4 ≤Κ= Κ′α , where k is
number of factors
• Spherical ( )Κ=α • Orthogonal quadratic(α value allows each
term to beestimated independently of the block)
• Practical
≥ΚΚ= 5;4
1
α
• Face centred ( )1=α Statistical analysis and optimization
Using the experimental plan as described in the previous section (2.1), 21 different experiments were carried out. Factorial and axial points replicated twice and centre point was replicated five times. Response surface methodology was applied on various response, such as, moisture content, protein content, etc, using design expert® 7.15 software. The response was present by first order, second order or higher order, multiple linear/polynomial regression models. For two
independent variables (coded as 21 ΧΧ and ), the
first order linear regression model is
21110 χβχββ ++=Υ
and second order polemical model is
211222
2212
1122110 χχβχβχβχβχββ +++++=Υ
Where, Y is any response variable and s'β is
regression coefficients. The adequacy of any regression model for the fitting experimental results for any response was cheeked by selecting the available options for models provided by the software giving
highest value of coefficient of regression( )2R . In the
response surface plotting the value of dependent variable are represented as a three dimension surface. The value of the independent variables for any two values of independent variable can be determined from the plot.
221112
1222211 4
2
2 βββββββ
−−
=Χ opt
Ahmad and Nawab… Quality evaluation of fermented sausages as influenced by fat levels and temperature
Journal of Meat Science and Technology | July-September, 2014 | Vol 2 | Issue 3 | Pages 51-62 © 2014 Jakraya Publications (P) Ltd
53
2211122
1212112 4
2
βββββββ
−−=Χ opt
The value of the response function under this condition is
222211
0
optopt
optχβχβ
β ++=Υ
The overall optimization was done by choosing
a desired goal for each factor and response from goals: maximize, target, within range none (for response only) and set to exact value (for factor only). These goals were then combined into an overall desirability function on the desirability objective function D (χ ), each response was assigned an importance relative to other response. The importance varies from the least value to 1 to maximize value of 5. For the different
important values the desirability function is given as
( )∑ΧΧΧ= irnrn
rr dddD1
2121
KKK
Where n is the number of response in the
measure and di are value according to which goals for each response was set. Experimental studies were conducted on semi-dry fermented sausages prepared by using different levels of fat and temperature conditions suggested by the RSM, during refrigerated storage (40C). The treatment of sodium ascorbate along with sodium nitrite was given to meat mix before preparation (fermentation, filling, smoking and drying). The quality of semi dried fermented sausage was evaluated on the basis of physico-chemical characteristics viz. pH, acidity, moisture content, protein content, fat content, moisture protein ratio (MPR), Thiobarbituric acid (TBA) number, sensory
characteristics like colour, aroma, texture, taste, juiciness and mouth feel. Preparation of meat and non meat ingredient
Meat samples collected from the local meat shop in the study were from buffaloes slaughtered according to traditional halal method at slaughterhouse of municipal corporation, Aligarh. The animals were kept in lairage for a period of 18-20 hours. Meat samples from round portion (Biceps femoris muscle) of 2.5, 3 and 3.5 years aged female carcasses of good finish were obtained from meat shop within 4 hr. of slaughter. The meet chunks were packed in combination film packaging and brought to the laboratory with in 20 min. Buffalo fat were also packed in combination film packaging and brought to the laboratory. Other non-meat ingredients like spices, salt, condiments and combination film were procured from the local market. This fibrous casing was procured from PRS technologies New Delhi. The meat and fat were kept inside ultra low temperature cabinet at 40C. Preparation of semi dry fermented sausage
Fermented sausages were prepared from comminuted mixture of meat, fat, salt, spices and sugar using bacterial culture there allowed to undergo fermentation under strict conditions of temperature and humidity. Two different lots of semi dry fermented sausages were conducted containing two levels of fat 20% and 25%. The composition of fermented sausages was kept: meat (2 kg), fat (400 and 500 g for 20 and 25% fat samples respectively), mix spices (24 g), chilli powder (12 g), condiments (40 g), salt (50 g), sugar (20 g), dextrose (10 g), sodium ascorbate (1000 mg), mono sodium glutamate (2 g), ice (150 g) and 10 ml of starter culture. The buffalo meat and fat were ground on a -
Table 1: Coded and actual levels of factors
S. No
Point type Coded value Temperature Degree C
Fat (%)
No of replications
1 Factorial ( )1,1 −− 15 15 2
2 Factorial ( )1,1− 15 25 2
3 Factorial ( )1,1− 30 25 2
4 Factorial ( )1,1 30 25 2
5 Centre ( )0,0 22.50 20 5
6 Axial ( )0,141.1− 11.89 20 2
7 Axial ( )414.1,0− 22.50 12.93 2
8 Axial ( )414.1,0 22.50 27.07 2
9 Axial ( )0,414.1 33.11 20 2

Ahmad and Nawab… Quality evaluation of fermented sausages as influenced by fat levels and temperature
Journal of Meat Science and Technology | July-September, 2014 | Vol 2 | Issue 3 | Pages 51-62 © 2014 Jakraya Publications (P) Ltd
54
grinder (PRS Technologies, India). Then buffalo meat was first chopped and then fat and other non-meat ingredients were added, salt was added at very end of chopping. Bowel cutter (PRS Technologies, India) was used for chopping of meat and other ingredients. Spices, condiment and mono sodium glutamate (MSG) were added to contribute flavour in semi dry sausages. Well-mixed mass was further added with different combined culture and finally placed in a shallow pan and held at 15oC, 85% relative humidity to complete fermentation. The completion of fermentation was indicated by drop in pH of the mixture. After the completion of fermentation the mixture was stuffed into the casing by using the sausage filler machine. Stuffing into fibrous casing (35 mm dia.) was done firmly and carefully to exclude the air inside the casing, which might discolour the meat mix and reduce the shelf life of the sausages. Semi dry fermented sausages then were smoked at temperature 40-60oC for 4 hours to improve flavour and to inhibit bacterial development. The smoked sausages were dried at 20oC and relative humidity 70%. The drying was done at optimum speed, precautions were taken to ensure that sausages neither dried too fast nor retained surface moisture and become sticky. At the end, sausages samples were packed in combination film under atmosphere packaging and stored at refrigerated temperature of 2oC for further study. Physico-chemical analysis
The pH of the finally minced samples were determined after homogenizing 10g of the sample with 100 ml distilled water using laboratory grinder (Yarco, India). The pH of suspension was recorded using reference and glass electrode portable type Digital pH meter model PH1500 (Eutech, Singapore) (Ranganna, 2002).
Thiobarbituric acid TBA reagent was prepared by dissolving 0.2883 g of Thiobarbituric acid in sufficient quantity of 90% acetic acid and by slight warming, the volume being made up 100 ml with 90% acetic acid. 20 g of meat sample were blended in a blender with 50 ml of cold 20% tricarboxylic acid (TCA) for 2 min. The blended contents were rinsed with 50 ml of distilled water, mixed together and filtered through filter paper and the interstate was collected in a 100 ml capacity-measuring cylinder. The filtrate, termed the TCA extract was used in the estimation of thiobarbituric acid (TBA) number. TBA number was measured by the method described by Strange et al. (1977). Five ml of TCA extract was mixed with 5 ml of TBA reagent in test tube. The test tube was kept in a water bath at 100o C for 30 min
along with another test tube containing a blank of 10% TCA and 5 ml of TBA reagent. After cooling the tubes in running water about 10 min, the absorbance was measured at 530 nm in a spectrophotometer (Digital spectrophotometer Model 310E, India) and reported as TBA number. Results and Discussion
The present study was undertaken for development, quality evaluation and shelf life studies of buffalo meat semi dry fermented sausage (SDFS) produced by using different levels of fat and temperature conditions. The quality of fresh sausage was evaluated on the basis of physico-chemical characteristics namely pH, acidity, moisture content, protein content, moisture protein ratio (MPR), fat content and TBA number, microbiological characteristics viz. total plate count, yeast and mold count, and coliform count and sensory characteristics. In the first experiment the composition of the fermented sausage was optimized using Response Surface Methodology. The results of the study have been presented in different tables and graphs and are discussed below: Effect of factors levels (fat and temperature) on various responses
The effect of fat and temperature on various physico-chemical and sensory evaluation properties of fresh samples of fermented sausage have been summarized in Table 2. Effect on moisture content
Moisture content of semi dry fermented sausage is an important characteristic, which relates the quality and shelf life. The moisture content is also criteria for deciding the completion of product in case of fermented sausage. The moisture is an important property influencing storage stability and texture of foods. Higher moisture containing foods are more prone to microbial spoilage but they have softer texture. The moisture content in the samples ranged between 39.5% (db) (in the sample prepared by incorporating 27.07% fat and) and 51.8 % (db) (in the sample prepared by incorporating 12.93% fat). The regression model obtained for moisture content.
M.C = +45.41 - 0.10* A - 4.05* B
Table 3 shows that the linear model was
suggested by the analysis and was found significant on

Ahmad and Nawab… Quality evaluation of fermented sausages as influenced by fat levels and temperature
Journal of Meat Science and Technology | July-September, 2014 | Vol 2 | Issue 3 | Pages 51-62 © 2014 Jakraya Publications (P) Ltd
55
Table 2: Physico-chemical and microbiological properties of fresh samples of fermented sausage
Table 3: ANOVA for Moisture Content
SOURCE SS Df MS F-VALUE P value
Prob>F
Model 262.95 2 131.47 764.02 <0.0001 Significant
A-Temp. 0.17 1 0.17 1.01 0.3293
B-Fat 262.77 1 262.77 1527.03 <0.0001
Residual 3.10 18 0.17
Lack of fit 1.34 6 0.22 1.52 0.2532 Non-Significant
Pure error 1.76 12 0.15
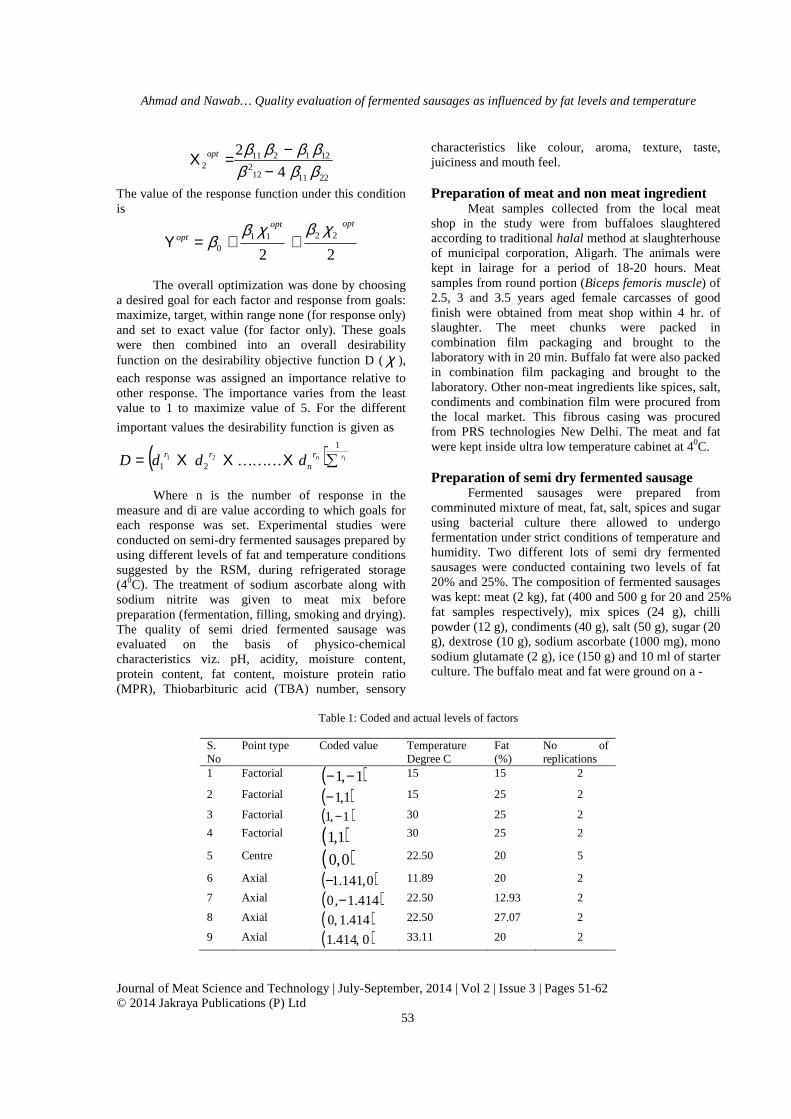
R2 0.9836 The model showed (R2 = 0.9836). The coefficient of linear term of factors indicates that the moisture content is negatively correlated with quantity of fat and temperature, whereas the quantity of temperature shows a weak negative correlation, and the F value shows that the fat affected more as compared to temperature. Fig 2 shows the response surface plot, describing the influence of temperature and fat on calculated response variable (moisture content). Starting from the initial point (A=150C, B=15%) value of moisture content was found 49.56%, the moisture decreased to 45.51% when the fat level was increased to 20%, while it further decreased to 41.46% when the fat level was increased to 25%.
Effect on pH Table 2 represents the results of pH of semi dry
fermented sausage produced by using different levels of fat and temperature conditions. Samples after preparation were packed by atmosphere packaging. pH of sausage samples lowered down after fermentation, smoking and drying. Reduction in pH was due to formation of lactic acid by mixed culture of LAB using carbohydrates (dextrose and sucrose) added in the meat mix. Similar results were obtained by (Ensoy et al., 2010). During refrigerated storage 2oC, pH values were found to significantly (p<0.05) decrease. At the end of 120 days of storage pH values were found to be between 4.39 and 4.43. Increasing the fat level from 20% to 25% increased the pH of all sample and that agreed
Std Run Type Factor 1 A: Temperature Degree C
Factor 2 B:Fat%
MC % (db)
pH Acidity %
Protein MPR %
MPR TBA Sensory Characte- ristics
5 1 Fact 15 25 41 5.1 0.508 18.3 2.24 0.35 8.62 15 2 Axial 22.5 27.07 40 5 0.557 17 2.35 0.38 8.6
13 3 Axial 22.5 12.93 51.8 5.2 0.475 18.87 2.75 0.23 8.12 12 4 Axial 33.11 20 45.8 4.8 0.607 18.44 2.48 0.3 8.48 11 5 Axial 33.11 20 45.4 4.9 0.585 18.44 2.46 0.31 8.45 20 6 Center 22.5 20 46 5 0.554 18.72 2.46 0.306 8.51 7 7 Fact 30 25 41.2 5.1 0.5 17.56 2.35 0.351 8.5 3 8 Fact 30 15 49 5.2 0.472 18.64 2.63 0.25 8.3 1 9 Fact 15 15 50.09 5.3 0.406 18.76 2.67 0.245 8.25 16 10 Axial 22.5 27.07 39.5 4.9 0.58 17.12 2.31 0.385 8.62 19 11 Center 22.5 20 45.6 5.1 0.504 18.22 2.5 0.295 8.5 8 12 Fact 30 25 41 5 0.552 17.56 2.33 0.355 8.42 14 13 Axial 22.5 12.93 51 5.2 0.46 18.87 2.7 0.235 8.1 18 14 Center 22.5 20 45.5 5.2 0.464 17.2 2.64 0.308 8.4 17 15 Center 22.5 20 45.2 5.2 0.48 17.34 2.61 0.29 8.6 4 16 Fact 30 15 48.5 5 0.55 18.64 2.6 0.26 8.35 2 17 Fact 15 15 49 5.1 0.506 18.76 2.61 0.265 8.23 10 18 Axial 11.89 20 45.62 5.4 0.36 18.13 2.52 0.3 8.46 21 19 Center 22.5 20 45.4 5.2 0.466 17.52 2.59 0.305 8.54 6 20 Fact 15 25 41.5 5 0.556 18.3 2.27 0.345 8.65 9 21 Axial 11.89 20 45.42 5.2 0.476 18.13 2.51 0.303 8.48

Ahmad and Nawab… Quality evaluation of fermented sausages as influenced by fat levels and temperature
Journal of Meat Science and Technology | July-September, 2014 | Vol 2 | Issue 3 | Pages 51-62 © 2014 Jakraya Publications (P) Ltd
56
with the result of studies conducted by (Ahmad, 2005; Liaquati and Srivastava, 2010; Olivares et al., 2010). pH plays an important role in preservation of foods. Generally high acidic foods are less prone to bacterial spoilage but have chance of mould spoilage. The value of pH ranged between 4.8 and 5.4 for the sample prepared with 33.110C of Temperature +20% of Fat and 11.89 0C of Temperature + 20% Fat, respectively. Following equation is the regression model obtained for pH.
pH = +5.10 - 0.092 * A - 0.069 *
Table 4 shows that the linear model was
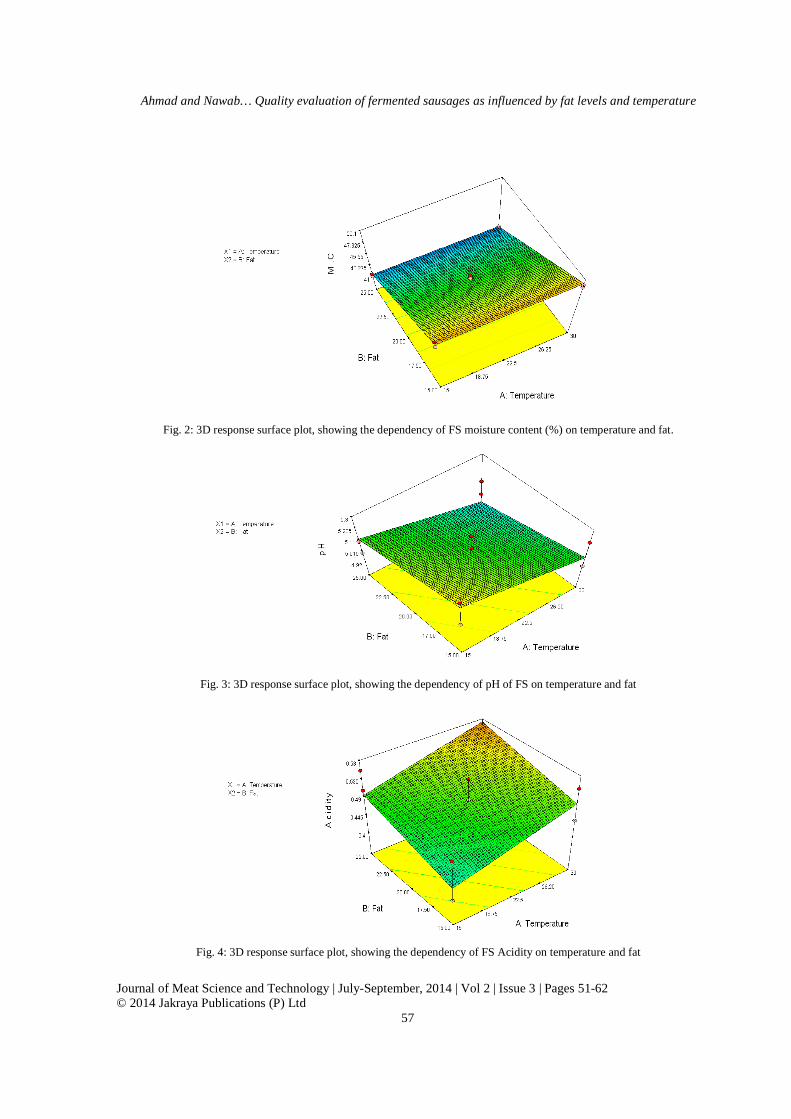
suggested by the analysis and was found significant on the analysis of variance at (p<0.05), the linear model showed low (R2 = 0.3113). The coefficient of linear term of factors indicates that the pH is negatively correlated with the amount of temperature whereas the quantity of fat shows a weak negative correlation. The values (F value) of the table also indicate that the temperature has more effect as compared to fat. Fig 3 shows the response surface plot, describing the influence of temperature and fat on calculated response variable (pH). Starting from the initial point (A=150C, B=15%) value of pH was found 5.26 and decreases to 5.19 when we increase the temperature to 200C and further decreases to 5.07 when the temperature increases to 300C. Effect on acidity
Table 2 represents the results of acidity of semi dry fermented sausage produced by using different levels of fat and temperature conditions according to RSM. Samples after preparation were packed by atmosphere packaging. Acidity of sausage samples increase after fermentation, smoking and drying. The acidity increases due to formation of lactic acid by mixed culture of LAB using carbohydrates (dextrose and sucrose) added in the meat mix. Acidity of semi dry fermented sausage was determined to ascertain the progress of fermentation. During fermentation mixed culture was added in the mix and lactic acid was produced. Acidity plays an important role in preservation of foods. Generally high acidic foods are less prone to bacterial spoilage but have chance of mould spoilage. The value of acidity ranged between 0.36 and 0.61 for the sample prepared with 11.890C of Temperature +20% of Fat and 33.110C of Temperature + 20% Fat, respectively. Following equation is the regression model obtained for acidity-
Acidity=+0.51+0.038*A+0.029*B
Table 5 shows that the linear model was suggested by the analysis and was found significant on
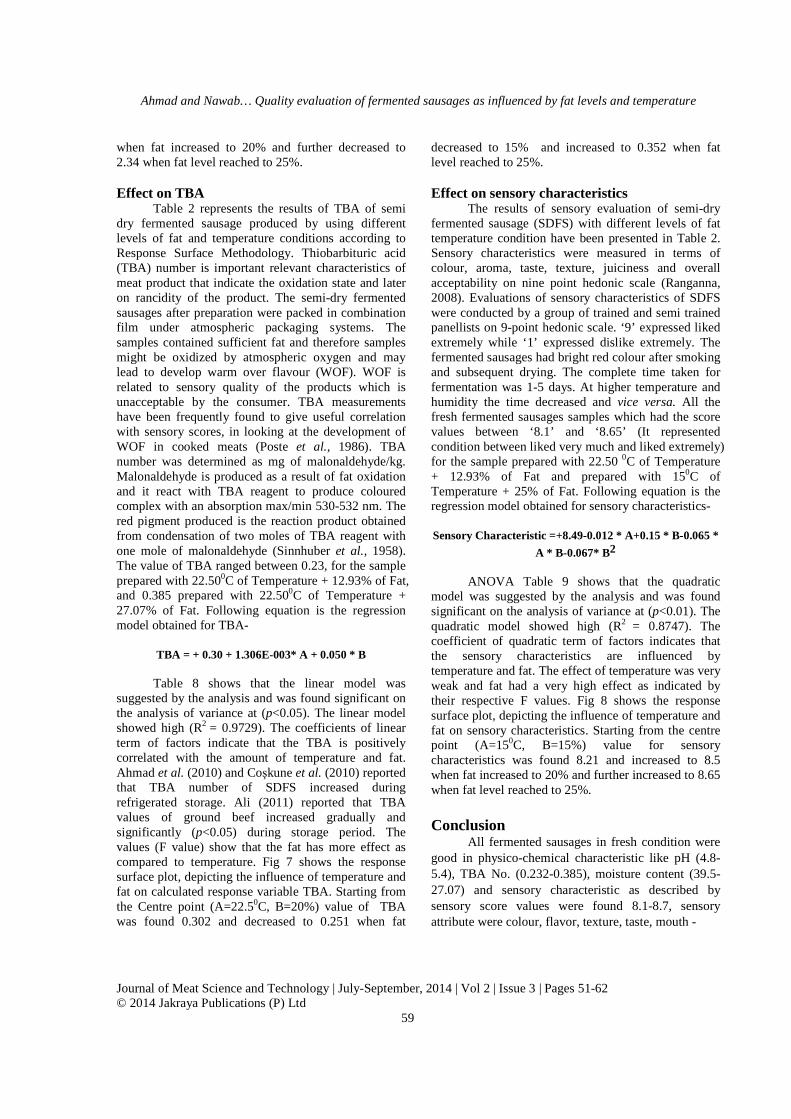
the analysis of variance at (p<0.05), the linear model showed low (R2 = 0.2868). The coefficient of linear term of factors indicates that the acidity is positively correlated with the amount of temperature and fat. The value (F value) of the Table 5 also indicates that the temperature has more effect as compared to fat. Fig 4 shows the response surface plot, describing the influence of temperature and fat on calculated response variable (Acidity). Starting from the initial point (A=150C, B=15%) value of acidity was found 0.439 and increase to 0.497 and 0.514 when fat increase to 25% and temperature to 300C respectively. Effect on protein content
Protein content of semi dry fermented sausage is an important characteristic, which relates the quality and shelf life. The protein is the third major class of nutrients. There are thousands of proteins founds in nature which vary in their composition and size. All the proteins contain the elements carbon, hydrogen, oxygen and nitrogen. Proteins are essential for tissue building and maintaining N equilibrium. Protein in the diet should be derived from different sources and provide at least 10 to 12 per cent energy. A good quantity of protein is essential for proper growth. The value of protein content ranged between 17 and 18.87 for the sample prepared with 22.500C of Temperature + 27.07% of Fat and 22.500C of Temperature + 12.93% of Fat, respectively (Table 2). Following equation is the regression model obtained for protein content-
Protein content (%) = + 18.12 - 0.053 * A - 0.51 * B
Table 6 shows that the linear model was
suggested by the analysis and was found significant on the analysis of variance at (p<0.05), the linear model showed low (R2 = 0.4324). Fig 4 shows the response surface plot, describing the influence of temperature and fat on calculated response variable (Protein content). Effect on MPR
Table 2 represents the results of MPR of semi dry fermented sausage produced by using different levels of fat and temperature conditions according to Response Surface Methodology. Semi dry sausages have low moisture content (40-50%). The ratio of moisture content and protein is known as moisture protein ratio (MPR) and it has been considered a standard property. MPR of semi dried fermented sausages was found apparently increased due to increase the percentage of fat. That indicates the decrease in protein content was more than the decrease of moisture content due to increase the level of fat. However, in both levels of fat, the values of MPR-
Ahmad and Nawab… Quality evaluation of fermented sausages as influenced by fat levels and temperature
Journal of Meat Science and Technology | July-September, 2014 | Vol 2 | Issue 3 | Pages 51-62 © 2014 Jakraya Publications (P) Ltd
57
Fig. 2: 3D response surface plot, showing the dependency of FS moisture content (%) on temperature and fat.
Fig. 3: 3D response surface plot, showing the dependency of pH of FS on temperature and fat
Fig. 4: 3D response surface plot, showing the dependency of FS Acidity on temperature and fat

Ahmad and Nawab… Quality evaluation of fermented sausages as influenced by fat levels and temperature
Journal of Meat Science and Technology | July-September, 2014 | Vol 2 | Issue 3 | Pages 51-62 © 2014 Jakraya Publications (P) Ltd
58
Table 4 ANOVA for pH
SOURCE SS dF MS F-VALUE P value Prob>F
Model 0.21 2 0.11 9.19 0.0018 significant
A-Temp. 0.14 1 0.14 11.74 0.0030
B-Fat 0.077 1 0.077 6.63 0.0190
Residual 0.21 18 0.012
Lack of fit 0.096 6 0.016 1.71 0.2016 Not significant
Pure error 0.11 12 9.333E-003
R2 0.311
Table 5: ANOVA for Acidity
SOURCE SS dF MS F-VALUE P value
Prob>F
Model 0.036 2 0.018 8.68 0.0023 significant
A-Temp. 0.023 1 0.023 10.82 0.0041
B-Fat 0.014 1 0.014 6.54 0.019
Residual 0.038 18 2.090E-003
Lack of fit 0.014 6 2.359E-003 1.21 0.3671 Not significant
Pure error 0.023 12
R2 0.2868
Table 6: ANOVA for Protein Content
SOURCE SS dF MS F-VALUE P value
Prob>F
Model 4.25 2 2.12 10.69 0.0009 significant
A-Temp. 0.044 1 0.044 0.22 0.6419
B-Fat 4.20 1 4.20 21.16 0.0002
Residual 3.57 18 0.20
Lack of fit 1.89 6 0.32 2.26 0.1086 Not significant
Pure error 1.68 12 0.14
R2 0.4324
obtained in this study were in the range of 1.751-2.097. MPR should be in the range of 3.7-1.0 (AMI, 1982). That was in accordance with FSIS (1986); Ricke and Keeton (1997); Doyle (2001). Guidance from the Food Safety and Inspection Service/United States Department of Agriculture (FSIS/USDA) requires that shelf stable semi-dry and dry sausage be nitrite cured, fermented, and smoked, and have MPR of ≤3.1:1 and ≤1.9:1, with a final of pH ≤ 5.0 (American Meat Institute Foundation, 1997). The value of MPR ranged between 2.24 and 2.75 for the sample prepared with 150C of Temperature + 25% of Fat and 22.500C of Temperature + 12.93% of Fat, respectively. Following (Eq.) is the regression model obtained for MPR-
MPR = +2.53 - 4.550E-004 * A - 0.15* B - 0.036 * A2
Table 7 shows that the quadratic model was
suggested by the analysis and was found significant on the analysis of variance at (p<0.05), the quadratic model showed high (R2 = 0.8123). The coefficient of linear term of factors indicates that the MPR is negatively correlated with the amount of temperature and fat. The values (F value) show that the fat has more effect as compared to temperature. Fig 6 shows the response surface plots, describing the influence of temperature and fat on calculated response variable MPR. Starting from the initial point (A=150C, B=15%) value of MPR was found 2.65 and decreased to 2.49
Ahmad and Nawab… Quality evaluation of fermented sausages as influenced by fat levels and temperature
Journal of Meat Science and Technology | July-September, 2014 | Vol 2 | Issue 3 | Pages 51-62 © 2014 Jakraya Publications (P) Ltd
59
when fat increased to 20% and further decreased to 2.34 when fat level reached to 25%. Effect on TBA
Table 2 represents the results of TBA of semi dry fermented sausage produced by using different levels of fat and temperature conditions according to Response Surface Methodology. Thiobarbituric acid (TBA) number is important relevant characteristics of meat product that indicate the oxidation state and later on rancidity of the product. The semi-dry fermented sausages after preparation were packed in combination film under atmospheric packaging systems. The samples contained sufficient fat and therefore samples might be oxidized by atmospheric oxygen and may lead to develop warm over flavour (WOF). WOF is related to sensory quality of the products which is unacceptable by the consumer. TBA measurements have been frequently found to give useful correlation with sensory scores, in looking at the development of WOF in cooked meats (Poste et al., 1986). TBA number was determined as mg of malonaldehyde/kg. Malonaldehyde is produced as a result of fat oxidation and it react with TBA reagent to produce coloured complex with an absorption max/min 530-532 nm. The red pigment produced is the reaction product obtained from condensation of two moles of TBA reagent with one mole of malonaldehyde (Sinnhuber et al., 1958). The value of TBA ranged between 0.23, for the sample prepared with 22.500C of Temperature + 12.93% of Fat, and 0.385 prepared with 22.500C of Temperature + 27.07% of Fat. Following equation is the regression model obtained for TBA-
TBA = + 0.30 + 1.306E-003* A + 0.050 * B
Table 8 shows that the linear model was
suggested by the analysis and was found significant on the analysis of variance at (p<0.05). The linear model showed high (R2 = 0.9729). The coefficients of linear term of factors indicate that the TBA is positively correlated with the amount of temperature and fat. Ahmad et al. (2010) and Coşkune et al. (2010) reported that TBA number of SDFS increased during refrigerated storage. Ali (2011) reported that TBA values of ground beef increased gradually and significantly (p<0.05) during storage period. The values (F value) show that the fat has more effect as compared to temperature. Fig 7 shows the response surface plot, depicting the influence of temperature and fat on calculated response variable TBA. Starting from the Centre point (A=22.50C, B=20%) value of TBA was found 0.302 and decreased to 0.251 when fat
decreased to 15% and increased to 0.352 when fat level reached to 25%. Effect on sensory characteristics
The results of sensory evaluation of semi-dry fermented sausage (SDFS) with different levels of fat temperature condition have been presented in Table 2. Sensory characteristics were measured in terms of colour, aroma, taste, texture, juiciness and overall acceptability on nine point hedonic scale (Ranganna, 2008). Evaluations of sensory characteristics of SDFS were conducted by a group of trained and semi trained panellists on 9-point hedonic scale. ‘9’ expressed liked extremely while ‘1’ expressed dislike extremely. The fermented sausages had bright red colour after smoking and subsequent drying. The complete time taken for fermentation was 1-5 days. At higher temperature and humidity the time decreased and vice versa. All the fresh fermented sausages samples which had the score values between ‘8.1’ and ‘8.65’ (It represented condition between liked very much and liked extremely) for the sample prepared with 22.50 0C of Temperature + 12.93% of Fat and prepared with 150C of Temperature + 25% of Fat. Following equation is the regression model obtained for sensory characteristics-
Sensory Characteristic =+8.49-0.012 * A+0.15 * B-0.065 *
A * B-0.067* B2
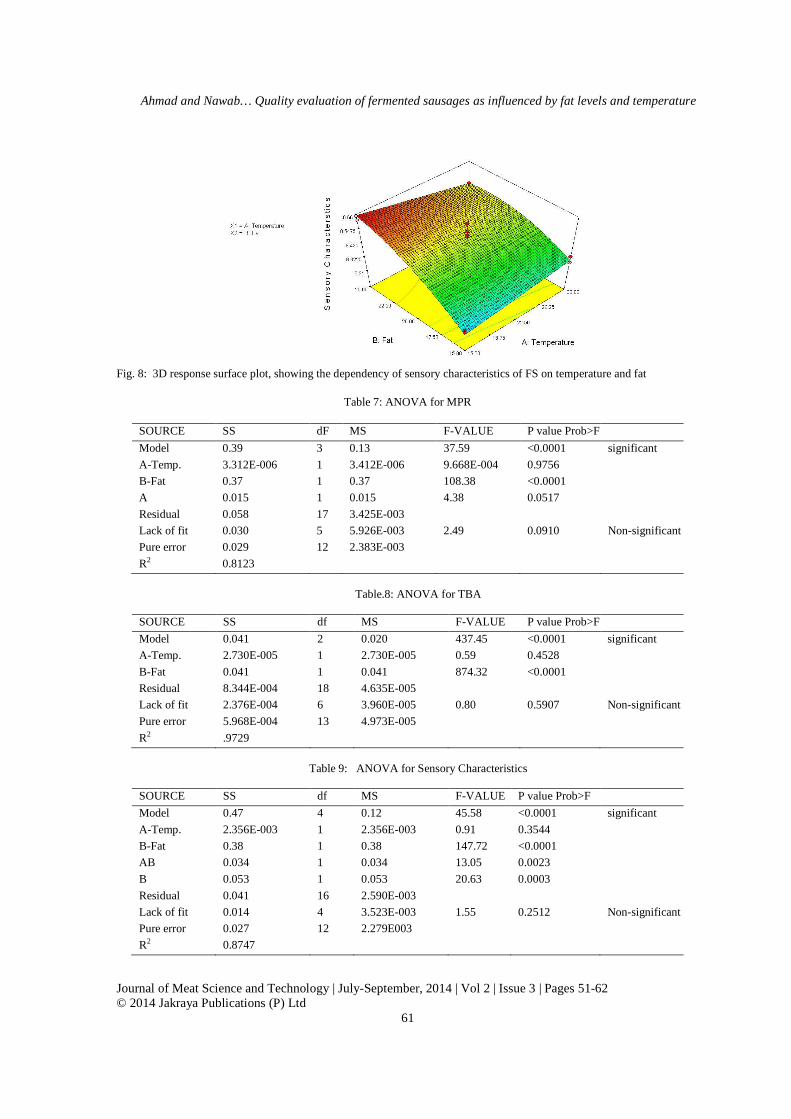
ANOVA Table 9 shows that the quadratic
model was suggested by the analysis and was found significant on the analysis of variance at (p<0.01). The quadratic model showed high (R2 = 0.8747). The coefficient of quadratic term of factors indicates that the sensory characteristics are influenced by temperature and fat. The effect of temperature was very weak and fat had a very high effect as indicated by their respective F values. Fig 8 shows the response surface plot, depicting the influence of temperature and fat on sensory characteristics. Starting from the centre point (A=150C, B=15%) value for sensory characteristics was found 8.21 and increased to 8.5 when fat increased to 20% and further increased to 8.65 when fat level reached to 25%. Conclusion
All fermented sausages in fresh condition were good in physico-chemical characteristic like pH (4.8-5.4), TBA No. (0.232-0.385), moisture content (39.5-27.07) and sensory characteristic as described by sensory score values were found 8.1-8.7, sensory attribute were colour, flavor, texture, taste, mouth -

Ahmad and Nawab… Quality evaluation of fermented sausages as influenced by fat levels and temperature
Journal of Meat Science and Technology | July-September, 2014 | Vol 2 | Issue 3 | Pages 51-62 © 2014 Jakraya Publications (P) Ltd
60
Fig. 5: 3D response surface plot, showing the dependency of FS Protein on temperature and fat
Fig. 6: 3D response surface plot, showing the dependency of Moisture Protein Ratio of FS on temperature and fat
Fig. 7: 3D response surface plot, showing the dependency of TBA No. of FS on temperature and fat.
Ahmad and Nawab… Quality evaluation of fermented sausages as influenced by fat levels and temperature
Journal of Meat Science and Technology | July-September, 2014 | Vol 2 | Issue 3 | Pages 51-62 © 2014 Jakraya Publications (P) Ltd
61
Fig. 8: 3D response surface plot, showing the dependency of sensory characteristics of FS on temperature and fat
Table 7: ANOVA for MPR
SOURCE SS dF MS F-VALUE P value Prob>F
Model 0.39 3 0.13 37.59 <0.0001 significant
A-Temp. 3.312E-006 1 3.412E-006 9.668E-004 0.9756
B-Fat 0.37 1 0.37 108.38 <0.0001
A 0.015 1 0.015 4.38 0.0517
Residual 0.058 17 3.425E-003
Lack of fit 0.030 5 5.926E-003 2.49 0.0910 Non-significant
Pure error 0.029 12 2.383E-003
R2 0.8123
Table.8: ANOVA for TBA
SOURCE SS df MS F-VALUE P value Prob>F
Model 0.041 2 0.020 437.45 <0.0001 significant
A-Temp. 2.730E-005 1 2.730E-005 0.59 0.4528
B-Fat 0.041 1 0.041 874.32 <0.0001
Residual 8.344E-004 18 4.635E-005
Lack of fit 2.376E-004 6 3.960E-005 0.80 0.5907 Non-significant
Pure error 5.968E-004 13 4.973E-005
R2 .9729
Table 9: ANOVA for Sensory Characteristics
SOURCE SS df MS F-VALUE P value Prob>F
Model 0.47 4 0.12 45.58 <0.0001 significant
A-Temp. 2.356E-003 1 2.356E-003 0.91 0.3544
B-Fat 0.38 1 0.38 147.72 <0.0001
AB 0.034 1 0.034 13.05 0.0023
B 0.053 1 0.053 20.63 0.0003
Residual 0.041 16 2.590E-003
Lack of fit 0.014 4 3.523E-003 1.55 0.2512 Non-significant
Pure error 0.027 12 2.279E003
R2 0.8747

Ahmad and Nawab… Quality evaluation of fermented sausages as influenced by fat levels and temperature
Journal of Meat Science and Technology | July-September, 2014 | Vol 2 | Issue 3 | Pages 51-62 © 2014 Jakraya Publications (P) Ltd
62
coating and juiciness. Progress of fermentation by mix culture of lactic acid bacteria, was recorded by drop of pH with respect to time. In principle fermentation smoking and drying reduced the pH and moisture content. The reduced moisture content and low pH was declaration for extended shelf life of semi dry fermented sausage. The study during the storage
stability that semi dry fermented sausage as in combination film had the shelf life of 75 days. Acknowledgment
Authors gratefully acknowledge Indian Council of Agricultural Research, New Delhi for providing the facility of experiment under Adhac Research Project on fermented sausage.
References Ahmad S (2005). Studies on quality and shelf life evaluation
of buffalo meat sausage incorporated with different levels of heart and fat. Ph.D. thesis. AMU, Aligarh, India.
Ahmad S and Amer B (2012). Effect of different cultures of Lactic acid bacteria fermentationon quality and shelflife of semidry fermenrted saudsages of buffalo meat. Journal of Industrial Research and Technology, 2(2): 603-609.
Ahmad S and Srivastava PK(2007). Quality and shelf life evaluation of fermented sausages of buffalo meat with different levels of heart and fat. Meat Science, 79(2): 603-609.
Ahmad S, Rizawi JA and Srivatava PK (2010). Effect of protein isolate incorporation on quality characteristics and shelf life of buffalo meat emulsion sausages. Journal of Food Science and Technology, 47(2): 290-294.
Ali RFM (2011). Antioxidative effects of pomposia extract, on lipid oxidation and quality of ground beef during refrigerated storage. American Journal of Food Technology, 6(1): 52-62.
American Meat Institute Foundation (1997). Good manufacturing practices for fermented dry and semi-dry sausage products. www.amif.org/Factsand- Figures/Sausage.pdf
AMI (1982). Good manufacturing practices, fermented dry and semi dry sausage. American Meat Institute, Washington. D.C.
APHA (1992). Compendium of methods for microbiological examination of foods. ML Speck (Ed) American Public Health Association, Washington, DC.
Coşkuner Ö, Ertas A H and Soyer A (2010). The effect of processing method and storage time on constituents of Turkish sausages (sucuk). Journal of Food Processing and Preservation, 34: 125-135.
Doyle MP, Beuchat LR and Montville TJ (2001). Fermented meat, poultry and fish products, In food microbiology. ASM Pub. N.W. Washington. pg-865.
Ensoy U, Kolsarici N, Candoğan K and Karslioğlu B (2010). Changes in biochemical and microbiological characteristics of turkey sucuks as affected by processing and starter culture utilization. Journal of Muscle Foods, 21: 142-165.
FSIS (1986). Standards and Labeling Policy Book. Food Safety and Inspection Service. Standards and Labeling Division. Washington, DC.
Liaquati S and Srivastava P (2010). Studies on quality and shelf life evaluation of buffalo meat sausages, utilization of byproducts for value addition and improve meat process economy. LAP Lambert Academic publishing, Germany. Pp 60-70.
Olivares A, Navarro JL, Salvador A and Flores M (2010). Sensory acceptability of slow fermented sausages based on fat content and ripening time. Meat Science, 86: 251-257.
Poste LM, Willemot C, Butler G and Patterson C (1986). Sensory aroma scores and TBA values as indices of warmed-over flavour in pork. Journal of Food Science, 51: 886-888.
Ranganna S (2002). Fruit Juices, Concentrate and Beverages In ‘Handbook of analysis and quality control for fruit and vegetable products, Second Edition.’Tata Mc Graw Hill Pub. Co. Ltd. New Delhi. pp 879-81.
Ranganna S (2002). Sensory Evaluation In ‘Handbook of analysis and quality control for fruit and vegetable products Second Edition.’ Tata Mc Graw Hill Pub. Co. Ltd. New Delhi. pp 623-24.
Ricke SC and Keeton JT (1997). Fermented meat, poultry, and fish products. Ch. 33 in Food Microbiology: Fundamentals and Frontiers, 1st Ed., Doyle, M.P., Beuchat, L.R., and Montville, T.J. (Ed.). ASM Press, Washington, DC. pp 610-628.
Sharma N (1987). Processed meat products and their potential in 2000 AD. Advances in meat research. J.B. Khot, A.T. Sherikar, B.M. Jayarao, Pillai (Eds). Red and Blue Cross Publisher, Bombay.
Sinnhuber RO, Yu T C and Yu T C (1958). Characterization of red pigment formed in the 2-thiobarbturic acid determination of oxidative rancidity. Food Research, 17: 550.
Stanton WR (1985). Food fermentation in the Tropics. In, Microbiology of fermented foods. Vol. 2. J.B. Brian (Ed.), pp 193-211. Elsevier Applied Sci. Pblishers, London.
Strange ED, Benedict RC, Smith JL and Swift K (1977). Evaluation of rapid tests for monitoring alteration in meat quality during storage. Journal of Food Protection, 40: 843-847.
UN (1979). Workshop on research and development needs in the field of fermented foods. United Nations International Symposium on microbiological aspects of food storage, processing and fermentation in Tropical Asia, Dec. 14-15, Bogor, Indonesia.