Quality crisis in Indian power supply...
33
Quality crisis in Indian power supply systems Anjuli Chandra, Director, CEA
Transcript of Quality crisis in Indian power supply...

Quality crisis in Indian power supply systems
Anjuli Chandra,Director, CEA

Power Quality (PQ)Power Quality (PQ)The term The term electric power qualityelectric power quality broadly broadly refers to maintaining a near sinusoidal power refers to maintaining a near sinusoidal power distribution bus voltage at rated magnitude distribution bus voltage at rated magnitude and frequency. and frequency. In addition, the energy supplied to a In addition, the energy supplied to a customer must be customer must be uninterrupteduninterrupted from the from the reliability point of view. reliability point of view. It is to be noted that even though power It is to be noted that even though power quality (PQ) is mainly a distribution system quality (PQ) is mainly a distribution system problem, power transmission systems may problem, power transmission systems may also have an impact on the quality of power. also have an impact on the quality of power.

Uninterrupted power supply

19.5021956112619P V V N L, Meerut
Uttar Pradesh12.2015335125720Ajmer, V V N Ltd
Rajasthan13.661184786706UHBVN Ltd
13.92956368698DHBVN Ltd, Hissar
HARYANAB/A*100BA
failure rate in %during the year
TransformerTransformers FailedTransformers Installed
DistributionNo. of DistributionNo. of DistributionState/ Utility
DT Failure rate of SEBs / Power Utilities-2005-06

13.91196114097North Eastern Supply Co of Orissa Ltd,
Orrisa23.35632427089
Chamundi Electric Supply Co.Ltd.
Andhra Pradesh21.241244958589
MP Madhya KVVCo,Bhopal
16.7830191179881Madhya PradeshB/A*100BA
failure rate in %during the year
TransformerTransformers FailedTransformers Installed
DistributionNo. of DistributionNo. of DistributionState/ Utility
DT Failure rate of SEBs / Power Utilities-2005-06

12.42 %WESCO8.00 %CESCO13.91 %NESCO8.41 %SOUTHCOORISSA9
7.32 %6.05%NPCLUTTAR PRADESH
81.23 %1.06%BEST7
0.39 %1.5%RELIANCE ENERGY
MAHARASHTRA
60.55 %0.33%BYPL50.12 %NABRPL41.3 %5.31%NDPLDELHI3
2.11 %2.13%TORRENT POWER AEC
2
0.44 %0.66%TORRENT POWER SEC
GUJARAT12005-062004-05UTILITYSTATESL. NO.
DISTRIBUTION TRANSFORMERS FAILURE RATE OF PRIVATE DISCOMS

99.8899.9606:4802:4221CESCKolkata
99.9999.9900:2000:2043Rel.EnergyMumbai
99.9099.7902:2502:2648Torrent Power SECSurat
99.9299.9101:5101:5144Torrent Power AECAhmedabad
99.0698.8801:0501:387660BRPLDelhi(West & South)
99.1198.801:0101:337768BYPLDelhi(East & Central)
99.8599.4301:2201:551026NDPLDelhi(NDPLArea)
2005-06
2004-05
2005-06
2004-05
2005-06
2004-05
Feeder Reliability
Average Duration of an
Outage (hh:mm)
No of Outages per feeder
Utility
State Capital/Urba
n area
Reliability of 11 kV feeders

Feeder Reliability
100XABA −
Where A = No of feeders x24x60xNo of days in a month
B = Outage duration in minutes

98.2900:49WBSEBHowrah
71.1401:48Noida Power Company Ltd.
Greater Noida
99.7499.800:1300:1TNEBChennai
97.1599.5100:5800:28PSEBAmritsar
99.5800:45Megh.SEBShillong
99.9000:11MPPo.K V VCOJabalpur
99.6600:26BESCOMBangalore
99.4799.500:1900:22CPDCL Hyderabad
2005-062004-05
2005-06
2004-05
Feeder Reliability
Average Duration of an Outage (hh:mm)
Utility
State Capital/Urb
an Agglomerat
ion
Reliability of 11 kV feeders

RELIABILITY INDICESSAIDI (System Average Interruption Duration Index)
SAIDI is more commonly known as “Average customer minutes off supply” and is generally reported over a one-year period. It is the total of interruption durations in minutes per customer per year experienced by customers for both planned and unplanned interruptions. A SAIDI of 200 minutes means that customers connected to the feeder or supply area, being measured, experience an average 200 minutes off supply in 12 months.
SAIFI (System Average Interruption Frequency Index)
SAIFI is a measure of how often an average customer loses supply during one year. A SAIFI of 3 means that the average customers connected to the feeder or supply area being measured on average lost supply thrice during the past 12 months.

SAIDI as reported by TNB (Malaysia)

SAIFI trend as reported by KEPCO (Korea)

Power quality

Power quality variationsPower quality variationsPower quality variations are classified as Power quality variations are classified as either either disturbancesdisturbances or or steady state steady state variationsvariations. . Disturbances pertain to abnormalities in Disturbances pertain to abnormalities in the system voltages or currents due to the system voltages or currents due to fault or some abnormal operations. fault or some abnormal operations. Steady state variations refer to Steady state variations refer to rmsrmsdeviations from the nominal quantities or deviations from the nominal quantities or harmonics. harmonics.

Common Manifestations of Power quality
Harmonics - current & voltage distortionsFrequency - under & over frequenciesSteady state voltages - under & over voltagesUnbalanceTransientsSags & SwellsFlickerNotching

Harmonic Levels observed in India
The following maximum harmonics have been observed in the case of some consumers Consumer Maximum % THDRailway traction 22.43Cement industry 6.50Casting plants 7.79Chemical plants 4.5

Typical harmonics in electronic devices
8185090Current
77.315.71.8VoltageMotorEnergy controllers
30446580Current
0.151.20.91VoltageChokes
892170Current
12212665VoltageFanRegulator
9th & above
7th5th3rd
Harmonic Content %Device (Electronic)

Frequency variation
A supplier shall not permit the frequency of an A.C. supply to vary from the declared frequency by more than 3%. As per IE rule 55, a power frequency variation of 50+ - 1.5 Hz is permissibleActual variations from April 2006-March2007 have been as under :
Max MinNorthern region - 51.24 48.01Western region 50.83 48.51Southern region 50.96 48.33Eastern region 51.57 48.27

Voltage variationsSteady State voltage limits In the case of Low Voltage, +6% and –6%; In the case of High Voltage, +6% and
-9%In the case of Extra High Voltage,
+10% and –12.5%Generally voltage varies much beyond the above-specified limits – as low as 150 volts at some places

Voltage unbalance
Voltage unbalance is a result of the unequal loading on the three phases of the transformer or feeder It has been observed that due to unbalance the current in the neutral is very high Utilities are specifying higher size of neutral
core - equal to that of the phase currentsThis flow of current in neutral is resulting in
increased losses and poor voltages

Result of actual monitoring in Delhi of unbalance
NEDO a Japanese company had carried out a study in Delhi. The results are as under:2 sets of 1000 kVA installed in a SubstationTotal consumption in 2 days-2905.7 kwh i.e 60.53 kwh per hrLoss as a result of measuring N phase current -539.5 kwh i.e 11.24 kwh per hrAnnual loss-18.6*24*260=97110 kwh per yearLoss in terms of amount @ Rs.3 per unit=291,330 per year
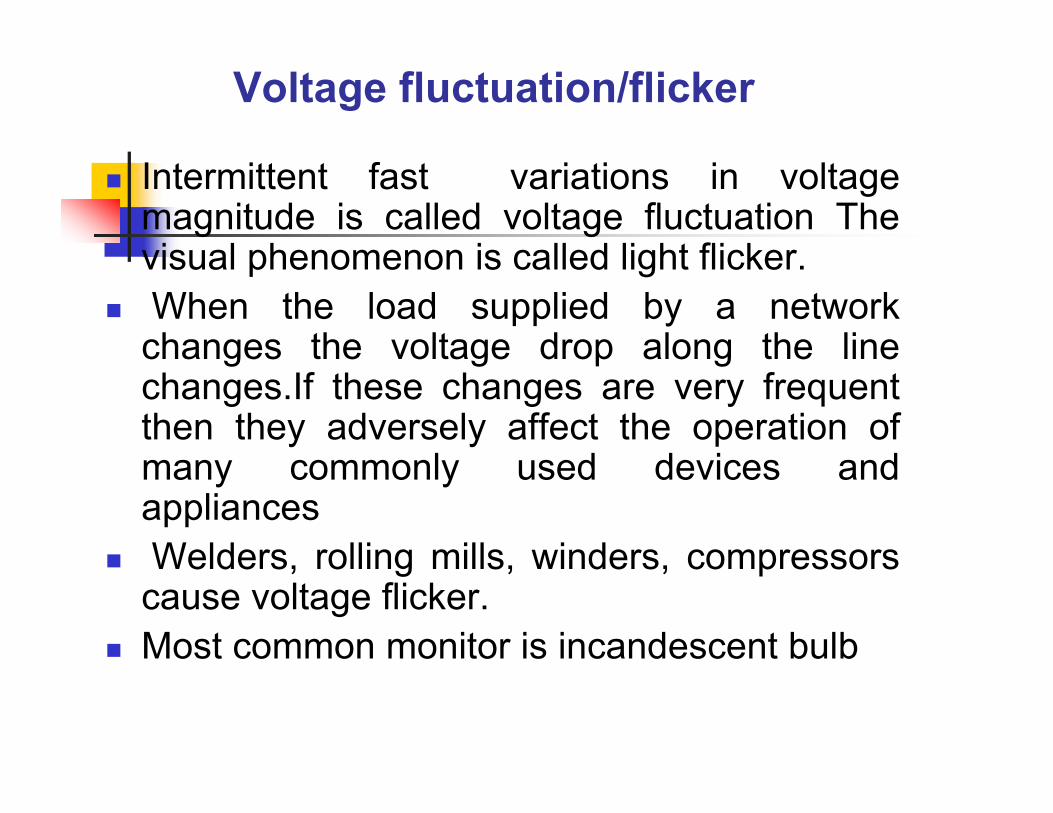
Voltage fluctuation/flicker
Intermittent fast variations in voltage magnitude is called voltage fluctuation The visual phenomenon is called light flicker. When the load supplied by a network changes the voltage drop along the line changes.If these changes are very frequent then they adversely affect the operation of many commonly used devices and appliances Welders, rolling mills, winders, compressors cause voltage flicker.Most common monitor is incandescent bulb
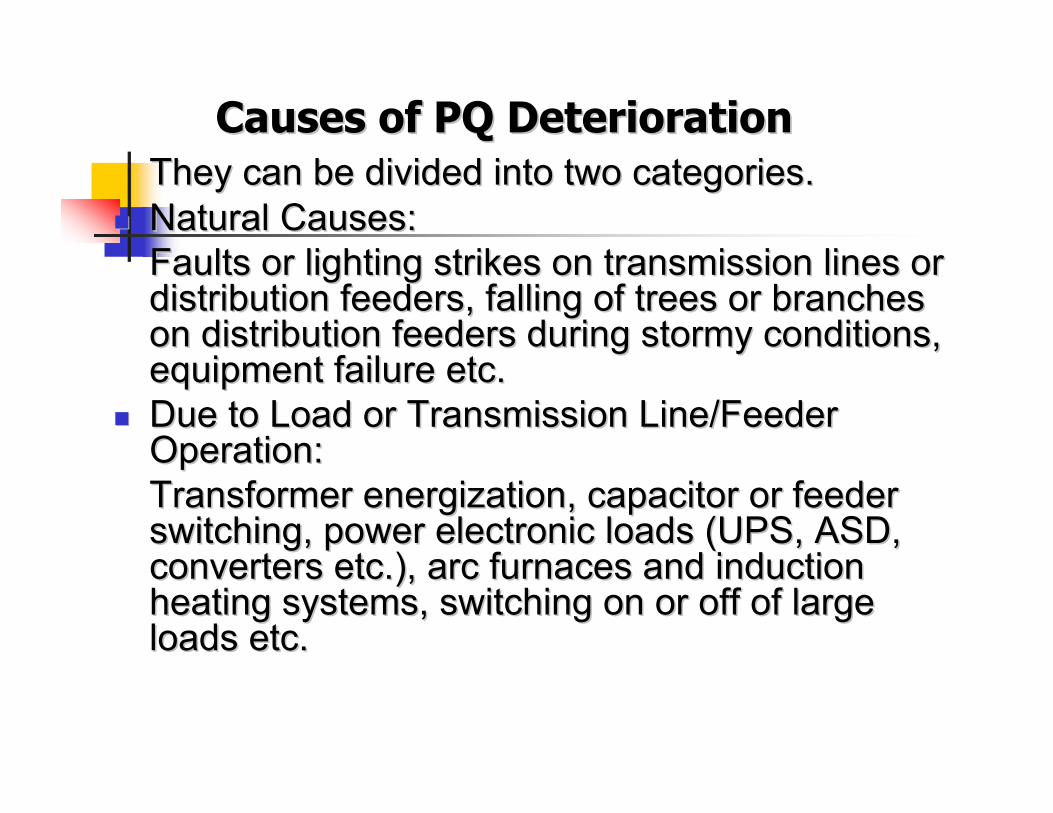
Causes of PQ DeteriorationCauses of PQ DeteriorationThey can be divided into two categories. They can be divided into two categories. Natural Causes: Natural Causes: Faults or lighting strikes on transmission lines or Faults or lighting strikes on transmission lines or distribution feeders, falling of trees or branches distribution feeders, falling of trees or branches on distribution feeders during stormy conditions, on distribution feeders during stormy conditions, equipment failure etc.equipment failure etc.Due to Load or Transmission Line/Feeder Due to Load or Transmission Line/Feeder Operation: Operation: Transformer Transformer energizationenergization, capacitor or feeder , capacitor or feeder switching, power electronic loads (UPS, ASD, switching, power electronic loads (UPS, ASD, converters etc.), arc furnaces and induction converters etc.), arc furnaces and induction heating systems, switching on or off of large heating systems, switching on or off of large loads etc.loads etc.

Power Quality Monitoring-Benefits
Prioritizing system improvementsIdentifying problem conditionsEnhanced quality of delivery
Formulation of RegulationsFormulation of Standards

PQ MonitoringPQ Monitoring-- DevicesDevices
Power quality variations are monitored by Power quality variations are monitored by disturbance analyzers, voltage recorders, disturbance analyzers, voltage recorders, harmonic analyzers etc.harmonic analyzers etc.The input data for any power quality The input data for any power quality monitoring device is obtained through monitoring device is obtained through transducers like CT, PT, Halltransducers like CT, PT, Hall--effect effect transducers etc.transducers etc.Disturbance analyzers and disturbance Disturbance analyzers and disturbance monitors are instruments that are monitors are instruments that are specifically designed for power quality specifically designed for power quality measurements.measurements.

PQ MonitoringPQ Monitoring-- Power quality Power quality analysersanalysers (voltage)(voltage)
There are two categories of these devices There are two categories of these devices −− conventional conventional analyzers and graphicsanalyzers and graphics--based analyzers. based analyzers. Conventional analyzers provide information like Conventional analyzers provide information like magnitude and duration of sag/swells, under/ over magnitude and duration of sag/swells, under/ over voltages etc.voltages etc.GraphicGraphic--based analyzers are equipped with memory based analyzers are equipped with memory such that the realsuch that the real--time data can be saved. time data can be saved. The advantage of this device is that the saved data can The advantage of this device is that the saved data can be analyzed later to determine the source and cause of be analyzed later to determine the source and cause of the power quality problems. the power quality problems. These analyzers can also graphically present the realThese analyzers can also graphically present the real--time data.time data.

PQ MonitoringPQ Monitoring-- Harmonic Harmonic analyseranalyser
Harmonic data are analyzed with the help Harmonic data are analyzed with the help of Digital Signal Processing (DSP)of Digital Signal Processing (DSP)--based based harmonic or spectrum analyzers. They can harmonic or spectrum analyzers. They can perform fast Fourier transform (FFT) by perform fast Fourier transform (FFT) by sampling realsampling real--time data.time data.These analyzers can simultaneously These analyzers can simultaneously measure the voltage and currents such measure the voltage and currents such that harmonic power can be computed.that harmonic power can be computed.They can also sample the signals at a very They can also sample the signals at a very high rate such that harmonics up to about high rate such that harmonics up to about 5050thth order can be determined.order can be determined.

PQ Monitoring PQ Monitoring –– Flicker analysis Flicker analysis
Flicker monitoring is done through IEC Flicker monitoring is done through IEC flicker meter. flicker meter. These meters measure the instantaneous These meters measure the instantaneous flickering voltage. This is called the flickering voltage. This is called the instantaneous flicker level (IFL). instantaneous flicker level (IFL). The recorded IFL is then stored and The recorded IFL is then stored and statistical operations on these data are statistical operations on these data are performed to determine short term (10 performed to determine short term (10 min) flicker severity index and long term min) flicker severity index and long term flicker severity index. flicker severity index.

Utility control of power quality
Installing Mitigation EquipmentUninterruptible power supplies (UPS)Use of Motor generator sets Voltage source converters (VSCs) Dynamic voltage restorerHarmonic mitigation equipmentPower System DesignIsolation transformerLine reactorsHarmonic filters

Utility control of power reliability
Reducing the number of faultsReducing the fault clearing timeImplementing Changes in the power Distribution system

Measures to reduce flickering
An increase of power supply transformer capacitySegregating varying load and steady
load consumersIncrease of equivalent three phase
short circuit capacity of the system through insertion of series capacitors

Standards for power quality -Grid connectivity standards
Voltage unbalanceThe Voltage Unbalance at 33 kV and above shall
not exceed 3.0% Harmonic distortionThe total harmonic distortion at 33 kV and above shall not exceed 3% with no individual harmonic higher than 2.5%.Voltage Fluctuations. -(i) The permissible limit of voltage fluctuation for step changes which may occur repetitively is 1.5%. (ii) For occasional fluctuations other than step changes the maximum permissible limit is 3%

Thank You !