QUALITY CONTROL DUPLICATE · 2018-12-06 · QUALITY CONTROL DUPLICATE Analytical Service, Inc. -...
19
QUALITY CONTROL DUPLICATE Analytical Service, Inc. - Duplicate of QC Sample EPA Method TO-15 SIM GClMS Analytical Method: TO15 SIM Dup File: QCO5196B.D Description: ST-071 105-2 Cannube#: QC-Batch: 051906MS3 SDG: LABQC CAS# Compound PP~V PP~V %D % '=Out 75-01-4 Vlnvl chloride 0.110 0.108 2 30 7535-4 l.l:~lchloroethene 0.082 0.075 7 30 156-59-2 cis-l,2-Dlchloroethene 0.114 0.122 8 30 79-01-6 Trlchloroethene 0.107 0.115 8 30 127-18-4 Tetrachloroethene 0.116 0.119 3 30 QC05196B.MS3 Printed on 5/22/2006 Envlronmental Analytical Service Page 1 of 1
Transcript of QUALITY CONTROL DUPLICATE · 2018-12-06 · QUALITY CONTROL DUPLICATE Analytical Service, Inc. -...
QUALITY CONTROL DUPLICATE Analy t ica l Serv ice , Inc.
-
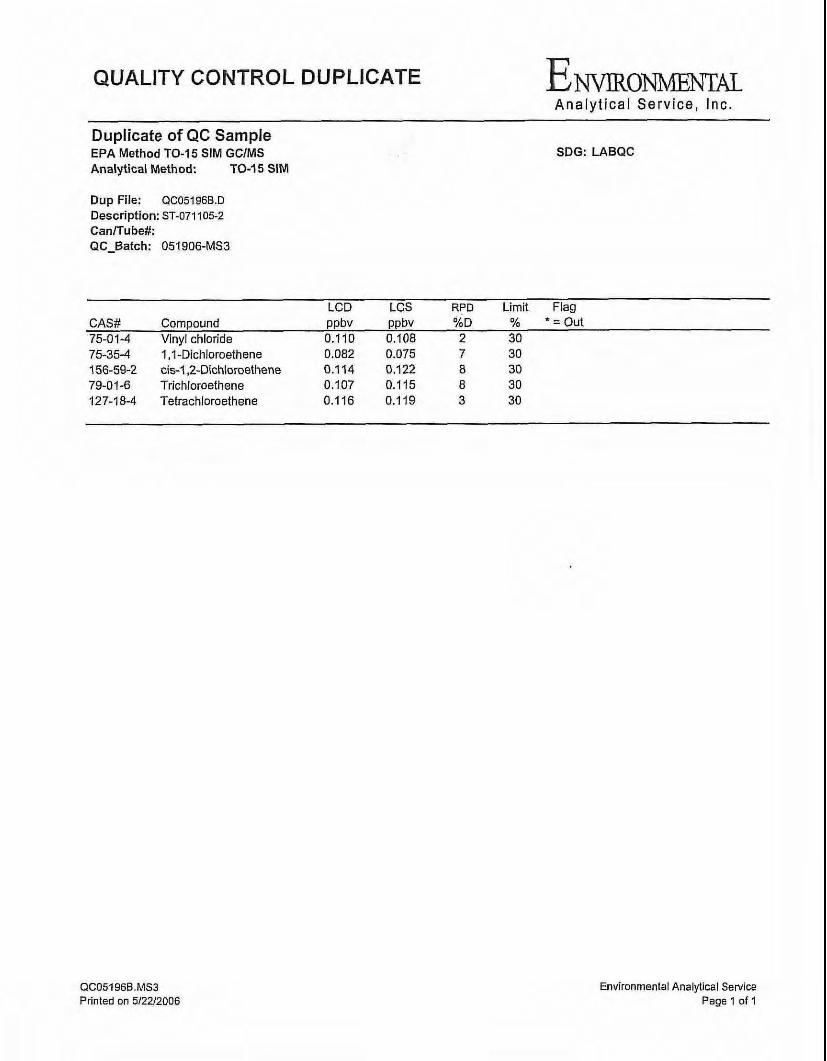
Duplicate of QC Sample EPA Method TO-15 SIM GClMS Analytical Method: TO15 SIM
Dup File: QCO5196B.D Description: ST-071 105-2 Cannube#: QC-Batch: 051906MS3
SDG: LABQC
CAS# Compound P P ~ V P P ~ V %D % '=Out 75-01-4 Vlnvl chloride 0.110 0.108 2 30 7535-4 l.l:~lchloroethene 0.082 0.075 7 30 156-59-2 cis-l,2-Dlchloroethene 0.114 0.122 8 30 79-01-6 Trlchloroethene 0.107 0.115 8 30 127-18-4 Tetrachloroethene 0.116 0.119 3 30
QC05196B.MS3 Printed on 5/22/2006
Envlronmental Analytical Service Page 1 of 1
QUALITY CONTROL REPORT A n a l y t i c a l Serv ice , Inc.
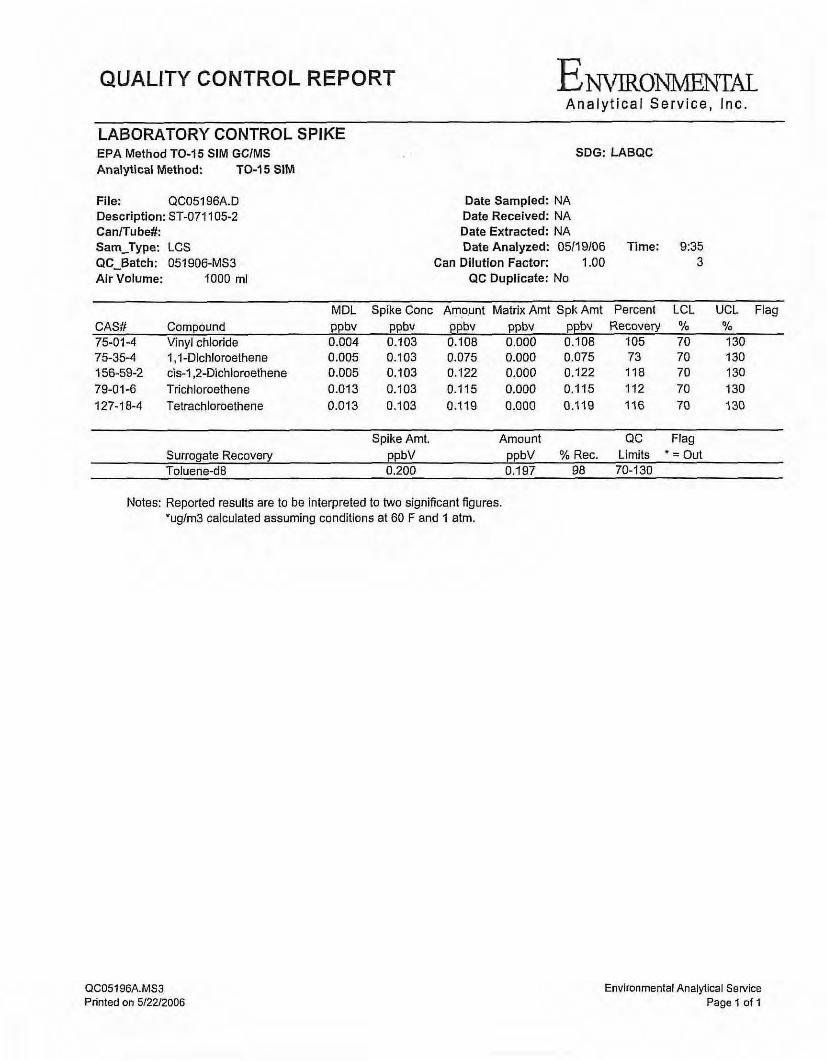
LABORATORY CONTROL SPIKE EPA Method TO-15 SIM GCIMS SDG: LABQC Analytical Method: TO-1 5 SIM
File: QC05196A.D Date Sampled: NA Description: ST-071 105-2 Date Received: NA CanlTubdf: Date Extracted: NA Sam-Type: LCS Date Analyzed: 05119106 Time: 9.35 QC-Batch: 051906-MS3 Can Dilution Factor: 1 .OO 3 Alr Volume: 1000 ml QC Duplicate: No
MDL Spike Conc Amount Matrix Amt Spk Amt Percent LCL UCL Flag CAS# Compound P P ~ V P P ~ V ppbv ppbv ppbv Recovely % % 75-01-4 Vinyl chloride 0.004 0.103 0.108 0000 0.108 105 70 130 75-35-4 1,l-Dichloroethene 0.005 0.103 0.075 0.000 0 075 73 70 130 156-59-2 cisl,2-D~chlomethene 0.005 0.103 0.122 0.000 0.122 118 70 130 79-01-6 Trichloroethene 0.013 0.103 0.115 0.000 0.115 112 70 130 127-18-4 Tetrachloroethene 0.013 0.103 0.119 0.000 0.119 116 70 130
Spike Amt. Amount QC Flag Surrogate Recovery 0 Toluene-d8 0.200 0.197 98 70-130
Notes: Reported results are to be interpreted to two significant figures. 'uglm3 calculated assuming conditions at 60 F and 1 atm.
QC05196A.MS3 Printed on 5/2212006
Environmental Analyllcal Service Page 1 of 1
QUALITY CONTROL REPORT Ana ly t l ca l Serv ice , Inc.
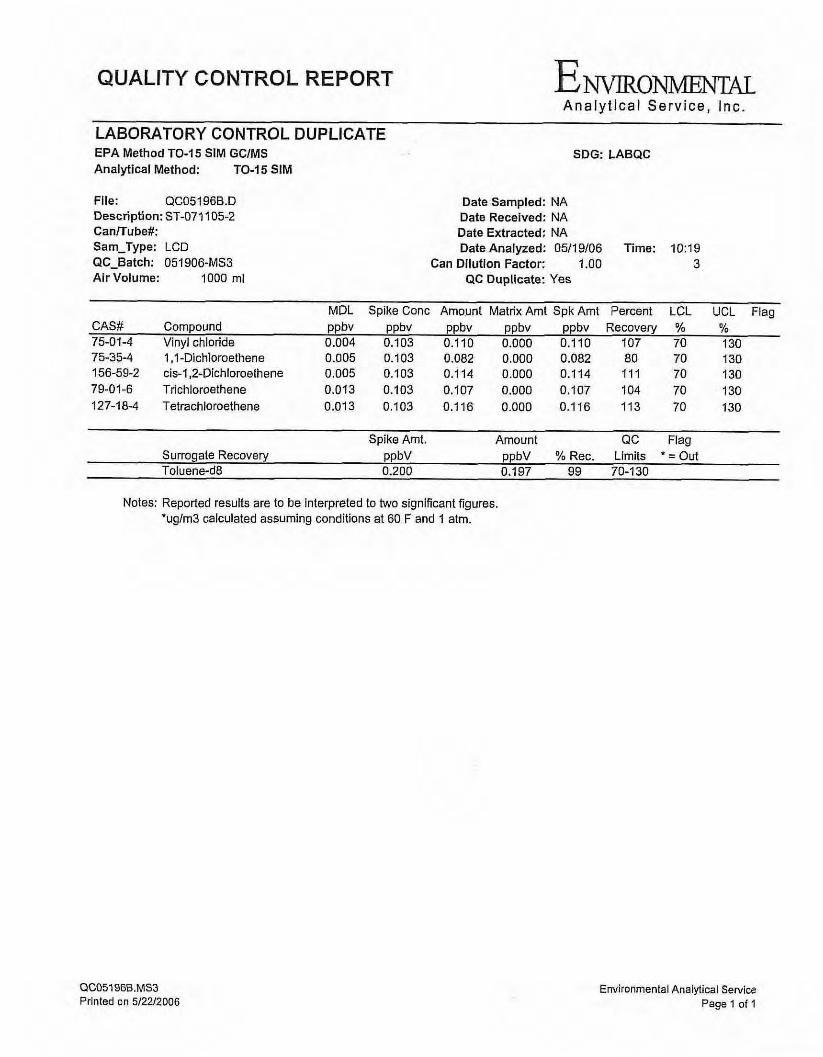
LABORATORY CONTROL DUPLICATE EPA Method TO-15 SIM GClMS SDG: LABQC Analytical Method: TO-15 SIM
Flle: QCO5196B.D Date Sampled: NA Description: ST-071 105-2 Date Received: NA Canmube#: Date Extracted: NA Sam-Type: LCD Date Analyzed: 05/19/06 Time: 10:19 QC-Batch: 051906-MS3 Can Dilution Factor: 1.00 3 Air Volume: 1000 ml QC Duplicate: Yes
MDL Spike Conc Amount Matrix Amt Spk Amt Percent LCL UCL Flag GAS# Compound P bv 75-01-4 Vinyl chloride 0.004 0.103 0.110 0.000 0.110 107 70 130 75-354 1 ,I-Dichloroethene 0.005 0.103 0.082 0.000 0.082 80 70 130 156-59-2 cis-l,2-Dichloroethene 0.005 0.103 0.114 0.000 0.114 111 70 130 79-01-6 Trlchloroethene 0.013 0.103 0.107 0.000 0.107 104 70 1 30 127-18-4 Tetmchloroethene 0.013 0.103 0.116 0.000 0.116 113 70 130
Spike Amt. Amount C Flag Surrogate Recovery P P ~ V ppbV % Rec. Limits ' = Out Toluene-d8 0.200 0.197 99 70-130
Notes: Reported results are to be interpreted to two significant figures. 'ugIm3 calculated assuming conditions at 60 F and 1 a h .
QC05196B.MS3 Printed on 5/22/2006
Environmental Analytical Service Page 1 of 1
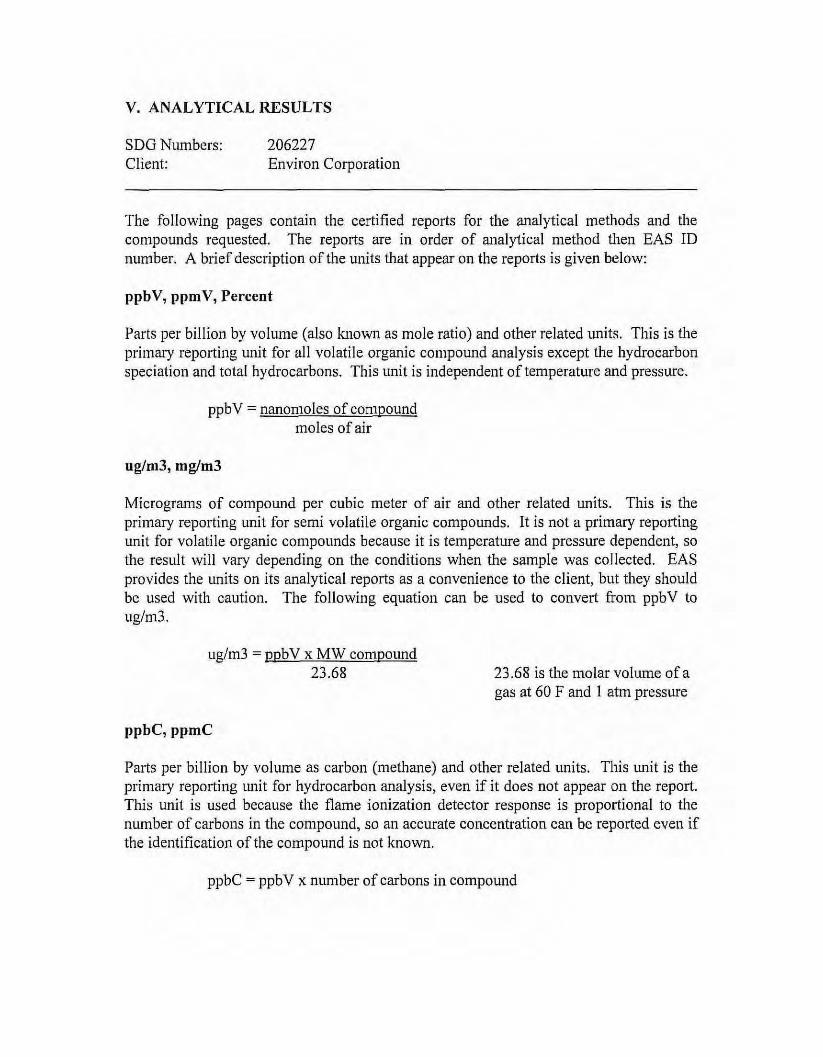
V. ANALYTICAL RESULTS
SDG Numbers: 206227 Client: Environ Corporation
The following pages contain the certified reports for the analytical methods and the compounds requested. The reports are in order of analytical method then EAS ID number. A brief description of the units that appear on the reports is given below:
ppbV, ppmV, Percent
Parts per billion by volume (also known as mole ratio) and other related units, This is the primary reporting unit for all volatile organic compound analysis except the hydrocarbon speciation and total hydrocarbons. This unit is independent of temperature and pressure.
ppbV = nanomoles of compound moles of air
Micrograms of compound per cubic meter of air and other related units. This is the primary reporting unit for semi volatile organic compounds. It is not a primary reporting unit for volatile organic conlpounds because it is tempera- and pressure dependent, so the result will vary depending on the conditions when the sample was collected. EAS provides the units on its analytical reports as a convenience to the client, but they should be used with caution. The following equation can be used to convert from ppbV to ug/m3.
ugIm3 = ppbV x MW compound 23.68 23.68 is the molar volume of a
gas at 60 F and 1 atm pressure
Parts per billion by volume as carbon (methane) and other related units. This unit is the primary reporting unit for hydrocarbon analysis, even if it does not appear on the report. This unit is used because the flame ionization detector response is proportional to the number of carbons in the compound, so an accurate concentration can be reported even if the identification of the compound is not known.
ppbC = ppbV x number of carbons in compound

ANALYTICAL REPORT Ana ly t i ca l Serv ice, Inc .
EPA Method TO-I5 SIM GChlS Analytical Method: TO-15 SIM
File: 0622701A.D Description: IAQ-HS-OUT3-51206 Canmube#: 648 Sam-Type: SA QC-Batch: 051806-MS1 Air Volume: 630 mi
SDG: 206227 Laboratory Number: 01
Date Sampled: 05/12/06 Time: Date Received: 05/16/06 Date Extracted: Date Analyzed: 0511 8/06 Time: 1258
Can Dilution Factor: 1.66 3 Not Detected Flag: U
MDL RL Amount MDL RL Amount Flag - CAS# Compound P P ~ V P P ~ V ppbv ugh3 ugh3 ugh3 75-01-4 Vinyl chloride 0.011 0.134 0.023 0.028 0.355 0.061 J 75-35-4 1,l-Dlchloroethene 0.013 0.137 0.020 0.054 0.561 0.084 J 156-60-5 trans-l,2-Dichloroethene 0.053 1.159 0.053 0.216 4.746 0.216 U 156-59-2 cis-l,2-Dlchloroethene 0.013 0.137 0.013 0.054 0.561 0.054 U 79-01-6 Trichloroethene 0.034 0.137 0.102 0.189 0.758 0.562 J 127-18-4 Tetrachioroethene 0.034 0.137 0.066 0.240 0.960 0.465 J
Splke Amt. Amount QC Flap - Surrogate Recovery P P ~ V ppbV % Rec. Limits +=Out Toluene-d8 0.200 0.232 116 70-130
Notes: 1) Reported results are to be Interpreted to two significant figures. 2) ugh3 = ppbV'FWl23.68 calculated assuming conditions at 60 F and 1 atm. 3) MDL and RL are adjusted for sample volume and can dilution. 4) U and ND are Flags used for Not Detected 5) J is a flag for a result between the MDL and the RL (or lower quantltation limit, LQL)
Report Flle Name: 20622701.MSl Printed on 5/24/2006
Envhonrnental Analytical Service Page 1 of 1
ANALYTICAL REPORT Analyt ical Service, Inc.
EPA Method TO-1 5 SIM GClMS Analytical Method: TO45 SIM
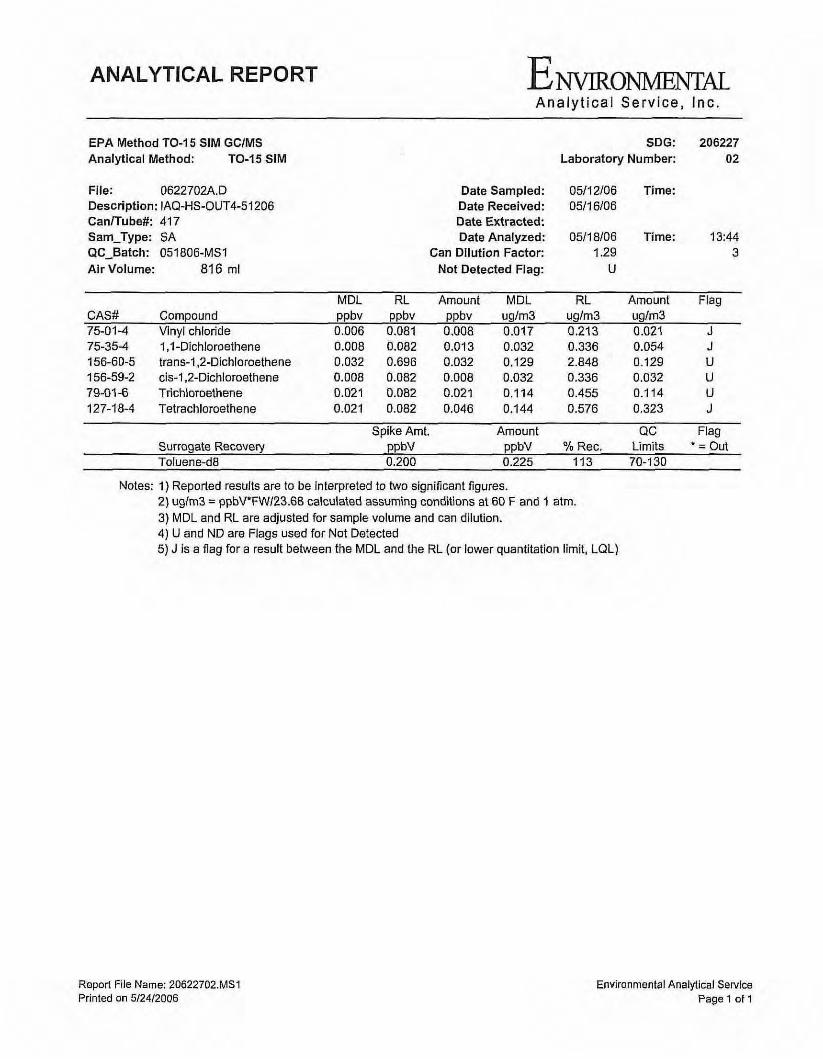
File: 0622702A.D Description: IAQ-HS-OUT4-51206 Canmube#: 417 Sam-Type: 9A QC-Batch: 051806-MS1 Air Volume: 816 ml
SDG: 206227 Laboratory Number: 02
Date Sampled: 05/12/06 Time: Date Received: 0511 6/06 Date Extracted: Date Analyzed: 0511 8/06 Time: 1244
Can Dilution Factor: 1.29 3 Not Detected Flag: U
MDL RL Amount MDL RL Amount Flaq - GAS# Compound ppbv ppbv ppbv ugIm3 ugIm3 uglm3 75014 Vinvl chloride 0.006 0.081 0.008 0.017 0.213 0.021 J 75-354 1,l-Dichloroethene 0.008 0.082 0.013 0.032 0.336 0.054 J 156-60-5 trans-1.2-Dichioroethene 0.032 0.696 0.032 0.129 2.848 0.129 U 156-59-2 cis-1.2-Dlchloroethene 0.008 0.082 0.008 0.032 0.336 0.032 U 79-01-6 Trichloroethene 0.021 0.082 0.021 0.114 0.455 0.114 U 127-18-4 Tetrachloroethene 0.021 0.082 0.046 0.144 0.576 0.323 J
Spike Amt. Amount QC Flag Surrogate Recovey P P ~ V ppbV % Rec, Limits '=Out Toluene-d8 0.200 0.225 113 70-1 30
Notes: 1) Reported results are to be Interpreted to two significant figures. 2) uglm3 = ppbV'FW123.68 calculated assuming conditions at 60 F and 1 atm. 3) MDL and RL are adjusted for sample volume and can dilution. 4) U and NO are Flags used for Not Detected 5) J is a flag for a result between the MDL and the RL (or lower quantltation limit, LQL)
Report File Name: 20622702.MS1 Printed on 5/24/2006
Environmental Analytical Service Page 1 of 1

ANALYTICAL REPORT A n a l y t i c a l S e r v i c e , Inc .
EPA Method TO-I5 SIM GCIMS Analytical Method: TO-15 SIM
File: 0622703A.D Description: IAQ-HS-22-51206 Canmube#: 754 Sam-Type: SA QC-Batch: 051806-MS1 Air Volume: 655 ml
SDG: 206227 Laboratory Number: 03
Date Sampled: 05112106 Time: Date Received: 05/16/06 Date Extracted: Date Analyzed: 05/18/06 Time: 14:29
Can Dilution Factor: 1.53 3 Not Detected Flag: U
MDL RL Amount MDL RL Amount Flag CAS# Compound ppbv ppbv ppbv u g h 3 u g h 3 uglm3 7501-4 Vinyl chloride 0.009 0.119 0.009 0.025 0.314 0.025 U 75-35-4 I ,I-Dlchlomethene 0.012 0.121 0.015 0.048 0.497 0.060 J 156-60-5 trans-l,2-Dichioroefhene 0.047 1.028 0.047 0.191 4.208 0.191 U 156-592 cls-l,2-Dichloroethene 0.012 0.121 0.012 0.048 0.497 0.048 U 79-01-6 Trichloroethene 0.030 0.121 0.038 0.168 0.672 0.210 J 127-18-4 Tetrachloroethene 0.030 0.121 0.030 0.213 0.851 0.21 3 U
Spike Amt. Amount QC Flaa - Surrogate Recovery P P ~ V ppbV % Rec. Limits * = Out Toluened8 0.200 0.207 103 70-130
Notes: 1) Reported results are to be interpreted to two significant figures. 2) u g h 3 = ppbV'FW123.68 calculated assuming conditions at 60 F and 1 atrn. 3) MDL and RL are adjusted for sample volume and can dilution. 4) U and ND are Flags used for Not Detected 5) J is a flag for a result between the MDL and the RL (or lower quantitation limit. LQL)
Report File Name: 20622703.MSl Printed on 5/24/2006
Envlronmental Analyt~cal Service Page 1 of 1

ANALYTICAL REPORT A n a l y t i c a l S e r v i c e , I n c .
EPA Method TO-15 SIM GClMS Analytical Method: TO-I5 SiM
File: 0622704A.D Description: IAQ-HS-23-51206 CanTTubdf: 56 Sam-Type: SA QC-Batch: 051806-MS1 Airvolume: 675 ml
SDG: 206227 Laboratory Number: 04
Date Sampled: 05/12/06 Time: Date Received: 05/16/06 Date Extracted: Date Analyzed: 0511 6/06 Time: 15:16
Can Dilution Factor: 1.36 3 Not Detected Flag: U
MDL RL Amount MDL RL Amount Flag CAS# Compound ppbv ppbv ppbv ugIm3 u g h 3 u g h 3 75-01-4 Vinvl chloride 0.006 0.103 0.013 0.021 0.271 0.034 J 75-35-4 1,l:~ichioroethene 0.010 0.105 0.012 0.041 0.429 0.047 J 156-60-5 trans-l,2-Dlchloroethene 0.040 0.887 0.040 0.165 3.629 0.165 U 156-59-2 cis-l,2-Dichloroethene 0.010 0.105 0.010 0.041 0.429 0.041 U 79-01-6 Trichloroethene 0.026 0.105 0.026 0.145 0.580 0.145 U 127-18-4 Tetrachloroethene 0.026 0.105 0.051 0.184 0.734 0.361 J
Spike Amt. Amount QC Flag Surrogate Recovery P P ~ V ppbV % Rec. Limits ' = Out Toluene-d8 0.200 0.206 103 70-130
Notes: 1) Reported results are to be interpreted to two significant figures. 2) u g h 3 = ppbV"FWl23.68 calculated assuming conditions at 60 F and 1 atrn. 3) MDL and RL are adjusted for sample volume and can dilution. 4) U and ND are Flags used for Not Detected 5) J is a flag for a result between the MDL and the RL (or lower quantltation limit, LQL)
Report Fils Name: 20622704.MSl Printed on 5/24/2006
Environmental Analytical Servlce Page 1 of 1
ANALYTICAL REPORT Analy t ica l S e r v i c e , Inc.
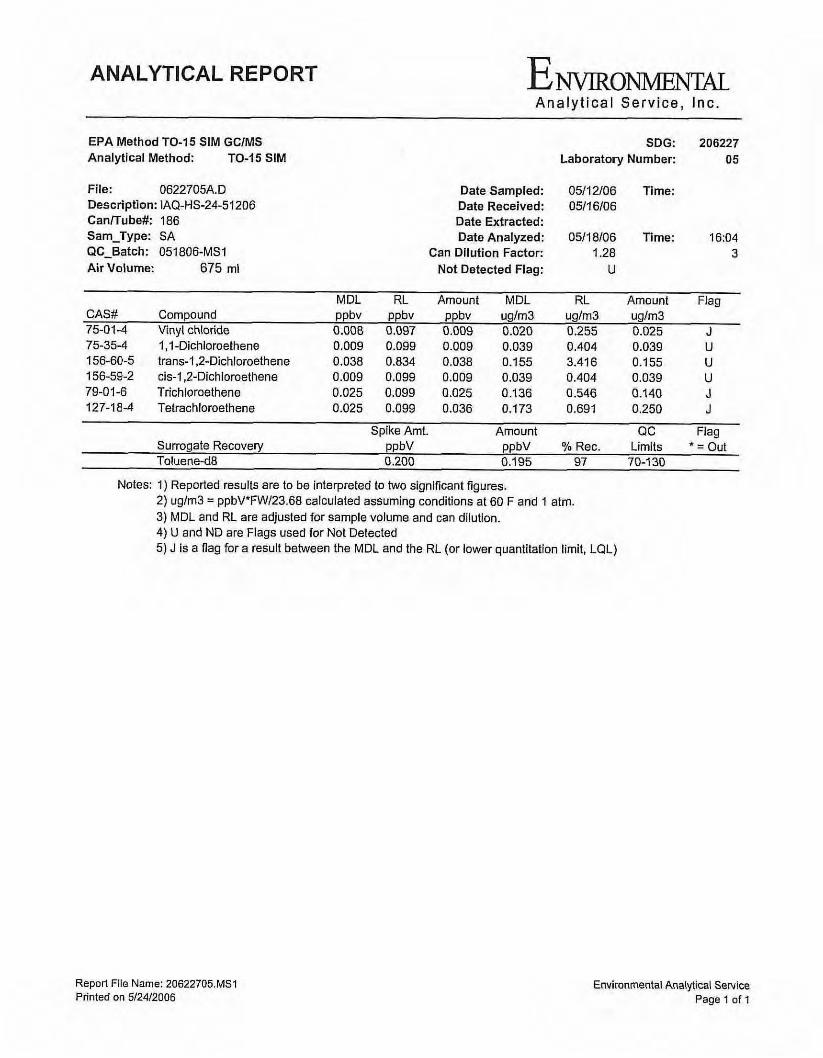
EPA Method TO-I5 SIM GClMS Analytical Method: TO-15 SIM
File: 0622705A.D Description: IAQ-HS-24-51206 Canmube#: 186 Sam-Type: SA QC-Batch: 051806-MS1 Air Volume: 675 ml
SOG: 206227 Laboratory Number: 05
Date Sampled: 05/12/06 Time: Date Received: 05/16/06 Date Extracted: Date Analyzed: 05/18/06 Time: 16:04
Can Dilution Factor: 1.28 3 Not Detected Flag: U
MDL RL Amount MDL RL Amount Flaa CAS# Compound 75-01-4 Vinyl chloride 0.008 0.097 0.009 0.020 0.255 0.025 J 75-35-4 1,l:~ichioroethene 0.009 0.099 0.009 0.039 0.404 0.039 U 156-60-5 trans-12-Dichloroethene 0.038 0.834 0.038 0.155 3.416 0.155 U 156-59-2 cis-l,2-Dichlomethene 0.009 0.099 0.009 0.039 0.404 0.039 U 79-01-6 Trichloroethene 0.025 0.099 0.025 0.136 0.546 0.140 J 127-18-4 Tetrachloroethene 0.025 0.099 0.036 0.173 0.691 0.250 J
Soike Amt. Amount QC Fiao .. Surrogate Recovery P P ~ V ppbV % Rec. Limits ' = Out Toluened8 0.200 0.195 97 70-1 30
Notes: 1) Reported results are to be interpreted to two significant figures. 2) ug/rn3 = ppbV'FWl23.68 calculated assuming conditions at 60 F and 1 atm. 3) MDL and RL are adjusted for sample volume and can dilution. 4) U and ND are Flags used for Not Delected 5) J is a flag for a result between the MDL and the RL (or lower quantitation limit, LQL)
Report Flle Name: 20622705.MSl Printed on 5/24/2006
Environmental Analytical S e ~ i c e Page 1 of 1
ANALYTICAL REPORT Analyt ical Service, Inc.
EPA Method TO-15 SIM GCIMS Analytical Method: TO-15 SIM
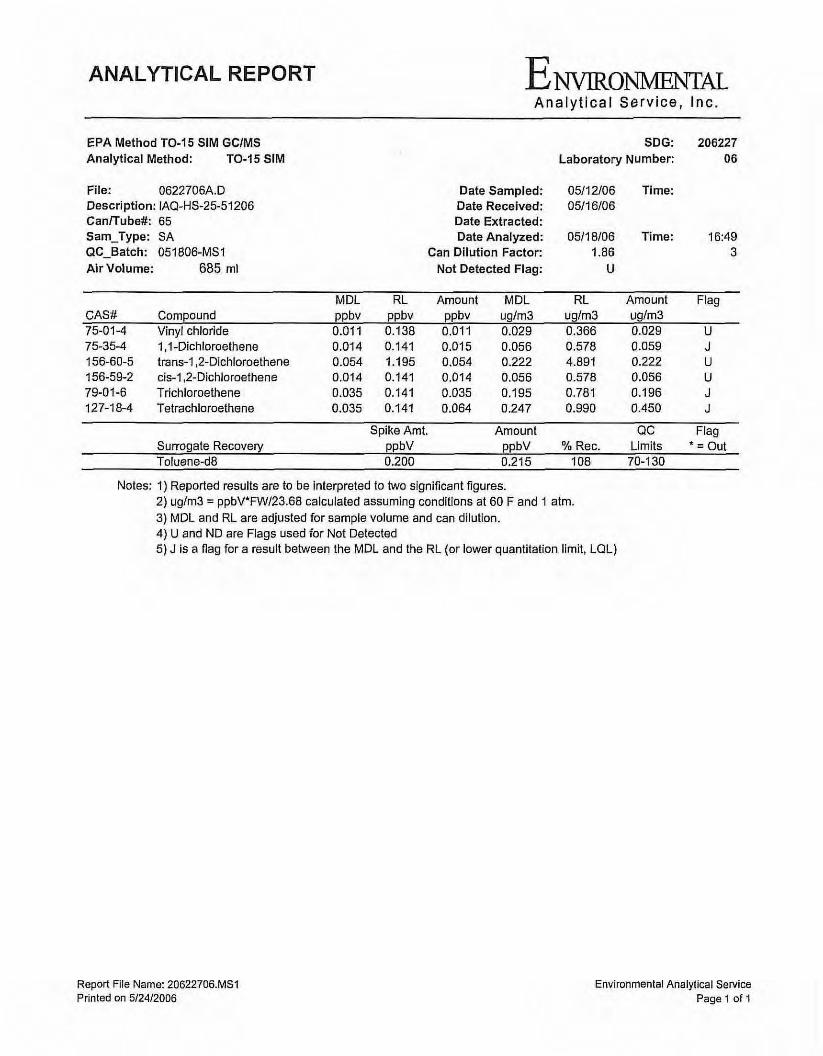
File: 0622706A.D Description: IAQ-HS-25-51206 Cannube#: 65 Sam-Type: SA QC-Batch: 051806-MS1 Air Volume: 685 ml
SDG: 206227 Laboratory Number: 06
Date Sampled: 05/12/06 Time: Date Received: 05/16/06 Date Extracted: Date Analyzed: 05/18/06 Time: 16:49
Can Dilution Factor: 1.86 3 Not Detected Flag: U
MDL RL Amount MDL RL Amount Flag . GAS# Compound P P ~ V P P ~ V ppbv u g h 3 ug/m3 ugIm3 75-01-4 Vinyl chloride 0.011 0.138 0.011 0.029 0.366 0.029 U 75-35-4 1.l:~ichloroethene 0.014 0.141 0.015 0.056 0.578 0.059 J 156-60-5 trans-l,2-Dichloroethene 0.054 1.195 0.054 0.222 4.891 0.222 U 156-59-2 cis-I ,2-Dichloroethene 0.014 0.141 0.014 0.056 0.578 0.056 U 79-01-6 Trichloroethene 0.035 0.141 0.035 0.195 0.781 0.196 J 127-184 Tetrachloroethene 0.035 0.141 0.064 0.247 0.990 0.450 J
Spike Amt. Amount QC Flag Surrogate Recovery P P ~ V ppbV % Rec. Llmits ' = Out ToluenedB 0.200 0.215 108 70-1 30
Notes: 1) Reported results are to be interpreted to two significant figures. 2) u g h 3 = ppbV'FWl23.68 calculated assuming conditions at 60 F and I atrn. 3) MDL and RL are adjusted for sample volume and can dilution. 4) U and ND are Flags used for Not Detected 5) J is a flag for a result between the MDL and the R t (or lower quantitation limit, LQL)
Report File Name: 20622706.MS1 Printed on 5/24/2006
Environmental Analyfical Service Page 1 of 1

ANALYTICAL REPORT ENVIRONMENTAL Analyt ical Serv ice , Inc.
EPA Method TO-15 SIM GCIMS Analytical Method: TO-15 SIM
File: 0622707A.D Description: IAQ-HS-2651206 Canmube#: 179 Sam-Type: SA QC-Batch: 051806MS1 Air Volume: 668 mi
SDG: 206227 Laboratory Number: 07
Date Sampled: 05/12/06 Time: Date Received: 05/16/06 Date Extracted: Date Analyzed: 05/18/06 Time: 17:40
Can Dilution Factor: 1.97 3 Not Detected Flag: U
MDL RL Amount MDL RL Amount Flag CAS# Com ound 75-01-4 Vinyl chloride 0.012 0.150 0.012 0.031 0.397 0.031 U 75-35-4 I ,1-Dlchloroethene 0.015 0.153 0.015 0.060 0.628 0.060 U 156-60-5 trans-1.2-Dichloroethene 0.059 1.298 0.059 0.241 5.312 0.241 U 156-59-2 cis-l,2-Dichloroethene 0.015 0.153 0.015 0.060 0.628 0.060 U 79-01-6 Trichloroethene 0.038 0.153 0.089 0.212 0.848 0.495 J 127-18-4 Tetmchloroethene 0.038 0.153 0.067 0.269 1.075 0.470 J
Spike Amt. Amount QC Flag Surrogate Recovery P P ~ V ppbV % Rec. Limits ' = Out Toluene-dB 0.200 0.202 101 70-130
Notes: 1) Reported results are to be interpreted to two significant figures. 2) ugh3 = ppbV'FWl23.68 calculated assuming conditions at 60 F and 1 atm. 3) MDL and RL are adjusted for sample volume and can dilution. 4) U and ND are Flags used for Not Detected 5) J is a flag for a result between the MDL and the RL (or lower quantitatlon limit, LQL)
Report Fie Name: 20622707.MS1 Printed on 5/24/2006
Environmental Analytical Service Page 1 of 1
ANALYTICAL REPORT A n a l y t i c a l Serv ice, Inc .
EPA Method TO-15 SIM GCIMS Analytical Method: TO-15 SIM
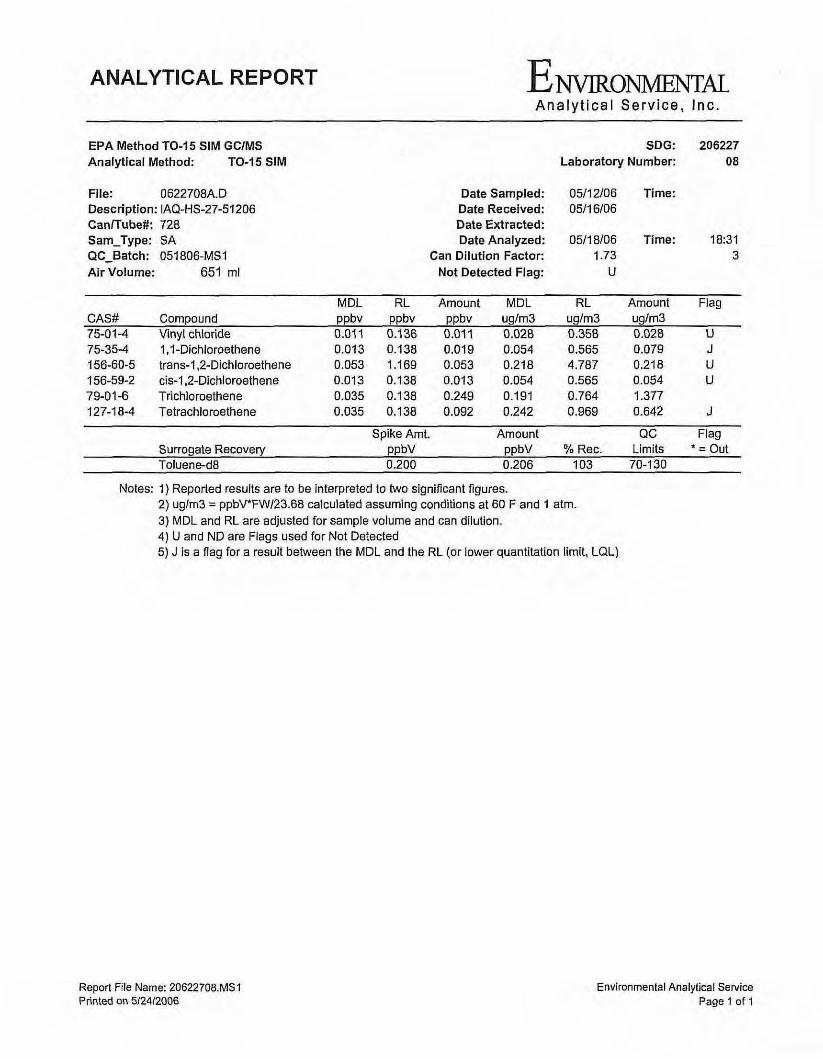
File: 0622708A.D Description: IAQ-HS-27-51206 Can/Tube#. 728 Sam-Type: SA QC-Batch: 051806-MS1 Air Volume: 651 ml
SDG: 206227 Laboratory Number: 08
Date Sampled: 05/12/06 Tlrne: Date Received: 0511 6/06 Date Extracted: Date Analyzed: 05/18/06 Time: 18:31
Can Dilution Factor: 1.73 3 Not Detected Flag: U
MDL RL Amount MDL RL Amount Flag CAS# Compound ppbv ppbv ppbv ugh3 ug/m3 ugh3 75-01-4 Vinyl chloride 0.011 0.136 0.011 0.028 0.358 0.028 U 75-35-4 1,l~~ichloroethene 0.013 0.138 0.019 0.054 0.565 0.079 J 156-60-5 trans-1.2-Dichloroethene 0.053 1.169 0.053 0.216 4.787 0.218 U 156-59-2 cis-l,2-Dichloroethene 0.013 0.138 0.013 0.054 0.565 0.054 U 79-01-6 Trichloroethene 0.035 0.138 0.249 0.191 0.764 1.377 127-18-4 Tetrachlomethene 0.035 0.136 0.092 0.242 0.969 0.642 J
Spike Amt. Amount QC Flag Surrogate Recovery P P ~ V ppbV % Rec. Limits * = Out Toluene-d8 0.200 0.206 103 70-1 30
Notes: 1) Reported results are to be interpreted to two significant figures. 2) ugh3 = ppbVFW123.68 calculated assuming conditions at 60 F and 1 atm. 3) MDL and RL are adjusted for sample volume and can dilution. 4) U and ND are Flags used for Not Detected 5) J is a flag for a result between the MDL and the RL (or lower quantitation limit. LQL)
Report File Name: 20622708.MS1 Printed on 5/24/2006
Environmental Analytical Service Page 1 of 1

ANALYTICAL REPORT Ana ly t i ca l Serv ice, Inc.
EPA Method TO-15 SIM GClMS Analytical Method: TO-15 SIM
File: 0622709A.D Description: IAQ-HS-28-51206 Cannube#: 790 Sam-Type: SA PC-Batch: 051806-MS1 Air Volume: 653 mi
SDG: 206227 Laboratory Number: 09
Date Sampled: 05/12/06 Time: Date Received: 05/16/06 Date Extracted: Date Analyzed: 05/18/06 Time: 19:38
Can Dilution Factor: 1.66 3 Not Detected Flag: U
MDL RL Amount MDL RL Amount Flao - CAS# Compound ppbv ppbv ppbv ugh3 ugh3 ugh3 75-01-4 Vinvl chloride 0.010 0.130 0.010 0.027 0.342 0.027 U 75-354 1.1-Dichloroethene 0.013 0.132 0.017 0.052 0.541 0.069 J 156-60-5 trans-l,2-Dichioroethene 0.051 1.119 0.051 0.208 4.579 0.208 U 156-59-2 cis-1.2-Dichloroethene 0.013 0.132 0.013 0.052 0.541 0.052 U 79-01-6 Trichloroethene 0.033 0.132 0.050 0.183 0.731 0.276 J 127-18-4 Tetrachloroethene 0.033 0.132 0.242 0.232 0.927 1.695
Spike Amt. Amount QC Flag Surro ate Recovely # Toluene48 0.200 0.194 97 70-130
Notes: 1) Reported results are to be interpreted to two significant figures. 2) ugIm3 = ppbV'FWl23.68 calculated assuming conditions at 60 F and 1 atm. 3) MDL and RL are adjusted for sample volume and can dilution. 4) U end ND are Flags used for Not Detected 5) J is a flag for e result between the MDL and the RL (or lower quantitation limit. LQL)
Report File Name: 20622709.MS1 Printed on 5/24/2006
Environmental Analytical Sewlca Page 1 of 1

ANALYTICAL REPORT Analytical Service, Inc.
EPA Method TO-15 S1M GCIMS Analytical Method: TO-15 SIM
File: 062271 0A.D Description: iAQ-HS-28-51206D Canmube#: 756 Sam-Type: SA QC-Batch: 051806-MS1 Air Volume: 679 ml
SDG: 206227 Laboratory Number: 10
Date Sampled: 05/12/06 Time: Date Received: 05/16/06 Date Extracted: Date Analyzed: 05/18/06 Time: 20:29
Can Dilution Factor: 1.96 3 Not Detected Flag: U
MDL RL Amount MDL RL Amount Flag -
CAS# Compound P P ~ V P P ~ V ppbv u g h 3 ugh3 ug/m3 75-01-4 Vinvl chloride 0.012 0.147 0.012 0.030 0.389 0.030 U 75-354 1,l-Dichloroethene 0.014 0.150 0.014 0.059 0.614 0.059 J 15660-5 trans-l,2-Dichloroethene 0.058 1.270 0.058 0.236 5.199 0.236 U 156-59-2 cis-1 9-Dichloroethene 0.014 0.150 0.014 0.059 0.614 0.059 U 79-01-6 Trichlomethene 0.038 0.150 0.054 0.208 0.830 0.298 J 127-18-4 Tetrachloroethene 0.038 0.150 0.269 0.263 1.052 1.886
Spike Amt. Amount QC Flag Surrogate Recovery P P ~ V ppbV % Rec. Limits ' = Out Toluene-d8 0.200 0.195 98 70-130
Notes: 1) Reported results are to be Interpreted to two significant figures. 2) ugh3 = ppbL"FW123.68 calculated assuming conditions at 60 F and I atm. 3) MDL and RL are adjusted for sample volume and can dilution. 4) U and ND are Flags used for Not Detected 5) J is e flag for a result between the MDL and the RL (or lower quantitatlon limit. LQL)
Report Rle Name: 20622710.MS1 Printed on 5/24/2006
Environmental Analytical Service Page 1 of 1

ANALYTICAL REPORT Ana ly t i ca l Serv ice, Inc.
EPA Method TO-15 SIM GCIMS Analytical Method: TO-15 SIM
File: 062271 1A.D Description: IAQ-HS-29-51206 CanlTubeik 612 Sam-Type: SA QC-Batch: 051806-MS1 Air Volume: 676 ml
SDG: 206227 Laboratory Number: 11
Date Sampled: 05/12/06 Time: Date Received: 05/16/06 Date Extracted: Date Analyzed: 05/18/06 Time: 21:20
Can Dilution Factor: 1.85 3 Not Detected Flag: U
MDL RL Amount MDL RL Amount Flag - GAS# Compound ppbv ppbv ppbv uglm3 u g h 3 u g h 3 75-01-4 Vinyl chloride 0.011 0.140 0.011 0.029 0.368 0.029 U 75-35-4 I ,I-Dichloroelhene 0.014 0.142 0.024 0.056 0.582 0.097 J 156-60-5 trans-1.2-Dichloroethene 0.055 1.204 0.055 0.224 4.929 0.224 U 156-59-2 cisl,2-Dlchloroethene 0.014 0.142 0.014 0.056 0.582 0.056 U 79-01-6 Trichloroethene 0.036 0.142 0.036 0.197 0.787 0.197 U 127-184 Tetrachloroethene 0.036 0.142 0.059 0.249 0.996 0.410 J
Spike Amt. Amount QC Flao - Surrogate Recovey P P ~ V ppbV % Rec. Limits *=Out Toluene48 0.200 0.186 93 70-130
Notes: 1) Reported results are to be interpreted to two significant Bgures. 2) u g h 3 = ppbV'FWl23.68 calculated assuming conditions at 60 F and 1 atm. 3) MDL and RL are adjusted for sample volume and can dilution. 4) U and ND are Flags used for Not Detected 5) J is a flag for a result between the MDL and the RL (or lower quantitation limit, LQL)
Report File Name: 20622711.MSl Printed on 5/24/2006
Environmental Analytical Servlce Page 1 of 1

ANALYTICAL REPORT Emomma A n a l y t i c a l S e r v i c e , Inc.
EPA Method TO-15 SIM GCIMS Analytical Method: TO-15 SIM
File: 0622712A.D Description: IAQ-HS-30-51206 Canmube#: 630 Sam-Type: SA QC-Batch: 051806-MS1 Air Volume: 674 ml
SDG: 206227 Laboratory Number: 12
Date Sampled: 05/12/06 Time: Date Received: 05/16/06 Date Extracted: DateAnalyzed: 05/18/06 Time: 2209
Can Dilution Factor: 1.65 3 Not Detected Flag: U
MDL RL Amount MDL RL Amount Flag . CAS# Compound ppbv ppbv ppbv uglm3 u g h 3 ug/m3 75-01-4 Vinvi chloride 0.010 0.125 0.010 0.026 0.330 0.026 U 75-354 1 ,l-Dichioroethene 0.012 0.127 0.017 0.050 0.521 0.070 J 156-60-5 trans-12-Dichloroethene 0.049 1.077 0.049 0.200 4.410 0.200 U 156-59-2 cis-I ,2-Dichloroethene 0.012 0.127 0.012 0.050 0.521 0.050 U 79-01-6 Trichloroethene 0.032 0.127 0.032 0.176 0.704 0.176 U 127-18-4 Tetrachlomethene 0.032 0.127 0.070 0.223 0.892 0.489 J
Spike Amt. Amount QC Flag Surrogate Recovely PPbv ppbV % Rec. Limits '=Out Toluene-d8 0.200 0.198 99 70-130
Notes: 1) Reported results are to be interpreted to two significant figures. 2) ugIm3 = ppbV*FW123.66 calculated assuming conditions at 60 F and 1 atm. 3) MDL and RL are adjusted for sample volume and can dilution. 4) U and ND are Flags used for Not Detected 5) J is a flag for a result between the MDL and the RL (or lower quantitation limit, LQL)
Report File Name: 20622712.MS1 Printed on 5/24/2006
Environmental Analytical Service Page 1 of 1
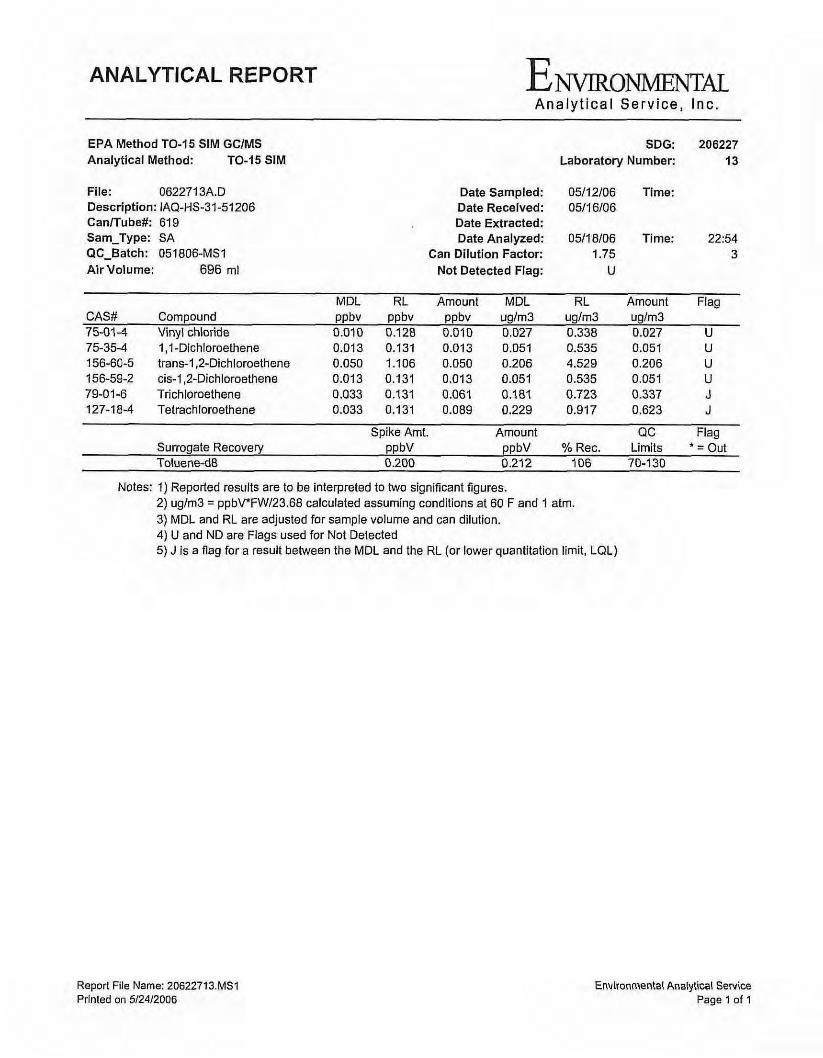
ANALYTICAL REPORT Analyt ical Service, Inc.
EPA Method TO-15 SIM GCIMS Analytical Method: TO-15 SIM
File: 062271 3A.D Description: IAQ-HS-31-51206 Canmube#: 619 Sam-Type: SA QC-Batch: 05180EMS1 Air Volume: 696 rnl
SDG: 206227 Laboratory Number: 13
Date Sampled: 05/12/06 Tlme: Date Received: 05/16/06 Date Extracted: Date Analyzed: 05118106 Time: 2254
Can Dilution Factor: 1.75 3 Not Detected Flag: U
MDL RL Amount MDL RL Amount Flag CAS# Compound ppbv ppbv ppbv ugh3 ugIm3 ugh3 75-01-4 Vinyl chloride 0.010 0.128 0.010 0.027 0.338 0.027 U 75-35-4 1,l-Dichloroethene 0.013 0.131 0.013 0.051 0.535 0.051 U
156-59-2 cis-l,2-Dichloroethene 0.013 0.131 0.013 0.051 0.535 0.051 U 79-01-6 Trichloroethene 0.033 0.131 0.061 0.181 0.723 0.337 J 127-18-4 Tetrachioroethene 0.033 0.131 0.089 0.229 0.917 0.623 J
Spike Amt. Amount QC Flag Surrogate Recovety P P ~ V ppbV % Rec. Lirnlts '=Out Toluene-d6 0.200 0.212 106 70-130
Notes: 1) Reported results are to be interpreted to two significant figures. 2) uglm3 = ppbV'FWl23.66 calculated assuming conditions at 60 F and 1 atm. 3) MDL and RL are adjusted for sample volume and can dilution. 4) U and ND are Flags used for Not Detected 5) J Is a flag for a result between the MDL and the RL (or lower quantitation limit, LQL)
Report File Name: 20622713.MSl Printed on 5/24/2006
Environmental Analytical Service Page 1 of 1

ANALYTICAL REPORT A n a l y t i c a l S e r v i c e , I n c .
EPA Method TO-15 SIM GClMS Analytical Method: TO-15 SIM
File: 0622714A.D Description: IAQ-TB-51206 Canmube#: 704 Sam-Type: SA QC-Batch: 051906-MS3 Air Volume: 600 ml
SDG: 206227 Laboratory Number: 14
Date Sampled: 05/12/06 Tlme: Date Received: 05116106 Date Extracted: Date Analyzed: 0511 9106 Tlme: 16:14
Can Dilution Factor: I .OO 3 Not Detected Flag: U
MDL RL Amount MDL RL Amount Flag CAS# Compound ppbv ppbv ppbv uglm3 uglm3 uglm3 75-01-4 Vinyl chloride 0.007 0.017 0.007 0.018 0.044 0.018 U 75-35-4 1,l-Dichloroethene 0.008 0.017 0.008 0.034 0.068 0.034 U 156-60-5 trans-l,2-Dlchloroethene 0.033 0.147 0.033 0.136 0.600 0.136 U 156-59-2 cis-l,2-Dichloroethene 0.008 0.017 0.008 0.034 0.068 0.034 U 79-01-6 Trichloroethene 0.022 0.042 0.022 0.120 0.231 0.120 U 127-184 Tetrachloroethene 0.022 0.042 0.022 0.152 0.292 0.1 52 U
Spike Amt. Amount QC Flag Surrogate Recovery P P ~ V ppbV % Rec. Limits ' = Out Toiuene-dB 0.200 0.218 109 70-1 30
Notes: 1) Reported results are fo be interpreted to two significant figures. 2) ugh3 = ppbV'FWl23.68 calculated assuming conditions at 60 F and 1 atm. 3) MDL and RL are adjusted for sample volume and can dilution. 4) U and ND are Flags used for Not Detected 5) J Is a flag for a result between the MDL and the RL (or lower quantkation limit. LQL)
Report File Name: 20622714.MS3 Printed on 5/24/2006
Environmental Analytical Service Page 1 of 1
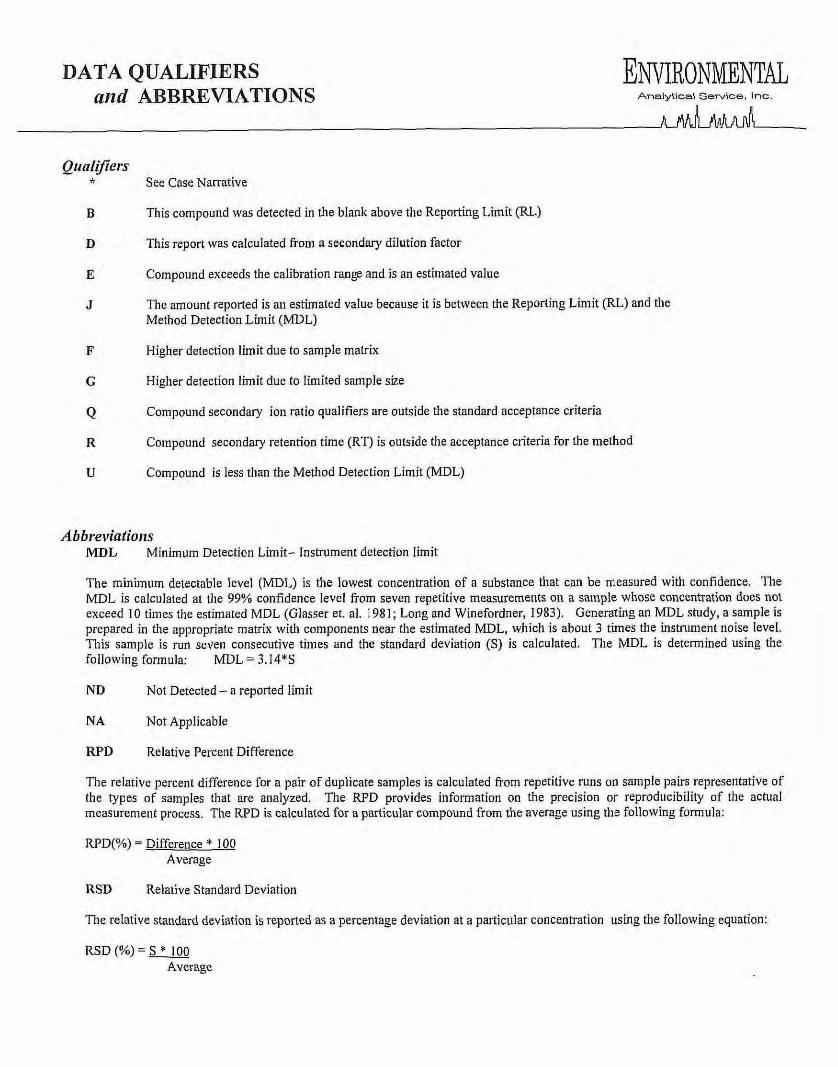
DATA QUALIFIERS and ABBREVIATIONS Analytical Service. Inc.
Qu~rtjiers k See Case Nanative
B This compound was detected in the blank above the Reporting Limit (RL)
D This report was calculated from a secondary dilution factor
E Compound exceeds the calibration range and is an estimated value
J The amount reported is an estimated value because it is between the Reporting Limit (RL) and the Method Detection Limit (MDL)
F Higher detection limit due to sample matrix
G Higher detection limit due to limited sample size
Q Compound secondary ion ratio qualifiers are outside the standard acceptance criteria
R Compound secondary retention time (RT) is outside the acceptance criteria for the method
U Compound is less than the Method Detection Limit (MDL)
Abbreviations MDL Minimum Detection Limit- Inshument detection limit
The minimum detectable level (MDL) is the lowest concentration of a substance that can be measured wit11 confidence. The MDL is calculated at the 99% confidence level from seven repetitive measurements on a sample whose concentration does not exceed 10 times the estimated MDL (Glasser et. nl. 1981; Long and Winefordner, 1983). Generating an MDL study, a sample is prepared in the appropriate matrix with components near the estimated MDL, which is about 3 times the instrument noise level. This sample is run seven consecutive times and the standard deviation (S) is calculated. The MDL is determined using the following formula: MDL = 3.14*S
ND Not Detected - a reported limit
NA Not Applicable
RPD Relative Percent Difference
The relative percent difference for a pair of duplicate samples is calculated from repetitive runs on sample pairs representative of the types of samples that are analyzed. The RPD provides information on the precision or reproducibility of the actual measurement process. The RPD is calculated for a particular compound from the average using the following formula:
RPD(%) = Difference * 100 Average
RSD Relative Standard Deviation
The relative standard deviation is reported as a percentage deviation at a particular concentration using the following equation:
RSD (%) = Average