
Quality Certifications: Their Impact on Firm Performance in ...
37
Quality Certifications: Their Impact on Firm Performance in LAC. A Random Forest Diff-in-Diff Approach Federico Bernini * Lucas Figal Garone † Alessandro Maffioli ‡ Andr´ es Sebasti´ an Mena § Jun, 2019 Abstract This study presents empirical evidence of the causal effect of internationally- recognized quality certification adoption on firms’ exports, local sales, produc- tivity, and finance restriction. Using a panel of 5410 firms operating in Latin America and the Caribbean we follow a two stage identification strategy:(stage- 1) estimating firms’ probability of quality certification adoption using Random Forest, (stage-2) using the estimated probabilities for computing a weighted Diff- in-Diff impact evaluation. Our findings indicate that quality certification has a positive effect on firm export behavior - both the probability of exporting in- directly and the amount of direct exports - and helps to ease their financial restrictions. Conversely, no effect was found on various measurements of firm productivity. This evidence is consistent with QC improving integration of local firms into Global Value Chains via indirect exports. JEL Classification Codes: D22, D24, D82, L15, L25 Keywords: Quality certification, information asymmetry, impact evaluation, firm performance, panel data, Latin America and the Caribbean. * Department of Economics, Universidad de San Andr´ es, Buenos Aires, Argentina E-mail: fg- [email protected] † Strategy & Development Department, IDB Invest, Buenos Aires, Argentina, and Department of Economics, Universidad de San Andr´ es, Buenos Aires, Argentina. E-mail: lfi[email protected]. ‡ Strategy & Development Department, IDB Invest, Washington D.C., United States. E-mail: [email protected]. § Universidad Nacional de Tucum´ an, Tucum´ an, Argentina and CONICET, Argentina E-mail: as- [email protected] 1
Transcript of Quality Certifications: Their Impact on Firm Performance in ...

Quality Certifications: Their Impact on FirmPerformance in LAC. A Random Forest Diff-in-Diff
Approach
Federico Bernini∗ Lucas Figal Garone†
Alessandro Maffioli‡ Andres Sebastian Mena§
Jun, 2019
Abstract
This study presents empirical evidence of the causal effect of internationally-recognized quality certification adoption on firms’ exports, local sales, produc-tivity, and finance restriction. Using a panel of 5410 firms operating in LatinAmerica and the Caribbean we follow a two stage identification strategy:(stage-1) estimating firms’ probability of quality certification adoption using RandomForest, (stage-2) using the estimated probabilities for computing a weighted Diff-in-Diff impact evaluation. Our findings indicate that quality certification has apositive effect on firm export behavior - both the probability of exporting in-directly and the amount of direct exports - and helps to ease their financialrestrictions. Conversely, no effect was found on various measurements of firmproductivity. This evidence is consistent with QC improving integration of localfirms into Global Value Chains via indirect exports.
JEL Classification Codes: D22, D24, D82, L15, L25Keywords: Quality certification, information asymmetry, impact evaluation,firm performance, panel data, Latin America and the Caribbean.
∗Department of Economics, Universidad de San Andres, Buenos Aires, Argentina E-mail: [email protected]†Strategy & Development Department, IDB Invest, Buenos Aires, Argentina, and Department of
Economics, Universidad de San Andres, Buenos Aires, Argentina. E-mail: [email protected].‡Strategy & Development Department, IDB Invest, Washington D.C., United States. E-mail:
[email protected].§Universidad Nacional de Tucuman, Tucuman, Argentina and CONICET, Argentina E-mail: as-
1

1 IntroductionThe Latin America and Caribbean (LAC) is a developing, middle-income region that
has managed to raise its per capita GDP over the last quarter century. However, thegap between LAC and developed countries in terms of income and well-being has yet tobe bridged. (Crespi et al., 2014a) find that this situation is not due to relatively smallerincreases in the levels of physical or human capital, but rather to the productivity gap,which has been growing in recent decades.1
There are a number of explanations for this productivity gap. From a macroeco-nomic standpoint, severe and persistent economic instability in many LAC countrieshas discouraged long-term investment. This situation is aggravated by the preponder-ance of small and medium enterprises (SMEs), whose productivity gap with firms indeveloped countries is even greater. From a microeconomic perspective, the region hasfailed to correct certain market failures, such as information asymmetries. Typically,owners or managers of a firm know more about their internal operations and futureprospects than external agents - i.e. investors, customers or creditors - can know. Thisinformation asymmetry can translate into severe barriers for firm’s growth and oftengenerates additional costs.
When a firm requests a loan, for example, the financial entity must bear the costof gathering data about that firm’s solvency and future prospects. To mitigate thecosts of information asymmetry, firms need to seek mechanisms to demonstrate theirdesirable characteristics that are not easily observable by all agents. Quality standardcertifications are effective for this purpose and represent a widely accepted solution, asthey provide a guarantee that the firm implements high-quality business and managepractices. King et al. (2005) argue that managerial standards, such as those grantedby the International Organization for Standardization, enable firms to demonstratecharacteristics that are not typically observable by third parties.
Firms that obtain an internationally-recognized quality certification tend to havemore desirable characteristics than those that do not. It is unclear, however, whetherthis relationship is causal, or whether firms deciding to adopt this certification, forexample, are already close to (or have surpassed) the quality threshold required toobtain it. In any case, firms can use this certification as a mark of quality to addressthe information asymmetry between them and the external agents with whom theyinteract.For the purpose of this study, we classified these agents into three groups: (i)domestic customers, for whom the certification is a guarantee that the firm complieswith certain quality standards; (ii) foreign customers, with whom greater informationproblems arise, and therefore who are more demanding with respect to process andproduct quality standards, which increases the importance of certification; and (iii)
1 For this reason, many productive development policies (PDPs) has been recently supported inLAC. Recently, some of them have been rigorously evaluated. These include innovation policies (Crespiet al., 2015) and their spillovers (Castillo et al., 2016b), cluster development (Figal Garone et al., 2015;Figal Garone & Maffioli, 2016), regional industrial policy (Castillo et al., 2017), technical assistance forMSMEs (Castillo et al., 2016a), and scientific research funds (Benavente et al., 2012), among others.
2

financial institutions, which through the certification, also receive relevant informationby the certification about the firm’s economic situation and good business practices,thereby improving its credit risk assessment.
In this paper we analyze the role of acquiring international certification on removinginformational barriers that hinder firm’s development and growth. First we describe thefirms in LAC that obtained an internationally-recognized quality certification 2. Thenwe explore the effects of this certification on several variables of firm performance. Theevidence on the impact of acquiring a quality certification on firm performance is scarceand it is specially important to firms in developing countries (as Latin America andCaribbean) where information asymmetries are larger and firms’ growth were slow. Weargue that analyzing several outcomes is important not only to understand the impactin different firm-level dimensions, but also because each outcome is related to a differentexternal agent of the firm. Therefore, it allows us to explore why firms certificate and,at the same time, identify for which agents the quality certification really matters assignaling mechanism of relevant characteristics of the firm.
We use the World Bank Enterprise Survey (WBES) carried out in Latin Americain 2006 and 2010 (with the exception of Brazil, where it was conducted from 2003 to2009), and the WBES carried out in 2011, in combination with the new round carriedout in 2014 (PROTEqIN) for Caribbean countries. Overall, we have data from 19,499enterprises in 32 countries in the region, where 5,410 firms were surveyed in two yearsand allow us to construct a panel database. Our identification strategy for the impactof quality certification is a weighted difference-in-difference approach, which allows usto deal with potential endogeneity issues. Weights are introduced in order to conduct adouble-robust evaluation assuring that treated and control groups’ covariates are equalin mean at baseline. To avoid biased conclusions due to weights misspecification, weestimate two different Inverse Probability Weights using the traditional probit modeland also random forest.
Results indicate that adoption of international quality certifications is more frequentamong exporters, foreign firms and enterprises with greater sales and more experiencedmanagers. Furthermore, obtaining international quality certification has a positiveeffect on the business objectives most affected by problems of information asymmetry,such as entry into international markets (the intensive margin of direct exports and theextensive margin of indirect exports) and access to financing. For local sales we findpositive effects, but only significant for the Random Forest method, indicating thatdomestic customers give less importance to quality certifications than internationalones. Finally, adopting certification seems to have no statistically significant effects onfirm productivity. This study therefore finds evidence that the main benefit to firmsthat obtain quality certification is not linked to an improvement in productivity orlocal sales, but rather to quality signaling for foreign clients and credit institutions, bydemonstrating certain desirable characteristics that are difficult to verify in the absenceof such certification.
2 We focus on process certification, such as ISO 9000 certificates.
3

To test the robustness of our results, we perform two falsification tests using thosefirms that initiated a quality certification process but not received it yet and also thosefirms that based on observed covariates are closer to treated ones3. No significant effectswere found.
The paper is organized as follows: Section 2 contains a review of the literature onquality certification adoption and its effects. Section 3 presents the data and variablesused, describes the sample and shows the differences in the variables between firms thatadopt international standards and those that do not. Section 4 carefully details ouridentification strategy by indicating how we defined treated and control groups, theformal Diff-in-Diff specification, the Probit and Random Forest methods for propensityscore estimation, and the results of the first stage propensity score estimation and theresulting baseline covariates mean balance. Section 5 analyzes the impact of adoptinginternational standards on firmsâĂŹ local sales, export bahavior, finance restriction andproductivity. Section ?? assess the robustness of the results using falsification tests.Section 6 concludes and offers some final considerations.
2 Literature ReviewFirms that opt to obtain an international quality certification (e.g., ISO standards)
must ensure that they are implementing best business practices by establishing a qual-ity policy with measurable objectives, complying with certain requirements concerningcustomer satisfaction, and providing the necessary training for staff to reach the re-quired level of competence, among other activities. Hudson & Orviska (2013) devel-oped a model that shows that obtaining international quality certification allow firms todemonstrate higher quality and less uncertainty about their activities and products orservices. Quality signaling is particularly important for firms in developing countries.As the general perception of the relationship between quality and the country’s percapita income is already unfavorable, firms seeking to export need an alternative wayof showing that their products can also be of high quality.
The empirical literature on the determinants of the adoption of international qualitystandards and its impact on firm’s performance is quite recent. The evidence showsthat exporters, larger firms and those with a higher share of foreign ownership aremore willing to seek adoption of international quality standards (Fikru, 2014; Hudson& Orviska, 2013; Pekovic, 2010; Ullah et al., 2014). Exporters are more likely to adopta certification because there is a greater information asymmetry with their foreigncustomers than their local clients and, in addition, because there is a harder competitionin foreign than local markers. At the same time, larger firms and companies withforeign ownership generally enjoy greater access to financial resources and have superiormanagement, enabling them to achieve certification more readily.
The literature about the impact of the adoption of quality certifications on firm’s
3 We employed the Genetic-Matching (?) algorithm to find the nearest-neighbours of treatmentgroup and falsified them as treated
4

performance has focus on two main variables: exports and productivity. In terms ofthe literature about the impact of certificate on exports, there are various studies thatfind significant effects on both the probability of exporting and the volume exported,that is, on both the intensive and extensive margin of trade (e.g., Otsuki, 2011; Sun& Outyang, 2014; Volpe Martincus et al., 2010; Xiaoyang Chen et al., 2008). Thesefindings are important not only in terms of developing the export potential of firms in agiven country, but also because there is evidence that firms learn lessons throughout theexport process, which enables them to improve their productivity (De Loecker, 2007;Harrison & Rodriguez-Clare, 2010).
In contrast, the evidence about the effects on firm’s productivity is less conclusive.While there is evidence that certified firms are more productive (Dick et al., 2008; Starke& Rangamonhan, 2012; Trifkovic, 2017; Ullah et al., 2014), it is not clear whether firmsimprove their productivity by obtaining the certification or they obtain the certificationbecause they are more productive. Javorcik & Sawada (2018) shows that ISO 9000 hasno effect on labor productivity and average wages on the short run, while there is asignificant effect on both variables on the long run. This difference in the timing of theeffect reflects that the improvements implemented to certify require maturing time tomaterialize in a more efficient production process. In addition, after examining datafrom manufacturing firms in 59 countries, Goedhuys & Sleuwaegen (2013) find thatthose firms that obtain international standard certification have greater productivityand that the effect is greater for the firms located in countries with weaker marketinstitutions. This finding underscores the importance of exploring these issues in theLAC region, where the potential benefits may be considerable.
Finally, the impact of acquiring a quality certification on other outcomes of interest isalmost non-existent. In particular, we will focus on the impact on the access to finance.Ullah et al. (2014) show, using the Enterprise Survey, that ISO certified firms exhibitsignificantly lower level of financial constraints, higher level of exports and productivity.Although the data they used are similar to the one used in this paper, they provideevidence in a cross-section setting for 31 LAC countries and therefore their resultsrest on the assumption that there is no firm-level unobserved heterogeneity that is notrelated to both the decision to certify and firm performance.In our case, we exploitpanel data and apply a difference-in-difference approach that allow us to control fortime-invariant heterogeneity. This approach reduce the potential heterogeneity causeby selection biases, since certified and non-certified firms are clearly not similar.
3 Data and descriptive statisticsThis study is based on the World Bank Enterprise Survey (WBES). The WBES is a
firm-level survey of a representative sample of an economy’s private sector. The surveycover a broad range of business environment topics including access to finance, corrup-tion, infrastructure, crime, competition, and performance measures. In this paper, weuse the WBES carried out in Latin America in 2006 and 2010 (with the exception of
5

Brazil, where it was conducted in 2003 and 2009), and the WBES carried out in 2011in combination with the new round carried out in 2014 (PROTEqIN) for Caribbeancountries. Overall, data were obtained from 22,945 enterprises in 32 countries in theLAC region. Given that 5,410 firms were surveyed in two years, we can construct apanel database for our main estimations.
In Table 1, the main variables used in this study are described. Our main focus ison the variable “Quality certification” that identifies if the firm have an internationally-recognized quality certification. This variable is first used as an outcome variable toexplore the determinants of certification adoption. Thereafter, the effect of certificationon certain outcomes of interest linked to firm performance is analyzed using it as a“treatment variable”.
We focus on a set of ten main outcome variables to evaluate firm’s performanceand how they are affected by the acquisition of an internationally-recognized qualitycertification. First, in order to explore the firm’s performance in foreign markets, wefocus on the export status of the firm and the amount of exports (direct and indirect).Second, we use local sales to assess firm’s performance in national markets. Then, wefocus on firm’s access to finance (own perception as a barrier). Finally, we use laborproductivity and TFP measures to evaluate firm’s productivity.4.
We also use a set of control variables to reduced potential biases. We control forfirm’s characteristics including firm age, number of employees, management experienceand whether firm has foreign owners. As well, we have a group of three variables thatare related to activities of the firm, such as whether the firm runs training programs;or uses a website to communicate with customers and suppliers; and the percentage ofworking capital financed by banks.
Table 2 compares the means values of outcomes and control variables between firmsthat achieved a quality certification and those that did not. In general, firms that haveadopted international quality standards tend to perform better. They have greatersales in local markets compared to firms without certification. In terms of interna-tional insertion, 50% of certified firms are exporters, whereas only 21% of non-certifiedfirms sell in foreign markets. Moreover, those that manage to get certification exporta larger volume, and a higher proportion of their sales −14%, versus only 5% for non-certified firms. Although this preliminary evidence reveals a clear correlation betweenexport orientation and performance for firms with international certification, it is stillnot sufficient to attribute causality. For example, it may be the case that firms incor-porate knowledge and lessons by exporting that subsequently help them to acquire acertification.
Firm productivity is a relevant variable to observe, as it highly correlated withfirm’s survival, long-term growth, and entry into export markets (Syverson (2011)).The results show that firms that obtained international certification are significantlybetter in terms of labor productivity but the opposite seems to be the case for TFP.
4 We computed productivity using other measures (e.g. value added per employee and measures ofTFP using input shares in the total cost) and results remained unchanged
6

Table 1: Description of variables
Variable Definition
Quality Binary variable that takes the value 1 if the firm has an internationallyCertification recognized quality certification and 0 otherwise
Exporting firm Binary variable that takes the value 1 if the firm exports0 otherwise
Direct Exporting firm Binary variable that takes the value 1 if the firm exports directlyand 0 otherwise
Indirect Exporting firm Binary variable that takes the value 1 if the firm exports indirectly0 otherwise
Exports Total amount exported (US dollars)
Direct Exports Total amount exported directly (US dollars)
Indirect Exports Total amount exported indirectly (US dollars)
Local sales Total amount sold in the local market (US dollars)
Financial Binary variable that takes the value 1 if the firm considers accessbarrier to financing to be a significant or severe barrier and 0 otherwise
Labor Sales per employee (US dollars)productivity
TFP Total factor productivity estimated using the Levinsohn & Petrin (2003)methodology
Employees Number of permanent full-time employees
Management Years of management experience in the sectorexperience
Foreign Binary variable that takes the value 1 if the firm is own by a privateforeign individual/organization in more than 10%
Age Number of years since the business was started
Training Binary variable that takes the value 1 if the firm runs a formaltraining program for their employees
Website Binary variable that takes the value 1 if the firm use a website tocommunicate with customers or suppliers
Bank Binary variable that takes the value 1 if the firm is financed by banks7

Table 2: Characteristics of firms with and without quality certification
MeanDifference ObservationsWithout With
certification certificationExporting Firm 0.23 0.51 0.28∗∗∗ 10685Direct Exporting Firm 0.18 0.43 0.25∗∗∗ 10791Indirect Exporting Firm 0.08 0.14 0.06∗∗∗ 10682Ln Exports (USD) 11.93 13.57 1.64∗∗∗ 2862Ln Direct Exports (USD) 12.04 13.78 1.74∗∗∗ 2316Ln Indirect Exports (USD) 11.15 12.00 0.85∗∗∗ 937Ln Local Sales (USD) 12.88 14.24 1.36∗∗∗ 9591Financial barrier 0.29 0.23 -0.07∗∗∗ 10701Ln Labor Productivity 9.78 10.25 0.47∗∗∗ 9841TFP 1.42 1.36 -0.06∗ 4950Manager Experience 20.47 21.69 1.22∗∗∗ 10577Website 0.46 0.75 0.29∗∗∗ 10793Foreign 0.10 0.29 0.19∗∗∗ 10507Bank 0.48 0.54 0.06∗∗∗ 10692Ln Sales (USD) 13.02 14.52 1.50∗∗∗ 9856Age 24.28 31.27 6.99∗∗∗ 10749Training 0.45 0.81 0.35∗∗∗ 7550Employees 66.93 260.45 193.52∗∗∗ 10798Micro: ≤ 10 employees 0.26 0.10 -0.16∗∗∗ 10798Small: 11 to 50 employees 0.49 0.34 -0.14∗∗∗ 10798Medium: 51 to 200 employees 0.19 0.33 0.14∗∗∗ 10798Big: ≥ 200 employees 0.06 0.22 0.16∗∗∗ 10798
Source: Author’s estimates based on WBES and PROTEqIN.*** p < 0.01, ** p < 0.05, * p < 0.1
8

In addition, these firms enjoy easier access to financing; only 23% of certified firmsconsidered access to finance as a barrier, compared to 29% of non-certified firms.
In addition, certified firms have more desirable characteristics as measured by severalvariables. They tend to be larger, with an average of 260 employees compared to 67employees in firms without certification. This is understandable, since firms that haveadopted quality standards are more likely to fall in the medium- (between 51 and 200employees) and large-sized (more than 200 employees) categories, whereas the non-certified group are mostly micro (less or equal than 10 employees) and small (between11 and 50) firms. They are also older firms, have managers with more years of experienceand their owners tend to be foreigners in larger proportions.
Finally, certified firms have a greater probability to run a formal training programfor their employees -81% versus 45%-. They also are more likely to have a website tocommunicate with their customers and suppliers and finance a greater proportion oftheir working capital with banks, which is another signal that they have a better accessto finance.
4 Identification StrategyOur identification strategy consists in a two step difference-in-difference estimation
from a balanced repeated cross-section of 4376 firms. In the first step we estimate thetreatment probability, i.e. baseline probability of obtaining a quality certification, usingtwo alternative methods: Parametric Probit and Non-Parametric Random Forest. Inthe second step we use the estimated propensity scores for weighting the diff-in-diffmodel and estimating the average treatment effect on the treated (ATT). As stated by(Wooldridge, 2007, p.1293), under regular assumptions this identification strategy hasa general ”double robustness”5 property. Details of each step are presented next.
4.1 Natural Experiment SettingTo estimate the impacts of interest we set-up a natural experiment framework which
allow us to use difference-in-difference strategy. For that, we define two relevant periods,before treatment (t = 0) and after treatment (t = 1), and also two relevant groups,Treatment group and Control group. For each firm, before treatment period correspondsto the baseline survey year and after treatment period corresponds to the follow-upsurvey year6. Furthermore, treatment group is comprised by those firms who had not
5 This implies that if at least one of the two models is correctly specified, i.e. diff-in-diff or propensityscore, then the estimated ATT is consistent. This is partially true for our strategy because in orderto avoid confusion between treatment effects and treatment determinants, time varying covariateswere not included in the propensity score model while for construction all baseline characteristics areincluded into the fixed-effects DID.
6 Each firm have only one observation by period but baseline survey was collected in year 2003 forBrazil, 2006 for remaining LA countries and 2011 for Caribbean. Follow-up survey for Brazil, LA andCaribbean were respectively conducted in 2009, 2010 & 2014.
9

a Quality Certification in t = 0 but obtained one before t = 1. We can see in table 4that 433 firms conform the treatment group. Also, control group is comprised by thosefirms who had not a Quality Certification in t = 0 and remain the same in t = 1. Wecan see in table 4 that 3943 firms conform the control group while, as displayed in table3, 1034 firms who already had a Quality Certification in t = 1 are omitted. This reduceour panel from 5410 firms to 4376 firms.
Table 3: Quality Certification
Has Quality Baseline Follow-UpCertification (t=0) (t=1) Total
No 4376 4158 8534Yes 1034 1252 2286
Total 5410 5410 10820Note:Balanced Panel of 5410 firms
Table 4: Treatment Status
Treated Before After(t=0) (t=1) Total
No 4376 3943 8319Yes 0 433 433
Total 4376 4376 8752Note:Balanced Panel of 4376 firms
To asses the impact of obtaining a Quality Certification on firm performance weuse a weighted differences-in-differences (Dif-in-Dif) model. The resulting model ispresented in equation 1 :
yicst = βTi + fi + δt + cc ∗ δt + ss ∗ δt + γXit + εicst ; λmi (1)
The coefficient β represents the effect of adopting the quality certification on anyoutcome. The variable T takes the value 0 if the firm lacked certification and continueswithout it, or if it had not acquired a certification yet; it takes the value 1 if the firmwas not certified in the previous period, but is now. To endow the model with a Diff-in-Diff structure we use firm-level (fi) and time (δt) fixed-effects, and to avoid biascoming from country and sector specific trends we also include Country-Year (cc ∗ δt)and Sector-Year(ss ∗ δt) specific trends. Finally, we include a set of firm specific time-varying covariates in Xit. Since firms in the panel are surveyed in 2 periods, number ofobservations will double number of firms in all estimations.
The Diff-in-Diff method control for both observable and unobservable heterogeneitybetween firms that is constant over time (e.g. firm’s sector, location, and other otherfirm intrinsic characteristics) which enables a significant reduction of the estimationbias. Nevertheless, the method has some limitations and its causal interpretation relieson treated and control groups satisfying the parallel trend assumption. This assumptionmay be implausible if pre-treatment characteristics that are thought to be associatedwith the dynamics of the outcome variable are unbalanced between the treated andthe untreated. If that is the case, and pre-treatment characteristics of treatment andcontrol groups are significantly different, then even in the absence of treatment theywould perform differently over time. That scenario would violate the parallel trendassumption. That is why, in order to achieve pre-treatment balanced groups, we adjustthe Diff-in-Diff using the weights λm
i . Given that models implemented to define weights
10

are feasible of misspecification leading to biased conclusions, we present results fromtwo alternative methods m. General approach and specific methods are detailed next.
4.2 Propensity ScoreWeights λm
i are defined using Inverse Probability Weighting, a strategy from thefamily of propensity score (PS) methods commonly used to minimize selection biasin non-experimental studies (Austin, 2011). PS was first introduced by Rosenbaum& Rubin (1983) as a way for ”balancing” treatment and control groups on a set ofbaseline characteristics; i.e., to make the groups as similar as possible with respectto those observed baseline characteristics. The PS itself is defined as the conditionalprobability of receiving the treatment of interest as a function of those covariates:
Pr(Ti = 1|Xi = xi) = pT (x) (2)
Both, the function pT (.) mapping from covariates to treatment, as well as the condi-tional probability of treatment assignment Pr(Ti = 1|Xi = xi), are essentially unknownin natural experiments and different methods were used for their estimation. Mostcommon methods are logit and probit (Imbens & Wooldridge, 2009). However, there isevidence that slight misspecification of parametric propensity score models can resultin substantial bias of estimated treatment effects (Drake, 1993; A. Smith & E. Todd,2005; King & Nielsen, 2019). In order to address this issue semi-parametric and non-parametric techniques can be employed for estimating it (Mccaffrey et al., 2005; Li et al.,2008; Imai & Ratkovic, 2014; Busso et al., 2014). Among non-parametric methods, ma-chine learning algorithms such as CART, Support Vector Machines and Random Forestare a promising alternative for PS estimation (Westreich et al., 2010; Imbens & Rubin,2015). Main reason for this is that ML algorithms usually achieve higher classificationaccuracy requiring fewer assumptions about functional forms and tuning parameters,specially in the presence of non-linearity and non-additivity of confounders (Lee et al.,2010). Despite of the different possible approaches, if the PS is correctly estimated andthe assumption of selection in observable holds, we can be sure that the true treatmenteffect will be estimated without bias. We employ two of the most popular among para-metric and non-parametric methods for estimating PS, i.e. Probit and Random Forest.Methods and results are detailed next.
11

4.2.1 Probit Propensity Score
Treatment probability of firms conditional on observed variables is estimated usinga probit probability model represented by Equation 37.
Ti = Xi0β + εi0 (3)
Where Ti takes the value of 1 if firms belongs to treatment group and 0 if belongsto control group, Xi0 represents a set of characteristics of the firm i in the period t = 08
and εi0 ∼ N(0, 1). This model allow us to compare characteristics between treatmentand control groups before treatment occurred and consequently estimate the propensityscore for each firm.
Despite we define our model specification not for predicting treatment status, but forachieving baseline covariates balance9, results (showed in Table 5) of the model are stilluseful guides to understand which firms’ characteristics are more important predictorsof treatment status. Our findings point in the direction anticipated by the theoryand the existing evidence. Firms with larger sales volume, have higher probability ofobtaining an internationally-recognized quality certification. Larger firms may find itnecessary to standardize processes in order to optimize performance. Direct Exportingfirms also have higher probability of certifying than those that operate in the domesticmarket alone and the effect increase with export volume. This could be due to higherinformation asymmetries with foreign than local customers and harder competition ininternational markets. Meanwhile, foreign owned firms are 22% more likely to adoptquality certifications. This is typically because they enjoy easier access to financialresources and have superior management skills10. Finally, years of manager experienceare significant predictors of quality certification adoption.
Figure 10 is the density of predicted propensity scores for treatment and controlgroups. As expected, control group distribution is placed to the left of treatment groupwith density peaks near 0.1, whereas treatment group distribution is flatter and lessasymmetrical but still with peaks near 0.2. Given that the true propensity score isessentially unknown and that small misspecifications of the probit model can strongly
7 More precisely, we suppose that propensity score takes the form Pr(Ti = 1|Xi = xi) = Pr(Ti >0) = Pr(Xiβ+εi > 0) = Φ(βXi), where Φ is the Normal distribution. This method is called parametricbecause thanks to this assumption, we can reduce the problem of estimating the propensity score tothat of estimating parameter β
8 To avoid confusion between treatment outcomes and determinants we use only pre-treatmentfirms’ characteristics observed in the baseline survey.
9 This is an important aspect because our metric for including or not covariates of different orderinto the model was not the r2, their predictive power, or even the significance of parameters, butthe degree of baseline covariate imbalance between treated and control groups. Log Direct Exportswas transformed using the Inverse Hiperbolic Sin Transformation to evaluate the extensive margin ofexports without losing those observations from non-exporters
10 However, in this model we are already controlling for years of manager experience. Anotherchannel, as showed by Pekovic (2010), is that foreign owned firms have also more internal pressure toadopt international quality standards (e.g. requirement of the headquarters when the firm is inside aninternational group).
12

bias causal inference (Drake, 1993; Dehejia & Wahba, 2000), in order to evaluate therobustness of our estimations we also use an alternative non-parametric estimator ofthe propensity score using random forest.
Table 5: Probit Propensity Score
(1)Prob. Treated
Log Total Sales 0.071**(0.031)
Log Employees 0.031(0.043)
Age 0.005(0.004)
Age2 -0.000(0.000)
Direct Exporting Firm -0.638(0.419)
Log Exports 0.063**(0.032)
Manager Experience 0.007**(0.003)
Bank 0.066(0.065)
Website 0.116(0.073)
Foreign 0.222**(0.103)
Observations 3,676
Source: Author’s estimates based on WBES and PROTEqIN.Dummy by Country and Sector includedStandard errors in parentheses. *** p < 0.01, ** p < 0.05, * p < 0.1
13

Figure 1: Probit Propensity Score
4.2.2 Random Forest Propensity Score
Random Forests (RF), firstly proposed for Breiman (2001), is one of the most suc-cessful machine (statistical) learning algorithms for practical applications11 with grow-ing use in econometrics and applied economics literature(Imbens & Wooldridge, 2009;Varian, 2014; Duflo et al., 2017; Athey et al., 2019). This algorithm is generally rec-ognized for ”...its accuracy and its ability to deal with small sample sizes and high-dimensional feature spaces” (Biau & Scornet, 2016, p.1). RF is a generic name for theprocess of (i)aggregating (ii)random (iii)decision-trees, its three main features:
i Aggregating feature comes from the process of Bagging, a contraction of bootstrap-aggreggating. It consists on drawing B bootstrap samples of size N from the data,constructing a decision-tree for each sample, and averaging results over the B sam-ples. We took B = 1000 samples of size N = 748 without replacement. Samplesize was defined for achieving, in average, size-balanced treated and control groups12.
ii Randomness arise from the sequential selection of L regressors out of K possiblecovariates. This is a key aspect of RF accuracy because exogenous variation is
11 For a detailed explanation of the algorithm functioning and recent developments see (Efron &Hastie, 2016, p.325) and Biau & Scornet (2016)
12 Imbalanced groups in the classification dimension is a serious issue in this kind of algorithmsbecause simple decision rules overestimates the probabilities of belonging to the majority group. Inour database, after eliminating observations with missing covariates, we have a treatment group of sizeNT = 374 and control group of size NC = 3302. For achieving size-balance we set a vector assigningsampling-probabilities of ( 1
NT, 1
NC) for treated and control groups respectively.
14

introduced into the classification process. We employed the same set of K = 12covariates used in Probit model and followed the empirical rule of setting L =K3 = 413
iii Decision-trees are the basic rule of classification employed for RF. In a generalsense, it consists on repeated binary splits of the sample according to some criteria.Our main objective is to classify two groups into our two states of interest T =0/T = 1. This classification is made at each decision node d conditional on thesupport of a single covariate chosen among the L randomly selected regressors.This covariate is selected according to its relative accuracy for splitting treatedfrom controls, i.e. its relative predictive power into the subset of the L regressors.More precisely, in RF the criteria used for sample-splitting is CART14, a non-parametric regression which is estimated in order to minimize the mean squareerror of node splitting d 4:
MSE(d) = MSEC +MSET
=∑
i∈T =0
(yi − yT =0)2 +∑
i∈T =1
(yi − yT =1)2 (4)
Where MSE(d) is the mean square error resulting from the splitting d, which isthe sum of MSEC and MSET , i.e. the respective error resulting from controland treatment group classification. The outcome of each decision node d are twoestimated groups (T = 0 and T = 1) split over the optimal cut-point value15 ofthe preferred regressor among the L sampled. This process is repeated until noimprovement on classification can be achieved or until the user-defined minimumterminal node-size (Nmin) is achieved. In our case we set Nmin = 6, the defaultrecommendation for regression tress. An example of two sample decision trees arepresented in figures 2 and 3. Figure 2 indicates that from the L = 4 randomlychosen regressors16, the best classification performance was achieved by loglaborwhich is the natural logarithm of the number of employees. Big firms, those withloglabor > 3.4, were classified as belonging to treatment group, while small firmswere classified as control. Among big firms, those with greater sales logsales >
13 This rule was complemented by cross-validation using covariates balancing as a measure of algo-rithm performance. Regressors’ sampling-probability were defined using the same rule. As expectedafter running the Probit model, more weight were required for those covariates with greater imbalanceand treatment predictive power such as Sales, Exports Volume and Foreign ownership.
14 Acronym for clasiffication and Regression Trees15 For continuous regressors, the algorithm creates a discrete grid, evalutes the resulting MSE at
each possible cut-point, and finally chose that which minimize the MSE. We use the default grid of 10possible cut-points for each splitting.
16 From the plotted CART we can’t know which were the contesting regressors at each node butonly which are the winners. Also, the subset of regressors at each node is taken with replacementallowing the inclusion of the same covariate more than once in a single tree
15

14.547 were assigned to node 9 and classified as treated. Over the 124 firms innode 9, accuracy of the classification was 0.661 and consequently the error rate was0.339. Another interpretation, more useful for us, is that conditional treatmentprobability of big firms with greater sales volumes is 0.66. Similarly, from figure3, we can infer that non-foreign owned firms, from sectors {2, 15, 24...}, which arenon-exporters, have probability 0.61 of being into the control group.
Figure 2: Sample Classification Treeusing Continuous Predictors
Figure 3: Sample Classification Treeusing Categorical Predictors
Figure 4: Random Forest Propensity Score
The resulting PS estimation via RF is presented on figure 4. Due to the superiorclassification power of RF over Probit, we can realize that RF-PS density of treated
16

and control groups has fewer overlapping over the support than those observed infigure 3. Because we don’t follow a local PS-Matching strategy but a complete samplere-weighting of a perfectly balanced panel, while covariate balancing between treatedand control group is satisfied, reduced overlapping is not a treat for our identificationstrategy17. On the contrary, given the marked differences of methodology and resultsbetween the two competing strategies we propose for PS estimation, similar results onthe estimated treatment effects will be an important proof of robustness.
4.2.3 Inverse Probability Weighting and Balancing results
Inverse Probability weighting (IPW) has a long tradition in statistics and was firstlyemployed in econometrics for consistent estimation under non-random attrition andcensored data (Horvitz & Thompson, 1952; Rubin, 1976; Robins et al., 1995; Robins& Rotnitzky, 1995). In the same line, Rotnitzky & Robins (1995) show that weightingobservations by the inverse of a parametric estimate of the selection probability is moreefficient than weighting by the inverse of the true selection probability. This result wasextended by Wooldridge (2007) for estimations of probabilities using non-parametricmethods and stating the “double robustness” (M. Robins & Ritov, 1997) property ofIWP estimation. This property implies that when covariates affecting the selectionand the outcomes of interest are the same, if either the estimated propensity score orthe unweighted model are correctly especified, then the parameters of interest can beconsistently identified18.
The problem of selection on the treatment is a special case o selection problemsdescribed before. Rosenbaum (1987) and Hirano et al. (2003) studied the propertiesof IWP for estimation of treatment effects respectively proving its consistency and effi-ciency. Lee et al. (2010) conducted montecarlo simulations evaluating the performanceof IPW using parametric and machine learning methods and discovered that randomforest was among the best performers in reducing estimation bias of treatment effects19.Furthermore, they find that covariate balancing was one the best metrics predicting biasreduction on treatment estimations. We use IPW for estimating the average treatmenteffect on the treated (ATT). ATT requires weighting the control group using the odds-ratio of the estimated propensity scores and leaving the treatment group unchanged as
17 We estimate the ATT (average treatment effect on the treated) which according to Imbens (2004)requires two weaker conditions for identification: i) Unconfoundness for control group Y0 ⊥ Pr(T0 =1|X), and ii) Weak-overlapping Pr(T0 = 1|X) < 1
18 Wooldridge (2007) points that IWP is not free of risks and indicates caution for two scenarioswhere weighting can introduce bias to the basic model. First scenario is a bad specification of thePS model. To avoid this possibility we propose two alternative methods for this estimation andprovide tests of baseline covariates balance. The second scenario, more dangerous and hard to detect,may appear when variables affecting the outcome of interest can not be included on the propensityscore estimation. This omission may introduce additional bias even if the propensity score is correctlyestimated. This is not a treat for our strategy because all the baseline covariates used for PS estimationare also fixed effects in the DID model.
19 This was specially true por data generating process with non-additivity and non-linearity. ForDGP with linear specification parametric methods performed equally well.
17

showed in equation 5:
λmi =
1 if T = 1pt(Xi)m
1−pt(Xi)m if T = 0.(5)
Results of baseline covariate mean balance before and after weighting with modelsm = {Probit;RF} are presented in Table 6 and Figure 520. Table 6 indicates thatunweighted baseline differences between treatment and control group are statisticallysignificant according to independent t-test for most of the covariates. This is reflectedalso on the multivariate F-test which reject the null of similar groups. More specifically,treated group is composed by firms: bigger (both in terms of sales and employees),mostly exporters (both in terms of exporting probability and volume), more productive,foreign owned, and with greater probability of having a website. However, after IPWall significant differences between groups disappears for both methods employed andRF slightly over-performs Probit balance. Some authors remarked the importance ofevaluating covariates imbalance using statistics that are not affected by sample size(Ho et al., 2007; Imai et al., 2008; Austin, 2009) and the use of standardized meandifferences (smd) became popular among propensity score literature. Main troublewith this measure is that don’t provide a clear cut-off point to assess what means fortwo groups to be imbalanced. A rule of thumb, also popular among practitioners, isthe threshold of 0.1 absoulte smd. Figure 5 displays graphically another perspectiveregarding baseline because thanks to standardization we can say that, before weighting,baseline imbalance was relative greater in Sales, Employees and Labor Productivity.Also, according to this criteria difference in age between groups was also significant.Another interesting feature is that despite the difference between estimated propensityscores, RF IPW produce similar balancing than Probit IPW, both performing well inachieving smd far below the 0.1 threshold21.
20 Due to space limitations, balance for country and sector are not presented. Both were includedinto both models as important covariates and a correct balance was achieved after weighting
21 We can also visualize that RF forest adjusting is below 0.05 smd for most of the covariates,performing better than Probit for covariates with greater previous imbalance and worse for those withfewer previous imbalance. This is due to the flexibility of non-parametric methods for managing tradeoffs between dimensions.
18

Table 6: Adjusted Baseline Covariate Mean Balance
Unweighted Probit Random ForestTreated Control Diff Control Diff Control Diff
Ln Employees 3.551 3.143 0.408*** 3.526 0.064 3.539 0.051Ln Sales 13.659 12.811 0.848*** 13.508 0.146 13.532 0.122Ln Local Sales 13.193 12.527 0.666*** 13.047 0.139 13.086 0.100Direct Exporter 0.246 0.173 0.073*** 0.249 0.021 0.249 0.021Exporter 0.292 0.223 0.070*** 0.299 0.008 0.301 0.007Indirect Exporter 0.086 0.080 0.006 0.085 -0.005 0.088 -0.008Ln Direct Exp. 3.338 2.085 1.252*** 3.221 0.277 3.205 0.294Ln Exports 3.846 2.672 1.174*** 3.819 0.081 3.819 0.081Ln Indirect Exp. 0.968 0.927 0.042 1.008 -0.118 1.032 -0.142Finance 0.318 0.321 -0.004 0.282 0.042 0.305 0.020M. Experience 18.451 19.044 -0.593 18.396 -0.014 18.913 -0.530Age 23.587 22.215 1.372 23.941 0.466 24.276 0.130Website 0.491 0.369 0.121*** 0.461 0.017 0.443 0.036Foreign 0.138 0.082 0.056*** 0.138 -0.001 0.119 0.018Bank 0.495 0.457 0.038 0.524 0.002 0.508 0.018Ln Labor Prod. 10.087 9.661 0.426*** 9.982 0.082 9.994 0.071TFP 1.540 1.440 0.099 1.403 0.122 1.422 0.103
Multiv. F Test 5.51*** 2.10 1.32Source: Author’s estimates based on WBES and PROTEqIN.Balanced groups by country and sector also achieved after weighting.Standard errors in parentheses. *** p < 0.01, ** p < 0.05, * p < 0.1
19

Figure 5: After weighting covariate balancing
Proven the effectiveness of the estimated weights λmi in achieving baseline balance
between groups , we can proceed to the second step of our identification strategy con-sisting on estimating the weighted differences-in-difference model presented in equation1. We can state that the resulting ATT will be:
ˆATT = β = 1λm
i N
N∑i=1
λmi (Yi1 − Yi0) (6)
Where Yi1, Yi0 are the respective conditional expectations for the first and secondperiod resulting from the unweighted DID model presented in equation 1. This iden-tification strategy is in the spirit of Abadie (2005) and same assumptions for equating
ˆATT = β are required:
1. Unconfoundedness for Control Trends: That is, conditional on observed variables,treatment status is not related to trends in controls’ outcomes.
E[Y1(0)− Y0(0)|X,T ] = E[Y1(0)− Y0(0)|X] (7)
20

2. Weak Overlap: This is a weaker assumption than the required for ATE estimation,needed for propensity score identification.
Pr(T = 1|X) < 1 (8)
Results of the estimated ATT of firms’ Quality Certification adoption on Local Sales,Export behavior, Finance restriction and Productivity are presented next.
5 Impacts on Firm PerformanceThe analysis of the results is divided into four parts. The first three subsections
analyses the impacts on different performance variables in order to explore actors towhom the possession of an international certification -i.e. signaling certain qualitystandards- may matter: domestic customers, foreign customers, and financial entities.Furthermore, because firms use new productive processes and management control sys-tems and implement a staff training agenda during the certification process, increasesin productivity may be expected and are analyzed in last subsection.
5.1 Local SalesFirms that seek to obtain benefits by signaling good business practices and quality
control standards to their customers in the domestic market should have an increasein their local sales or national sales. Therefore, we estimate the Equation 6 using localsales of the firms as outcome variable. Results are shown in Table 7.
Table 7: Effect of internationally-recognized quality certification on local sales
(1) (2)Ln local Sales Ln local Sales
Probit RF
Treated 0.136 0.173*[0.089] [0.089]
Observations 6,328 6,328Firms 3164 3164Control 2846 2846Treated 318 318
Source: Author’s estimates based on WBES and PROTEqIN using IPW Diff-in-Diff.Time varying controls for Foreign ownership, Manager Experience and own Website.Firm-level fixed effects and Country and Sector specific trends included.Clustered standard errors at firm-level in brackets.*** p<0.01, ** p<0.05, * p<0.1
21

Adopting an internationally-recognized quality certification seems to have weak risein firm’s local sales. Estimated ˆATT is positive for both methods but significant onlyfor RF. There are probably two main reasons for this finding. First, local customers(specially in developing counties as Latin American and the Caribbean) may pay littleor no attention to the firm’s business practices and quality controls. Second, since localcustomers have closer dealings with the firm, they have alternative ways to judge qualityfor themselves without requiring a certification. For example, they could interact withother firm’s customers or they could visit firm’s factory.
5.2 Export behaviorFirms may seek to signal their quality to customers in international markets. In this
case, the impact could be reflected by the firm’s entry into foreign markets, either bystarting in exporting (non-exporting firms) or by expanding exports (already exportingfirms). Hence, we estimate the Equation 6 using export condition and the amount ofexports. Results for the extensive and intensive margins of exports are shown in Tables8 and 9.
Table 8: Effect of internationally-recognized quality certification on Export Probability
(1) (2) (3) (4) (5) (6)Export Export Dir. Exp. Dir. Exp. Ind. Exp. Ind. Exp.Probit RF Probit RF Probit RF
Treated 0.074*** 0.063** 0.023 0.011 0.050** 0.042*[0.024] [0.025] [0.022] [0.023] [0.022] [0.022]
Observations 6,984 6,984 7,088 7,088 6,984 6,984Firms 3492 3492 3544 3544 3492 3492Control 3137 3137 3186 3186 3137 3137Treated 355 355 358 358 355 355
Source: Author’s estimates based on WBES and PROTEqIN using IPW Diff-in-Diff.Time varying controls for Foreign ownership, Manager Experience and own Website.Firm-level fixed effects and Country and Sector specific trends included.Clustered standard errors at firm-level in brackets. *** p<0.01, ** p<0.05, * p<0.1
22

Table 9: Effect of internationally-recognized quality certification on Exports Volume
(1) (2) (3) (4) (5) (6)Ln Exp Ln Exp Ln D. Exp Ln D. Exp Ln I. Exp Ln I. ExpProbit RF Probit RF Probit RF
Treated 0.458* 0.441* 0.694*** 0.665*** -1.905 -0.906[0.266] [0.265] [0.237] [0.250] [1.219] [1.451]
Observations 1,244 1,244 940 940 326 326Firms 622 622 470 470 163 163Control 543 543 405 405 155 155Treated 79 79 65 65 8 8
Source: Author’s estimates based on WBES and PROTEqIN using IPW Diff-in-Diff.Time varying controls for Foreign ownership, Manager Experience and own Website.Firm-level fixed effects and Country and Sector specific trends included.Clustered standard errors at firm-level in brackets. *** p<0.01, ** p<0.05, * p<0.1
Quality certification is found to increase both the extensive and intensive marginsof trade. More specifically, adopting an internationally recognized quality certificationincreases the likelihood of entering into foreign markets between 6.3 and 7.4 percentagepoints. Furthermore, firms that were already exporting increase their exports by ap-proximately 44 percent. The increase in the amount exported might have been achievedeither by exporting higher amounts to the same destinations or by entering new marketsor introducing new products. For firms already exporting, entering new markets wouldbe an argument in favor of certifications as an instrument to remove informational bar-riers that prevented them from demonstrating the quality of their products and process.This is the mechanism proposed by Volpe Martincus et al. (2010). Unfortunately, ourdataset don’t have information about export destinations or products. However, thanksto the decomposition between indirect and direct exports, we can propose an alternativemechanism explaining increases in intensive and extensive margins.
Our findings indicate that quality certifications don’t affect extensive margins ofdirect exports, but allows firms’ introduction into the indirect exports market. Also,for those firms already exporting before obtaining a quality certification, only directexports volume is increased due to certification adoption.
This evidence is consistent with the internationalization process proposed in theGlobal Value Chain literature (Gereffi et al., 2001; Pietrobelli & Rabellotti, 2010;Hernandez et al., 2014; Gereffi & Fernandez-Stark, 2016). Obtaining a quality cer-tification would promote indirect internationalization of local firms by reducing infor-mational barriers among already-international firms operating in the local markets.However, this signaling effect coming from quality certification may be not enoughto avoid other barriers for direct exports, such as language, paperwork, invoicing, or
23

sales management (Crespi et al., 2014b) affecting the capacity of firms of contactingcustomers abroad, identifying business opportunities in foreign markets, and learningabout distribution channels for their products and bureaucratic procedures (Leonidou,2004). This may be the reasons why obtaining a quality-certification promote only anindirect path to international markets.
The fact that only direct exports volume increase is consistent with the hypothesisof the existence of formal barriers impeding international access to firms’ which are notcertified. For firms already exporting directly, costs of entering into new internationalmarkets are smaller than those faced for local firms’ to becoming direct exporters.Obtaining a quality certification may be helping those firms’ to overcome formal barriersfor introducing new highly-regulated products22 into the regions they already operate,or for accessing to new regions with stronger regulation policies for the same productsthey already trade.
5.3 Finance restrictionWe observe the impact of obtaining quality certification on access to financing by
using the own perception of the firm on how access to finance represent an obstacle togrow. In the short term, it is expected that firms that achieve a quality certificationmanage to improve their financing due to an easing of credit restrictions. This might bedue to the fact that certification is a criterion in credit institutions evaluation of a firm’screditworthiness, since it is associated with better future performance. We analyze thispotential effect in Table 10.
22 This hypothesis is also consistent with learning-by-exporting theory (Silva et al., 2012) predictingan increase of sophistication in the production after entering international markets. Learning-by-exporting may be operating also among firms which start as indirect exporters and become directexporters later. Our dataset indicates that 18% of firms exclusively exporting indirectly in the firstperiod become direct exporters in the second. Also 35% stop exporting at all.
24

Table 10: Effect of internationally-recognized quality certification on perceived Financerestriction
(1) (2)Finance FinanceProbit RF
Treated -0.071** -0.062**[0.031] [0.032]
Observations 6,980 6,980Firms 3490 3490Control 3141 3141Treated 349 349
Source: Author’s estimates based on WBES and PROTEqIN using IPW Diff-in-Diff.Time varying controls for Foreign ownership, Manager Experience and own Website.Firm-level fixed effects and Country and Sector specific trends included.Clustered standard errors at firm-level in brackets.*** p<0.01, ** p<0.05, * p<0.1
Adopting an internationally-recognized quality certification leads to a reductionbetween 6 and 7 percentage points in the likelihood that firms consider access to creditas a barrier to their growth. Improving access to credit could be an important source ofgrowth for firms because it enables them to deploy long-term investments, for example,in projects to improve (or expand) productive infrastructure or increase R&D spendingleading to product and process innovations (Brito & Mello, 1995; Schiavo & Musso,2008). Moreover, this positive finding regarding access to credit can, at the same time,enhance the effects on exports due to the importance of pre- and post-export financing(Bellone et al., 2010).
5.4 Effects on ProductivityThe effects analyzed up to this point have been mainly referred to reduced infor-
mational barriers with certain agents external to the firm. Another hypothesis couldbe that firms adopting quality certification become more productive due to the imple-mentation of internationally standardized process. Hence, we estimate Equation 1 forlabor productivity and TFP. Table 11 presents the results.
25

Table 11: Effect of internationally-recognized quality certification on productivity
(1) (2) (3) (4)Labor Prod Labor Prod TFP TFP
Probit RF Probit RF
Treated 0.002 0.043 -0.089 -0.019[0.079] [0.081] [0.114] [0.121]
Observations 6,516 6,516 1,890 1,890Firms 3258 3258 945 945Control 2927 2927 841 841Treated 331 331 104 104
Source: Author’s estimates based on WBES and PROTEqIN using IPW Diff-in-Diff.Time varying controls for Foreign ownership, Manager Experience and own Website.Firm-level fixed effects and Country and Sector specific trends included.Clustered standard errors at firm-level in brackets.*** p<0.01, ** p<0.05, * p<0.1
We find no statistically significant effects of acquiring a quality certification on ei-ther labor productivity or TFP. However, certain aspects of these estimates are worthhighlighting. Since questionnaire question on raw materials has a lower response rate,the number of observations for these estimates is a third of the total, which generateshigher variance of the parameters and hampers identification of impacts. This is par-ticularly in the case for the TFP measure, which also suffers the low rate of responseto the questions about capital.
Overall, we find statistically significant positive effects on local sales, export per-formance (both for firms that previously exported and non-exporters) and on accessto credit, but not or firm productivity (both labor productivity and TFP). However,effects on local sales are only significant at 90% under one of the specifications.Positiveeffects seems to be stronger on sales to foreign customers indicating that the infor-mation asymmetries might be different with regard to each actor. The higher costsforeign customers faced in seeking out and identifying firms with desirable character-istics and signing contracts and verifying their compliance imply that the firm facesbigger obstacles in its commercial relationship with the former. In this case, obtaininga certification is more important for revealing information about the existence of suchdesirable characteristics. An alternative explanation could be that firms that acquireinternationally-recognized quality certification can improve their products and, thus,export more. But if this hypothesis were true, it would also generate an increase in itslocal sales, which is not so clear.
Moreover, we find effects on short-term outcomes but not on long-term outcomes,such as productivity. There are at least two possible explanations why no statistically
26

significant effect on the latter was found. Obtaining an internationally-recognized qual-ity certification may not, in fact, lead to increased productivity, the improvement maybe too weak to be captured by the estimate, or need more time to materialize. Thisargument reinforces the idea that the main benefit of certification is the signaling ofdesirable firm’s characteristics for certain agents, especially to foreign customers andcredit agencies.
However, given the positive effect of certification on a firm’s export potential, itmay set in motion a learning-by-exporting process, in which the firm can improveits productivity, albeit indirectly, based on the knowledge acquired after starting toexport, or through access to credit. Firms may decide to install better machinery,provide training for its employees, increase expenditure on R&D, and so forth. That is,it is expected that the increase in productivity is more an indirect consequence of theexport behavior and access to credit due to certification adoption than a direct effectof this.
Therefore, the temporal dynamic of the impact need to be taken into account.In our database, the time gap between one period and another is only four years.However, certification can occur at any intermediate point, including immediately afterresponding to the first questionnaire or immediately before responding to the second.It is therefore possible that the effect on firm productivity is not registered becauseit requires a longer window of time to materialize. Since our time-lapse is a short-runperiod, our results are consistent with (Javorcik & Sawada, 2018) in which productivityeffects are not seen until the third year of certification.
6 Falsification testsFor evaluating the robustness of our findings, we propose two alternative experi-
ments imitating our identification strategy but using different firms falsely classified astreatment group. The purpose of these experiments is to try to falsify our previous find-ings. The impossibility of reproducing the estimated effects with these methodologieswill be evidence favoring our conclusions23.
Experiment A consists on creating a false treatment group conformed by those firmswho didn’t had a Quality Certification in the first period, but in the follow up surveydeclared having a Quality Certification in process (not awarded yet). Results providedin Table 13 confirms that none of our significant previous findings can be reproducedusing in-process certification as treatment indicator. We believe this is an almost idealgroup for mimic treatment because those firms also self-selected into a certificationprocess. Finding no significant effects provides further evidence in favor of the causaleffect of effectively certifying by international quality standards. However, it can beargued that non-significant coefficients are due to the relatively smaller number of firmswith quality certification in process. For this reason, we propose a second falsification
23 We present results only for Random Forest methodology and for previous significant effect. How-ever, we checked that results can not be falsely reproduced for any method or outcome
27
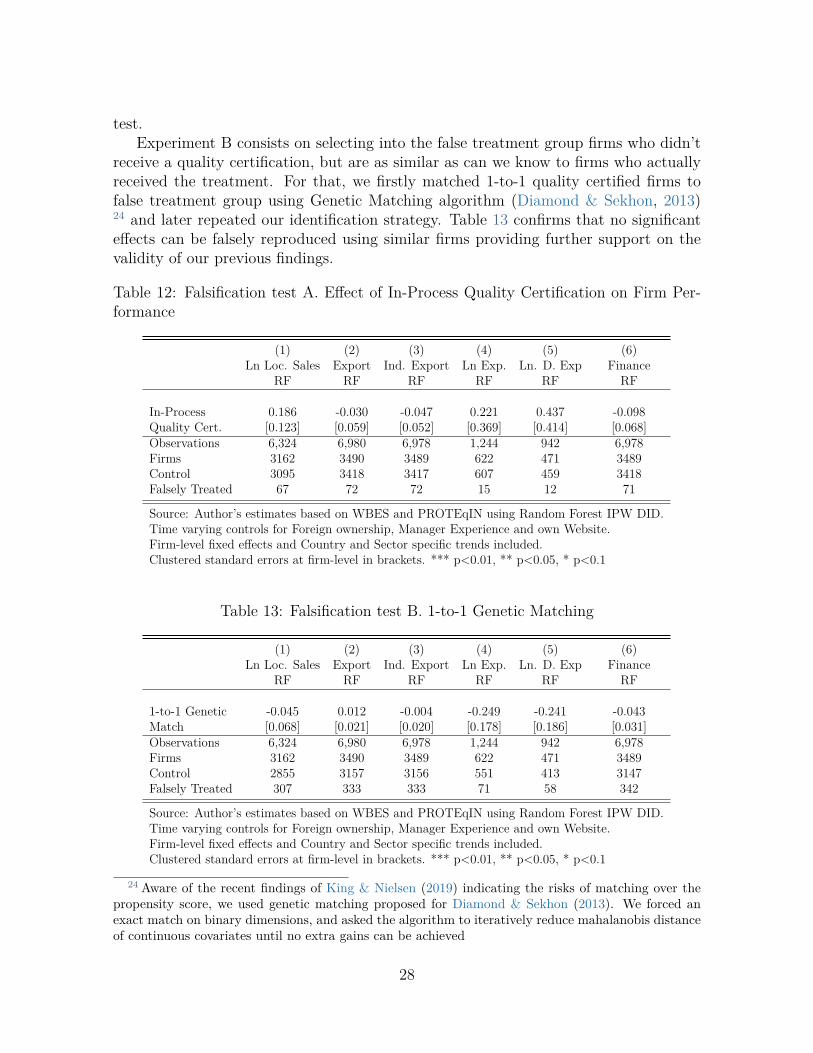
test.Experiment B consists on selecting into the false treatment group firms who didn’t
receive a quality certification, but are as similar as can we know to firms who actuallyreceived the treatment. For that, we firstly matched 1-to-1 quality certified firms tofalse treatment group using Genetic Matching algorithm (Diamond & Sekhon, 2013)24 and later repeated our identification strategy. Table 13 confirms that no significanteffects can be falsely reproduced using similar firms providing further support on thevalidity of our previous findings.
Table 12: Falsification test A. Effect of In-Process Quality Certification on Firm Per-formance
(1) (2) (3) (4) (5) (6)Ln Loc. Sales Export Ind. Export Ln Exp. Ln. D. Exp Finance
RF RF RF RF RF RF
In-Process 0.186 -0.030 -0.047 0.221 0.437 -0.098Quality Cert. [0.123] [0.059] [0.052] [0.369] [0.414] [0.068]Observations 6,324 6,980 6,978 1,244 942 6,978Firms 3162 3490 3489 622 471 3489Control 3095 3418 3417 607 459 3418Falsely Treated 67 72 72 15 12 71
Source: Author’s estimates based on WBES and PROTEqIN using Random Forest IPW DID.Time varying controls for Foreign ownership, Manager Experience and own Website.Firm-level fixed effects and Country and Sector specific trends included.Clustered standard errors at firm-level in brackets. *** p<0.01, ** p<0.05, * p<0.1
Table 13: Falsification test B. 1-to-1 Genetic Matching
(1) (2) (3) (4) (5) (6)Ln Loc. Sales Export Ind. Export Ln Exp. Ln. D. Exp Finance
RF RF RF RF RF RF
1-to-1 Genetic -0.045 0.012 -0.004 -0.249 -0.241 -0.043Match [0.068] [0.021] [0.020] [0.178] [0.186] [0.031]Observations 6,324 6,980 6,978 1,244 942 6,978Firms 3162 3490 3489 622 471 3489Control 2855 3157 3156 551 413 3147Falsely Treated 307 333 333 71 58 342
Source: Author’s estimates based on WBES and PROTEqIN using Random Forest IPW DID.Time varying controls for Foreign ownership, Manager Experience and own Website.Firm-level fixed effects and Country and Sector specific trends included.Clustered standard errors at firm-level in brackets. *** p<0.01, ** p<0.05, * p<0.1
24 Aware of the recent findings of King & Nielsen (2019) indicating the risks of matching over thepropensity score, we used genetic matching proposed for Diamond & Sekhon (2013). We forced anexact match on binary dimensions, and asked the algorithm to iteratively reduce mahalanobis distanceof continuous covariates until no extra gains can be achieved
28

7 ConclusionThis study presents empirical evidence at the firm level for the LAC region on
the determinants of adopting an internationally-recognized quality certification andtheir effects on firm performance using the WBES and PROTEqIN, surveys from 32countries in the LAC region. The results indicate that exporting firms, foreign firms,and firms with higher sales volume have the highest probabilities of obtaining a qualitycertification. We then find that obtaining a quality certification have a positive effect bysignaling desirable characteristics to firm’s external agents for whom the relationship hasmore information asymmetries. Thus, firms that obtained this certification achieved tostart exporting indirectly. Furthermore, firms already exporting directly increased theirvolume of direct exports. Effects on locals sales seems to be less important and we findpositive significant effects only in one of our strategies. They also improve their creditsituation, as they reported that access to financing was easier after certification. Wedo not find statistically significant effects of the certification on either of the measuresof firm productivity.
Our findings provide several useful considerations for productive development pol-icymakers. First, the study provides information about the types of firms most likelyto seek and achieve a quality certification. The fact that firms with more experiencedmanagers and more internationalized profile (i.e., exporters and foreign owned) aremost likely to certify may be a signal of informational barriers regarding the benefitsand requirements for quality certifications. This indicates that public intervention canplay and important role eliminating this barrier by providing public information aboutinternational business opportunities for certified firms, and also offering training pro-grams on quality process, reducing then informational costs for less experienced firmsoperating locally.
Regarding public policy design, policies or programs aimed to support certificationfor firms that require quality signaling to successfully entry (or expand) into foreignmarkets can be designed and implemented. For this purpose, those firms most ham-pered to information asymmetries must be identified. For example, policies could bedesigned with focus on local firms that wish to export products with high differentia-tion, or on those seeking to enter a global value chain. For the export process to besuccessful, these firms must demonstrate that they can produce efficiently and withhigh quality standards, reducing the risks of failures and delivery delays. This seem tobe an important tool facilitating integration between firms operating locally and moreinternationalized-firms, fostering first-time indirect exports, and providing an indirectpath for local firms to entering into global value chains.
Another role for public policy, in this case related to the domestic market could be,for example, educating local consumers about the advantages of demanding productswith higher quality standards. Such policies could stimulate the creation of incentivesfor firms to invest in achieving certification of business practices that also improve andsignal the quality of their products and processes in the local market.
Finally, the findings regarding productivity are not conclusive. The effect on firm
29

performance may depend on the time periods during which the firm implements processimprovements. In other words, it is possible that the immediate improvements are theones observed in this paper and that, over a longer period, by starting to export andreducing the credit barrier, improvements in productivity can be achieved. In this sense,two main reflections can, in principle, be made.
30

AcknowledgementsWe wish to thank Roberto Alvarez, Jose Miguel Benavente, Gabriel Casaburi, Gus-
tavo Crespi, and and participants at LACEA-LAMES 2017 for useful comments on aprevious version of this paper. This research did not receive any specific grant fromfunding agencies in the public, commercial, or not-for-profit sectors. The opinionsexpressed in this publication are those of the authors and do not necessarily reflectthe views of the Inter-American Development Bank Group, its respective Boards ofDirectors, or the countries they represent. The usual disclaimers apply.
31

ReferencesA. Smith, J. & E. Todd, P. (2005). Does matching overcome LaLonde’s critique of
nonexperimental estimators? Journal of Econometrics, 125(1-2), 305–353.
Abadie, A. (2005). Semiparametric difference-in-differences estimators. Review of Eco-nomic Studies, 72(1), 1–19.
Athey, S., Tibshirani, J., & Wager, S. (2019). Generalized random forests. Ann. Statist.,47(2), 1148–1178.
Austin, P. (2009). Balance diagnostics for comparing the distribution of baseline co-variates between treatment groups in propensity-score matched samples. Statisticsin medicine, 28, 3083–107.
Austin, P. C. (2011). An introduction to propensity score methods for reducing theeffects of confounding in observational studies. Multivariate Behavioral Research,46(3), 399–424. PMID: 21818162.
Bellone, F., Musso, P., Nesta, L., & Schiavo, S. (2010). Financial constraints and firmexport behaviour. The World Economy, 33(3), 347–373.
Benavente, J. M., Crespi, G., Figal Garone, L., & Maffioli, A. (2012). The impact ofnational research funds: A regression discontinuity approach to the chilean fondecyt.Research Policy, 41(8), 1461–1475.
Biau, G. & Scornet, E. (2016). A random forest guided tour. TEST, 25(2), 197–227.
Breiman, L. (2001). Random forests. Machine Learning, 45(1), 5–32.
Brito, P. & Mello, A. S. (1995). Financial constraints and firm post-entry performance.International Journal of Industrial Organization, 13(4), 543 – 565. The Post-EntryPerformance of Firms.
Busso, M., DiNardo, J., & McCrary, J. (2014). New evidence on the finite sampleproperties of propensity score reweighting and matching estimators. The Review ofEconomics and Statistics, 96(5), 885–897.
Castillo, V., Figal Garone, L., Maffioli, A., & Ohaco, M. (2016a). Asistencias tecnicas ycompetitividad de las MiPyMEs: Evidencia para Argentina. Technical report, Inter-American Development Bank.
Castillo, V., Figal Garone, L., Maffioli, A., Rojo, S., & Stucchi, R. (2016b). The effectsof knowledge spillovers through labor mobility. MPRA Paper No. 69141.
Castillo, V., Figal Garone, L., Maffioli, A., & Salazar, L. (2017). The causal effectsof regional industrial policies: a synthetic control approach. Regional Science andUrban Economics, 67, 25–41.
32

Crespi, G., Fernandez-Arias, E., & Stein, E. (2014a). Rethinking productive develop-ment. In Rethinking Productive Development (pp. 3–31). Palgrave.
Crespi, G., Fernandez-Arias, E., & Stein, E., Eds. (2014b). Rethinking ProductiveDevelopment. Washington: Palgrave Macmillan US.
Crespi, G., Garone, L. F., Maffioli, A., & Melendez, M. (2015). Long-term productivityeffects of public support to innovation in colombia. Emerging Markets Finance andTrade, 51(1), 48–64.
De Loecker, J. (2007). Do exports generate higher productivity? evidence from slovenia.Journal of international economics, 73(1), 69–98.
Dehejia, R. & Wahba, S. (2000). Causal effects in nonexperimental studies: Reevalu-ating the evaluation of training programs. Journal of the American Statistical Asso-ciation, 94, 1053–1062.
Diamond, A. & Sekhon, J. S. (2013). Genetic matching for estimating causal effects: Ageneral multivariate matching method for achieving balance in observational studies.The Review of Economics and Statistics, 95(3), 932–945.
Dick, G. P., Heras, I., & Casadesus, M. (2008). Shedding light on causation betweeniso 9001 and improved business performance. International Journal of Operations &Production Management, 28(7), 687–708.
Drake, C. (1993). Effects of misspecification of the propensity score on estimators oftreatment effect. Biometrics, 49(4), 1231–1236.
Duflo, E., Chernozhukov, V., Chetverikov, D., Demirer, M., Hansen, C., & Newey, W.(2017). Double/debiased/neyman machine learning of treatment effects. AmericanEconomic Review, 107(5), 261–65.
Efron, B. & Hastie, T. (2016). Computer Age Statistical Inference: Algorithms, Ev-idence, and Data Science. Institute of Mathematical Statistics Monographs. Cam-bridge University Press.
Figal Garone, L. & Maffioli, A. (2016). Impact evaluation of cluster development pro-grams: An application to arranjos produtivos locais policy in brazil. In C. Pietrobelli,R. Stucchi, & A. Maffioli (Eds.), The Impact Evaluation of Cluster Development Pro-grams: Methods and Practices. Washington, DC: Inter-American Development Bank.
Figal Garone, L., Maffioli, A., de Negri, J. A., Rodriguez, C. M., & Vazquez-Bare, G.(2015). Cluster development policy, sme’s performance, and spillovers: evidence frombrazil. Small Business Economics, 44(4), 925.
Fikru, M. G. (2014). Firm level determinants of international certification: evidencefrom ethiopia. World Development, 64, 286–297.
33

Gereffi, G. & Fernandez-Stark, K. (2016). Global value chain analysis: A primer (secondedition). Center on Globalization, Governance & Competitiveness, Duke University.
Gereffi, G., Humphrey, J., Kaplinsky, R., & Sturgeon, T. (2001). Introduction: global-isation, value chains and development. IDS Bulletin, 32(3), 1–8.
Goedhuys, M. & Sleuwaegen, L. (2013). The impact of international standards certifi-cation on the performance of firms in less developed countries. World Development,47, 87–101.
Harrison, A. & Rodriguez-Clare, A. (2010). Trade, foreign investment, and industrialpolicy for developing countries. In D. Rodrik & M. Rosenzweig (Eds.), Handbook ofDevelopment Economics 5 (pp. 4039–214). Elsevier.
Hernandez, R. A., Martınez, J. M., & Mulder, N. (2014). Global value chains andworld trade: Prospects and challenges for Latin America. ECLAC Books. EconomicCommission for Latin America and the Caribbean (ECLAC).
Hirano, K., Imbens, G. W., & Ridder, G. (2003). Efficient estimation of average treat-ment effects using the estimated propensity score. Econometrica, 71(4), 1161–1189.
Ho, D. E., Imai, K., King, G., & Stuart, E. A. (2007). Matching as nonparametricpreprocessing for reducing model dependence in parametric causal inference. PoliticalAnalysis, 15(03), 199–236.
Horvitz, D. G. & Thompson, D. J. (1952). A generalization of sampling without re-placement from a finite universe. Journal of the American Statistical Association,47(260), 663–685.
Hudson, J. & Orviska, M. (2013). Firm’s adoption of international standards: One sizefits all? Journal of Policy Modeling, 35(2), 289–306.
Imai, K., King, G., & Stuart, E. A. (2008). Misunderstandings between experimentalistsand observationalists about causal inference. Journal of the Royal Statistical SocietySeries A, 171(2), 481–502.
Imai, K. & Ratkovic, M. (2014). Covariate balancing propensity score. Journal of theRoyal Statistical Society: Series B (Statistical Methodology), 76(1), 243–263.
Imbens, G. W. (2004). Nonparametric Estimation of Average Treatment Effects UnderExogeneity: A Review. The Review of Economics and Statistics, 86(1), 4–29.
Imbens, G. W. & Rubin, D. B. (2015). Estimating the Propensity Score, (pp. 281–308).Cambridge University Press.
Imbens, G. W. & Wooldridge, J. M. (2009). Recent developments in the econometricsof program evaluation. Journal of Economic Literature, 47(1), 5–86.
34

Javorcik, B. & Sawada, N. (2018). The iso 9000 certification: Little pain, big gain?European Economic Review, 105, 103–114.
King, A. A., Lenox, M. J., & Terlaak, A. (2005). The Strategic Use of Decentral-ized Institutions: Exploring Certification with the ISO 14001 Management Standard.Academy of Management Journal, 48(6), 1091–106.
King, G. & Nielsen, R. (2019). Why propensity scores should not be used for matching.Political Analysis, (pp. 1–20).
Lee, B. K., Lessler, J., & Stuart, E. A. (2010). Improving propensity score weightingusing machine learning. Statistics in Medicine, 29(3), 337–346.
Leonidou, L. (2004). An analysis of the barriers hindering small business export devel-opment. Journal of Small Business Management, 42, 279 – 302.
Levinsohn, J. & Petrin, A. (2003). Estimating Production Functions using Inputs toControl for Unobservables. Review of Economic Studies, 70(2), 317–41.
Li, Q., Racine, J. S., & Wooldridge, J. M. (2008). Estimating average treatment ef-fects with continuous and discrete covariates: The case of swan-ganz catheterization.American Economic Review, 98(2), 357–62.
M. Robins, J. & Ritov, Y. (1997). Robins jm, ritov y. toward a curse of dimensional-ity appropriate (coda) asymptotic theory for semi-parametric models. Statistics inMedicine - STAT MED, 16, 285–319.
Mccaffrey, D., Ridgeway, G., & Morral, A. (2005). Propensity score estimation withboosted regression for evaluating causal effects in observational studies. Psychologicalmethods, 9, 403–25.
Otsuki, T. (2011). Effect of International Standards Certification on Firm-Level Ex-ports: An Application of the Control Function Approach. The Empirical EconomicsLetters, 10(7).
Pekovic (2010). The Determinants of ISO 9000 Certification: A Comparison of theManufacturing and Service Sectors. Journal of Economic Issues, 44(4), 895–914.
Pietrobelli, C. & Rabellotti, R. (2010). Upgrading to compete global value chains,clusters, and smes in latin america. Harvard University Press.
Robins, J. M. & Rotnitzky, A. (1995). Semiparametric efficiency in multivariate re-gression models with missing data. Journal of the American Statistical Association,90(429), 122–129.
Robins, J. M., Rotnitzky, A., & Zhao, L. P. (1995). Analysis of semiparametric regres-sion models for repeated outcomes in the presence of missing data. Journal of theAmerican Statistical Association, 90(429), 106–121.
35

Rosenbaum, P. R. (1987). Model-based direct adjustment. Journal of the AmericanStatistical Association, 82(398), 387–394.
Rosenbaum, P. R. & Rubin, D. B. (1983). The central role of the propensity score inobservational studies for causal effects. Biometrika, 70(1), 41–55.
Rotnitzky, A. & Robins, J. M. (1995). Semiparametric regression estimation in thepresence of dependent censoring. Biometrika, 82(4), 805–820.
Rubin, D. B. (1976). Inference and missing data. Biometrika, 63(3), 581–592.
Schiavo, S. & Musso, P. (2008). The impact of financial constraints on firm survivaland growth. Journal of Evolutionary Economics, 18, 135–149.
Silva, A., Afonso, O., & Africano, A. P. (2012). Learning-by-exporting: What we knowand what we would like to know. The International Trade Journal, 26(3), 255–288.
Starke, F. & Rangamonhan, E. (2012). Impact of ISO 9000 Certification on FirmPerformance: Evidence from Brazil. Management Research Review, 35(10), 974–97.
Sun, Y. & Outyang, W. (2014). International Standards for Exporting Firms: Evidencefrom China. The Journal of Applied Business Research, 30(6), 1753.
Syverson, C. (2011). What Determines Productivity? Journal of Economic Literature,48(2), 326–365.
Trifkovic, N. (2017). Spillover Effects of International Standards: Working Conditionsin the Vietnamese SMEs. World Development, 97(C), 79–101.
Ullah, B., Wei, Z., & Xie, F. (2014). ISO certification, financial constraints, and firmperformance in Latin American and Caribbean countries. Global Finance Journal,25(3), 203–28.
Varian, H. R. (2014). Big data: New tricks for econometrics. Journal of EconomicPerspectives, 28(2), 3–28.
Volpe Martincus, C., Castresesana, S., & Castagnino, T. (2010). ISO Standards: ACertificate to Expand Exports? Firm-level Evidence from Argentina. Global FinanceJournal, 18(5), 896–912.
Westreich, D., Lessler, J., & Jonsson Funk, M. (2010). Propensity score estimation:Neural networks, support vector machines, decision trees (cart), and meta-classifiersas alternatives to logistic regression. Journal of clinical epidemiology, 63, 826–33.
Wooldridge, J. (2007). Inverse probability weighted estimation for general missing dataproblems. Journal of Econometrics, 141(2), 1281–1301.
36

Xiaoyang Chen, M., Wilson, J., & Otsuki, T. (2008). Standards and Export Decisions:Firm-level Evidence from Developing Countries. The Journal of International Trade& Economic Development, 17(4), 501–23.
37