Quality Assurance and Quality Control by Variableimos.org.au/fileadmin/user_upload/shared/IMOS...
67
1 Quality Assurance and Quality Control by Variable Summary This is a working document designed to summarise the current status of quality assurance and quality control (QA/QC) procedures across IMOS from the perspective of the ocean variables we are measuring. This has not been done before now, and it is expected to take some time to complete (hence the description as a ‘working document’). The purpose of this document is to highlight gaps, identify priorities, and to provide an evidence base for use by the IMOS community in considering whether or not the QC procedures that we have evolved are as effective and efficient as they need to be for a sustained observing system. This document includes: 1. An Introduction which explains the background to variables being measured within IMOS and platforms and technologies being used. 2. A section on International Context, covering 2.1 Essential Ocean variables (EOVs) in the Global Ocean Observing System (GOOS) 2.2 QC within the relevant global networks (e.g. Argo) 2.3 The International Quality controlled Ocean Database (IQuOD) project, and 2.4 The US-IOOS Quality Assurance of Real-Time Ocean Data (QARTOD) project. 3. A summary of the current QA/QC procedures of IMOS variables 4. Appendices with a table indicating the existence of written protocols (A1), a summary table of key issues and recommendations per variable (A2), and a list of acronyms (A3). General points emerging from this review include: 1) QA/QC across IMOS facilities per variable is inconsistent (after taking into account sensor type and instruments), particularly when there are several facilities (and organisations) undertaking QC using different standards. 2) Some facilities used different Quality Flags (QF) for the same variable (i.e. SST). 3) The lack of a written document outlining QA/QC protocols in some facilities makes it very difficult to understand and assess their QA/QC processes. This includes QC procedures that have their methodology in several peer reviewed papers but is not compiled into a single document. (See table in Appendix 1).
Transcript of Quality Assurance and Quality Control by Variableimos.org.au/fileadmin/user_upload/shared/IMOS...

1
Quality Assurance and Quality Control by
Variable
Summary
This is a working document designed to summarise the current status of quality assurance and
quality control (QA/QC) procedures across IMOS from the perspective of the ocean variables we are
measuring. This has not been done before now, and it is expected to take some time to complete
(hence the description as a ‘working document’).
The purpose of this document is to highlight gaps, identify priorities, and to provide an evidence
base for use by the IMOS community in considering whether or not the QC procedures that we have
evolved are as effective and efficient as they need to be for a sustained observing system.
This document includes:
1. An Introduction which explains the background to variables being measured within IMOS and platforms and technologies being used.
2. A section on International Context, covering 2.1 Essential Ocean variables (EOVs) in the Global Ocean Observing System (GOOS) 2.2 QC within the relevant global networks (e.g. Argo) 2.3 The International Quality controlled Ocean Database (IQuOD) project, and 2.4 The US-IOOS Quality Assurance of Real-Time Ocean Data (QARTOD) project.
3. A summary of the current QA/QC procedures of IMOS variables 4. Appendices with a table indicating the existence of written protocols (A1), a summary table of
key issues and recommendations per variable (A2), and a list of acronyms (A3). General points emerging from this review include:
1) QA/QC across IMOS facilities per variable is inconsistent (after taking into account sensor
type and instruments), particularly when there are several facilities (and organisations)
undertaking QC using different standards.
2) Some facilities used different Quality Flags (QF) for the same variable (i.e. SST).
3) The lack of a written document outlining QA/QC protocols in some facilities makes it very
difficult to understand and assess their QA/QC processes. This includes QC procedures that
have their methodology in several peer reviewed papers but is not compiled into a single
document. (See table in Appendix 1).

2
4) Calibration of sensors is inconsistent, with similar sensors sent to different places for their
calibration.
5) For some facilities (e.g. gliders) manual QC is lost when data is re-processed, and becomes a
time consuming exercise to re-do.
6) Data from additional sensors used in some facilities (e.g. SOTS velocity and acoustic data)
has not been delivered to AODN and discussion is needed if these data are to be available
through the AODN.
7) Some EOVs need analysis of data to obtain data on an EOV (passive and active acoustics).
8) Some near real time (NRT) data is not QC’d with some variables having little to no QC
(waves)
9) QC for some facilities (biologging) is outsourced to partner organisations
10) Visual validation done of the automated/semi-automated QC from the Matlab toolbox by
Facilities/subfaciltities that use it needs improvement.
11) New QA/QC procedures have been developed or are being developed by some facilities and
are leading in their field (Acoustic tracking, Autonomous Underwater Vehicle imagery,
Radar)
12) Centralisation for the QA/QC of some variables, such as nutrients and phyto-zooplankton
has worked well, ensuring all data are treated the same and facilitating the identification of
issues.
The review suggests the following recommendations:
That all facilities without a written protocol produced one that includes the QA/QC
procedures for all variables derived from this facility. The protocol will be made available on
the IMOS or the AODN website so they can be easily accessible.
The possibility of centralising QA/QC for some variables should be discussed as a way to
solve inconsistencies in the data sets, such as sensor based observations from moorings and
SOOP.
Publication of the data in a peer review journal (such as the phytoplankton and zooplankton
databases) is good practice and should be encouraged. This gives confidence in the data and
also opens the opportunity for non-IMOS data contributions.
Implementing and developing a set of standard automated test similar to QARTOD for near
real-time QC could be a good approach for NRT data streams not currently QC’ed and in
general
Availability of the calibration results from sensors through the AODN website, and the
addition of target accuracies, error estimates per measurement (particularly needed for the
reanalysis/data assimilation community), uncertainty flags and the elimination of biased
errors where possible will improve confidence
Given we now have more than 7 years of experience with various sensors and combined
with a rich history of calibration stability and sensor issues from the IMOS community
updating the document “IMOS Data Streams and their Uncertainties” to incorporate
knowledge learnt form practical experience will be very valuable.
Defining a more rigorous process to get user feedback, which will help improve our systems
A written report of results from some Task Teams (TT) such as the O2, radiometry and
acoustic tracking TT’s are essential and expected. They represent important steps to
improve our QA/QC procedures for those variables.

3
Prepared by: Ana Lara-Lopez with input from Tim Moltmann, Sebastian Mancini, and Roger
Proctor.
Version 5: February 2017

4
1. Introduction
IMOS is funded by Australian Government as a national collaborative research infrastructure. As
such its requirements have been set by the scientific community. Science and implementation plans
were written to set out the rationale for measuring particular variables at particular time and space
scales in particular places. These plans then informed investment in a portfolio of observing
platforms and technologies to take the required observations. IMOS science and implementation
plans have been refined and developed over the years in response to changing socio-economic
drivers, new scientific knowledge, and technological development. All plans were subject to
international peer review in 2009-10. There is a single national plan supported by six more detailed
plans for the open ocean and five sub-regions collectively covering Australia’s shelf and coastal
oceans. The full package of documentation (650 pages in total) can be found here.
Development of IMOS science and implementation plans from 2009 to present has been concurrent
with revitalisation of the Global Ocean Observing System (GOOS) since the Ocean Obs’09
conference. In particular, the Framework for Ocean Observing has strongly influenced IMOS science
and implementation planning in terms of defining requirements, assessing ‘readiness’, and focusing
on essential ocean variables (EOVs).
The process of developing and refining science questions under major themes of research has led to
IMOS observing 30 variables, of which 21 are directly measured, 4 are derived measurements, 3 are
relative estimates and 2 could potentially be derived – see Table 1. These variables are being
observed/estimated using 26 different platforms and technologies (called Facilities within IMOS) –
see Table 2.
Many variables are measured by multiple Facilities (up to 18 for temperature), whereas some are
measured by only one (e.g. nekton biomass). Virtually all Facilities measure multiple variables (up to
17 at National Reference Stations). This multi–use approach is seen to be a strength of IMOS as it
increases both scientific effectiveness and operational efficiency.
Because of the way in which IMOS was developed, QC is largely done by Facility and the organisation
that hosts the Facility. Over the years there has been discussion as to whether or not this is the
most effective and efficient approach, and it is now time to focus on this issue at the whole-of-
program level. The physics, biogeochemistry, and biology & ecosystems panels of GOOS are placing
significant emphasis on the identification and specification of EOVs (see next section). So the timing
is good from this perspective. Other international efforts referenced will include:
QC within the relevant global networks (e.g. Argo)
The International Quality Controlled Ocean Database (IQuOD)
The US-IOOS Quality Assurance for Real Time Oceanographic Data (QARTOD) project.
As a first step, this report documents current QC procedures by variable (i.e. cross-Facility).
The Australian Ocean Data Network AODN Ocean Portal enables discovery, access and downloading
of data by parameter (physical, chemical, biological), and is now backed by a controlled vocabulary
service. It will be important for IMOS to ensure that work on EOVs is synchronised with the
parameter vocabularies.

5
Table 1: The variables required to address key science questions across IMOS.
Science themes
Var
iab
les
Sea
Su
rfac
e Te
mp
erat
ure
Sub
surf
ace
Tem
per
atu
re
Sub
surf
ace
Salin
ity
Surf
ace/
sub
surf
ace
cu
rren
ts
Sea
Surf
ace
Hei
ght
Sea
Stat
e (w
ave
par
amet
ers)
Oce
an s
urf
ace
vect
or
stre
ss (
win
d
par
amet
ers)
Hea
t fl
ux/
rad
iati
on
Dis
solv
ed o
xyge
n
Car
bo
nat
e Sy
stem
(p
CO
2)
Car
bo
nat
e Sy
stem
(p
H)
Car
bo
nat
e Sy
stem
(TI
C)
Susp
end
ed p
arti
cula
tes
(TSS
)
Car
bo
nat
e Sy
stem
(A
lkal
init
y)
Mac
ron
utr
ien
t co
nce
ntr
atio
n
Ch
loro
ph
yll a
/ fl
uo
resc
ence
CD
OM
Ph
yto
pla
nkt
on
sp
ecie
s
Ph
yto
pla
nkt
on
Bio
mas
s
Zoo
pla
nkt
on
Sp
ecie
s
Zoo
pla
nkt
on
Bio
mas
s
Nek
ton
Sp
ecie
s
Nek
ton
Bio
mas
s
Top
Pre
dat
ors
sp
ecie
s
Top
pre
dat
ors
– p
op
ula
tio
n
Ben
tho
s (
% c
ove
rage
of
spe
cies
)
Det
ritu
s (f
lux)
Oce
an C
olo
ur
Pri
mar
y p
rod
uct
ivit
y
Multidecadal Ocean Change
Global Energy Balance
Global Hydrological Cycle
Carbon Budget
Global Circulation
Climate Variability and Weather
Inter-annual (ENSO, IOD)
Intra-seasonal (MJO, Cyclones, ECL’s )
Boundary Currents and Inter-basin Flows
Fluxes (Mass, Heat, Salt)
Drivers
Dynamics
Continental Shelf Processes
Eddy-Shelf interactions
Upwelling/ Downwelling
Shelf Currents
Wave Processes
Ecosystem Responses
Circulation and nutrient fluxes
Productivity
Trophic connections
Distribution and abundance

6
Table 2: How variables required to IMOS science questions are delivered by IMOS facilities. Blue = directly measured variable; Red = derived variable; Orange = could be
derived; Green = relative estimate.
How facilities deliver variables across IMOS
Sea
Su
rfac
e Te
mp
erat
ure
Sub
surf
ace
Tem
per
atu
re
Sub
surf
ace
Salin
ity
Surf
ace/
sub
surf
ace
cu
rren
ts
Sea
Su
rfac
e H
eigh
t
Sea
Stat
e (w
ave
par
amet
ers)
Oce
an s
urf
ace
vect
or
stre
ss
(win
d p
aram
eter
s)
Hea
t fl
ux/
rad
iati
on
Dis
solv
e o
xyge
n
Car
bo
nat
e Sy
stem
(p
CO
2)
Car
bo
nat
e Sy
stem
(p
H)
Car
bo
nat
e Sy
stem
(TI
C)
Susp
end
ed p
arti
cula
tes
(TSS
)
Car
bo
nat
e Sy
stem
(A
lkal
init
y)
Mac
ron
utr
ien
t co
nce
ntr
atio
n
Ch
loro
ph
yll a
/ fl
uo
resc
ence
CD
OM
Ph
yto
pla
nkt
on
sp
ecie
s
Ph
yto
pla
nkt
on
Bio
mas
s
Zoo
pla
nkt
on
Sp
ecie
s
Zoo
pla
nkt
on
Bio
mas
s
Nek
ton
Sp
ecie
s
Nek
ton
Bio
mas
s
Top
Pre
dat
ors
sp
ecie
s
Top
pre
dat
ors
– p
op
ula
tio
n
Ben
tho
s (
% c
ove
rage
of
spec
ies)
Det
ritu
s (f
lux)
Oce
an C
olo
ur
Pri
mar
y P
rod
uct
ivit
y
Argo
Ships of Opportunity (SOOP)
XBT
Sea Surface Temperature
Air-Sea Fluxes
Biochemistry (pCO2)
Cont. Plankton Recorder
Bioacoustics
Tropical RV/Temperate MV
Deep water Moorings
Air-sea fluxes
Deep water arrays
Southern Ocean Timeseries
Ocean Gliders
Seagliders
Slocum Gliders
Auto. Underwater Vehicle

7
Table 2 cont: How variables required to IMOS science questions are delivered by IMOS facilities. Blue = directly measured variable; Red = derived variable; Orange = could be
derived; Green = relative estimate.
How facilities deliver variables across IMOS
Sea
Su
rfac
e Te
mp
erat
ure
Sub
surf
ace
Tem
per
atu
re
Sub
surf
ace
Salin
ity
Surf
ace/
sub
surf
ace
cu
rren
ts
Sea
Su
rfac
e H
eigh
t
Sea
Stat
e (w
ave
par
amet
ers)
Oce
an s
urf
ace
vect
or
stre
ss
(win
d p
aram
eter
s)
Hea
t fl
ux/
rad
iati
on
Dis
solv
e o
xyge
n
Car
bo
nat
e Sy
stem
(p
CO
2)
Car
bo
nat
e Sy
stem
(p
H)
Car
bo
nat
e Sy
stem
(TI
C)
Susp
end
ed p
arti
cula
tes
(TSS
)
Car
bo
nat
e Sy
stem
(A
lkal
init
y)
Mac
ron
utr
ien
t co
nce
ntr
atio
n
Ch
loro
ph
yll a
/ fl
uo
resc
ence
CD
OM
Ph
yto
pla
nkt
on
sp
ecie
s
Ph
yto
pla
nkt
on
Bio
mas
s
Zoo
pla
nkt
on
Sp
ecie
s
Zoo
pla
nkt
on
Bio
mas
s
Nek
ton
Sp
ecie
s
Nek
ton
Bio
mas
s
Top
Pre
dat
ors
sp
ecie
s
Top
pre
dat
ors
– p
op
ula
tio
n
Ben
tho
s (
% c
ove
rage
of
spec
ies)
Det
ritu
s (f
lux)
Oce
an C
olo
ur
Pri
mar
y P
rod
uct
ivit
y
Moorings
National Reference Stations
Shelf Arrays
Acidification Moorings
Passive Acoustics
Ocean Radar
WERA
CODAR
Animal Tagging
Acoustic Tagging
?
Biologging ?
Wireless Sensor Networks
Satellite Remote Sensing
Sea Surface Temperature
Sea Surface Height
Ocean Colour
Repeat Hydrography
Tide Gauges
Wave buoys

8
2. International Context
2.1. Essential Ocean variables (EOVs) in the Global Ocean Observing System (GOOS)
In developing IMOS science and implementation plans there was good guidance available for open
ocean physics via the ocean Essential Climate Variables (ECVs) of the Global Climate Observing
System (GCOS). The International Ocean Carbon Coordination Project (IOCCP) and the former GOOS
Panel for Integrated Coastal Observations (PICO) also provided guidance in their areas of focus.
However, it is only very recently that the ‘new’ GOOS panels (which in concept cover physics,
biogeochemistry, and biology & ecosystems, from open-ocean to coast) have begun defining a
comprehensive set of EOVs in a systematic fashion. This is still very much a work in progress, but it
may be useful to begin comparing this emerging set of EOVs with those being measured by IMOS
and other GOOS Regional Alliances (e.g. US IOOS).
In the table below, the 30 IMOS EOVs have been compared with 11 GCOS physics ECVs (6 surface
ocean, 2 surface atmosphere and 3 sub-surface ocean) now being reviewed by the Ocean
Observations Panel for Climate (OOPC), the 8 EOVs identified by IOCCP with its broadened
biogeochemistry mandate, and the 7 ‘first cut’ biological EOVs identified by the newly formed
Biology & Ecosystems panel.
GOOS Panel EOVs (11+9+7 = 27) IMOS EOVs (29)
Physics Panel/OOPC
1. Sea surface temperature (SST) 1. Sea Surface Temperature
2. Sea surface salinity (SSS) (gap just starting to be addressed)
3. Sea surface height 2. Sea Surface Height
(tide gauge network sits outside IMOS)
5. Sea state (Significant wave height, wave period, wave direction, maximum wave height, swell, directional spectrum, whitecap fraction)
3. Sea state (wave height, spectrum, period)
6. Sea ice (identified gap)
7. Surface currents 5. Surface currents
8. Ocean surface vector stress (Equivalent neutral winds, stress equivalent neutral winds, scalar stress)
6. Ocean surface vector stress (Wind parameters: velocity and stress)
8. Heat flux/radiation 7. Heat flux/radiation
9. Subsurface temperature 8. Subsurface temperature
10. Subsurface salinity 9. Subsurface salinity
11. Subsurface currents 10. Subsurface velocity
BGC Panel/IOCCP
1. Dissolved Oxygen 11. Dissolved oxygen
2. Inorganic macro nutrients 12. Macronutrient concentration
3. Carbonate System (DIC, Total Alkalinity, pCO2, pH (at least 2 of 4))
13. Carbonate system (pCO2, pH, alkalinity, TIC)
4. Transient tracers
5. Suspended particulates (POM, POC, PON, POP, PIC)
17. Suspended particulates (PON, POC, PIC, TSS)
6. Nitrous oxide
7. Carbon isotope
8. Dissolved organic carbon 18. CDOM
9. Ocean Colour 19. Ocean colour

9
20. Chlorophyll fluorescence
Biology & Ecosystems Panel
1. Phytoplankton biomass and diversity (Presence/Absence/Relative Abundance, Diversity/Taxonomy ,Genomic information, Pigment concentration (chlorophyll a, b, HPLC pigments), Spectral reflectance (ocean color, Primary productivity) (different methods)
21. Phytoplankton biomass and diversity (Relative Abundance, Taxonomy , Pigment concentration (chlorophyll a, b, HPLC pigments), Spectral reflectance (ocean color, Primary productivity) (different methods)
2. Zooplankton biomass and diversity 22. Zooplankton biomass and diversity
3. Marine turtles, birds, mammals abundance and distribution
23. Top Predators species
24. Top predators – population
4. Live coral cover (AIMS Long Term Monitoring Program)
5. Seagrass cover 25. Benthos (% coverage of species)
7. Macroalgal canopy (Benthos see above)
6. Mangrove cover (not currently in scope for IMOS)
7. Fish abundance and distribution 26. Nekton Species
27. Nekton Biomass
28. Detritus (flux)
29. Primary Productivity
This simple comparison indicates that, at first glance, 22 of 29 IMOS EOVs are consistent with those
emerging from the panels.
IMOS is not currently observing eight of the 27 emerging GOOS EOVs. Some of these differences are
identified gaps, some are deliberate positioning around other programs or are currently out of
scope, and some provide food for thought about future priorities. Not too much should be read into
the Biology & Ecosystems EOVs at this stage as they are very preliminary.
The work being done on EOV specification by the GOOS panels will be very helpful in this context.
IMOS may also be able to contribute to the work of the panels as we have built up some very
substantial data collections in areas where EOVs are just being defined or are under consideration.
These data holdings may prove useful in testing the utility of candidate EOVs.

10
2.2. QC within the relevant global networks (e.g. Argo)
From inception, IMOS was designed to contribute to and benefit from the Global Ocean Observing
System (GOOS), and many of the facilities operated by IMOS are embedded and contribute data to
important global networks. The table below indicates the IMOS facility and the global network to
which it contributes.
IMOS Facilities/Sub-Facilities Relevant global networks
Argo Argo
Ships of Opportunity (SOOP)
XBT Ships Observations Team (SOT)
Sea Surface Temperature
Group for High Resolution Sea Surface Temperature (GHRSST) Shipboard Automated Meteorological and Oceanographic System Initiative (SAMOS)
Air-Sea Fluxes Shipboard Automated Meteorological and Oceanographic System (SAMOS)
Biochemistry (pCO2) Surface Ocean CO2 Atlas (SOCAT), Global Ocean Acidification Observing Network (GOA ON)
Cont. Plankton Recorder
Sir Alister Hardy Foundation for Ocean Science (SAHFOS), Southern Ocean CPR (SO-CPR), Global Alliance of CPR Surveys (GACS)
Bioacoustics CLimate Impacts on Oceanic TOp Predators (CLIOTOP)
Tropical RV/Temperate MV
iQAM
Deep water Moorings
Air-sea fluxes OceanSITES
Deep water arrays OceanSITES
Southern Ocean Time series
OceanSITES, The International Ocean Carbon
Coordinating Project (IOCCP)
Ocean Gliders
Seagliders Everyone’s Gliding Observatories (EGO)
Slocum Gliders Everyone’s Gliding Observatories (EGO)
Auto. Underwater Vehicle
N/A
Moorings
National Reference Stations
N/A
Shelf Arrays N/A
Acidification Moorings
Global Ocean Acidification Observing Network (GOA ON), Surface Ocean CO2 Atlas (SOCAT)
Passive Acoustics N/A
Ocean Radar
WERA Group on Earth Observation, GEO Global High Frequency (HF) Radar Network Component
CODAR Group on Earth Observation, GEO Global High Frequency (HF) Radar Network Component
Animal Tagging
Acoustic Tagging Ocean Tracking Network (OTN)
Biologging
Marine Mammals Exploring the Oceans Pole to Pole – MEOP, Sea Mammal Research Unit – SMRU, Southern Ocean Observing System – SOOS, Ocean Tracking Network – OTN

11
Wireless Sensor Networks
Coral Reef Ecological Observation Network (CREON)
Satellite Remote Sensing
Sea Surface Temperature
Group for High Resolution SST (GHRSST)
Sea Surface Height AVISO Satellite Altimetry Data
Ocean Colour International Ocean Colour Coordinating Group (IOCCG)
Other useful resources that could inform IMOS include SeaDataNet, Copernicus Marine Environment
Monitoring Service and others.

12
2.3. International Quality controlled Ocean Database (IQuOD)
The objective of IQuOD is to construct a climate-quality ocean temperature database (later
moving to other variables), with a consistent quality control (QC) standard. The database will
be continually updated into the future – see http://www.iquod.org/index.php/home
The IQUOD project members will initially refine and agree on a common set of QC methods and
apply them to the historical database (all records that are publicly available). IQuOD Member
countries/organisations are pooling resources to apply these QC methods to historical archives being
assembled, duplicate checked and labelled with errors. The hope, once the historical archive is
assembled, is to continue adding to the database into the future.
The ‘IQUOD standard’ database, with consistent quality control that is continually updated, will be
invaluable for data assimilation, anthropogenic warming estimates, ocean heat content and sea level
change estimates.
2.4. The US-IOOS Quality Assurance of Real-Time Ocean Data (QARTOD) project
The key objective of QARTOD is to sustain a process for establishing QA/QC procedures that will:
Establish authoritative QA/QC procedures for 26 of the U.S. IOOS core variables , as
necessary, including detailed information about the sensors and procedures used to measure
the variables
Produce written manuals for these QA/QC procedures
From the list of individual QA/QC procedures and guidelines developed, define a baseline set of
QA/QC procedures that can be used for certification of RCOOS data providers
Facilitate QA/QC integration with Global Ocean Observing System (GOOS) and other
international ocean observation efforts
Engage the Federal Agencies and IOOS Regions that are part of, contribute to, US IOOS who will
use the established QA/QC procedure
Work efficiently, without duplication of effort, to facilitate the implementation of common
QA/QC procedures amongst US IOOS Partners.
Real-Time Quality Control Manuals have been produced for:
Real-Time Quality Control of Dissolved Nutrients Observations
Real-Time Quality Control of Wind Data
Real-Time Quality Control of Water Level Data
Real-Time Quality Control of In-Situ Surface Wave Data
Real-Time Quality Control of Ocean Optics Data
Real-Time Quality Control of High Frequency Radar Surface Current Data
In-situ Temperature and Salinity Data
Dissolved Oxygen Observations in Coastal Oceans
In-Situ Current Observations
Other QARTOD Quality Control Manuals
Manual for Oceanographic Data Quality Control Flags

13
3. Current status of QC in IMOS variables
The following tables show the QA/QC procedures used per variable by the different IMOS facilities. Colours used in the tables shown in the following
sections have the same meanings as in Table 1 i.e.
Blue = directly measured variable;
Red = derived variable;
Orange = could be derived;
Green = relative estimate.
1. Sea surface temperature 2. Sub surface temperature These variables include near-real time data and delayed mode data and different levels of QC are applied.
Sea surface temperature
Subsurface temperature
QC procedures near-real time QC procedures delayed mode QA Comments
Argo
Argo Quality Control Manual for CTD and Trajectory Data, includes near real-time tests. . Global OI mapping done by the GDACs help identify major sensor faults within 2-3 days.
Argo Quality Control Manual for CTD and Trajectory Data. Rigorous QC by experts. Data are eligible for DMQC after 12 months.
Sensors are compared to ship-based hydrographic and nearby recently deployed float data to diagnose any sensor drift and offsets on delayed mode QC. Consistency with satellite altimetry is checked regularly to detect sensor drifts.
Follows international convention
Ships of Opportunity (SOOP)
XBT
Automated test of similar scope to Argo, independent from the Cook book
Follows CSIRO’s Quality Control Cook book for XBT (report 221)
Several processes used as described in the Cook book
The Cook book is used for Australia, and for a subset of data run on the lines that fall under the SOT network. There are many other XBT data (Navy data) that do not get QC’d – hence the need or an ongoing iQUOD type activity

14
Sea surface temperature
Subsurface temperature
QC procedures near-real time QC procedures delayed mode QA Comments
*Sea Surface Temperature
Automated test is based on the system developed by the Center for Ocean-Atmospheric Prediction Studies (COAPS) SAMOS http://coaps.fsu.edu/woce/docs/qchbook/qchbook.htm#intro
There is no delayed mode QC. Manual QC was performed prior June 2013. Manual QC involved: visual inspection using the IDL program samos_vidat_v002.pro (/flurry/home/rverein/IMOS_QC/) to review of flags assigned by the automated QC system and for visual data examination to ensure the data consistency
Documented at http://imos.org.au/sst_data.html and in Beggs et al. (2012) and http://imos.org.au/sst_instrumentation.html Hull contact temp SBE 48 sensor tested when installed. SBE 48 sensors calibrated every 2-3 years and calibration coefficients entered into instrument access programs. SBE 38 sensors calibrated yearly. Biases differ according to vessels, location of sensor, etc. The RV Investigator ISAR has been compared with 33 other ship-borne SST radiometers, and its calibration blackbody compared to the NPL reference blackbody,
SAMOS QC slightly modified to fit BOM purposes, applied once for near-real time with no further QC. BOM own QC flags are used.
Independent routine QC/QA of the IMOS ship SST observations is performed by NOAA/NESDIS using their on-line In Situ Quality Monitor (iQuam2).
*Air-Sea Fluxes
Automated test is based on the system developed by the Center for Ocean-Atmospheric Prediction Studies (COAPS) SAMOS http://coaps.fsu.edu/woce/docs/qchbook/qchbook.htm#intro
There is no delayed mode QC. Manual QC was performed prior June 2013
No information provided but in “IMOS Data Streams and their uncertainty document” suggests yearly with radiometer maintained daily
QC based on SAMOS but slightly modify to fit BOM purposes, applied once for near-real time with no further QC. They use their own QC flags
Biochemistry (pCO2)
No near-real time QC QC at CSIRO by Marine National Facility for R/V Investigator and the IMOS facilities own protocol
Calibrated yearly, accuracy given in pCO2 QC protocol, although no QC manual is produced by MNF
QC procedure from MNF is robust, however, there is no written protocol for QC of this and other environmental variables
*Tropical RV/Temperate MV
TRV Basic QC done that is automated and includes range of acceptable/non-acceptable values TMV has its own QC by Vic EPA.
TRV: No extra delayed mode QC TMV: delayed mode QC includes calibration offsets (sensor to sample), and sensor drifts due to bio-fouling
TRV: Sensors re-calibrated every year by manufacturers. Uncertainty values provided by manufacturers, with allowances for sensor drift. Compare underway system data with CTD samples, TMV: Annual calibration in CSIRO, monthly servicing of equipment, other procedures outline in their protocol
TRV: BoM also QC the TRV data using their own system but the data is only deliver to GTS for BoM purposes. TMV: Very clear and detailed protocol

15
Sea surface temperature
Subsurface temperature
QC procedures near-real time QC procedures delayed mode QA Comments
Deep water Moorings
Deep water arrays
N/A Processing and quality control of the data are completed using Matlab routines developed in CSIRO, with some routines aligned with the IMOS toolbox and sharing the same algorithms. Data are also visually inspected by experts during the process and before submission of data.
Immediately after retrieval of each mooring, Seabird, Star Oddi, and some Nortek DW Aquadop instruments are placed in a well-mixed calibration bath on board the ship
Southern Ocean Timeseries
N/A CSIRO QC which aligns with WOCE
protocols. Calibration before and after No detailed protocol, all in
peered review papers and others
Ocean Gliders
Seagliders
No near-real time QC QC through automated standard tests. Has written protocol on the treatment of data
Calibration after one year deployment Calibration and other pre-processing and corrections applied to data
Slocum Gliders
No near-real time QC QC through automated standard tests. Has written protocol on the treatment of data
Calibration after one year deployment, Calibration and other pre-processing and corrections applied to data
Auto. Underwater Vehicle
N/A No QC Environmental data are not
QC

16
Sea surface temperature
Subsurface temperature
QC procedures near-real time QC procedures delayed mode QA Comments
Moorings National Reference Stations
Near real-time (NRT) data only available in Maria Island (MAI), North Stradbroke Island (NSI), Yongala (YON), and Darwin (DAR) NRS. Some of the relevant IMOS toolbox routines are implemented in NRT at YON and DAR
Data QC using IMOS Matlab toolbox and CTD uses the IMOS guidelines as well. QC is mostly automated and semi-automated, supervised (tuned / validated) by a technician (only rarely by an expert in oceanography). See https://github.com/aodn/imos-toolbox/wiki/QCProcedures#moored-time-series
Annual calibration Monthly CTD checks and water sampling collected
Issues with lack of validation of automated QC from Toolbox has resulted in some bad data not being flagged. This relates to data from WQM Calibration of sensors have been performed either locally, at the CSIRO facility or at the manufacturers, and is dependent on the needs and sub-facility. According to new definitions of SST, 5-10m temperature is regarded as “foundation” SST. Most moorings only measure temperatures below 20 m, and none measure the skin SST. Buoys that usually measure within the top 1m (Yongala, Darwin & Beagle)
Shelf Arrays
NRT data available only in QLD&NT. Automated QC done with own code that borrows from Matlab toolbox
Data QC using IMOS Matlab toolbox and CTD uses the IMOS guidelines as well. QC is mostly automated and semi-automated, supervised (tuned / validated) by a technician (only rarely by an expert in oceanography). See https://github.com/aodn/imos-toolbox/wiki/QCProcedures#moored-time-series
Annual calibration Deployment and post-recovery CTD checks are made in a calibration bath.
Issues with lack of validation of automated QC from Toolbox has resulted in some bad data not being flagged. This relates to data from WQM Calibration of sensors have been performed either locally, at the CSIRO facility or at the manufacturer’s, and is dependent on the needs and sub-facility.
Acidification Moorings
Automatic QC Temperature corrected based on pre and post deployment calibrations, although no corrections have been necessary to date
Sensor calibrated pre and post-deployment at NATA test facility

17
Sea surface temperature
Subsurface temperature
QC procedures near-real time QC procedures delayed mode QA Comments
Biologging
No QC Done by MEOP. A location AC will be implemented within IMOS in the near future
Done by MEOP MEOP is doing the QC data. It includes a standard set of tests, adapted from Argo standard quality-control procedures, is first run to remove bad profiles, spikes, and outliers. Temperature and salinity adjustments are then determined, which vary from tag to tag, and they are applied identically to all profiles from a given tag
Wireless Sensor Networks
In house procedures, no protocol written. Automated QC and sometimes manual QC if there is something evidently wrong
N/A QC done on a data stream by data stream basis by the facility (i.e. the hard and soft limits vary for each data stream) with values are constantly tweaked during the manual QC.
Satellite Remote Sensing
Sea Surface Temperature
International Group for High Resolution Sea Surface Temperature (GHRSST) “GDS 2” file formats provide QC flags (“l2p_flags” and “quality_level”) and uncertainty estimates (“sses_bias” and “sses_standard_deviation”). See http://imos.org.au/sstdata0.html.
International Group for High Resolution Sea Surface Temperature (GHRSST) “GDS 2” file formats provide QC flags (“l2p_flags” and “quality_level”) and uncertainty estimates (“sses_bias” and “sses_standard_deviation”). See http://imos.org.au/sstdata0.html..
Satellite SST data is validated with drifting buoys, moorings, Argo and SOOP SST. See http://imos.org.au/sstdata_validation.html. Gridded data are provided at quality level 2 (worst),3, 4 and 5 (best) based on GHRSST guidelines. See http://imos.org.au/sstdata0.html.
It is important to consider the spatial scale of the observations at which each platform measures this variable. Some platforms observe throughout the
water column, other ones at one point in the water column, and others only at the surface.
Key points:
1. Sub-facilities follow their own protocol for QA/QC, with few linked to international programs (e.g. Argo, XBT)
2. Some QA/QC procedures are more robust than others, with some facilities not doing any QC (AUV) for this variable.
3. QC for some facilities (biologging) will be/is outsourced
4. Most of the moorings (shelves, deepwater and NRS) use similar QC procedures that include or are aligned to the IMOS toolbox

18
5. SST from ships of opportunity has different QC applied, depending on the agency processing the data, i.e. BoM will do an automated QC and apply
its own QC flagging system while AIMS TRV will do basic QC and apply the IMOS QC flags.
6. Some near real-time data is not QC (e.g. gliders, some moorings, some SOOP BGC)
7. While there are some facilities with written protocols, there are many that don’t.
Issues:
1. QC results produced by the toolbox need visual validation by the NRS and Shelves moorings sub-facilities in order to avoid bad data not being
flagged.
2. A separate issue with moorings is that not all sub-facilities send their instruments to a central place for calibration, however, this is being corrected.
3. The consistency of the QC’ed SST data from the different vessels (SOOP SST, TMV, TRV and SOOP BGC) is variable, including the QF (quality flags).
This can lead (has led) to some confusion from people downloading and using the data. Additionally, there is variation in the temporal frequency of
the data delivered, with TMV facility delivering data at very high temporal frequencies (1 second) in comparison to other SST data from BOM (SOOP
SST) or AIMS (TRV) (10 seconds).
4. While there are written protocols for some facilities, it does not include the QA/QC of all the variables derived from the facility as this is dependent
of the organisation that performs the QC. For example, SOOP BGC has a written protocol for the BGC variables but there is no written
documentation on the MNF QC protocol for the physical variables from this facility. This is being corrected.
5. There is currently limited knowledge within IMOS of the QC work performed at MEOP, there is a preliminary strategy in place should MEOP stop
QC’ing the biologging data, but this needs to be fully formed.
Recommendations
1. The Australian National Mooring Network Steering Committee (ANMN SC) has agreed to re-process the relevant mooring datasets and improve the
QC performed on them. There needs to be improvement on the visual validation of Toolbox QC results as well as more guidance and agreement on
a standard use of the Toolbox. A task team (TT) will be proposed to develop a document that would try to describe a consistent methodology on
how to QC a mooring dataset with the toolbox.
2. Centralising the calibration of sensors, where possible, will be a good strategy for consistency in the QA. In addition, documenting the process by
the calibration provider is also needed.
3. It is important that all facilities have a written document on their QA/QC protocols and make them available. This will facilitate the querying of the
QA/QC procedures and give users confidence in the data.
4. The AODN is currently harvesting the MEOP QC data (which includes IMOS), some thought should be given if the outsourcing of the QC is the best
strategy for IMOS regarding the QA/QC of these data sets, and some involvement from IMOS should be discussed with MEOP.

19
5. Discussion is needed on how to handle the QA/QC and file formatting of the SST data from SOOP, TRV, NMF and TMV in order to provide a
consistent data set that is not dependent on the agency that processes the data. Centralising the QC to one agency could be one way to solve this
issue.
6. It would be beneficial to update the document “IMOS Data Streams and their Uncertainties” that reflects the current situation, sensors and
processes

20
3. Sub surface salinity
Subsur
face Salinity
QC procedures near-real time QC procedures delayed mode QA Comments
Argo
Argo Quality Control Manual for CTD and Trajectory Data, includes near real-time tests
Argo Quality Control Manual for CTD and Trajectory Data. Rigorous QC by experts. Data are eligible for DMQC after 12 months. Where target accuracy is not achieved, the estimated accuracy is captured in the error fields for each observation. Salinity data with errors larger than 0.05 psu are deemed uncorrectible and are flagged as bad data.
Sensors are compared to ship-based hydrographic data and nearby Argo float data to determine if any sensor drift or offset occurs and it can be corrected through delayed mode QC. To identify drift and to permit the correction of the drift in the conductivity sensors, the conductivity data from the floats are compared to existing climatological databases, and compared to nearby floats. A thermal lag correction is also applied which is dependent on the CTD pump rate and float ascent rate.
Argo’s target accuracy is 0.01 psu.
Ships of Opportunity (SOOP)
Biochemistry (pCO2)
No near-real time QC except on RTM Wakmatha where data go through range checking and have a QC procedure applied (e.g, ensuring adequate flow).
QC at CSIRO Marine National Facility for R/V Investigator and the facility’s own protocol.
Calibrated yearly, accuracy given in pCO2 QC protocol, although no written QC manual is produced by MNF. However, Investigator sensor is maintained and checked regularly against calibrated CTD sensors and bottle samples. Aurora Australis and Wakmatha calibrated yearly, and checked against salinity samples.
No written protocol for QC of this and other environmental variables from MNF
Tropical RV/Temperate MV
TRV Basic QC done that is automated and includes range of acceptable/non-acceptable values. TMV has its own QC by Vic EPA.
TRV: No extra delayed mode QC TMV: delayed mode QC includes calibration offsets (sensor to sample), and sensor drifts due to bio-fouling
TRV: Sensors calibrated every year by manufacturer. Uncertainty values provided by manufacturers, with allowances for sensor drift. Underway system data compared with CTD samples TMV: Annual calibration in CSIRO, monthly servicing of equipment, other procedures outline in their protocol
TRV: A new tool has been developed at AIMS to improve QC procedures, known as the Data Visualization and Quality Control tool. TMV: Very clear and detailed protocol
Deep water Moorings
Deep water arrays
N/A Processing and quality control of the data is completed using Matlab routines developed by CSIRO, with some routines aligned with the IMOS toolbox and sharing the same algorithms. Data are also visually inspected by experts during the process and before submission of data.
Immediately after retrieval of each mooring, Seabird, instruments are placed in a well-mixed calibration bath on board the ship. Offsets and drifts are applied as needed, though this is rare with well prepared SBE37s’.

21
Subsur
face Salinity
QC procedures near-real time QC procedures delayed mode QA Comments
Southern Ocean Timeseries
Facility’s own procedure, aligned with WOCE protocols.
PSAL Derived from conductivity and temperature using EOS-80. SBE16 and SBE37Derived from Pressure, Temperature (IPTS68) and Conductivity using PSS 1978 equations.
Ocean Gliders Seagliders No near-real time QC Automated standard tests. Has written
protocol on the treatment of data Calibration after one year deployment, weight distribution and balance done in lab before every mission
Slocum Gliders No near-real time QC Automated standard tests. Has written
protocol on the treatment of data Calibration after one year deployment, weight distribution and balance done in lab before every mission
Auto. Underwater Vehicle
N/A No QC Environmental data are not QC
Moorings National Reference Stations
NRT data only available in MAI, YON, and DAR. Automated QC done in YON and DAR with AIMS code that borrows from Matlab toolbox. No automated QC on MAI and NSI
Data QC using IMOS Matlab toolbox and CTD uses the IMOS guidelines as well. QC is mostly automated and semi-automated, supervised (tuned / validated) by a technician (only rarely by an expert in oceanography). See https://github.com/aodn/imos-toolbox/wiki/QCProcedures#moored-time-series
Calibration roughly once a year.
There are issues with the WQM, which has been unreliable for many measurements including salinity (conductivity), although recently there has been an improvement in its performance, i.e. good comparison between bottle salinity and WQM measurements, as in published results of Feng et al. (2015). However, there is still a need to systematically assess this.
Issues with lack of validation of automated QC from Toolbox has resulted in some bad data not being flagged. This relates to data from WQM .
There has been issues with sub-facilities not keeping conductivity data, which will allow a better assessment on the data
Calibration of sensors have been performed either locally, at the CSIRO facility or at the manufacturer’s, and is dependent on the needs and sub-facility.

22
Subsur
face Salinity
QC procedures near-real time QC procedures delayed mode QA Comments
Shelf arrays
NRT data available only in QLD&NT. Automated QC done with own code that borrows from Matlab toolbox
Data QC using IMOS Matlab toolbox and CTD uses the IMOS guidelines as well. QC is mostly automated and semi-automated, supervised (tuned / validated) by a technician (only rarely by an expert in oceanography). See https://github.com/aodn/imos-toolbox/wiki/QCProcedures#moored-time-series.
Calibration roughly once a year
Same issues as above
Acidification Moorings
Automated QC QC at CSIRO using the facility’s own protocol, with bottle samples (from NRS sampling) used to check the salinity calibrations and corrections applied where necessary.
Calibration pre and post-deployment
Animal Tagging
Biologging
No QA/QC Done by MEOP. A location AC will be implemented within IMOS in the near future
QA/QC to be done by MEOP MEOP QC data includes a standard set of tests, adapted from Argo standard quality-control procedures, is first run to remove bad profiles, spikes, and outliers. Temperature and salinity adjustments are then determined, which vary from tag to tag, and they are applied identically to all profiles from a given tag
Wireless Sensor Networks
Own procedures, no protocol written. Automated QC and sometimes manual QC if there is something evidently wrong
N/A Bounds checking using soft and hard limits. Checks against historical data where this is available Checks against reference sensors
QC done on a data stream by data stream basis (i.e. the hard and soft limits vary for each data stream) with values are constantly tweaked as we do the manual QC.
Key points:
1. Sub-facilities follow their own protocol for QA/QC, with few linked to international programs (e.g. Argo, XBT)
2. Some QA/QC procedures are more robust that others, with some facilities not doing any QC for this variable (AUV).
3. QC for some facilities (biologging) is outsourced
4. Most of the moorings (shelves, deepwater and NRS) use similar QC procedures that include or are aligned to the IMOS toolbox
5. Some near real-time data is not QC (gliders, some moorings, some SOOP BGC)
6. While there are some facilities with written protocols, there are many that don’t.
Issues:
23
1. QC results produced by the toolbox need visual validation by the NRS and Shelves moorings sub-facilities in order to avoid bad data not being
flagged.
2. A separate issue with moorings is that not all sub-facilities send their instruments to a central place for calibration, however, this is being corrected.
3. Some ANMN sub-facilities did not extract the raw conductivity data (from which salinity is derived) to make sure spikes are not an instrument issue,
the data will be re-processed to add it
4. There is a general lack of information on the calibration results.
5. Some protocols indicate the calculations used to derive salinity, while many do not state it.
6. While there are written protocols for some facilities, it does not include the QA/QC of all the variables derived from the facility as this is dependent
of the organisation that performs the QC, i.e. SOOP BGC has a written protocol for the BGC variables but there is no written documentation of the
QC protocol undertaken by MNF for the physical variables for this facility
7. There is currently limited knowledge within IMOS of the QC work performed at MEOP, there is a preliminary strategy in place should MEOP stop
QC’ing the biologging data, but this needs to be fully formed.
Recommendations
1. The Australian National Mooring Network Steering Committee (ANMN SC) has agreed to re-process the relevant mooring datasets and improve the
QC performed on them. There needs to be improvement on the visual validation of Toolbox QC results as well as the use of the Toolbox. A task
team (TT) will be proposed to develop a document that would try to describe a consistent methodology on how to QC a mooring dataset with the
toolbox.
2. Centralising the calibration of sensors, where possible, will be a good strategy for consistency in the QA. In addition, documenting the process by
the calibration provider is also needed to improve confidence in the data
3. It would be highly beneficial for all facilities to have a written protocol and make them available. This will facilitate the querying of the QA/QC
procedures and give users confidence in the data.
4. The AODN is currently harvesting the MEOP QC data (which includes IMOS), some thought should be given if the outsourcing of the QC is the best
strategy for IMOS regarding the QA/QC of these data sets, and some involvement from IMOS should be discussed with MEOP. Similar to ANMN,
conductivity needs to be stored if reprocessing is needed in the future.
5. It would be beneficial to update the document “IMOS Data Streams and their Uncertainties” that reflects the current situation, sensors and
processes

24
4. Surface/subsurface currents Surface/subsurface
currents QC procedures near-real time QC procedures delayed mode QA Comments
Argo Argo
Position data are QC’d as per Argo manual
Consistency is checked with float timing information and past positions
Limited to date, largely through global synthesis products.
Average velocity is derived from float dive and surfacing positions. Change of sat localisation from Service Argos to GPS has seen a major accuracy increase.
Deep water Moorings
Deep water arrays
N/A QC of the ADCP data (equivalent to the application of the IMOS Teledyne QC procedures). These tests examine the diagnostic variable output from the RDI ADCP instruments (echo amplitude, correlation magnitude, percent good, error velocity and velocities). The IMOS side-lobe test is also applied. Data are also visually inspected by experts during the process and before submission of data.
Inter comparison with other instruments, ocean models and surface currents are used to verify the acoustic measurements. Several parameters are looked at to ensure the heads are working during deployment ADCP are currently not calibrated, though generally tidal analyses can be used to identify any major amplitude or direction drifts; interbeam and correlation information allows single beam failures to be detected.
Undertake their own QC but it is aligned with IMOS QC toolbox.
Ocean Gliders
Seagliders
Not Qc UCUR and VCUR are depth-mean velocities of the seawater over all the water that the glider travels through between surfacing. The values are approximate estimates derived from engineering parameters.
Velocity estimation calculated using the two GPS positions taken after the glider resurfacing
These current estimations are not very accurate because their calculation relies on many simplifications and assumptions
Slocum Gliders
Not QC UCUR and VCUR are depth-mean velocities of the seawater over all the water that the glider travels through between surfacing. The values are approximate estimates derived from engineering parameters
Velocity estimation calculated using the two GPS positions taken after the glider resurfacing
These currents estimations are not very accurate because their calculation relies on many simplifications and assumptions
Moorings National Reference Stations
NRT data only available from Yongala and Darwin
IMOS Matlab toolbox for QC for moorings and CTD uses the IMOS guidelines as well. See https://github.com/aodn/imos-toolbox/wiki/QCProcedures#moored-time-series
Calibration of ADCP for current speed is not required, however, ADCP compass calibration and other physical measurements made by the instrument do require calibration. Pre-deployment checks are made for compass and tilt,
Automated and semi-automated QC applied.
Shelf Arrays
NRT data available only in QLD&NT. Automated QC done with own code that borrows from Matlab toolbox
IMOS Matlab toolbox for QC for moorings and CTD uses the IMOS guidelines as well. See https://github.com/aodn/imos-toolbox/wiki/QCProcedures#moored-time-series
Calibration of ADCP for current speed is not required, however, ADCP compass calibration and other physical measurements made by the instrument do require calibration. Pre-deployment checks are made for compass and tilt,
Automated and semi-automated QC applied.
Ocean Radar
WERA
Not QC QC developed by the facility, however, the documentation was not transferred when the facility moved to UWA. The current leadership is developing new QC procedures and now has a preliminary
Periodic and extensive calibrations of all the radar electronic components, performed every 3 months
There is no international QC standard procedure for WERA, but QARTOD is providing RT QC manuals, to which IMOS has contributed. Signal-to-Noise Ratio (SNR) is accepted as a proxy for data quality both for

25
manual for offline QC describing procedures that can also be applied in RT model
WERA and SeaSonde radial currents. WERA radars (Doppler peak width, separation of 1st and 2nd order for radials; GDOP or GDOSA for vector maps) are considered valid proxies for data quality.
CODAR
Not QC. The current leadership is developing new QC procedures.
No specific QAQC procedures were developed at JCU for SeaSonde radars. QA procedures also include some periodic calibrations but were not documented in the logs since the beginning. The current leadership is developing new QC procedures.
Periodic and extensive calibrations of all the radar electronic components, performed every 3 months
There are QC procedures developed by the radar community with new ones being proposed, but they're not universally accepted. The CODAR QC complies with the best-practices. Signal-to-Noise Ratio (SNR) is accepted as a proxy for data quality both for WERA and SeaSonde radial currents. Additional metric is either specific to SeaSonde systems (MUSIC peak width, single VS dual solution for the radials; geometry of the intercepting beams –or GDOP- and GDOSA for the vectors)
Satellite Remote Sensing
Sea Surface Height
Estimated from calibrated satellite data, see below under SSH
Estimated from calibrated satellite data, see below under SSH
Geostrophic surface current velocity is estimated using sea surface height anomaly calculated from SRS SSH and tide gauges.
Each observing platforms observes velocity at different scales and regions. For example, radars will estimate surface velocity at a local scale while satellites will be estimating at broadscale. Moorings will be measuring in a depth binned manner throughout the water column, except for the surface. Gliders provide a depth average estimate as the glider travels through between surfacing. Key points:
1. There is no universal agreement on the QA/QC approach for radar currents within the radar group and the scientific community is split between the two major technologies.
2. QC procedures developed in house for WERA but not SeaSonde. Currently tests are being performed on a new data format for ocean radar currents, that is being developed within the international HF radar community. Similarly, tests are being performed for the near real-time and offline quality-control procedures, in accordance with the IOOS (Integrated Ocean Observing System) “Manual for Real-Time Quality Control of High Frequency Radar Surface Current Data”.
3. SSH linked internationally to contribute calibrated and validated SSH data from which surface currents are derived 4. The Matlab toolbox is used for QC of the data for moorings by the different sub-facility leaders.
Issues: 1. Bonney Coast and GBR radars not optimized to monitor the regions. 2. Calibration of ADCP for current speed is not required, however, ADCP compass calibration and other physical measurements made by the
instrument do require calibration. Recommendations:

26
1. ADCPs can be acoustically calibrated and there is suggestions for the CSIRO facility to purchase the necessary acoustic equipment to calibrate ADCP acoustically
2. Discussion may be needed about the utility of the Bonney Coast and GBR radars and how to improve them 3. ADCP QA checks to ensure the data outputs are consistent and sensible are highly valuable. A facility or prescribed method to undertake a check of
current speed/compass integrity would be recommended.

27
5. Sea Surface Height
Sea
Surface Height
QC procedures near-real time
QC procedures delayed mode
QA Comments
Satellite Remote Sensing
Sea Surface Height
Follow standard procedure Follow standard procedure
for the mooring and GPS
processing with a step in the
data processing for the
satellite calibration
processes
Fine checks are carried out
around the time of the
satellite overflight
The sub-facility contributes a
continuous absolute bias
data stream, or time series,
to the Ocean Surface
Topography Science Team
(OSTST), vital to deliver final
‘calibrated and validated’
Geophysical Data Records
(GDRs) to the global
oceanographic community.
It directly contributes to the
calibration and validation of
the Jason-series satellite
altimeters within the
framework of the OSTST
Sub-facility contributes internationally to deliver calibrated and validated SSH data. The only one in the southern hemisphere. Key points:
1. The facility does not follow a fixed protocol, however, they follow a standard procedure for the mooring and GPS processing with a step in the data processing for the satellite calibration purposes. Fine checks are carried out around the time of the satellite overflight (~10 days).
Recommendation: 1. While the facility follows standard procedure to calibrate satellite SSH, providing some written documentation would be beneficial as an
information source

28
6. Sea State (wave height, spectrum, period) Sea state QC procedures near-real time QC procedures delayed mode QA Comments
Deep water Moorings
Southern Ocean Timeseries
N/A CSIRO QC procedures based on inter-
comparison of wave height from the different sensors
No information given No protocol written
Moorings National Reference Stations
Acceptable on board processing for statistical analysis and error detection allows NRT QC
No QC performed. Pre-deployment checks on ADCP made
Most research users of wave data would prefer to start from the raw data.
It is currently expected that users use their own software or that provided by the manufacturers to satisfy themselves of the integrity of the data. The manufacturer provides both on board (for NRT data) and post deployment software.
Shelf moorings
Acceptable on board processing for statistical analysis and error detection allows essential NRT QC
There is an experimental Nortek AWAC at One tree east (GBROTE) mooring, data it flagged as experimental and there is a need to remove mooring motion from it
Pre-deployment checks on ADCP made
Ocean Radar
WERA
Not QC Data processing involving temporal and spatial averaging is being set up to improve the data.
The WERA radar system needs to be optimise for waves or currents, and currently it is used for currents.
The optimization of the wera systems for wave would require a major work. Data not available in portal, just through the thredds server
Key points:
1. QC of wave data from SOTS is done in CSIRO and involves sensor inter-comparison 2. There is essential manufacturer QA/QC for the IMOS wave data from moorings in NRT and delayed mode. Some data are considered experimental
only. 3. There are no written protocols available for the QA/QC of these data in most facilities. Manufacturers and QARTOD protocols are available 4. The radar facility is looking at improving the wave data and has produced a report, although the radar set up was specifically designed for currents
Issues: 1. Rudimentary or not QC
Recommendations: 1. Given the increase interest in wave data, it may be important to start considering QC these data set and provide a written protocol of the QA/QC
procedures. It is important to consider the purpose for the use of these data as QC requirements may vary. NOTE: Radar wave spectrum data are available through thredds

29
7. Ocean surface vector stress (wind parameters: speed, direction and stress)
Ocean surface vector stress
QC procedures near-real time QC procedures delayed mode
QA Comments
Ships of Opportunity (SOOP)
Air-Sea Fluxes
BoM automated test is based on the system developed by the Center for Ocean-Atmospheric Prediction Studies (COAPS) SAMOS http://coaps.fsu.edu/woce/docs/qchbook/qchbook.htm#intro
No further QC Acoustic wind velocity and direction measurements are validated by design and calibration is not needed. Pre-deployment verification is needed for functionality
Deep water Moorings
Air-sea fluxes
BoM automated test is based on the system developed by the Center for Ocean-Atmospheric Prediction Studies (COAPS) SAMOS http://coaps.fsu.edu/woce/docs/qchbook/qchbook.htm#intro
No further QC No information provided but in “IMOS Data Streams and their uncertainty document” it suggests that wind sensor uncertainty is a combination of the intrinsic sensor uncertainty, combined with a 2° uncertainty in installation orientation. Yearly calibrations suggested
Literature on CFD modelling of flow around the buoy and its impact on accuracy should be referenced as well as differences between dual sensors.
Moorings National Reference Stations
Rudimentary near real time QC No further QC Wind sensors are replaced with new
so no re-calibrations
Ocean Radar
WERA
N/A N/A Wind data is output from model. However comparing it with in situ data, the radar wind information matches quite well all the temporal scales with high spectral coherence
Wireless Sensor Networks
Wind velocity data is QC’s by using an upper limit only due to the natural variability. Averages over 10 and 30 minutes are undertaken. Wind direction is smoothed but not QC because of the difficulty of that data stream
N/A
Key points:
1. Wind velocity data only, QC in BoM, using the same automated QC used for all other variables, namely: SST, Air-sea fluxes, and others.
2. Rudimentary QC is undertaken in all other facilities.
Recommendations:
1. QARTOD manuals suggest that expert QC should be considered for both speed and direction of winds, along with comparisons with other
observations such as Satellite. This could be a possibility to improve the data we are currently serving.
2. There is also the potential to use remote sensing scatterometer data/and or reanalysis data to detect major errors.

30
8. Heat flux/radiation NOTE: Sensible and latent heat fluxes have traditionally been estimated through bulk formulae with the aid of the observations of SST, near surface air temperature and humidity, surface winds, waves, and surface air pressure.
Heat
flux/radiation QC procedures near-real time QC procedures
delayed mode Comments
Ships of Opportunity (SOOP)
Air-Sea Fluxes
BoM automated test is based on the system developed by the Center for Ocean-Atmospheric Prediction Studies (COAPS) SAMOS http://coaps.fsu.edu/woce/docs/qchbook/qchbook.htm#intro
No further QC No information provided but the document “IMOS Data Streams and their uncertainty” it suggests that wind sensor uncertainty is a combination of the intrinsic sensor uncertainty, combined with a 2° uncertainty in installation orientation. Yearly calibrations suggested
Parameters measured are: wind speed and direction, air temperature, air humidity, air pressure, precipitation, solar radiation (down welling short-wave), infrared radiation (down welling long-wave), sea surface temperature (at 1m depth), and sea surface salinity.
Deep water Moorings
Air-sea fluxes
BoM automated test is based on the system developed by the Center for Ocean-Atmospheric Prediction Studies (COAPS) SAMOS http://coaps.fsu.edu/woce/docs/qchbook/qchbook.htm#intro
No further QC No information provided but the document “IMOS Data Streams and their uncertainty” it suggests that wind sensor uncertainty is a combination of the intrinsic sensor uncertainty, combined with a 2° uncertainty in installation orientation. Yearly calibrations suggested
Parameters measured: wind direction and speed, relative humidity, air pressure, air and water temperature, sunlight and precipitation, as well as oceanographic measurements including salinity and conductivity
QA/QC of air-sea fluxes are done by BoM for both SOOP and SOFS using the same automated QC system.

31
9. Dissolved oxygen
Dissolved oxygen
IMOS QC procedures near-
real time
QC procedures delayed mode QA Comments
Argo
The quality control procedures on the near real-time data are limited and automatic.
QC procedure for oxygen databased on a modified approach from Takeshita et al. 2013 through a comparison of Argo float data to the climatology CARS 2009. Oxygen correction coefficients are estimated for a linear regression of float vs climatological percent oxygen saturation. The MATLAB GUI that has been developed allows the assessment of the correction with various modifications (gain only, gain and offset, offset only terms, winter months and ascent rate filters, mixed layer and deep layer filters).
To verify the climatology-based QC procedure corrected float data are compared to calibrated oxygen profiles taken on deployment of several floats when available. Calibration protocols using air O2 measurements need to be incorporated in the future to account for dynamic errors of sensors.
Strict QC procedures have yet to be agreed upon and implemented for dissolved oxygen by Argo data centres. The current Argo quality control procedures are specified in the Argo quality control manual for dissolved oxygen concentration available here: http://archimer.ifremer.fr/doc/00354/46542/ REF: Takeshita et al, 2013. A climatology-based quality control procedure for profiling float oxygen data. JGR. 118, 5640-5650.
Deep water Moorings
Air-sea fluxes
N/A There is no documentation on the QC, it follows WOCE protocols. The only documentation available is the sensors’ calibration history.
Sensors are calibrated by CSIRO using and CSIRO calibrations using the Winkler method. Sensor drift is also checked, characterised and corrected pre and post deployment calibration. Cross check with other sensors, with uncertainty estimated.
Two different O2 sensors deployed. Sea Bird SBE43 Clark cell oxygen sensors along with Aanderaa 3975 (3830 with adaptor) Optode.
Sensor failure has been far more common in the data set for SBE43 electrodes than Aanderaa or SBE63 Optodes., with SBE43 showing a higher sensor drift. However, this sensor is still useful for comparison The SBE43 data has also shown that the optode data can take 0-2 weeks to stabilise once put into the water. Within certain accuracy the SBE43 is still a very useful sensor.
Southern Ocean Timeseries
N/A Similar to the above, QC is conducted by CSIRO,
follows WOCE protocols Similar to the above
Ocean Gliders
Seagliders No QC for near real time
This parameter is visually checked and manually flagged for QC
Slocum Gliders
No QC for near real time
Careful QC conducted on data. Improvement of dissolved oxygen data made by recomputing dissolved oxygen data with time shifted bphase data and temperature data from the fast response CTD
The raw parameters from the optodes are only available for datasets where gliders were deployed after mi-2011, which prevent the facility to improve the oxygen data of datasets anterior to mid-2011.
There is a method to back-calculate the phase measured by the optode which will allow this correction for Slocum

32
glider missions, since 2008. However, the facility has not yet correct the data for the oldest missions (before 2011), where only the oxygen concentration and oxygen saturation are available.
Moorings National Reference Stations
NRT data only available in MAI, DAR and YON
Measurement of dissolved oxygen using modified winkler titrations for water samples are needed to check the quality of the data but these data are only collected at Maria Island and more recently Rottnest Island. Moored WQM oxygen sensors: SBE43 sensors are used in IMOS WQM's. There is limited QC done on the data
The CTD sensors are calibrated intermittently at CSIRO, Hobart. The WQM sensors are calibrated before deployments
The SBE43 used in CTD is a fast response, but suffer from a high failure rate and variable drift.
Without bottle calibration data, the NRS CTD profiles are of limited use. AIMS Townsville has the capability to do Winkler titrations
For the moored WQMs occasional sensor failure and lack of calibration water samples at most sites make these data difficult to use.
There is a suggestion of problems with oxygen calibration from CSIRO, that could be 10-15 uM out.
Acidification Moorings
No QC for NRT QC performed in CSIRO Moored optical oxygen sensors are calibrated pre and post deployment using high quality winkler titrations. Sensors are checked for sensor drift over time, which is typically very low
QC is to a high standard
Optical sensors are accurate and show low drift
Key points:
1. QA/QC undertaken by facility.
2. Issue with high failure rate of the O2 sensors in WQM and CTD in the ANMN facility
3. Moored optical oxygen sensors used in acidification moorings show low and linear drift with time and deliver an accuracy of about 0.5% or better.
Issues
1. WQM O2 sensors and CTD SBE43 sensors suffer from high failure and winkler titrations are needed to cross check the WQM and CTD data.
2. Winkler titrations for cross checking sensors are only carried out in MAI and ROT due to the equipment needed to conduct them. The lack of these
titrations on other NRS makes their data difficult to use, although there is potential for Qld NRS to do titrations with AIMS equipment.
Recommendations:

33
1. That a report is produced by the O2 Task Team giving recommendations for sensors available, uses, target accuracies and precisions required (e.g.
Future Oceans EOV¹s) and options and recommendations for calibration and maintenance for O2 sensors.
2. That optical oxygen sensors are used on NRS with 6-12 monthly calibrations and data processing using well defined and available techniques.
3. A fast response sensor like the Seabird SBE63 or Aanderaa 4330F sensors may be needed for a profiling CTD. Initial tests at Maria Island using bottle
samples provide a way to ensure the sensors can be used for profiling prior to purchasing a number for other NRS CTD's.

34
10. Carbonate System (pCO2, pH, Total. Inorg. Carbon, Alkalinity )
pCO2 pH Total. Inorg.
Carbon Alkalinity
QC procedures near-real time
QC procedures delayed mode QA Comments
Ships of Opportunity (SOOP)
Biochemistry (pCO2)
pCO2 data is calibrated daily using a zero and span gas and the calibrations applied in real time
Data is carefully QC in CSIRO for pCO2. After completion of the quality control checks, the measured mole fractions are corrected to final values using measurements of four CO2-in-air standards made every 3 hours when the system is operating at sea.
A number of parameters are used to establish that the system is functioning correctly.
Data are QC post-cruise.
QC to a high standard
A protocol for QC is available for this facility.
Deep water Moorings Air-sea fluxes N/A pCO2 sensor is from PMEL
NOAA, they perform the QA/QC for this data
These data are not in the portal
Southern Ocean Time series
N/A TCO2 and TAlk samples analysed using techniques developed for measurements in ocean waters on CO2/CLIVAR sections
The accuracy of the methods used are checked against certified reference material from SIO
TCO2 and alkalinity analyses do follow the most up to date measurement protocols.
Moorings National Reference Stations
N/A TCO2 and TAlk samples analysed using techniques developed for measurements in ocean waters on CO2/CLIVAR sections.
The accuracy of the methods used are checked against certified reference material from SIO
Protocol very well described.
Data is from water samples.
pH is not derived from this facility
Acidification Moorings
At each measurement of pCO2, a zero and span gas is used to calibrate the sensor response and determine the CO2 value.
QC performed by CSIRO. .
All sensors are calibrated before and after deployments. . pCO2 sensors are calibrated at each measurement point using a zero and span gas. Diagnostic parameters are checked and any parameters that are questionable and can influence the final pCO2 value are flagged along with pCO2. pH is calibrated on the total pH scale with calibration data calculated from total dissolved inorganic carbon and total alkalinity samples. The sensors are preconditioned in seawater prior to deployment
The pH sensors have been tested at Maria Island and data for the past 12 months and tests indicate these data are now ready for deployment on other moorings

35
IOCCP have defined these variables collectively as ‘the carbonate system’ – need to measure 2 of 4 Key points:
1. Data from all facilities are QA/QC to a good high standard, all linked to international standards 2. pH is delivered only by one sub-facility
Recommendations
1. Deliver pH data to AODN where available and consider implementation on SOOP and CO2/acidification moorings 2. A written protocol from SOTS consolidating all their QC for all their variables is necessary
NOTE: SOTS methods are the same as used elsewhere in IMOS. The new protocols referred to are part of a larger update and have not changed compared to earlier methods. The only difference is the reference and pH, TCO2 and alkalinity for SOTS and elsewhere, the latest protocols are

36
11. Macronutrient concentration
Macronutrient
concentration QC procedures near-real time
QC procedures delayed mode QA Comments
Deep water Moorings
Southern Ocean Timeseries
N/A Follows GO-SHIP protocols. http://www.go-ship.org/HydroMan.html. Nutrients collected are Si, NO3 and PO3. There is also a sensor for NO3
Follows GO-SHIP procedures, analyses are carried out by MNF/CSIRO hydrochem group
There are issues with the NO3 sensor because of biofouling and it is not recommended for use at fixed point sites.
Moorings National Reference Stations
N/A They have their own NRS BGC manual and protocol where they set the detection limits based on Go-SHIP. QA/QC is centralised in Hobart CSIRO
Method detection limits and precision for nutrients are determined for each run using standards. Accuracy is determined using KANSO reference material of nutrients in seawater (RMNS).
Key points:
1. Currently very sparse nutrient observations based on water samples. 2. Bio-fouling issues with NO3 sensor when moored.
Issues 1. Satlantic ISUS NO3 sensor appears to be good in profiling mode such as Argo, maybe gliders. This can open up the potential to have more
observations at larger scales. Recommendations:
1. The centralization of nutrient analysis in Hobart is a good approach as it makes the data consistent.

37
12. Ocean colour 13. Chlorophyll a/ fluorescence
Ocean
Colour Chlorophyll a concentration
QC procedures near-real time QC procedures delayed mode QA Comments
Ships of Opportunity (SOOP)
Cont. Plankton Recorder
N/A Phytoplankton Colour Index is
estimated and has 4 levels
depending on the greenness of
the silk.
Methods described in peer review
publication
Although the phytoplankton colour
assessment is done 'by eye', there is
very close agreement between CPR
analysts on the estimated colour of
silks.
Phytoplankton colour index has
proven to be a good index of
phytoplankton biomass
(chlorophyll) estimate
fluorometrically and from satellite
(see Richardson et al. (2006) for
more information).
Tropical RV/Temperate MV
TRV Basic QC done that is automated and includes range of acceptable/non-acceptable values. TMV has its own QC by Vic EPA.
TRV: No extra delayed mode QC TMV: delayed mode QC includes calibration offsets (sensor to sample), and sensor drifts due to bio-fouling. Scale factor and the offsets for the variables (fluorescence, turbidity and salinity) are applied.
TRV: Sensors calibrated every year by manufacturer. Uncertainty values provided by manufacturers, with allowances for sensor drift. TMV: regular cleaning of the sensors to minimise fouling. Salinity and chlorophyll-a samples taken during service as a calibration check. Annual calibration to assess long-term drift
TRV: DALEC radiometer on board for in situ validation of ocean colour TMV: Very clear and detailed protocol
Deep water Moorings
Air-sea flux
N/A PAR sensor data is QC by BOM using their automated QC program. WQM data is QC by CSIRO.
Wet Labs provide a calibration for the sensors output to Chlorophyll-A (ug/l) equivalent, CSIRO calibration lab provides a calibration for the sensor output to Fluorescein solution concentration (ug/l).
Surface photosynthetically active radiation and surface UV are measured, to help assess light available for phytoplankton production.
Sensors include Wetlabs FLNUTS sensor, LiCor PAR sensor, Wetlabs ECO PAR sensor.
Southern Ocean Timeseries
N/A No more information provided Wet Labs provide a calibration for the sensors output to Chlorophyll-A (ug/l) equivalent, CSIRO calibration lab provides a calibration for the sensor output to Fluorescein solution concentration (ug/l).
The relationship between Fluorescein concentration and Chlorophyll-A concentration is not provided by Wet-Labs.

38
Ocean Gliders
Seagliders
No QC for near real time Measured as fluorescence. QC done using calibration coefficients. Data QC on the bio-optical data stream flags only the most obvious of outliers as bad data, thus QC for this parameters is manual.
Sensors are sent overseas for calibration. There is a standard performance test procedure for pre- and post-deployment on glider ecopucks.
Serious effort needs to be made to interpret bio-optical data streams from gliders.
Additionally, there is an issue with manual QC, in that when data are reprocessed the manual QC flags are removed during the re-processing so QC needs to be re-done again manually
The last BOWG suggested that having a calibration facility in Australia will help reduce the time spent sending instruments overseas.
The BOWG produced a document for QA, however it is not clear if this has been applied. The document does not seem to be available online.
Slocum Gliders
No QC for near real time Measured as fluorescence. QC done using calibration coefficients. Sensors are sent overseas for calibration. There is a standard performance test procedure for pre- and post-deployment on glider ecopucks. Data QC on the bio-optical data stream flags only the most obvious of outliers as bad data, thus QC for this parameters is manual.
Sensors are sent overseas for calibration. There is a standard performance test procedure for pre- and post-deployment on glider ecopucks.
Serious effort needs to be made to interpret bio-optical data streams from gliders.
Additionally, there is an issue with manual QC, in that when data are reprocessed the manual QC flags are removed during the re-processing so QC needs to be re-done again manually
The last BOWG suggested that having a calibration facility in Australia will help reduce the time spent sending instruments overseas.
The BOWG produced a document for QA, however it is not clear if this has been applied. The document does not seem to be available online.
Auto. Underwater Vehicle
N/A Not QC No QA
Moorings National Reference Stations
NRT data only at MAI, YON, DAR and NSI
Detail protocol for the collection of samples and the HPLC analysis for Chl-a concentration. WQM measures fluorescence and phytoplankton (pigments)
Calibration is not centralised so each subfacility will get their sensors calibrated at different places. Experimental project being undertaken to improve the data collection and interpretation
Conversion from fluorescence to CHl-a is difficult
An experimental project undertaken by CSIRO to help interpret the observations collected by the WQM fluorescence sensors is

39
Key points:
1. QA/QC undertaken by facility 2. Conversion from fluorescence to Chl-a concentration can be difficult 3. In situ HPLC Chl-a conc. provides Chl-a concentration with high accuracy at the NRS 4. An experimental project to calibrate and convert fluorescence data from WQM using algal cultures is currently underway, and there are other
regional efforts, particularly in WA and SA to implement low Chla calibrations and instrument response
5. Calibration is not centralised within the ANMN 6. There is a radiometry TT underway to look at calibrations and sensor inter-comparisons
Issues: 1. The is a lot of work needed for the WQM to calibrate and convert fluorescence to Chla 2. Many facilities do not have a detail protocol written 3. The WQM fluorescence conversion using algal cultures is experimental, results have not been published and converted data has not been given to
AODN 4. An issue with moorings is that not all sub-facilities send their instruments to a central place for calibration, this has recently been corrected.
Recommendations 1. That results from the project to convert fluorescence from WQM to Chl-a be published and a detailed protocol written. This project will help the
conversion by considering the regional differences as well as sensor differences. It will be helpful if this project includes all WQM and not only the NRS ones (i.e. Lucinda, SOTS and other shelf moorings).
samples are collected to check the WQM sensor performance
underway. This is done by calibrating and converting fluorescence to Chla from the WQM using different algal cultures. This has been done in MAI and NSI and will be expanded to all NRS.
CSIRO WA are devoting some efforts on the instrument response to low concentrations.
SARDI implementing local low range Chl-a calibrations
Satellite Remote Sensing
Ocean Colour
n/A DALEC from Solander has currently minimal QC but will include similar checks to Lucinda in the future. At LJCO several routines from the toolbox are used to QC the data from WQM.
A radiometry TT has been created and will deliver a report on the laboratory absolute calibrations and inter-comparison, relative intercomparison and field inter-comparison at LJCO and recommendations as to how radiometry should be organised / developed in IMOS for the future
This facility provides the in-situ observations for validation of Ocean colour from satellites

40
2. Discussion is needed to clarify if results from the experimental project to convert WQM fluorescence to Chl-a data is to be used to process all WQM fluorescence data (including historical data).
3. That recommendations from the radiometry TT are implemented once the TT is finished. 4. Centralising calibration of sensors will be ideal and more efficient 5. All facilities should have written protocols available 6. Bottle pigment samples could be used to calibrate the WQM data in situ, and maybe needed because of site variations in the community
composition.

41
14. CDOM 15. Suspended particulates (PON, PIC, POC, TSS)
CDOM
Suspended particulates
QC procedures near-real
time
QC procedures delayed mode QA Comments
Deep water Moorings
Southern Ocean Timeseries
N/A PON, POC and PIC are collected with the sediment trap and analysis follows JGOFS protocols
Follows JGOF protocols PON, POC and PIC is collected in this facility. This is consistent with the subvariables for the Suspended particles EOVs from IOCCP The facility has a backscatter sensor, which could be converted into a TSS or POC units. However, it is not being done and it would have very limited validity. The backscatter sensor is currently being used as a control on the phytoplankton ce signal
Ocean Gliders
Seagliders
No QC for near real time
Data QC on the bio-optical data stream flags only the most obvious of outliers as bad data, thus QC for this parameters is manual.
Pre and post deployment calibrations and tests done. The facility has slowly compiled a ‘climatology’ for bio-optical parameters from glider missions around Australia and used it to help in the assessment of extreme values A document has been prepared this year to describe the calculation of a particle backscattering coefficient (BBP, m-1)
There is an issue with manual QC, in that when data are reprocessed the manual QC flags are removed during the re-processing so QC needs to be re-done again manually
Slocum Gliders
No QC for near real time
Data QC on the bio-optical data stream flags only the most obvious of outliers as bad data, thus QC for this parameters is manual.
Pre and post deployment calibrations and tests done. A document has been prepared this year to describe the calculation of a particle backscattering coefficient (BBP, m-1)
Same comments as above
Moorings National Reference Stations
N/A CDOM is measured with the Ecotriplet. This sensor will not be used anymore because of the instruments have yielded very inconsistent data and the issues have been difficult to diagnose.
Annual calibrations are performed by the manufacturer Wetlabs Calibration by the manufacturer may not be appropriate to Australian waters and require more frequent pre- and post-deployment local calibrations. TSS and CDOM measured from water samples
TSS and CDOM are currently measured from a pooled sample spaning from 0-50m. This does not make the data very useful so there will be a change implemented with TSS and CDOM measured from a sample at the surface.
There are plans to measure CDOM from water samples at the NRS to help satellite validation.
TSS is collected but there has been trouble with the blank (control) samples. This is currently under investigation
Satellite Remote Sensing
Ocean Colour
N/A CDOM and TSS are measured at LJCO with CDOM
fluorescence measured with a WETLabs WETStar
fluorometer, particulate and dissolved spectral
absorption and attenuation coefficients using a
No information given but follows similar procedures of NRS for water samples
Water samples in LJCO have been collected, however, these data are not in the AODN yet, but will be delivered soon. The samples are QC and analysed as per NRS by CSIRO team

42
WETLabs AC-S and, total backscattering
coefficients using a WETLabs BB9 radiometer.
Lucinda Jetty Coastal Observatory (LJCO) data are
processed in two steps, first all data including BB9
and Wetstar are applied two QC, min / max check
and rate-of-change check. These conditions are
flagged with bit masks, and is converted to IMOS
compliant QC.
Key points:
1. The water samples collected at Lucinda and the NRS are QC and analysed as per NRS protocol by CSIRO team. 2. There is no written protocol for LJCO and Gliders for these variables
Issues: 1. There are issues with measuring the TSS from the pooled sample collected at NRS, this is currently under review to resolve the issues. 2. Data from water samples taken at LJCO are currently not delivered to AODN, although there are plans for the delivery of these data soon. 3. There is an issue with manual QC from gliders, in that when data are reprocessed the manual QC flags are removed during the re-processing so QC
needs to be re-done again manually
4. There are issues with the filters used for the collection of TSS samples from IMOS (see NOTE below) Recommendation:
1. The change from the pooled sample to the stratified samples in will allow the use of the CDOM and TSS samples for satellite validation purposes. 2. A protocol on the QA/QC should be available for all facilities 3. Data from LJCO water samples should be delivered to AODN
NOTE: There has been some discussion around the collection of the TSS samples; IMOS TSS samples are collected on pre-weighed GF/F filters and the TSS is
split into an organic and inorganic fraction, with protocols for TSS analysis for the remote sensing community is to use GF/F filters. AIMS in their non-IMOS
work (MMP) collect TSS on a membrane filter which cannot be used to separate the inorganic and organic fractions. There are also issues with
contaminated blanks. Further discussion ensued and it was decided that a comparison between filters types and blanks analysis will be undertaken

43
16. Phytoplankton biomass and diversity Phytoplankton
divesity Phytoplankton
Biomass QC procedures near-real time
QC procedures delayed mode QA Comments
Ships of Opportunity (SOOP)
Cont. Plankton Recorder
N/A All phytoplankton identification has been standardised to the correct current classification as given by the World Register of Marine Species (WoRMS) There is a detailed protocol they use for flagging data.
Protocol that considers data entry measures, taxonomic measures, naming conventions and ID rules. ID rules from SAHFOS
The CSIRO database holds all the raw data, for example original species names and ambiguous records, from these datasets, and researchers can request further information from the corresponding author if required Their protocol also includes plastics
Deep water Moorings
Southern Ocean Timeseries
N/A All phytoplankton identification has been standardised to the correct current classification as given by the World Register of Marine Species (WoRMS)
None indicated but may follow similar rules as the NRS
Moorings National Reference Stations
N/A. Detailed protocol for the collection and analysis of samples that include same sample analysis by two different analysts for QC purposes.
Same as for CPR, but follows Sedgwick Rafter square for ID rules
Phytoplankton (pigments) samples are collected to check the WQM sensor performance. This type of variable is done with water samples that need to be analysed in lab.
Key Points: 1. All the phytoplankton data is managed centrally making these data consistent. 2. Regular taxonomic training and comparison of our identification with overseas labs also increases consistency 3. In addition, the publication of the phytoplankton database in Nature Scientific Data was an opportunity to get the IMOS and other data in a consistent
and standard way. It should be encouraged for other data sets.

44
17. Zooplankton biomass and diversity
Zooplankton diversity
Zooplankton Biomass
QC procedures near-real
time
QC procedures delayed mode QA Comments
Ships of Opportunity (SOOP)
Cont. Plankton Recorder
N/A ID done is guided by the library of taxonomic keys the facility has assembled. It follows procedures described in Richardson et al 2006.
There is a detailed protocol they use for flagging data..
A suite of taxonomic guides is used for identification, with the main one being the online guide “Diversity and Geographic Distribution of Marine Planktonic Copepods”, which summarizes the taxonomic literature over the past 130 years and is regularly updated
Bioacoustics
N/A In-house tools developed to assist with data management and help identify and prioritise subsets of data for post-processing. Data cleaned from background and intermittent noise. Defined metrics for data quality.
Vessels are calibrated according to the procedures recommended in the ICES CRR 144 document (Foote 1987). In the case of ES60 systems, the calibration data is pre-processed to eliminate the possibility of bias of up to +/- 0.5 dB. At a minimum vessels will ideally be calibrated annually
The bio-acoustic data has the potential to deliver information on biomass and to a certain extent species. However, the data needs to be analysed before that information can be estimated from observations and it requires in depth knowledge of acoustic data.
It is likely that expert user would like to have access to the raw data
Moorings National Reference Stations
N/A Dry weight analysis undertaken for biomass following standard procedures. Species ID keys used to identify organisms. The ID of these observations are carried out by the same lab that does SOOP CPR and thus both data sets are consistent.
There is a detailed protocol they use for flagging data.
A taxonomic key for Australian zooplankton was created from this and the CPR datasets
Deep water Moorings
Southern Ocean Timeseries
N/A No QC No QA Some SOFS and FluxPulse moorings have had a 4-frequency acoustic water column profiler which provides information on zooplankton and fish abundances and their vertical diel migrations.
Key Points: 1. The management of the zooplankton data from SOOP and ANMN into a central laboratory makes these data consistent. 2. A taxonomic key for Australian zooplankton was created from these data sets as a collaboration between IMOS, UTas and CSIRO and is available online
http://www.imas.utas.edu.au/zooplankton/home 3. Bioacoustic data is QC to international standards following the ICES WGFAST recommendations 4. Bioacoustic data will need analysis to estimate zooplankton biomass 5. Regular taxonomic training and comparison of our identification with overseas labs increases consistency
6. The zooplankton data set has been published in Ecology

45
Issues: 1. There is an multifrequency acoustic system in SOTS, however, the data has not been given to AODN Recommendations: 1. Serious discussion is needed on extra data sets from sensors added by facilities but not integrated to IMOS

46
18. Nekton Species 19. Nekton Biomass
Nekton Species
Nekton Biomass
QC procedures
near-real time
QC procedures delayed mode QA Comments
Ships of Opportunity (SOOP)
Bioacoustics
N/A In-house tools developed to assist with data management and help identify and prioritise subsets of data for post-processing. Data cleaned from background and intermittent noise. Defined metrics for data quality.
Vessels are calibrated according to the procedures recommended in the ICES CRR 144 document (Foote 1987). In the case of ES60 systems, the calibration data is pre-processed to eliminate the possibility of bias of up to +/- 0.5 dB. At a minimum vessels will ideally be calibrated annually
The bio-acoustic data has the potential to deliver information on biomass and to a certain extent species. However, the data needs to be analysed before that information can be estimated from observations and it requires in depth knowledge of acoustic data.
It is likely that expert user would like to have access to the raw data
Animal Tagging
Acoustic tagging
N/A QC includes the 1) identification of false tag detections, 2) distance test, 3)velocity test, 4) species distribution test and 5) distance from release location test. Additional QC tests are carried out on the tag metadata: 1) validation of the species name, 2)comparison of release date, 3) comparison of release location
All data from the Animal Tracking Facility’s arrays are typically serviced and uploaded on an annual basis; all collaborating projects have their own servicing schedule. Information related to the receiver, tags, species ID is entered into the database by researchers at the onset of the project and is updated once receivers are downloaded or tags are released
Data from this sub-facility includes IMOS as well as contribution from other parties. False detection QC procedures have been published in the scientific literature
The full QC procedure is being finalised and has been successfully applied to all data available in the animal tracking database
A scientific publication is in preparation for publication
Key points:
1. Both facilities have good QA/QC procedures 2. Bio-acoustic data is QC to international standards. 3. The acoustic animal tracking facility is the first to set standards for these observations, with false detection analysis. Information has been peered
review and published and can be found here: https://animalbiotelemetry.biomedcentral.com/articles/10.1186/s40317-015-0094-z

47
20. Top Predators species 21. Top predators – population
Top
Predators species
Top predators
– population
QC procedures near-real
time
QC procedures delayed mode QA Comments
Moorings Passive Acoustics
The data is scrutinised for notable events and to assess data quality.
The passive acoustic moorings are typically serviced every 10-12 months, with the duty cycle giving an 11-12 month duration. On recovery the instruments are calibrated post deployment and check everything is working.
Data is currently supplied in its raw format only, although a software product CHORUS has been made available to facilitate analysis of these datasets
Animal Tagging
Acoustic Tagging
QC includes the identification of false tag detections using several different approaches and the protocol is available in the IMOS facility website.
All data from the Animal Tracking Facility’s arrays are typically serviced and uploaded on an annual basis; all collaborating projects have their own servicing schedule. Information related to the receiver, tags, species ID is entered into the database by researchers at the onset of the project and is updated once receivers are downloaded
Data from this sub-facility includes IMOS as well as contribution from other parties. The false detection QC was applied to all the data available in the animal tracking database.
False detection QC procedures have been published in the scientific literature
Biologging No QC No QC, but they are discussing ways to QC the accuracy
of the spatial information. See avobe
Key points:
1. Data is QC in both the passive acoustic moorings and the animal acoustic tagging facilities. Animal movement and presence/absence information can
be extracted from these data, however, population information will need different techniques.
2. There is no written QA/QC protocol for passive acoustic. A software product, CHORUS, to analyse the IMOS Passive Acoustic data sets has been
provided by Curtin.
Recommendations: 1. That all facilities write a protocol for QA/QC that is publicly available

48
22. Benthos (% coverage of species)
Benthos (%
coverage of
species)
QC procedures near-real
time
QC procedures delayed mode QA Comments
Auto. Underwater Vehicle
N/A Optical imagery is delivered as individual high resolution, colour corrected images (geotiffs) and also in processed form, as mosaics and 3D seafloor reconstructions. Specialised software Squidle used for annotations
Each of the high resolution imaging missions are typically flown at a fixed altitude above the seafloor. All data products are precisely georeferenced using state-of-the art terrain-aided navigation algorithms. Standard annotation scheme (CATAMI) was adopted but proved to be too restrictive
Two reviews of the benthic monitoring program were conducted this year with recommendations for improvement of the program given.
Reviews for the entire program looked at improving the workflow as well as improving diagnostics and robustness in the tools required for retrieving data from the vehicles, converting the data to account for issues with lighting, computing geo-referenced information for the imagery, generating integrated mosaics and 3D structural models and uploading the data to online archives.
While there is no written protocol for QA/QC, two reviews of the program had been undertaken to look at issues with the sampling design, standardise annotation software development and uptake of the data. Key points from the review:
1. Annotation happens outside the AODN through the software Squidle. The updated Squidle+ software will be able to handle larger data sets with flexible annotation. Members of the community agreed to upload their annotated data.
2. CATAMI has been too restrictive, so a flexible annotation scheme will be implemented. 3. There has been discussions with AODN to support closer integration with Squidle and the AODN portal and to facilitate the inclusion of additional
data sources as part of the NeCTAR Ocean Sciences cloud. Recommendations from the review relevant to QA/QC:
1. That the IMOS AUV Facility steering committee review the campaign planning and design of dives at sites around the country to ensure that a consistent methodology is adopted and that future data collected by the facility can be compared and conclusions drawn on a national basis to support the broadscale objectives of the program.
2. That the facility should accelerate the transition to higher resolution imagery to improve description of benthos. 3. That the next generation of online annotation tools be designed to support flexible classification schemes. 4. To form a scientific steering committee with representation from the major groups involved in this work helps to set priorities for the IMOS
Integrated Benthic Monitoring program, secure ship time, assist with fieldwork and lead the analysis of the resulting data streams

49
23. Detritus (flux)
Detritus
(flux) QC procedures near-
real time QC procedures delayed mode QA Comments
Deep water Moorings
Southern Ocean Timeseries
N/A Sinking particles to estimate carbon fluxes are collected with the SAZ sediment trap. QA/QC follows JGOFS protocols.
Follows JGOFS protocol The SAZ sediment trap mooring collects sinking particles to quantify carbon fluxes,
Key points:
1. Follows international convention for QA/QC. This is the only facility that collects these observations. 2. No written protocol

50
APPENDIX 1
Table: Indication of how facilities undertake QA/QC per variable and if written protocols are available. Purple: written international protocol that is available online, Green: Written protocol in development, Grey: written organisation protocol, Yellow: incomplete protocol written or lacks detail, Pink: no written protocol but procedures can be found in literature; Blue: QC but no written protocol; Red: no QC. * No written protocol, but use the IMOS Matlab toolbox;
How facilities deliver variables across IMOS
Sea
surf
ace
tem
per
atu
re
Sub
su
rfac
e te
mp
erat
ure
Sub
surf
ace
salin
ity
Surf
ace/
sub
surf
ace
curr
ents
Sea
Su
rfac
e H
eigh
t
Sea
stat
e (w
ave
par
amet
ers)
Oce
an s
urf
ace
vect
or
stre
ss (
win
d
par
amet
ers)
Hea
t fl
ux/
rad
iati
on
Dis
solv
ed o
xyge
n
Car
bo
nat
e sy
stem
(p
CO
2)
Car
bo
nat
e sy
stem
(p
H)
Car
bo
nat
e sy
stem
(TI
C)
Car
bo
nat
e sy
stem
(A
lkal
init
y)
Susp
end
ed p
arti
cula
tes
Mac
ron
utr
ien
t co
nce
ntr
atio
n
Ch
loro
ph
yll a
/flu
ore
scen
ce
CD
OM
Ph
yto
pla
nkt
on
div
ersi
ty
Ph
yto
pla
nkt
on
Bio
mas
s
Zoo
pla
nkt
on
div
ersi
ty
Zoo
pla
nkt
on
Bio
mas
s
Nek
ton
div
ersi
ty
Nek
ton
Bio
mas
s
Top
Pre
dat
ors
sp
ecie
s
Top
pre
dat
ors
– p
op
ula
tio
n
Ben
tho
s (
% c
ove
rage
of
spec
ies)
Det
ritu
s (f
lux)
Argo
Ships of Opportunity (SOOP)
XBT
Sea Surface Temperature
Air-Sea Fluxes
Biochemistry (pCO2)
Cont. Plankton Recorder
Bioacoustics
Tropical RV/Temperate MV
Deep water Moorings
Air-sea fluxes
Deep water arrays

51
Southern Ocean Timeseries
Ocean Gliders
Seagliders
Slocum Gliders
Auto. Underwater Vehicle
Moorings
*National Reference Stations
*Shelf Arrays
Acidification Moorings
Passive Acoustics
Ocean Radar
WERA Experimental
Experimental
CODAR
Animal Tagging
Acoustic Tagging
Biologging
Wireless Sensor Networks
Satellite Remote Sensing
Sea Surface Temperature
Sea Surface Height
Ocean Colour

52
APPENDIX 2. KEY POINTS, ISSUES AND RECOMMENDATIONS PER VARIABLE
Variable Key Points Issues Recommendations
Sea surface temperature
Subsurface Temperature
Sub-facilities follow their own protocol for QA/QC, with few linked to international programs (e.g. ARGO, XBT)
Most of the moorings (shelves, deepwater and NRS) use similar QC procedures that include or are aligned to the IMOS toolbox
QC results produced by the toolbox need visual validation by the NRS and Shelves moorings sub-facilities in order to avoid bad data not being flagged.
The Australian National Mooring Network Steering Committee (ANMN SC) has agreed to re-process the relevant mooring datasets and improve the QC performed on them. There needs to be improvement on the visual validation of Toolbox QC results as well as more guidance and agreement on a standard use of the Toolbox. A task team (TT) will be proposed to develop a document that would try to describe a consistent methodology on how to QC a mooring dataset with the toolbox.
A separate issue with moorings is that not all sub-facilities send their instruments to a central place for calibration, however, this is being corrected.
Centralising the calibration of sensors, where possible, will be a good strategy for consistency in the QA. In addition, documenting the process by the calibration provider is also needed.
QC for some facilities (biologging) will be/is outsourced
There is currently limited knowledge within IMOS of the QC work performed at MEOP, there is a preliminary strategy in place should MEOP stop QC’ing the biologging data, but this needs to be fully formed.
The AODN is currently harvesting the MEOP QC data (which includes IMOS), some thought should be given if the outsourcing of the QC is the best strategy for IMOS regarding the QA/QC of these data sets, and some involvement from IMOS should be discussed with MEOP.

53
Variable Key Points Issues Recommendations
While there are some facilities with written protocols, there are many that don’t.
While there are written protocols for some facilities, it does not include the QA/QC of all the variables derived from the facility as this is dependent of the organisation that performs the QC. For example, SOOP BGC has a written protocol for the BGC variables but there is no written documentation on the MNF QC protocol for the physical variables from this facility. This is being corrected
It is important that all facilities have a written document on their QA/QC protocols and make them available. This will facilitate the querying of the QA/QC procedures and give users confidence in the data.
SST from ships of opportunity has different QC applied, depending of the agency processing the data, i.e. BoM will do an automated QC and apply its own QC flagging system while AIMS TRV will do basic QC and apply the IMOS QC flags.
The consistency of the QC’ed SST data from the different vessels (SOOP SST, TMV, TRV and SOOP BGC) is variable, including the QF (quality flags). This can lead (has led) to some confusion from people downloading and using the data. Additionally, there is variation in the temporal frequency of the data delivered, with TMV facility delivering data at very high temporal frequencies (1 second) in comparison to other SST data from BOM (SOOP SST) or AIMS (TRV) (10 seconds).
Discussion is needed on how to handle the QA/QC and file formatting of the SST data from SOOP, TRV, NMF and TMV in order to provide a consistent data set that is not dependent on the agency that processes the data. Centralising the QC to one agency could be one way to solve this issue.
Some QA/QC procedures are more robust that others, with some facilities not doing any QC (AUV).
Some near real-time data is not QC (gliders, some moorings, some SOOP BGC)
It would be beneficial to update the document “IMOS Data Streams and their Uncertainties” that reflects the current situation, sensors and processes

54
Variable Key Points Issues Recommendations
Subsurface salinity
Sub-facilities follow their own protocol for QA/QC, with few linked to international programs (e.g. ARGO, XBT)
While there are some facilities with written protocols, there are many that don’t.
While there are written protocols for some facilities, it does not include the QA/QC of all the variables derived from the facility as this is dependent of the organisation that performs the QC, i.e. SOOP BGC has a written protocol for the BGC variables but there is no written documentation of the QC protocol undertaken by MNF for the physical variables for this facility
It would be highly beneficial for all facilities to have a written protocol and make them available. This will facilitate the querying of the QA/QC procedures and give users confidence in the data.
QC for some facilities (biologging) is outsourced
There is currently limited knowledge within IMOS of the QC work performed at MEOP, there is a preliminary strategy in place should MEOP stop QC’ing the biologging data, but this needs to be fully formed.
The AODN is currently harvesting the MEOP QC data (which includes IMOS), some thought should be given if the outsourcing of the QC is the best strategy for IMOS regarding the QA/QC of these data sets, and some involvement from IMOS should be discussed with MEOP. Similar to ANMN, conductivity needs to be stored if reprocessing is needed in the future.

55
Variable Key Points Issues Recommendations
Most of the moorings (shelves, deepwater and NRS) use similar QC procedures that include or are aligned to the IMOS toolbox
QC results produced by the toolbox need visual validation by the NRS and Shelves moorings sub-facilities in order to avoid bad data not being flagged.
The Australian National Mooring Network Steering Committee (ANMN SC) has agreed to re-process the relevant mooring datasets and improve the QC performed on them. There needs to be improvement on the visual validation of Toolbox QC results as well as the use of the Toolbox. A task team (TT) will be proposed to develop a document that would try to describe a consistent methodology on how to QC a mooring dataset with the toolbox.
A separate issue with moorings is that not all sub-facilities send their instruments to a central place for calibration, however, this is being corrected.
Centralising the calibration of sensors, where possible, will be a good strategy for consistency in the QA. In addition, documenting the process by the calibration provider is also needed to improve confidence in the data
Some ANMN sub-facilities did not extract the raw conductivity data (from which salinity is derived) to make sure spikes are not an instrument issue, the data will be re-processed to add it
There is a general lack of
information on the calibration results.
Some near real-time data is not QC (gliders, moorings, SOOP BGC)
Some QA/QC procedures are more robust that others, with some facilities not doing any QC for this variable (AUV).

56
Variable Key Points Issues Recommendations
Some protocols indicate the calculations used to derive salinity, while many do not state it.
It would be beneficial to update the document “IMOS Data Streams and their Uncertainties” that reflects the current situation, sensors and processes
Surface/subsurface currents
There is no universal agreement on the QA/QC approach for radar currents within the radar group and the scientific community is split between the two major technologies.
Bonney Coast and GBR radars not optimized to monitor the regions.
Discussion may be needed about the utility of the Bonney Coast and GBR radars and how to improve them.
QC procedures developed in house for WERA but not SeaSonde. Currently tests are being performed on a new data format for ocean radar currents, that is being developed within the international HF radar community. Similarly, tests are being performed for the near real-time and offline quality-control procedures, in accordance with the IOOS (Integrated Ocean Observing System) “Manual for Real-Time Quality Control of High Frequency Radar Surface Current Data”.
SSH linked internationally to contribute calibrated and validated SSH data from which surface currents are derived
The Matlab toolbox is used for QC of the data for moorings by the different sub-facility leaders.
Calibration of ADCP for current speed is not required, however, ADCP compass calibration and other physical measurements made by the instrument do require calibration.
ADCPs can be acoustically calibrated and there is suggestions for the CSIRO facility to purchase the necessary acoustic equipment to calibrate ADCP acoustically

57
Variable Key Points Issues Recommendations
ADCP QA checks to ensure the data outputs are consistent and sensible are highly valuable. A facility or prescribed method to undertake a check of current speed/compass integrity would be recommended.
Sea Surface Height
The facility does not follow a fixed protocol, however, they follow a standard procedure for the mooring and GPS processing with a step in the data processing for the satellite calibration purposes. Fine checks are carried out around the time of the satellite overflight (~10 days).
There is no written documentation of their protocol
While the facility follows standard procedure to calibrate satellite SSH, providing some written documentation would be beneficial as an information source
Sea state (wave
parameters)
Wave data from SOTS is done in CSIRO, QC is sensor intercomparison
Rudimentary or not QC
Given the increase interest in wave data, it may be important to start considering QC these data set and provide a written protocol of the QA/QC procedures. It is important to consider the purpose for the use of these data as QC requirements may vary.
There is essential manufacturer QA/QC for the IMOS wave data from moorings in NRT and delayed mode. Some data are considered experimental only.
There are no protocols available for the QA/QC of these data in most facilities. Manufacturers and QARTOD protocols are available
The radar facility is looking at improving the wave data and has produced a report,

58
Variable Key Points Issues Recommendations
although the radar set up was specifically designed for currents
Ocean surface vector stress
(wind parameters)
Wind velocity data only, QC in BoM, using the same automated QC used for all other variables, namely: SST, Air-sea fluxes, and others.
Rudimentary QC is undertaken in all other facilities.
No written protocols except for BoM
QARTOD manuals suggest that expert QC should be considered for both speed and direction of winds, along with comparisons with other observations such as Satellite. This could be a possibility to improve the data we are currently serving.
There is also the potential to use remote sensing scatterometer data/and or reanalysis data to detect major errors.
Heat flux/radiation
QA/QC of air-sea fluxes are done by BoM for both SOOP and SOFS using the same automated QC system.
Dissolved oxygen
QA/QC undertaken by facility.
That a written report is produced by the O2 Task Team giving recommendations for sensors available, uses, target accuracies and precisions required (e.g. Future Oceans EOV¹s) and options and recommendations for calibration and maintenance for O2 sensors.
Issue with high failure rate of the O2 sensors in WQM and CTD in the ANMN facility
WQM O2 sensors and CTD SBE43 sensors suffer from high failure and winkler titrations are needed to cross check the WQM and CTD data.
That optical oxygen sensors are used on NRS with 6-12 monthly calibrations and data processing using well defined and available techniques.
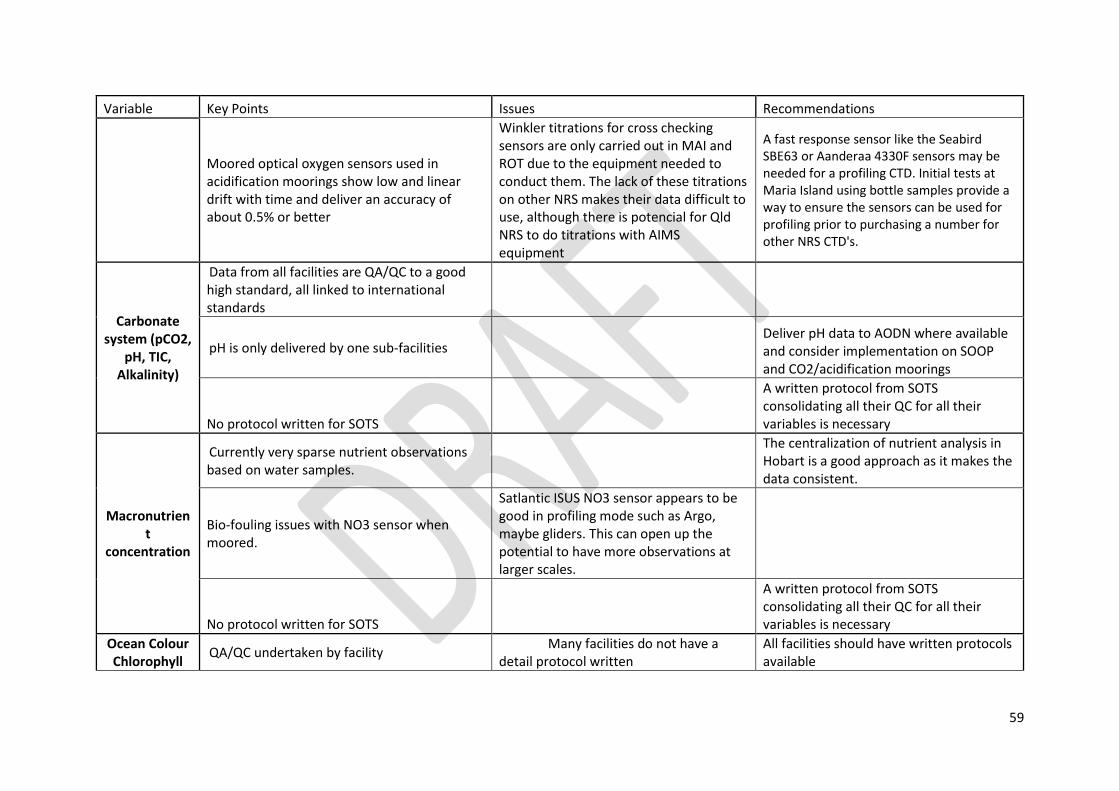
59
Variable Key Points Issues Recommendations
Moored optical oxygen sensors used in acidification moorings show low and linear drift with time and deliver an accuracy of about 0.5% or better
Winkler titrations for cross checking sensors are only carried out in MAI and ROT due to the equipment needed to conduct them. The lack of these titrations on other NRS makes their data difficult to use, although there is potencial for Qld NRS to do titrations with AIMS equipment
A fast response sensor like the Seabird SBE63 or Aanderaa 4330F sensors may be needed for a profiling CTD. Initial tests at Maria Island using bottle samples provide a way to ensure the sensors can be used for profiling prior to purchasing a number for other NRS CTD's.
Carbonate system (pCO2,
pH, TIC, Alkalinity)
Data from all facilities are QA/QC to a good high standard, all linked to international standards
pH is only delivered by one sub-facilities
Deliver pH data to AODN where available and consider implementation on SOOP and CO2/acidification moorings
No protocol written for SOTS
A written protocol from SOTS consolidating all their QC for all their variables is necessary
Macronutrient
concentration
Currently very sparse nutrient observations based on water samples.
The centralization of nutrient analysis in Hobart is a good approach as it makes the data consistent.
Bio-fouling issues with NO3 sensor when moored.
Satlantic ISUS NO3 sensor appears to be good in profiling mode such as Argo, maybe gliders. This can open up the potential to have more observations at larger scales.
No protocol written for SOTS
A written protocol from SOTS consolidating all their QC for all their variables is necessary
Ocean Colour Chlorophyll
QA/QC undertaken by facility Many facilities do not have a
detail protocol written All facilities should have written protocols available

60
Variable Key Points Issues Recommendations
fluorescence Conversion from fluorescence to Chl-a
concentration can be difficult
The is a lot of work needed for the WQM to calibrate and convert fluorescence to Chla
Bottle pigment samples could be used to calibrate the WQM data in situ, and maybe needed because of site variations in the community composition
An experimental project to calibrate and convert fluorescence data from WQM using algal cultures is currently underway, and there are other regional efforts, particularly in WA and SA to implement low Chla calibrations and instrument response
The WQM fluorescence conversion using algal cultures is experimental, results have not been published and converted data has not been given to AODN
That results from the project to convert fluorescence from WQM to Chl-a be published and a detailed protocol written. This project will help the conversion by considering the regional differences as well as sensor differences. It will be helpful if this project includes all WQM and not only the NRS ones (i.e. Lucinda, SOTS and other shelf moorings).
Discussion is needed to clarify if results from the experimental project to convert WQM fluorescence to Chl-a data is to be used to process all WQM fluorescence data (including historical data).
Calibration is not centralised within the ANMN
An issue with moorings is that not all sub-facilities send their instruments to a central place for calibration, this has recently been corrected
Centralising calibration of sensors will be ideal and more efficient
In situ HPLC Chl-a conc. provides Chl-a concentration with high accuracy at the NRS
There is a radiometry TT underway to look at calibrations and sensor intercomparisons
That recommendations from the radiometry TT are implemented once the TT is finished.

61
Variable Key Points Issues Recommendations
CDOM
Suspended particulates (PON, PIC, POC, TSS)
The water samples collected at Lucinda and the NRS are QC and analysed as per NRS protocol by CSIRO team.
There are issues with measuring the TSS from the pooled sample collected at NRS, this is currently under review to resolve these issues.
The change from the pooled sample to the stratified samples in NRS will allow the use of the CDOM and TSS samples for satellite validation purposes.
There are issues with the filters used for the collection of TSS samples from IMOS
Discussion is needed to resolve this issue
Data from water samples taken at LJCO are currently not delivered to AODN, although there are plans for the delivery of these data soon.
Data from LJCO water samples should be delivered to AODN
There is no written protocol for LJCO and Gliders for these variables
A protocol on the QA/QC should be
available for all facilities
There is an issue with manual QC from gliders, in that when data are reprocessed the manual QC flags are removed during the re-processing so QC needs to be re-done again manually
Phytoplankton diversity
Phytoplankto
n biomass
All the phytoplankton data is managed centrally making these data consistent.
Regular taxonomic training and comparison of our identification with overseas labs also increases consistency

62
Variable Key Points Issues Recommendations
In addition, the publication of the phytoplankton database in Nature Scientific Data was an opportunity to get the IMOS and other data in a consistent and standard way. It should be encouraged for other data sets.
Zooplankton diversity
Zooplankton biomass
The management of the zooplankton data from SOOP and ANMN into a central laboratory makes these data consistent.
A taxonomic key for Australian zooplankton was created from these data sets as a collaboration between IMOS, UTas and CSIRO and is available online http://www.imas.utas.edu.au/zooplankton/home
Bioacoustic data is QC to international standards following the ICES WGFAST recommendations
Bioacoustic data will need analysis to estimate zooplankton biomass
There is an multifrequency acoustic system in SOTS, however, the data has not been given to AODN
Serious discussion is needed on extra data sets from sensors added by facilities but not integrated to IMOS
Regular taxonomic training and comparison of our identification with overseas labs increases consistency
The zooplankton data set has been published in Ecology
Both facilities have good QA/QC procedures

63
Variable Key Points Issues Recommendations
Nekton species
Nekton biomass
Bio-acoustic data is QC to international standards.
The acoustic animal tracking facility is the first to set standards for these observations, with false detection analysis. Information has been peered review and published and can be found here: https://animalbiotelemetry.biomedcentral.com/articles/10.1186/s40317-015-0094-z
Top predator species
Top predator population
Data is QC in both the passive acoustic moorings and the animal acoustic tagging facilities. Animal movement and presence/absence information can be extracted from these data, however, population information will need different techniques.
There is no written QA/QC protocol for passive acoustic. A software product, CHORUS, to analyse the IMOS Passive Acoustic data sets has been provided by Curtin.
That all facilities write a protocol for QA/QC that is publicly available
Benthos (% coverage of
species)
* This facility has undergo an internal
review
Annotation happens outside the AODN through the software Squidle. The updated Squidle+ software will be able to handle larger data sets with flexible annotation. Members of the community agreed to upload their annotated data.
That the IMOS AUV Facility steering committee review the campaign planning and design of dives at sites around the country to ensure that a consistent methodology is adopted and that future data collected by the facility can be compared and conclusions drawn on a national basis to support the broadscale objectives of the program.

64
Variable Key Points Issues Recommendations
CATAMI has been too restrictive, so a flexible annotation scheme will be implemented.
That the facility should accelerate the transition to higher resolution imagery to improve description of benthos.
There has been discussions with AODN to support closer integration with Squidle and the AODN portal and to facilitate the inclusion of additional data sources as part of the NeCTAR Ocean Sciences cloud.
That the next generation of online annotation tools be designed to support flexible classification schemes.
To form a scientific steering committee with representation from the major groups involved in this work helps to set priorities for the IMOS Integrated Benthic Monitoring program, secure ship time, assist with fieldwork and lead the analysis of the resulting data streams
Detritus flux Follows international convention for
QA/QC. There is only one facility that collects these observations. No written protocol
A written protocol for this facililty that compiles all the QA/QC

65
APPENDIX 3 LIST OF ACRONYMS
ADCP Acoustic Doppler Current Profiler
AIMS Australian Institute of Marine Science
ANMN The Australian National Mooring Network
ANMN SC The Australian National Mooring Network Steering Committee
AODN Australian Ocean Data Network
AUV Autonomous Underwater Vehicle
BGC Biogeochemistry
BOM Bureau of Meteorology
BOWG Bio-optical Working Group
CATAMI Collaborative and Annotation Tools for Analysis of Marine Imagery
CDOM Colored Dissolved Organic Matter
CLIOTOP CLimate Impacts on Oceanic TOp Predators
CLIVAR Climate Variability and Predictability
COAPS Center for Ocean-Atmospheric Prediction Studies (COAPS)
CPR Continous Plankton Recorder
CREON Coral Reef Ecological Observation Network
CSIRO
CTD Conductivity, Temperature, Depth
DAR Darwn Station
ECV ocean Essential Climate Variables
EGO Everyone’s Gliding Observatories
EOV Essential Ocean variables
EPA Environment Protection Authority
FLNTU Fluorescence, optical turbidity
GACS Global Alliance of CPR Surveys
GBR Great Barrier Reef
GCOS Global Climate Observing System
GDRs Geophysical Data Records
GHRSST Group for High Resolution Sea Surface Temperature
GOA-ON Global Ocean Acidification Observing Network
GOOS Global Ocean Observing System
GPS Global Positioning System
GTD Gas Tension Device
GTSPP Global Temperature Salinity Profile Programme
ICES International Council for the Exploration of the Sea
IOCCP International Ocean Carbon Coordination Project
IQuOD International Quality controlled Ocean Database
JCU James Cook University
JGOFS Joint Global Ocean Flux Study
LJCO Lucinda Jetty Coastal Observatory

66
MAI Maria Island Station
MEOP Marine Mammals Exploring the Oceans Pole to Pole
MMP Marine Monitoring Program
MNF Marine National Facility
NecTAR National eResearch Collaboration, Tools and Resources
NRS National Reference Stations
NRT Near Real Time
NT Northern Territory
OOPC Ocean Observations Panel for Climate
OSTST Ocean Surface Topography Science Team
OTN Ocean Tracking Network
PAR Photosynthetically active radiation
PIC particulate inorganic carbon
PICES North Pacific Marine Science Organization
PICO Panel for Integrated Coastal Observations
POC particulate organic carbon
PON particulate organic nitrogen
QA Quality Assurance
QARTOD Quality Assurance of Real-Time Ocean Data
QC Quality Control
QF Quality Flags
QLD Queensland
RCOOS Regional Coastal and Ocean Observing Systems
ROT Rottnest Station
SAHFOS Sir Alister Hardy Foundation for Ocean Science
SAMOS Shipboard Automated Meteorological and Oceanographic System
SIO Scripps Institution of Oceanography
SMRU Sea Mammal Research Unit
SOCAT Surface Ocean CO2 Atlas
SO-CPR Southern Ocean CPR
SOFS Souther Ocean Flux mooring
SOOP Ships of Opportunity Program
SOOS Southern Ocean Observing System
SOTS Southern Ocean Time Series
SRS Satellite Remote Sensing
SSH Sea Surface Height
SST Sea Surface Temperature
TIC Total Inorganic Carbon
TMV Temperate Merchant Vessel
TRV Tropical Research Vessel
TSS Total Suspended Solids
TT Task Teams
US-IOOS United States - Integrated Ocean Observing System
UWA University of Western Australia

67
WOCE World Ocean Circulation Experiment
WoRMS World Register of Marine Species
WQM Water Quality Monitor
XBT Expendable Bathy Thermograph
YON Yongala Station