
Quality Assessment for Crowdsourced Object...
11
S. VITTAYAKORN, J. HAYS: CROWDSOURCED OBJECT ANNOTATIONS 1 Quality Assessment for Crowdsourced Object Annotations Sirion Vittayakorn [email protected] James Hays [email protected] Computer Science Department Brown university Providence, RI, USA Abstract As computer vision datasets grow larger the community is increasingly relying on crowdsourced annotations to train and test our algorithms. Due to the heterogeneous and unpredictable capability of online annotators, various strategies have been proposed to “clean” crowdsourced annotations. However, these strategies typically involve getting more annotations, perhaps different types of annotations (e.g. a grading task), rather than computationally assessing the annotation or image content. In this paper we propose and evaluate several strategies for automatically estimating the quality of a spatial object annotation. We show that one can significantly outperform simple baselines, such as that used by LabelMe, by combining multiple image-based annotation assessment strategies. 1 Introduction Numerous core computer vision [18] and computer graphics [6, 14] research topics rely on data sets of spatially annotated objects. Perhaps the most widely known data set is that of the annually updated Pascal VOC object detection challenge [11]. The Pascal data set was tradi- tionally built by a dozens of skilled annotators operating with detailed instructions and expert supervision. The resulting data sets contain ∼20,000 objects in ∼10,000 images. The object annotations span 20 categories and are limited to rectangular bounding boxes. The various Pascal VOC challenges continue to advance the state of the art in object recognition, but the data sets are relatively expensive to collect, relatively limited in number of categories and amount of training data, and rectangular bounding boxes carry limited shape information. In recent years there has been interest in larger and more diverse object data sets. Ef- forts such as LabelMe [4] and ImageNet [9] contain spatial annotations of thousands of object categories in hundreds of thousands of images. To build these data sets with orders of magnitude more data than expert-constructed data sets researchers must crowdsource the an- notation effort to non-expert, minimally trained workers of heterogeneous ability. Whether such workers are paid [9] or not [4], individual annotations can not be trusted as they can for a dataset such as Pascal or Lotus Hill [2]. For this reason, numerous strategies are employed to “clean” or filter the raw annotations. Sorokin and Forsyth [1] suggest strategies such as “Gold standard”, “Grading”, and “Consensus”. These strategies are effective, but they necessarily cost additional money (especially consensus) and add complexity to database c 2011. The copyright of this document resides with its authors. It may be distributed unchanged freely in print or electronic forms.
Transcript of Quality Assessment for Crowdsourced Object...
S. VITTAYAKORN, J. HAYS: CROWDSOURCED OBJECT ANNOTATIONS 1
Quality Assessment for CrowdsourcedObject Annotations
Sirion [email protected]
James [email protected]
Computer Science DepartmentBrown universityProvidence, RI, USA
Abstract
As computer vision datasets grow larger the community is increasingly relying oncrowdsourced annotations to train and test our algorithms. Due to the heterogeneous andunpredictable capability of online annotators, various strategies have been proposed to“clean” crowdsourced annotations. However, these strategies typically involve gettingmore annotations, perhaps different types of annotations (e.g. a grading task), rather thancomputationally assessing the annotation or image content. In this paper we proposeand evaluate several strategies for automatically estimating the quality of a spatial objectannotation. We show that one can significantly outperform simple baselines, such as thatused by LabelMe, by combining multiple image-based annotation assessment strategies.
1 IntroductionNumerous core computer vision [18] and computer graphics [6, 14] research topics rely ondata sets of spatially annotated objects. Perhaps the most widely known data set is that of theannually updated Pascal VOC object detection challenge [11]. The Pascal data set was tradi-tionally built by a dozens of skilled annotators operating with detailed instructions and expertsupervision. The resulting data sets contain ∼20,000 objects in ∼10,000 images. The objectannotations span 20 categories and are limited to rectangular bounding boxes. The variousPascal VOC challenges continue to advance the state of the art in object recognition, but thedata sets are relatively expensive to collect, relatively limited in number of categories andamount of training data, and rectangular bounding boxes carry limited shape information.
In recent years there has been interest in larger and more diverse object data sets. Ef-forts such as LabelMe [4] and ImageNet [9] contain spatial annotations of thousands ofobject categories in hundreds of thousands of images. To build these data sets with orders ofmagnitude more data than expert-constructed data sets researchers must crowdsource the an-notation effort to non-expert, minimally trained workers of heterogeneous ability. Whethersuch workers are paid [9] or not [4], individual annotations can not be trusted as they can fora dataset such as Pascal or Lotus Hill [2]. For this reason, numerous strategies are employedto “clean” or filter the raw annotations. Sorokin and Forsyth [1] suggest strategies suchas “Gold standard”, “Grading”, and “Consensus”. These strategies are effective, but theynecessarily cost additional money (especially consensus) and add complexity to database
c© 2011. The copyright of this document resides with its authors.It may be distributed unchanged freely in print or electronic forms.
Citation
Citation
{P.protect unhbox voidb@x penalty @M {}Felzenszwalb} 2009
Citation
Citation
{Chen} 2009
Citation
Citation
{Lalonde, Hoiem, Efros, Rother, Winn, and Criminisi} 2007
Citation
Citation
{Everingham, Vanprotect unhbox voidb@x penalty @M {}Gool, Williams, Winn, and Zisserman} 2010
Citation
Citation
{C.protect unhbox voidb@x penalty @M {}Russell and Freeman.} 2008
Citation
Citation
{Deng, Dong, Socher, Li, Li, and Fei-Fei} 2009
Citation
Citation
{Deng, Dong, Socher, Li, Li, and Fei-Fei} 2009
Citation
Citation
{C.protect unhbox voidb@x penalty @M {}Russell and Freeman.} 2008
Citation
Citation
{B.protect unhbox voidb@x penalty @M {}Yao and Zhu} 2007
Citation
Citation
{Alexanderprotect unhbox voidb@x penalty @M {}Sorokin} 2008
2 S. VITTAYAKORN, J. HAYS: CROWDSOURCED OBJECT ANNOTATIONS
creation. LabelMe, on the other hand, does not explicitly use any of these strategies (al-though administrators will manually remove flagrant annotations). Instead LabelMe uses asimple but surprisingly effective heuristic to rank user annotations – the number of controlpoints in each annotation.
This heuristic is an instance of what we will refer to as annotation scoring functions.One can think of such functions as returning a real-valued score given a user annotation andan image. Such functions are useful because they do not throw out any user annotationsand allow a database to be filtered in accordance with the demands of a specific algorithm.For instance, applications such as Photo Clip Art [14] or silhouette-based detectors [12]require very accurate annotations. Fixed aspect ratio detectors like Delal and Triggs [8]or Felzenswalb et al. [18] need the rough spatial extent of each object. Finally, to learncontextual relationships one might only need the rough location of objects or one might onlybe concerned with whether objects co-occur in the same scene [18].
We believe this paper is the first to explore annotation scoring functions. We hope thesemethods will help researchers utilize large-scale, crowdsourced data sets in computer visionand computer graphics. An ideal annotation scoring function would rank annotations inaccordance with a “ground truth” quality ranking. We will discuss how we define groundtruth later in the paper. The scoring function should be unbiased. For instance, one mightconsider using a car detector to assess the quality of car annotations, but this circularitywould bias you toward using car instances which are already easy to recognize and thusdefeat the purpose of using larger datasets. To help avoid such biases, we examine onlycategory agnostic scoring functions (i.e. scoring functions which consider only the spatialannotation and not the category label).
The baseline scoring function proposed by LabelMe [4] which counts control points issurprisingly effective but it does not even consider the image itself. Clearly, we should beable to score annotations more intelligently by considering whether an annotation is likelygiven the local or global image content. While there is little previous work on “annotationscoring functions” per se, there is considerable research on edge detection, image segmenta-tion, and more recently generic object detection which might relate to annotation quality. InSection 3 we operationalize such techniques for use in annotation assessment and comparetheir performance to simple baselines. A combined scoring function leveraging multiplecues significantly outperforms any existing baseline.
1.1 Additional Related WorkThe argument for effective annotation scoring functions is partly an economic argument. Ifmoney weren’t an issue, collecting more annotations and involving more expert supervisionwould always be a solution. To make large-scale annotation economical and fast there isongoing research into active learning methods for visual recognition which preferentiallycollect the most informative annotations [20], sometimes while considering the expectedhuman annotation effort [19]. These methods are very effective but they are task dependent.To annotate a general purpose database like LabelMe or ImageNet these methods are notsuitable because there is no single classification task to guide the active learning. Also,while these methods are informative about which annotations to collect, they don’t usuallyoffer any unique insight into which annotations to trust.
The image synthesis method of Sketch2photo[6] could be thought of as including an an-notation scoring function. In this case the annotations or bounding boxes being assessed arenot from humans but from automatic segmentation techniques that are expected to have a
Citation
Citation
{Lalonde, Hoiem, Efros, Rother, Winn, and Criminisi} 2007
Citation
Citation
{Gupta, Shi, and Davis} 2008
Citation
Citation
{Dalal and Triggs} 2005
Citation
Citation
{P.protect unhbox voidb@x penalty @M {}Felzenszwalb} 2009
Citation
Citation
{P.protect unhbox voidb@x penalty @M {}Felzenszwalb} 2009
Citation
Citation
{C.protect unhbox voidb@x penalty @M {}Russell and Freeman.} 2008
Citation
Citation
{Vijayanarasimhan and Grauman} 2011
Citation
Citation
{Vijayanarasimhan and Grauman} 2009
Citation
Citation
{Chen} 2009

S. VITTAYAKORN, J. HAYS: CROWDSOURCED OBJECT ANNOTATIONS 3
high failure rate. Sketch2photo focuses on finding “algorithm friendly” images which seg-ment easily (for instance, containing only one salient object). Our proposed methods mightalso have a tendency to reward “algorithm friendly” images for which the user annotationand automatic segmentation agree. Our evaluation penalizes any such bias, though.
2 Definitions and DatasetAn annotation scoring function is a function that takes an image and user’s annotation andreturns a real-valued score indicating the quality of that annotation. By our definition, anannotation scoring function does not consider the supposed category of an annotation. Wedo not consider the situation where an annotation is poor quality because the annotator gaveit the wrong label (e.g. a user accurately segmented a dog but then labeled it a car). In ourexperience, this is a very rare situation. In this paper, we investigate five annotation scoringfunctions and have each method rank hundreds of crowdsourced user annotations. We thencompare those rankings of annotation quality to a ground truth ranking using Spearman’srank correlation coefficient [16]. To make this comparison we must first build a dataset con-taining pairs of crowdsourced annotations with their corresponding ground truth annotation.
2.1 User AnnotationsWe collect spatial object annotations from LabelMe [4]. We expect such annotations to bequalitatively similar to those obtained from other sources such as Mechanical Turk. LabelMeannotations are closed polygons entered from a web-based interface. All of the scoringfunctions, except for the LabelMe baseline, take a binary mask as input rather than a polygon.Thus our functions are suitable to any labeling interface that produces a bounding box orsegmentation. For the experiments in this paper, we collect 200 pairs of object images anduser annotations from 5 categories – person, car, chair, dog, and building. These categoriesare picked because they are among the most common objects in LabelMe and because theyare distinct in size, shape, and annotation difficulty.
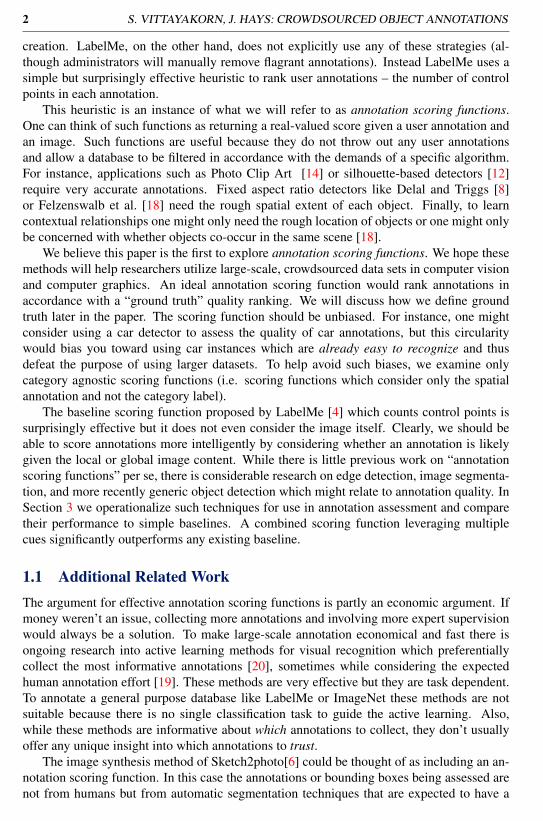
2.2 Ground Truth AnnotationsFor these 1,000 total images we need to establish a ground truth spatial annotation in order toknow how good each user annotation is. The red contour in Figure 1 shows a sample of theground truth annotation for five objects in our dataset. Because we are assessing LabelMeannotations, our ground truth is specified in strict accordance with the LabelMe guidelines.For instance, different datasets have different rules about how to annotate occlusions. We donot think these rules had a significant impact on user annotation quality, except for the build-ing category where user annotations violated these rules occasionally. The actual groundtruth segmentation was a time-consuming, manual process. We have released this databaseonline.
2.3 Comparing AnnotationsTo establish a ground truth quality score for user annotations we need to compare user anno-tations to our ground truth annotations. There are numerous methods in the vision literaturefor comparing such shapes. Perhaps the most widely used is the PASCAL VOC overlap
Citation
Citation
{Myers} 2003
Citation
Citation
{C.protect unhbox voidb@x penalty @M {}Russell and Freeman.} 2008
4 S. VITTAYAKORN, J. HAYS: CROWDSOURCED OBJECT ANNOTATIONS
Figure 1: Example of the ground truth dataset from 5 categories. The red bounding box isthe ground truth bounding box of object.
score [11]. However, the overlap score is not entirely satisfying for arbitrary shapes be-cause it gives no special attention to boundaries or small protrusions. For instance, a personannotation might still be scored quite highly even if extended arms are completely left out,because those pixels are perhaps only five percent of the area of the shape. Therefore, wealso use the Euclidean distance score, inspired by the “Shape Context” method [3], whichemphasizes the boundary agreement of two annotations.
Overlap Score. In PASCAL VOC competition, algorithms are evaluated based on theoverlap area of the two annotations. For two objects Bu and Bv, the overlap score is:
scorep =area(Bu∩Bv)
area(Bu∪Bv)(1)
where Bu∩Bv denotes the intersection of two bounding boxes or binary masks and Bu∪Bvtheir union.
Euclidean Distance Score. The Euclidean distance score measures the distance betweentwo annotation boundaries. There are numerous shape matching methods and we chose abipartite matching method in the spirit of [3]. We sample m = 300 random points along eachannotation boundary then calculate the Euclidean distance between all possible pairwisecorrespondences, resulting in an m by m matrix of Euclidean distances. Given this matrix,the Kuhn-Munkres algorithm [15] returns the m assignments which have the minimum totalEuclidean distance. In Figure 2 left, the red and green points are the random points fromthe user and ground truth annotations, respectively, while the blue lines show the Euclideandistance between the assigned pairwise. Given these correspondences for annotations Bvand Bu where (Xi,Yi) ∈ Bu,(xi′ ,yi′) ∈ Bv we simply sum the pairwise distances accordingto Equation 2. Finally, we normalize these distances into [0,1]. Because larger Euclideandistances are associated with lower annotation quality, we define our Euclidean distancescore as 1 minus the normalized summed distance (Equation 3).
dist = ∑i
√(Xi− xi′)
2 +(Yi− yi′)2 (2)
scoree = 1− distmax(dist)
(3)
And max(dist) is the maximum Euclidean distance of that category.
2.4 Ground Truth Quality RankingTo create our per-category ground truth ranking, we sort the user annotations by a combinedscore: score = (w1× scoree)+ (w2× scorep) where scoree is the Euclidean distance score,
Citation
Citation
{Everingham, Vanprotect unhbox voidb@x penalty @M {}Gool, Williams, Winn, and Zisserman} 2010
Citation
Citation
{Belongie, Malik, and Puzicha} 2002
Citation
Citation
{Belongie, Malik, and Puzicha} 2002
Citation
Citation
{Munkres} 1957

S. VITTAYAKORN, J. HAYS: CROWDSOURCED OBJECT ANNOTATIONS 5
Figure 2: Left: The blue line shows the Euclidean distance between the ground truth bound-ing box (red points) and the user’s bounding box (green points) Right: The green contour isthe user’s bounding box, while the red contours are the candidate object’s contour base onthe user’s bounding box
scorep is the overlap score between the user and ground truth bounding box while w1 and w2were set to 0.5.
3 Annotation Scoring FunctionsGiven an image and annotation, we evaluate the quality of each annotation using an an-notation scoring function and then rank all of the annotations within each object category.We investigate five annotation scoring functions: number of annotation control points [4],annotation size, edge detection, Bayesian matting [7] and object proposal [10].
3.1 Baselines: Control Points and Annotation SizeWe start with the simple baseline used by LabelMe [4] and techniques which derive datafrom LabelMe such as Photo Clipart [14]. For this baseline, the quality of an annotation isproportional to the number of control points in the bounding polygon. This baseline workswell – a large number of control points usually indicates that the user made an effort toclosely follow the object boundary.
We also propose an even simpler baseline relating annotation size and quality of annota-tion. We assume that the larger an object is, the better the annotation is because it is easierfor a user to annotate a large, high resolution object than a smaller one. We calculate the sizebaseline score as the percentage of image area occupied by the user annotation.
3.2 Edge DetectionIntuitively, a good annotation will tend to follow image edges. But this is not strictly true ofmost user annotations, even those which are qualitatively quite good. Users have a tendencyto annotate outside the actual object boundary by a few pixels even when they are tracingthe shape quite accurately. To accommodate for this we consider not just the user boundingpolygon, but also several dilations and erosions of this bounding region as shown in Figure2, right. For each such dilated or eroded user boundary we measure the overlap with filteredimage edges. We first run Canny edge detection [5] with threshold 0.2 on the image andgroup the resulting edge fragments into contours. If w is the diagonal length of a user’sannotation’s bounding box, we discard contours which are (1) shorter than 3% of w, becausesuch contours tend to be texture not boundaries, (2) more than 5% of w away from the user
Citation
Citation
{C.protect unhbox voidb@x penalty @M {}Russell and Freeman.} 2008
Citation
Citation
{Chuang, Curless, Salesin, and Szeliski} 2001
Citation
Citation
{Endres and Hoiem} 2010
Citation
Citation
{C.protect unhbox voidb@x penalty @M {}Russell and Freeman.} 2008
Citation
Citation
{Lalonde, Hoiem, Efros, Rother, Winn, and Criminisi} 2007
Citation
Citation
{Canny} 1986

6 S. VITTAYAKORN, J. HAYS: CROWDSOURCED OBJECT ANNOTATIONS
Figure 3: Left:The input image with annotation, its trimap and its alpha map from BayesianMatting approach. The black, gray and white region in the trimap are the background, un-known and foreground region respectively. Right:The blue contours are regions which aresimilar to the user’s bounding box (green contour) from object proposal approach
annotation, or (3) oriented more than 20 degrees away from the nearby user annotation.Finally, we find the boundary which has the most edge overlap and we assign a score to theuser annotation in proportion to how much this best boundary was dilated or eroded.
3.3 Bayesian Matting
Good annotations often agree with localized image segmentation. The fourth annotationscoring function is based on the Bayesian matting algorithm [7]. Bayesian matting modelsthe object and background color distributions with spatially-varying mixtures of Gaussiansand assumes a fractional blending of the object and background colors to produce the ob-served pixel colors. It then uses a maximum-likelihood criterion to estimate the optimalopacity, object and background simultaneously.
The input for Bayesian matting is a trimap with three regions: “background”, “object”and “unknown” where the background and object regions have been delineated conserva-tively. We construct these three regions based on the user annotation. The region outsidethe user annotation is constrained as background. The inside region is constrained as ob-ject. All pixels within a small and fixed distance, 3% of the length of user’s bounding box’sdiagonal, of the user boundary are marked unknown (see Figure 3, left). Bayesian mat-ting returns an alpha map with values between 0 to 1 where 0 means background and 1means object. The fractional opacities, α , can be interpreted as a confidence of that pixelbelonging to the object. We use these α values to compute an annotation score as follows:score=∑αin/areain−∑αout/areaout where αin and αout are the opacity of each pixel withinthe unknown region inside and outside the annotation respectively while areain and areaoutare the area of the unknown region inside and outside the annotation.
3.4 Object Proposal
The last annotation scoring function is based on the object proposal approach by Endresand Hoiem [10]. In their work, they propose a category-independent method to produce aranking of potential object regions. Given an input image, their approach generates a setof segmentations by performing graph cuts based on a seed region and a learned affinityfunction. Then these regions are ranked using structured learning based on various cues.Top-ranked regions are likely to be good segmentations of objects. If the user annotationis similar to one of the top ranked object proposals that suggests the annotation may be
Citation
Citation
{Chuang, Curless, Salesin, and Szeliski} 2001
Citation
Citation
{Endres and Hoiem} 2010

S. VITTAYAKORN, J. HAYS: CROWDSOURCED OBJECT ANNOTATIONS 7
Catergory Rank correlation
Points Size Edge Bayesian Proposal Final
Car 0.5216 0.4356 0.5972 0.3848 0.0817 0.5999
Chair 0.6758 0.6519 0.6132 0.6780 0.0190 0.6947
Building −0.3874 0.4271 0.4055 0.2030 0.0386 0.5214
Person 0.5503 0.4386 0.5716 0.7036 0.0394 0.7072
Dog 0.6070 0.2367 0.6932 0.6503 0.0468 0.7689
Average 0.3935 0.4380 0.5761 0.5239 0.0232 0.6584
Table 1: The rank correlation between ground truth ranking and other rankings
high quality. To score a user annotation, we find the object proposal with smallest Euclideandistance and overlap score to the user annotation. The score is the rank of that object proposaldivided by the total number of object proposals. We also tried to have the object proposalmethod [10] directly score the segmentation provided by the user, and not explore multiplesegmentations, but the performance was worse.
4 Comparing RankingAt this point we have a ground truth ranking for the user annotations within each category aswell as a ranking from each scoring function. We measure how well each ranking agrees withthe ground truth using Spearman’s rank correlation coefficient or Spearman’s rho, ρ [16].The n raw scores Xi,Yi are converted to ranks xi,yi and the differences di = xi− yi betweenthe ranks of each observation on the two variables are calculated. If there are no tied ranks,then ρ is given by:
ρ = 1− 6∑d2i
n(n2−1)(4)
An increasing rank correlation coefficient implies increasing agreement between rank-ings. The coefficient is inside the interval [-1, 1] and can be interpreted as 1 if the agreementbetween the two rankings is perfect, 0 if the rankings are completely independent, and -1 ifone ranking is the reverse of the other. We also measured the rank correlation using Kendallrank correlation coefficient [13], but there were no changes in the relative performance ofthe scoring functions so we do not report these numbers.
5 ResultsGiven the input image and its corresponding annotation, the annotation scoring function re-turns a score corresponding to the estimated quality of that annotation. We then generatethe overall annotation ranking from each scoring function and evaluate these rankings bycalculating the rank correlation against the ground truth ranking. Table 1 shows the rank cor-relations for each annotation scoring function broken down by category. “Building” standsout as the most difficult category for most scoring functions. We believe this is because La-belMe users did not reliably follow the annotation rules – they sometimes included multiplebuildings in a single annotation, or handled occlusion incorrectly. This led to a significantdisparity between some user and ground truth annotation pairs.
Citation
Citation
{Endres and Hoiem} 2010
Citation
Citation
{Myers} 2003
Citation
Citation
{Kendall} 1938

8 S. VITTAYAKORN, J. HAYS: CROWDSOURCED OBJECT ANNOTATIONS
Figure 4: Selected user annotations and their rank according to each scoring function.
These results show that the number of control points is indeed a good predictor of an-notation quality except for the building category. We think that this metric is uniquely badfor the building category because many buildings are rectangular, thus many accurate anno-tations have only 4 control points. Interestingly, the even simpler annotation size baselineperforms about as well as the control point baseline and is more directly applicable to an-notation protocols that don’t use polygons such as freehand lassoing. Both the Bayesianmatting and edge detection scoring functions have a high rank correlation. We believe theBayesian matting approach handles foreground occlusions poorly and thus does not performwell on the building category. We expected the object proposal scoring function to performbetter. But, in fact, the algorithm is answering a somewhat different question than what weare interested in. The object proposal evaluates how likely is this segment to be an object?and the question we are interested in is how accurately annotated is this object segment?. Weknow that all user annotations are object segments – none of the annotations are so adver-sarial as to contain no object. The object proposal method may be intentionally invariant toannotation quality, because the automatic segmentations that it considers cannot be expectedto be particularly accurate.
Finally, we investigate the performance of combinations of scoring functions. It is sim-ple to “average” multiple rankings by converting a rank to a real valued number, averaging,and then re-ordering. We tried numerous combinations and found that none could exceedthe performance of the Bayesian matting and edge scoring functions together. This "final"combination scores the highest for every category. We were surprised that the baseline scor-ing functions did not reinforce the more advanced, image-based functions. We also visualizespecific annotation instances are ranked by each function in Figure 4 and the rankings thatresult from each scoring function in Table 2.
6 Test Scenario: Object ClassificationWe would like to confirm that using annotation scoring functions to filter crowdsourcedtraining examples can lead to increased performance in secondary vision or graphics tasks.In particular, we examine a simple 5-way object classification task. The test set is madeup of 50 cropped objects from each of the five categories of our database. We create twotraining sets of LabelMe annotated objects. For each category, training set I contains 50random instances while training set II contains the 50 top ranked instances according toour combined annotation scoring function. There is no overlap between the test set and
S. VITTAYAKORN, J. HAYS: CROWDSOURCED OBJECT ANNOTATIONS 9
Ranking method Example of best ranked Example of worst ranked
Ground truth
Number of points
Annotation size
Edge detection
Bayesian Matting
Object proposal
Final
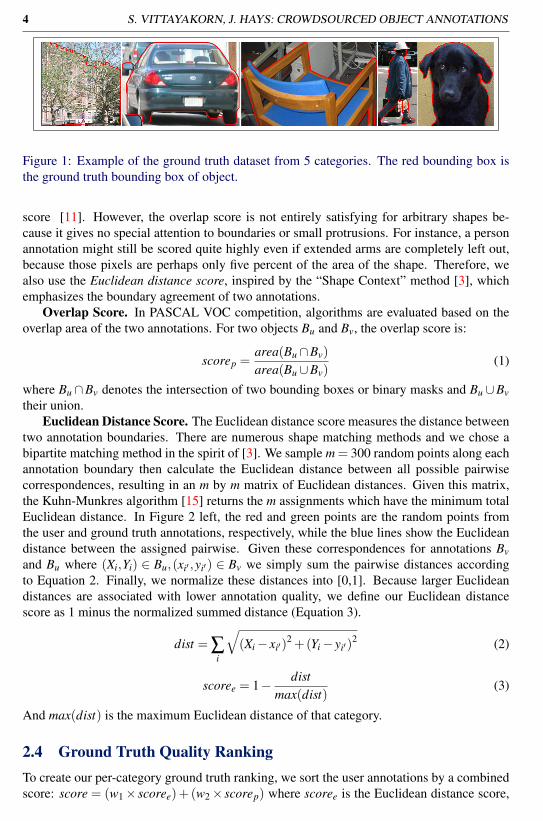
Table 2: The five highest and lowest ranked user annotations according to the ground truthranking and each annotation scoring function.The green and red bounding boxes are theuser’s and ground truth bounding boxes respectively, while the blue contours are the object’scontour from edge detection approach.
Category Classification Accuracy
Training set I Training set II
Car 79.9% 88.6%
Chair 75.5% 82.5%
Building 74.7% 79.7%
Person 85.3% 94%
Dog 74% 82%
Average 77.9% 85.3%
Table 3: The classification accuracy of each category
either training set. The test set objects are masked (background set to zero) according tothe ground truth annotations. The training set objects are likewise masked according to theuser annotations. We represent masked object crops with the gist descriptor [17]. This isa primitive but straightforward way to encode both object shape and appearance. We trainone-vs-all linear SVMs for each category and show quantitative results in Table 3. Theresults show that using our scoring function as a filter increases the classification rate inevery category and decreases the misclassification rate by 36% on average.
7 ConclusionIn this paper we rigorously show that numerous annotation scoring functions, some verysimple, can produce annotation rankings that are reasonably similar to the ground truth an-notation quality rankings. We propose new annotation scoring functions and show that, inisolation or combination, they outperform the simple LabelMe baseline. To evaluate thesescoring functions we produced an extensive database with 1,000 pairs of crowdsourced an-notations and meticulous ground truth annotations. As a sanity check, we show that userannotations ranked highly by our annotation scoring functions are more effective trainingdata than random user annotations in a simple object classification task. We share our datasetand look forward to the development of better annotation scoring functions which will makecrowdsourced annotations easier to leverage.
Citation
Citation
{Oliva and Torralba} 2001
10 S. VITTAYAKORN, J. HAYS: CROWDSOURCED OBJECT ANNOTATIONS
References[1] David Forsyth Alexander Sorokin. Utility data annotation with amazon mechanical
turk. First IEEE Workshop on Internet Vision at CVPR 08, 2008.
[2] X. Yang B. Yao and S.-C. Zhu. Introduction to a large scale general purpose groundtruth dataset: methodology, annotation tool, and benchmarks. EMMCVPR 2007, pages169–183, 2007.
[3] Serge Belongie, Jitendra Malik, and Jan Puzicha. Shape matching and object recogni-tion using shape contexts. IEEE Transactions on Pattern Analysis and Machine Intel-ligence, 24(4):509–522, April 2002.
[4] K. P. Murphy C. Russell, A. Torralba and W. T. Freeman. Labelme: a database andweb-based tool for image annotation. International Journal of Computer Vision, 77:157–173, May 2008.
[5] John Canny. A computational approach to edge detection. Pattern Analysis and Ma-chine Intelligence, IEEE Transactions on, PAMI-8(6):679 –698, nov. 1986. ISSN 0162-8828. doi: 10.1109/TPAMI.1986.4767851.
[6] Cheng M. Tan P. Shamir A. Hu S. Chen, T. Sketch2photo: Internet image montage.ACM Transactions on Graphics, 28(5), December 2009.
[7] Yung-Yu Chuang, Brian Curless, David H. Salesin, and Richard Szeliski. A bayesianapproach to digital matting. In Proceedings of IEEE CVPR 2001, volume 2, pages264–271. IEEE Computer Society, December 2001.
[8] Navneet Dalal and Bill Triggs. Histograms of oriented gradients for human detection.Computer Vision and Pattern Recognition, IEEE Computer Society Conference on, 1:886–893, 2005. ISSN 1063-6919. doi: http://doi.ieeecomputersociety.org/10.1109/CVPR.2005.177.
[9] J. Deng, W. Dong, R. Socher, L.-J. Li, K. Li, and L. Fei-Fei. Imagenet: A large-scalehierarchical image database. In CVPR09, 2009.
[10] Ian Endres and Derek Hoiem. Category independent object proposals. Computer Vision– ECCV 2010, 6315:575–588, 2010.
[11] M. Everingham, L. Van Gool, C. K. I. Williams, J. Winn, and A. Zisserman. The pascalvisual object classes (voc) challenge. International Journal of Computer Vision, 88(2):303–338, June 2010.
[12] Abhinav Gupta, Jianbo Shi, and Larry S. Davis. A "shape aware" model for semisu-pervised learning. In of Objects and Its Context, Proc. Conf. Neural Information Pro-cessing Systems, 2008.
[13] M. G. Kendall. A new measure of rank correlation. Biometrika, 30(1/2):81–93, June1938. URL http://www.jstor.org/stable/2332226.
[14] Jean-François Lalonde, Derek Hoiem, Alexei A. Efros, Carsten Rother, John Winn,and Antonio Criminisi. Photo clip art. ACM Transactions on Graphics (SIGGRAPH2007), 26(3):3, August 2007.
S. VITTAYAKORN, J. HAYS: CROWDSOURCED OBJECT ANNOTATIONS 11
[15] J. Munkres. Algorithms for the assignment and transportation problems. Journal of theSociety for Industrial and Applied Mathematics, 5:32, 1957.
[16] Jerome Myers. Research Design and Statistical Analysis. Lawrence Erlbaum Asso-ciates, Hillsdale, 2003. ISBN 0805840370.
[17] Aude Oliva and Antonio Torralba. Modeling the shape of the scene: A holistic repre-sentation of the spatial envelope. Int. J. Comput. Vision, 42(3):145–175, 2001.
[18] D. McAllester D. Ramanan. P. Felzenszwalb, R. Girshick. Object detection with dis-criminatively trained part-based models. IEEE Pattern Analysis and Machine Intelli-gence (PAMI), 2009.
[19] S. Vijayanarasimhan and K. Grauman. What’s it going to cost you?: Predicting effortvs. informativeness for multi-label image annotations. In Computer Vision and PatternRecognition, 2009. CVPR 2009. IEEE Conference on, pages 2262 –2269, june 2009.doi: 10.1109/CVPR.2009.5206705.
[20] S. Vijayanarasimhan and K. Grauman. Large-scale live active learning:training objectdetectors with crawled data and crowds. Computer Vision and Pattern Recognition,2011., april 2011.


![Automated Quality Assessment for Crowdsourced Test Reports ...oscar-lab.org/paper/cx_20180511.pdf · crowdsourced platforms, but are generally similar in the con-tent [8], [9]. In](https://static.fdocuments.us/doc/165x107/5fa7336e567d5a57e929d930/automated-quality-assessment-for-crowdsourced-test-reports-oscar-laborgpapercx.jpg)