Quality Assessment and Improvement on Spark Assisted ...
95
Quality Assessment and Improvement on Spark Assisted Chemical Engraving Gravity Feed Micro-drilling Malek Mousa A Thesis in The Department of Mechanical and Industrial Engineering Presented in Partial Fulfillment of the Requirements for the Degree of Master of Applied Science (Mechanical Engineering) at Concordia University Montreal, Quebec, Canada August 2008 © Malek Mousa, 2008
Transcript of Quality Assessment and Improvement on Spark Assisted ...

Quality Assessment and Improvement on Spark Assisted Chemical Engraving Gravity Feed Micro-drilling
Malek Mousa
A Thesis
in
The Department
of
Mechanical and Industrial Engineering
Presented in Partial Fulfillment of the Requirements
for the Degree of Master of Applied Science (Mechanical Engineering) at
Concordia University
Montreal, Quebec, Canada
August 2008
© Malek Mousa, 2008

1*1 Library and Archives Canada
Published Heritage Branch
395 Wellington Street Ottawa ON K1A0N4 Canada
Bibliotheque et Archives Canada
Direction du Patrimoine de I'edition
395, rue Wellington Ottawa ON K1A0N4 Canada
Your file Votre reference ISBN: 978-0-494-45315-5 Our file Notre reference ISBN: 978-0-494-45315-5
NOTICE: The author has granted a nonexclusive license allowing Library and Archives Canada to reproduce, publish, archive, preserve, conserve, communicate to the public by telecommunication or on the Internet, loan, distribute and sell theses worldwide, for commercial or noncommercial purposes, in microform, paper, electronic and/or any other formats.
AVIS: L'auteur a accorde une licence non exclusive permettant a la Bibliotheque et Archives Canada de reproduire, publier, archiver, sauvegarder, conserver, transmettre au public par telecommunication ou par Plntemet, prefer, distribuer et vendre des theses partout dans le monde, a des fins commerciales ou autres, sur support microforme, papier, electronique et/ou autres formats.
The author retains copyright ownership and moral rights in this thesis. Neither the thesis nor substantial extracts from it may be printed or otherwise reproduced without the author's permission.
L'auteur conserve la propriete du droit d'auteur et des droits moraux qui protege cette these. Ni la these ni des extraits substantiels de celle-ci ne doivent etre imprimes ou autrement reproduits sans son autorisation.
In compliance with the Canadian Privacy Act some supporting forms may have been removed from this thesis.
Conformement a la loi canadienne sur la protection de la vie privee, quelques formulaires secondaires ont ete enleves de cette these.
While these forms may be included in the document page count, their removal does not represent any loss of content from the thesis.
Canada
Bien que ces formulaires aient inclus dans la pagination, il n'y aura aucun contenu manquant.

ABSTRACT
Quality Assessment and Improvement on Spark Assisted Chemical Engraving Gravity Feed Micro-drilling
Malek Mousa
This thesis presents an investigation on the gravity feed micro-drilling spark assisted chemi
cal engraving (GFMD-SACE). The competitive advantage of the GFMD-SACE process is its
combined simplicity and low-cost with high aspect ratio and smooth surface finish. As long as these
values are well-preserved and intensified, this process will take a share in the market of micro-
fabrication.
The main objective of this study is to establish a systematic approach of the improvement in
GFMD-SACE by minimizing initially different variabilities in the process. The methodology is to
observe in details the process by adapting the six sigma procedures to determine the major error
states and their root causes. To this end, the process initial documentations are created such that it
keeps the door wide open for continuous improvement. Based on the initial evaluation, an improved
process is recommended on the tool electrode thermal and material properties, electrolyte levels and
the use of pulse voltage. Compared to the traditional process, the improvement procedure shows
less variability and more capability to achieve high quality in micro-drilling.
111

ACKNOWLEDGMENTS
There are a number of people without whom this work might not have been completed suc
cessfully, and to whom I am greatly indebted.
To my family who have been a source of encouragement and inspiration to me throughout
this life. I love you.
I am very also grateful to Dr. Rolf Wiithrich and Dr. Hoi Dick Ng, for their continuous sup
port and non-stopping motivation they created on me.
Special thanks to Mr. Gilles Huard, Mr. Robert Oliver, Mr. Dan Juras, Mr. William Wong
and Mr. Henry Szczawinski for helping me building the setups and prototypes for my experiment.
Your aid made it less stressful.
To Mrs. Charlene Wald, Dr. Mamoun Medraj and Dr. Brandon Gordon, who encouraged me
to change to the thesis option of the master program. Thank you so much.
IV

DEDICATION
To Jerusalem my great home and to my family and friends I dedicate this.
v
Contents
List of Figures x
List of Tables xiv
List of Symbols xv
Chapter 1 1
Introduction 1
1.1. Statement of problem 2
1.1.1. Process performance 2
1.1.2. Cost of non-quality 2
1.2. Purpose of study 3
Chapter 2 4
Literature and theory 4
2.1. State of the art Spark Assisted Chemical Engraving 4
2.1.1 General overview 4
2.1.2 Gravity-feed micro-drilling 5
2.1.3 Gravity feed micro-drilling sequences and procedure 6
2.1.4 Drilling regimes 7
2.1.5 Viscosity of the machining zone within the hydrodynamic regime 8
2.1.6 Material removal mechanism 8
2.1.7 Chemical etching contribution 9
2.1.8 Heat generation 10
2.1.9 Repeatability of drilling 11
2.1.10 Influence of inter-electrode resistance 12
2.1.11 Machining quality 12
2.2. Quality improvement strategy 15
2.3. Statistical process control 16
2.3.1 Process definition and initial documentation 16
2.3.2 Process variability 17
2.3.3 Quality control tools 18
vi

2.3.4 Process capability 21
2.4. Summary 22
Chapter 3 24
Gravity feed micro-drilling improvement 24
3.1. Potential for improvement 24
3.2. Thesis outline 24
3.2.1 Presenting a strategy for improvement 24
3.2.2 Investigating the heat transfer in the process 25
3.2.3 Investigating the pulse voltage 25
3.2.4 Investigating the electrolyte temperature and level 25
3.2.5 Introducing improvement procedures 26
3.3. Benchmarking 26
3.4. Summary 27
Chapter 4 28
The heat generation in gravity feed micro-drilling 28
4.1. Introduction 28
4.2. Thermal conductivity of tool electrode 29
4.2.1 Experimental procedure 29
4.2.2 Micro-drilling evolution 31
4.2.3 Viscosity of the machining zone within the hydrodynamic regime 34
4.2.4 First seconds of micro-drilling 35
4.3. Applying pulse voltage 37
4.3.1 The goal of using pulse voltage 37
4.3.2 Pulse voltage Circuit 37
4.3.3 Micro-drilling with pulse voltage 39
4.4. Electrolyte level and temperature 41
4.4.1 The importance of electrolyte level 41
4.4.2 Electrolyte circulation and leveling system 41
4.4.3 Micro-drilling with different electrolyte level 42
vii

4.4.4 Need of preheating the electrolyte 44
4.4.5 Electrolyte level adjustment and pulse voltage effect on machining time 45
4.5. Understanding the stair-case-like evolution 46
4.6. Improved process setup 47
4.7. Improving the machining time 48
4.8. Summary 48
Chapter 5 50
Quality evaluation of the process 50
5.1. Introduction 50
5.2. Quality evaluation metrics 51
5.2.1 Mean radius 51
5.2.2 Shape factor 52
5.2.3 Texture 52
5.3. Quality of the traditional gravity feed drilling process 53
5.3.1 Traditional machining conditions 53
5.3.2 Quality at different machining voltages machined during a fixed time 53
5.3.3 Variability of the traditional process 55
5.3.4 Traditional process capability 55
5.4. Quality after improvements 56
5.4.1 Improved machining conditions 56
5.4.2 Quality of micro-holes at fixed depth and variable machining time 56
5.4.3 Quality of machining with pulse voltage without electrolyte adjustment 58
5.4.4 Preheating the tool electrode 59
5.4.5 Preheating the electrolyte 60
5.4.6 Variability of the micro-hole quality with the improved process 61
5.4.7 Capability of the improved process 62
5.5. Quality of machining with tungsten electrodes 63
5.6. Summary 64
Chapter 6 65
viii

Conclusion 65
6.1. Concluding remarks 65
6.2. Recommended improvements for future work 66
6.2.1 To implement electrolyte leveling system 66
6.2.2 To implement tool electrode orbital motion 67
6.2.3 Synchronizing the tool vibration pulse voltage and the dispensing 68
6.2.4 Investigating the overall geometry of the micro-hole 69
6.2.5 Using stair-case-like evolution for predicting quality and machining time 69
6.3. Contribution to knowledge 70
References 71
Appendices 74
Appendix A 75
Appendix B 77
Appendix C 79
IX
List of Figures
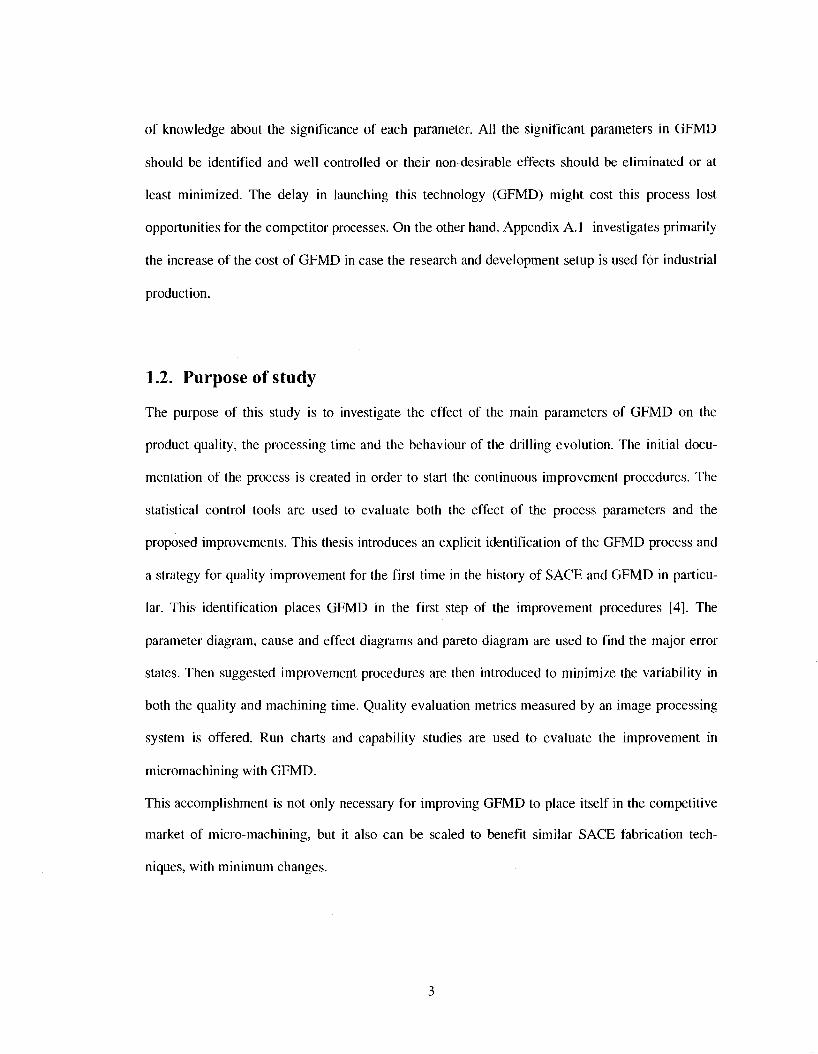
Figure 1: Principle of SACE technology: the glass sample to be machined is dipped in an electrolyte solution. A constant DC voltage is applied between the tool and counter-electrode [1] 4
Figure 2: Evolution versus time plot of four samples of micro-holes performed by gravity feed micro drilling at different machining voltages [3] 5
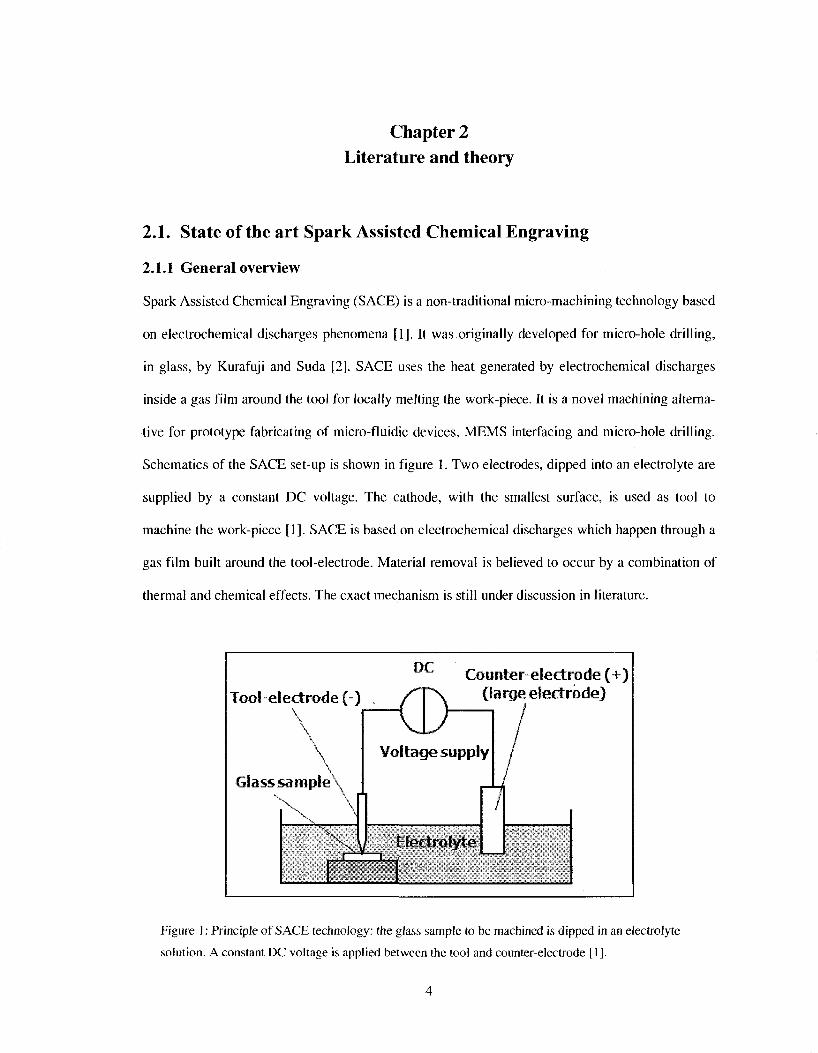
Figure 3: Sketch of the SACE gravity-feed micro-drilling procedure 6
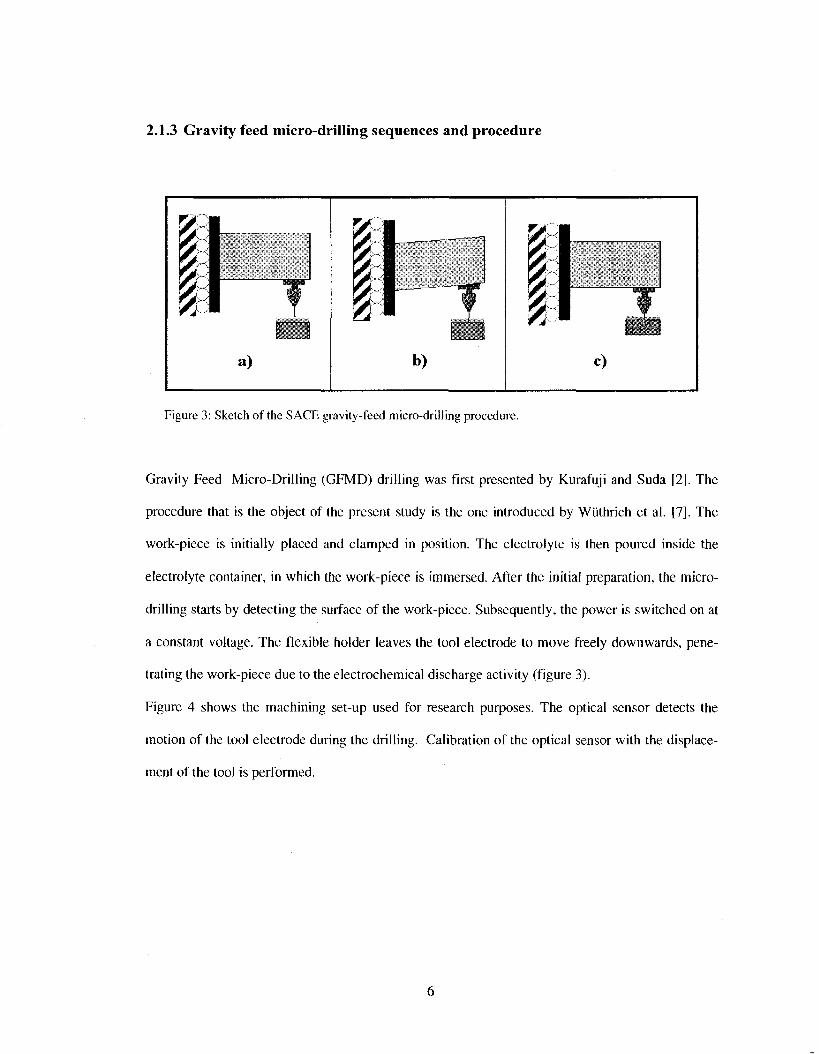
Figure 4: Schematic for the initial setup of SACE gravity-feed drilling [4]. The constant force refers to the weight of the drilling head (flexible frame, Top holder and tool spindle with the electrode 7
Figure 5: Causes of non-predictable machining removal rate in GFMD 10
Figure 6: Several consecutive glass gravity-feed drillings at 29V with a cylindrical stainless steel tool-cathode of 0.4mm diameter. Applied force was 0.8N. After five successively drilled holes, the evolutions become similar [3] 11
Figure 7: Different micro-hole quality obtained by gravity-feed drilling with a stainless steel 316L tool-electrode of 0.4mm in glass [17] 12
Figure 8: Sample of two micro-holes. Deformed micro-hole because of the tool bending (right) and well-defined circular (left) 13
Figure 9: Evolution of SACE glass gravity-feed drilling in the machining voltage U - drilling depth z plane [3] 13
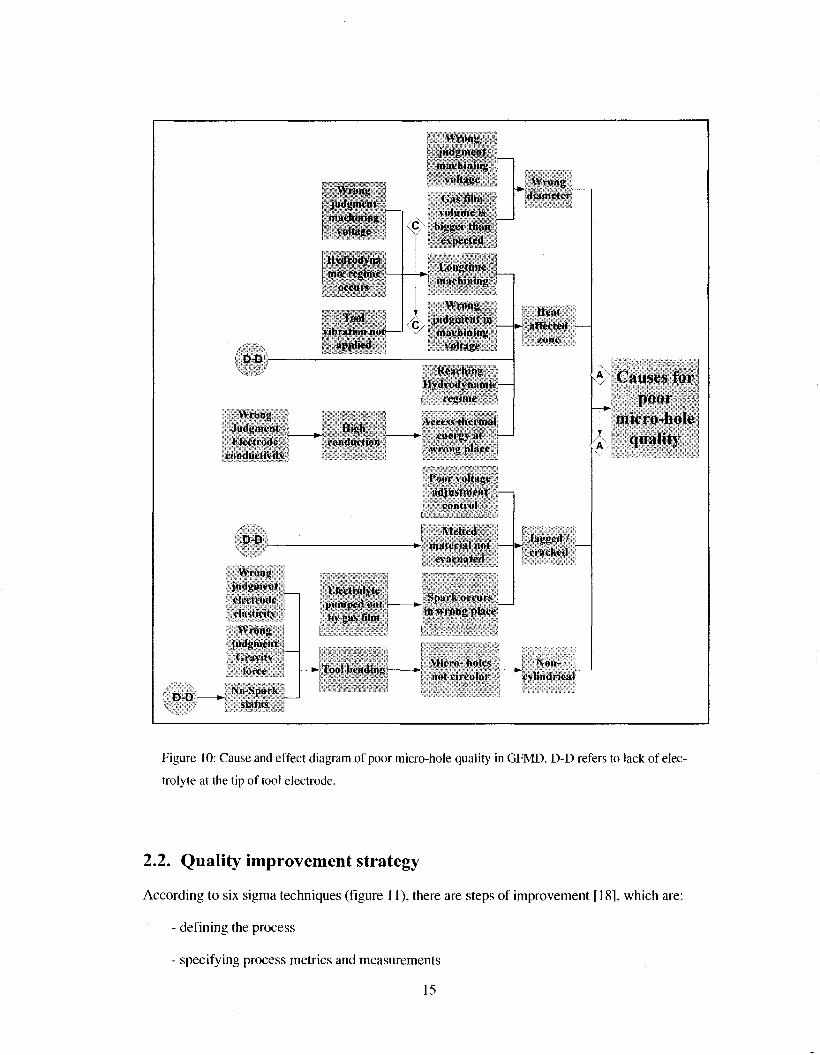
Figure 10: Cause and effect diagram of poor micro-hole quality in GFMD. D-D refers to lack of electrolyte at the tip of tool electrode 15
Figure 11: Step by step approach that is followed in this study [18] 16
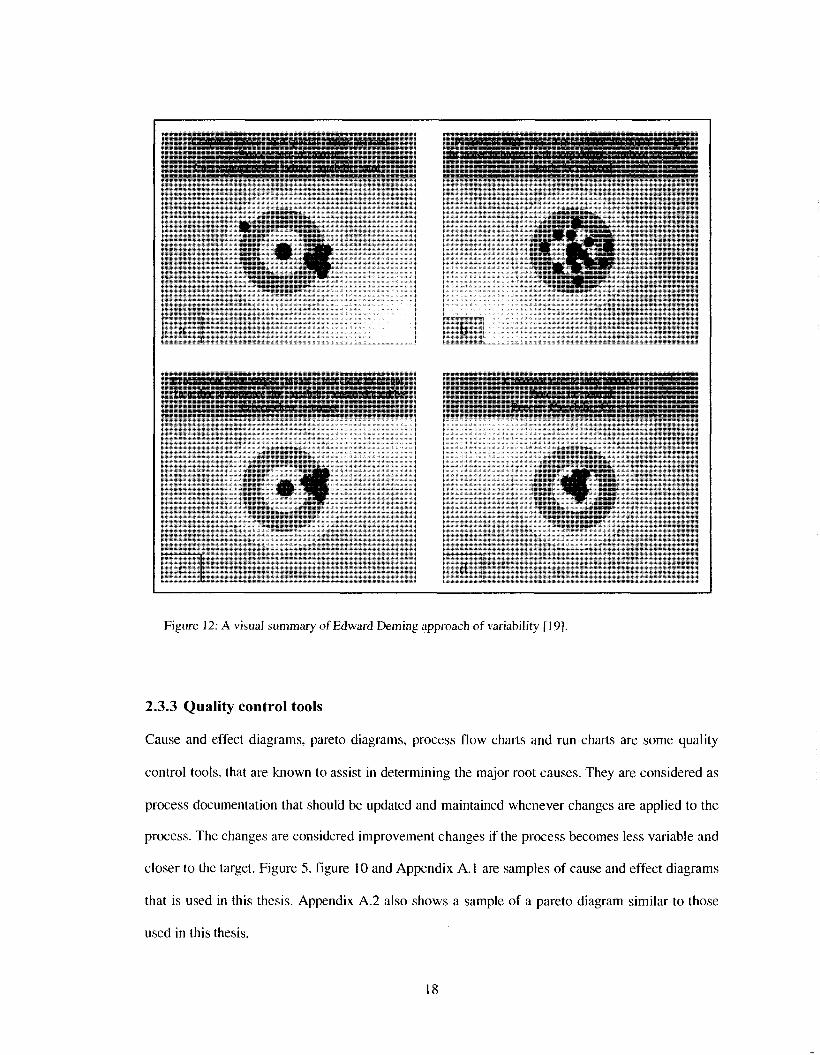
Figure 12: A visual summary of Edward Deming approach of variability [19] 18
Figure 13: Sample of a run charts. Dual run chart of the machining time with the traditional procedures and with the improved procedures 19
Figure 14: GFMD parameters flowchart. This flow chart is built by the author however all the information included is collected from SACE publications 20
Figure 15: Process capability plots for different stages of the process 22
Figure 16: Sketch of the heat transfer in gravity feed micro-machining. The heat is transferred by conduction to the tool electrode (1), by conduction and convection through the electrolyte (2 and 3) and by conduction and convection through the melted zone (4) 28
Figure 17: A sketch for a set of 50 holes at the same sequence of drilling used in the experiment. 29
Figure 18: Typical mean evolution of drilling for 0.5 mm diameter stainless steel( 316L), high carbon steel (HCS) tungsten (W) and copper (Cu) electrodes, at various machining voltages (28, 29, 32 and 35 V) 31
x

Figure 19: Current signals versus time of the electrochemical discharges for stainless steel electrode (316L), high carbon steel (HCS), tungsten (W) and copper (Cu) at 35V 32
Figure 20: The initial drilling speeds according to the slopes of the fitted curves at the start of the drilling, for 0.5 mm diameter stainless steel (316L), high carbon steel (HCS), tungsten (W) and copper (Cu) electrodes, at various machining voltages 33
Figure 21: Evolution of drilling depth as a function of time for stainless steel (316L) and tungsten (W) electrodes with a diameter of 0.5 mm, at 28 V machining voltage 34
Figure 22: Plot of the amplitudes vs. the duration of first seconds of drilling for the last 40 micro-holes, calculated from the real evolution data for stainless steel 316L electrodes, with a diameter of 0.5 mm, at 28 V machining voltage 35
Figure 23: Typical example of evolution versus time plot for two micro-holes: one machined after preheating the electrode and the other one machined with a tool electrode initially at room temperature. Electrolyte level is 1 mm, electrolyte is initially at room temperature 36
Figure 24: Pulse voltage, time-on time-off circuit, L=8 mH, R=12.8 Ohms, V=29 V electrolyte 30% wt. NaOH 37
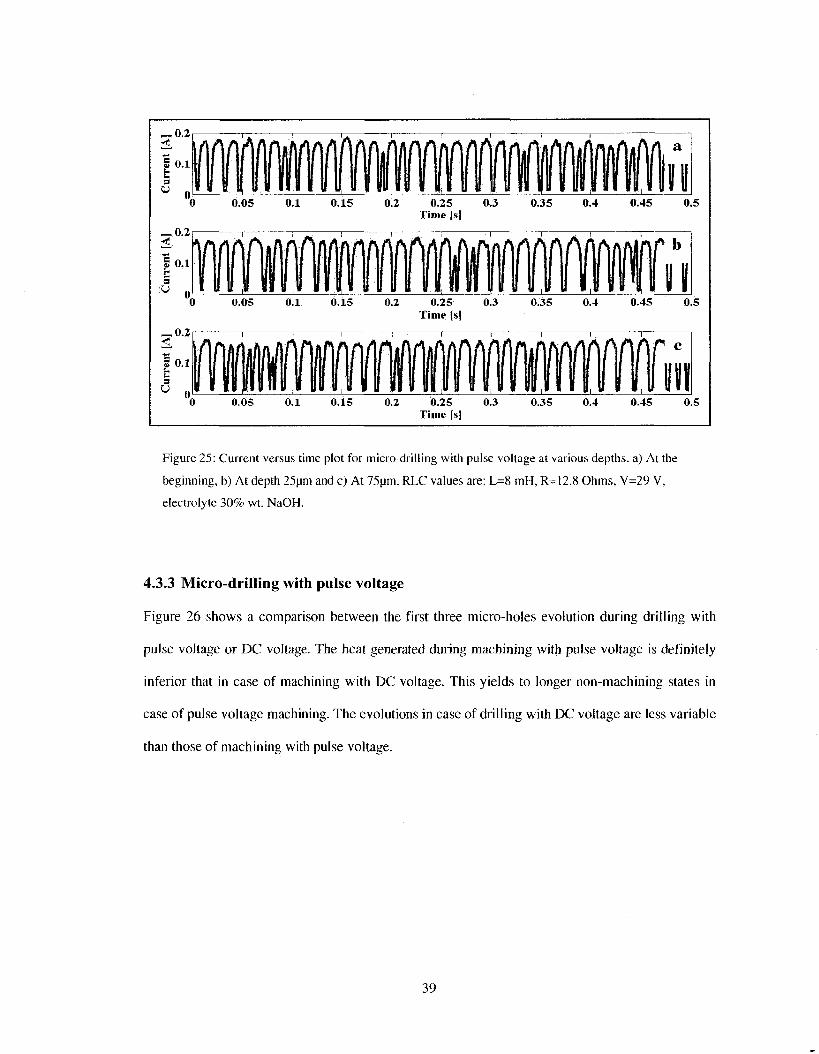
Figure 25: Current versus time plot for micro-drilling with pulse voltage at various depths, a) At the beginning, b) At depth 25pm and c) At 75pm. RLC values are: L=8 mH, R=12.8 Ohms, V=29 V, electrolyte 30% wt. NaOH 39
Figure 26: Evolution versus plots of sample micro-drills with pulse voltage (P) and DC voltage (N). The machining voltage is 29 V. The tool electrode is 0.5 mm stainless steel. The electrolyte is preheated to 60C and the electrode is preheated 40
Figure 27: Schematic of the electrical and mechanical components of the electrolyte circulation system. The heating system is a standalone system consisted of hot plate with built in stirrer and temperature probe 42
Figure 28: Evolution plots of micro-drilling with high electrolyte level and with low electrolyte level. Machining voltage is 29 V and electrode is stainless steel of 0.5 mm diameter 44
Figure 29: Evolution plots of two micro-drilling one is drilled with 80°C electrolyte and the other one is drilled without preheating the electrolyte initially. Machining voltage is 29 V and electrode is preheated before the start of the drilling, and it is 0.5 mm diameter stainless steel. The micro-hole depth is 50pm 45
Figure 30: The effect of manual adjustment of the electrolyte level in reducing the machining time. 46
Figure 31: Stair-case-like evolution that indicates slowdown or stopping in machining (right). Smooth drilling achieved by pulse voltage (left) 47
Figure 32: Comparison between the traditional drilling procedure and the improved procedures. The variability in the machining time is reduced and the mean machining time is minimized 48
Figure 33: Microscope image of a micro-hole, the vision program tracks the external profile, then ellipse fitting is performed, a is semi-major axis and b is semi-minor axis. (Images are taken by Olympus BX60M microscope with Infinity X digital camera) 50
XI

Figure 34: Well-defined circular contour (left) and full figured deformed micro-hole due to tool bending (right) [17] 52
Figure 35: Interval plot of mean texture for machining voltages of 28V, 29V, 32V and 35V machined during 60s 53
Figure 36: Interval plot of linear eccentricity (left) and texture of elliptic shape (right) with the machining voltages at machining voltages of 28V, 29V, 32V, 35V machined during 60s 54
Figure 37: The quality evaluation of the traditional process. Run charts of shape factor, texture and mean radius for set of 50 micro-holes drilled with the traditional procedures. The condition of the machining is listed in section 5.3.1. The machining voltage is constant 29V DC 55
Figure 38: Capability plots of the texture and the shape factor for the tradition process. The condition of the machining is listed in section 5.3.1. The machining voltage is constant 29V DC 56
Figure 39: Shape factor versus machining time for 3 sets of micro-holes machined at different depths. The variability of shape factor increases with increasing the depth 57
Figure 40: Run chart of drilling time in the case of drilling a micro-hole of fixed depth of 150um at 29V. The electrode is 0.5mm of tungsten. The tool electrode is not initially preheated, and the electrolyte is preheated to 80 °C 58
Figure 41: Shape factor versus machining time for two sets of micro-holes machined one with is machined using DC voltage and the other is machined using pulse voltage. The variability of pulse voltage drills is more significant. Drilling depth is 50um 59
Figure 42: The effect of preheating the tool electrode. The non-machining duration time is reduced. No significant change in quality is detected 60
Figure 43: Evolution plots of two micro-drilling one is drilled with 80°C electrolyte and the other one is drilled without preheating the electrolyte (room temperature). Machining voltage is 29 V and electrode is preheated before the start of the drilling, and it is 0.5 mm diameter stainless steel. The micro-hole depth is 50pm 61
Figure 44: The quality evaluation of the traditional and improved processes. Run charts of shape factor, texture and mean radius for set of 50 micro-holes. Both the traditional and the improved processes use the same setup, however in case of the improved process the electrode and electrolyte is initially preheated, manual adjustment of the electrolyte is performed and the pulse voltage with 29V is used 62
Figure 45: Capability plots of texture and shape factor for the improved process and the traditional process. Both the traditional and the improved processes use the same setup, however in case of the improved process the electrode and electrolyte is initially preheated, manual adjustment of the electrolyte is performed and the pulse voltage with 29V is used 63
Figure 46: Two micro-holes, one with less texturing (upper-left) and another one with better shape factor (lower-left) and the corresponding evolution plot of them (right) 64
Figure 47: Schematic of electrolyte levelling technique 66
Figure 48: Cross-section of electrolyte injecting tool. The electrolyte is dispensed internally to the machining zone to overcome the shortage throughout the drilling 67
xn

Figure 49: Helical tool electrode, to feed electrolyte into the machining zone to improve the chemical etching and to evacuate the melted material 68
Figure 50: Sketch of overall control system for GFMD. The vibration, pulse voltage and electrolyte feeding is synchronized 69
Figure 51: Cause and effect diagram of the process operational cost, if the research and development setup is used as a production setup for GFMD. A-A and B-B are described in figure 5 and figure 10 75
Figure 52: Pareto diagram of the major error states. The data is collected by an error frequency survey 76
Figure 53: The flow chart of the Micro-hole edge tracking vision system 77
Figure 54: The output of each step in the vision system 78
Figure 55: The ideal current signal from RL circuit (solid line) and the expected current response when connecting to the machining cell (hidden line) 79
Figure 56: Interpreting the electrolyte level as the interfacing area between the electrode and electrolyte. Ip is the current density of the cell, and S is the total interfacing area. The tool electrode is 0.5 mm in diameter and the current density is 1.0 — - 80
X l l l

List of Tables
Table 1: A quantitative comparison between ultra sonic machining (USM), abrasive jet machining (AJM), laser beam machining, conventional milling and spark assisted chemical engraving (SACE) 26
Table 2: A qualitative comparison between ultra sonic machining (USM), abrasive jet machining (AJM), laser beam machining, conventional milling and spark assisted chemical engraving (SACE) 27
Table 3: Thermal properties of the four tool electrode materials used in this study 30
xiv

List of Symbols
Notation
F
r
H
V
a
b
c
M
SF
^Tex
RP
Rv
Cp
Cpu
Cpl
Cpk
USL
LSL
o
Mean
S
r'
L
Interpretation
Drag force exerted on the electrode's tip by the melted zone [N]
Radius of the spherical object [m]
Molten mixture viscosity [kg/(m. s)]
Tool electrode velocity [m/s]
Major radius of the fitted ellipse [Pixels]
Minor radius of the fitted ellipse [Pixel]
Conversion factor
Mean radius [urn]
Shape factor [dimensionless]
Texture average (roughness) [um]
Magnitude of the maximum convex (peak) [um]
Magnitude of the maximum concave (valley) [ um]
Process Capability [dimensionless]
Upper Process Capability [dimensionless]
Lower Process Capability [dimensionless]
Process Capability index [dimensionless]
Upper specification limits [unit of metric]
Lower specification limits [unit of metric]
Population Standard deviation [unit of metric]
Population Mean [unit of metric]
interfacing surface [um2]
radius of electrode [urn]
level of the electrolyte [um]
XV

Chapter 1 Introduction
Spark Assisted Chemical Engraving (SACE) is a non-traditional micro-machining technology based
on electrochemical discharges phenomena [1]. It was originally developed for micro-hole drilling in
glass by Kurafuji and Suda [2]. SACE uses the heat generated by electrochemical discharges inside
a gas film around the tool for locally melting and etching the work-piece. It is a novel machining
alternative for fabricating prototypes of micro-fluidic devices, MEMS interfacing and micro-hole
drilling. In SACE's Gravity-Feed Micro-Drilling (GFMD), a constant force is applied vertically on
the tool electrode. In this case the tool electrode is always in contact with the work-piece. The
drilling by gravity-feed is faster compared to the other types of SACE machining, such as constant
velocity drilling. On the other hand, the disadvantage of using gravity-feed micro-drilling in SACE
machining is the risk of tool bending or breaking, as well as the lack of knowledge about the
particular effect of the interacted parameters and their role in forming the quality and the cost of the
final product. The heat generation and chemical effect are the two major factors that drive the
GFMD process.
SACE gravity-feed micro-drilling has two different regimes in function of the drilling depth: the
discharge regime (depths up to 200 to 300 m) and the hydrodynamic regime (depths more than
300 m) [3]. The discharge regime is controlled by the number of discharges taking place in the gas
film (by the applied voltage) [3, 4]. Fast drilling (up to about 100 m/s) occurs in this regime. On
the other hand, the drilling speed in the hydrodynamic regime is slower (a few m/s), because of the
shortage of electrolyte inside the micro-hole during the drilling, limited material removal by
chemical etching and the drag force exerted on the tool while penetrating in the molten work-piece
[3].
1
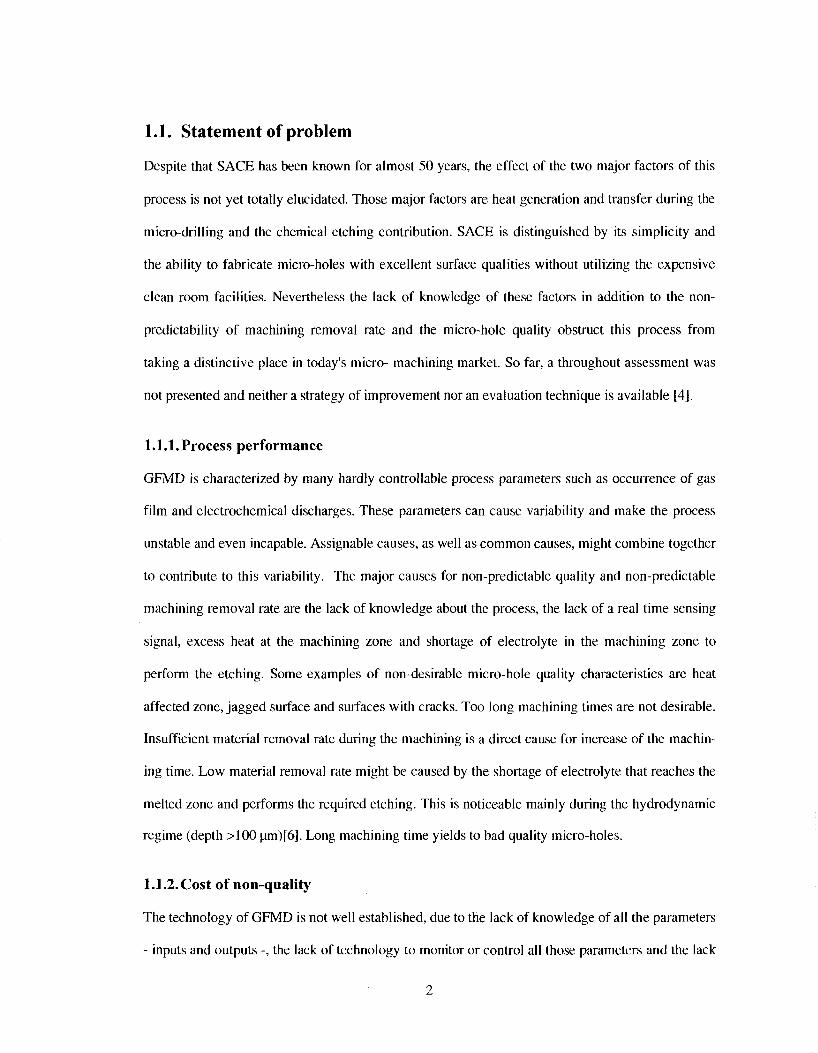
1.1. Statement of problem
Despite that SACE has been known for almost 50 years, the effect of the two major factors of this
process is not yet totally elucidated. Those major factors are heat generation and transfer during the
micro-drilling and the chemical etching contribution. SACE is distinguished by its simplicity and
the ability to fabricate micro-holes with excellent surface qualities without utilizing the expensive
clean room facilities. Nevertheless the lack of knowledge of these factors in addition to the non-
predictability of machining removal rate and the micro-hole quality obstruct this process from
taking a distinctive place in today's micro- machining market. So far, a throughout assessment was
not presented and neither a strategy of improvement nor an evaluation technique is available [4].
1.1.1. Process performance
GFMD is characterized by many hardly controllable process parameters such as occurrence of gas
film and electrochemical discharges. These parameters can cause variability and make the process
unstable and even incapable. Assignable causes, as well as common causes, might combine together
to contribute to this variability. The major causes for non-predictable quality and non-predictable
machining removal rate are the lack of knowledge about the process, the lack of a real time sensing
signal, excess heat at the machining zone and shortage of electrolyte in the machining zone to
perform the etching. Some examples of non-desirable micro-hole quality characteristics are heat
affected zone, jagged surface and surfaces with cracks. Too long machining times are not desirable.
Insufficient material removal rate during the machining is a direct cause for increase of the machin
ing time. Low material removal rate might be caused by the shortage of electrolyte that reaches the
melted zone and performs the required etching. This is noticeable mainly during the hydrodynamic
regime (depth >100 um)[6]. Long machining time yields to bad quality micro-holes.
1.1.2. Cost of non-quality
The technology of GFMD is not well established, due to the lack of knowledge of all the parameters
- inputs and outputs -, the lack of technology to monitor or control all those parameters and the lack
2
of knowledge about the significance of each parameter. All the significant parameters in GFMD
should be identified and well controlled or their non-desirable effects should be eliminated or at
least minimized. The delay in launching this technology (GFMD) might cost this process lost
opportunities for the competitor processes. On the other hand, Appendix A. 1 investigates primarily
the increase of the cost of GFMD in case the research and development setup is used for industrial
production.
1.2. Purpose of study
The purpose of this study is to investigate the effect of the main parameters of GFMD on the
product quality, the processing time and the behaviour of the drilling evolution. The initial docu
mentation of the process is created in order to start the continuous improvement procedures. The
statistical control tools are used to evaluate both the effect of the process parameters and the
proposed improvements. This thesis introduces an explicit identification of the GFMD process and
a strategy for quality improvement for the first time in the history of SACE and GFMD in particu
lar. This identification places GFMD in the first step of the improvement procedures 14]. The
parameter diagram, cause and effect diagrams and pareto diagram are used to find the major error
states. Then suggested improvement procedures are then introduced to minimize the variability in
both the quality and machining time. Quality evaluation metrics measured by an image processing
system is offered. Run charts and capability studies are used to evaluate the improvement in
micromachining with GFMD.
This accomplishment is not only necessary for improving GFMD to place itself in the competitive
market of micro-machining, but it also can be scaled to benefit similar SACE fabrication tech
niques, with minimum changes.
3
Chapter 2 Literature and theory
2.1. State of the art Spark Assisted Chemical Engraving
2.1.1 General overview
Spark Assisted Chemical Engraving (SACE) is a non-traditional micro-machining technology based
on electrochemical discharges phenomena [1]. It was originally developed for micro-hole drilling,
in glass, by Kurafuji and Suda [2]. SACE uses the heat generated by electrochemical discharges
inside a gas film around the tool for locally melting the work-piece. It is a novel machining alterna
tive for prototype fabricating of micro-fluidic devices, MEMS interfacing and micro-hole drilling.
Schematics of the SACE set-up is shown in figure 1. Two electrodes, dipped into an electrolyte are
supplied by a constant DC voltage. The cathode, with the smallest surface, is used as tool to
machine the work-piece [1]. SACE is based on electrochemical discharges which happen through a
gas film built around the tool-electrode. Material removal is believed to occur by a combination of
thermal and chemical effects. The exact mechanism is still under discussion in literature.
DC
Tool-electrode (-)
Glass sample\
Counter-electrode (+} (large electrode)
Voltage supply
Electrolyte ' ' i
a
Figure 1: Principle of SACE technology: the glass sample to be machined is dipped in an electrolyte
solution. A constant DC voltage is applied between the tool and counter-electrode [1].
4

2.1.2 Gravity-feed micro-drilling
Gravity-feed micro-drilling (GFMD) is one of the machining techniques used in SACE. In this
technique a constant force is applied vertically on the tool electrode. In this case the tool electrode is
always in contact with the work-piece. Micro-drilling by gravity-feed is faster compared to the other
types of SACE machining, such as constant velocity micro-drilling. On the other hand, the disad
vantage of using the gravity-feed micro-drilling in SACE machining is the risk of tool bending or
breaking of the work-piece. As during gravity-feed drilling the tool-electrode is constantly in
contact with the work-piece, drilling can be followed by measuring the progress of the tool-
electrode. Typical examples for glass drilling in function of various machining voltages are shown
on figure 2. Drilling was done with a 0.4mm cylindrical stainless steel cathode in 30%wt NaOH
[3].
Figure 2: Evolution versus time plot of four samples of micro-holes performed by gravity feed micro
drilling at different machining voltages [3].
5
2.1.3 Gravity feed micro-drilling sequences and procedure
Figure 3: Sketch of the SACE gravity-feed micro-drilling procedure.
Gravity Feed Micro-Drilling (GFMD) drilling was first presented by Kurafuji and Suda [2]. The
procedure that is the object of the present study is the one introduced by Wuthrich et al. [7]. The
work-piece is initially placed and clamped in position. The electrolyte is then poured inside the
electrolyte container, in which the work-piece is immersed. After the initial preparation, the micro-
drilling starts by detecting the surface of the work-piece. Subsequently, the power is switched on at
a constant voltage. The flexible holder leaves the tool electrode to move freely downwards, pene
trating the work-piece due to the electrochemical discharge activity (figure 3).
Figure 4 shows the machining set-up used for research purposes. The optical sensor detects the
motion of the tool electrode during the drilling. Calibration of the optical sensor with the displace
ment of the tool is performed.
6
/~ Flexible frame
Optica! sensor
/•—Top holder
Too! spindle
ir*t7 Tool electrode
{ Electrolyte I I Clamping fixture
Figure 4: Schematic for the initial setup of SACE gravity-feed drilling [4]. The constant force refers to
the weight of the drilling head (flexible frame, Top holder and tool spindle with the electrode.
2.1.4 Drilling regimes
SACE gravity-feed micro-drilling has two different regimes in function of the drilling depth: the
discharge regime (depths up to 200-300 um) and the hydrodynamic regime (depths more
than 300 urn) [3]. The discharge regime is controlled by the number of discharges taking place in
the gas film (by the applied voltage) [3, 4]. Fast drilling (up to about 100 um/s) occurs in this
regime. On the other hand, the drilling speed in the hydrodynamic regime is slower (a few u.m/s),
because of the shortage of electrolyte inside the micro-hole during the drilling, limited material
removal by chemical etching and the drag force exerted on the tool while penetrating in the molten
work-piece [3].
The hydrodynamic regime is strongly non-desirable. On one side it increases the drilling time, and
on the other side it is responsible for lowering the micro-hole quality as structural damages (micro-
cracks) of the drilled micro-holes happen in this regime. Solutions were proposed to minimize or to
eliminate the effect of the hydrodynamic regime. For constant velocity feed, Gautam et al. [5] were
able to demonstrate that adding orbital motion to the vertical motion improves the material removal
7
I Counter electrode (Stainless steel
ring) Work-piece
\

rate. Vibration motion of the tool electrode was proposed by Wuthrich et al. |6J and it was demon
strated to be efficient in gravity-feed micro-drilling.
2.1.5 Viscosity of the machining zone within the hydrodynamic regime
Recently a model was presented by Maillard et al. [7, 8] predicting the limiting velocity of hydro-
dynamic regime in SACE gravity-feed Micro-drilling. Maillard's model is based on the relation
between the limiting speed of the tool electrode and the resisting drag force. The drag force is
function of the viscosity of the melted zone in front of the tool-electrode. The thermal conductivity
of tool electrode controls the amount of thermal energy of the electrochemical discharge removed
through the tool. This later leads to temperature variations of the molten work-piece in front of the
tool yielding to changes in viscosities.
The dynamic viscosity of the machining zone in front of the tool tip during the hydrodynamic
regime is obtained for all the tool electrodes using Maillard's model [7, 8J. This model assumes that
the drag force - according to Stokes' law - is proportional to the limiting velocity with a proportion
ality constant that depends on the radius and shape of the electrode and the viscosity of the molten
mixture. As the tool electrode moves through the fluid at the melted zone with a small velocity (i.e.
low Reynolds number, Re < 1), then Stokes' law can be used as described below:
F = 6TiruV (1)
where
F: is the drag force exerted on the electrode's tip by the fluid of the melted zone [N]
r: is the radius of the spherical object [m]
u: is the molten mixture viscosity [kg/(m. s)J
V: is the electrode's velocity [m/s]
2.1.6 Material removal mechanism
Several processes are presumed to contribute in the material removal mechanism [14]. These are
generally:
8

- Melting and vaporization due to electrochemical discharges
- High temperature chemical etching
- Differential expansion of constituents and weathering
- Mechanical shock due to expanding gases and electrolyte movement
In this investigation, only thermal effects and chemical etching were investigated in SACE machin
ing literature.
2.1.7 Chemical etching contribution
An electrolyte composition of NaOH with a concentration of about 30% in weight is a good
choice and is commonly used [2]. If very thin substrates have to be machined, the concentration
should be reduced [13]. The mean temperature of the electrolyte affects material removal rate. To
the author's knowledge electrolyte level and electrolyte circulation were not yet systematically
investigated in SACE machining literature. On the other hand, some studies focused on the promo
tion of the chemical etching by changing the tool-electrode shape [3], by tool-electrode vibration [6]
and tool-electrode rotation [15], or by adding abrasive to the electrolyte [16].
9
\Ynni<: jutt^nii-nl
r irr lr i i l>lr Man-rial
Proi'i'si n'ijiiiri'iiii'iiC>
I'llK'ISS
IMjIlil t'llKIIIS -
Micro wiile
Ural tr:lilslt-|- -
D-D
\»i;rrssi\ i* I'lt'ili'iil.Mt' :nul
U'lnprralurrs in\ohc(l
Si'llsiliir svnsuis - mill a i tualms -
rcqiiiiTd
I iapomtioii of t 'k ' i - l ruhU'
( ht'iiiii-ul
r i a d i o i l
< ills l i l l l l l l l l l l i l l t 'S
I'liTl n i h i l 1
Y Mipoi'iiliiin &
No vk-i'l nihil-. i i i i i l . i i inn
I uvk of Umiwli'ilsji' of all I hi- pai-uiiK-U'i-N
Niin-iiH-asiiiarik' p a i a im- l i .T\
IU:il lime • i i i i i i i i in i i i i» a n d -
control hit>h insl
hisuflki i i i l I ' l l T l l o l M f
comi'iilriilion
I U ' l l l o l W l ' i l i n s
nol IVHI'II tin' -
t inIrmli- lip
Slim laur (il r l f i ' l r o h t t '
Kr.H l i ini .
l l s i l i u i h n a i l i i r
i i -^ i inc
Nol all SIUILIN - • » • . .
art- mnuiloiiil
i;.i^ iiim IMHII I
lip .Mill lit'.lli -~\ ilo.» 11 nol
iil'iiln'i.llili'
N o i i>nI ill iciiis
r l i l i i n . : .11 lilt
*• l l l l l l l ' l l / n l U -
h \ rlii
i ' l n i M - I W i
N o s p a r k
s ia t i iv
N o n -
: • p r e d i c t a b l e
M R R
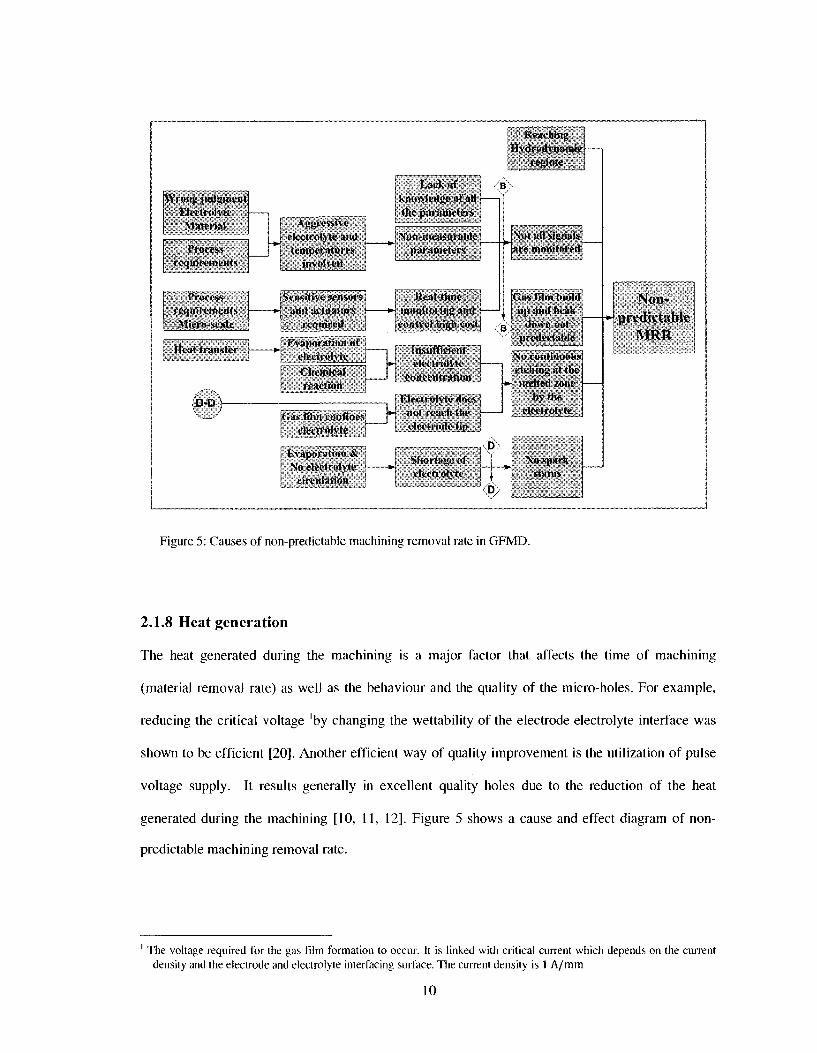
Figure 5 : Causes of non-predictable machining removal rate in G F M D .
2.1.8 Heat generation
The heat generated during the machining is a major factor that affects the time of machining
(material removal rate) as well as the behaviour and the quality of the micro-holes. For example,
reducing the critical voltage 'by changing the wettability of the electrode electrolyte interface was
shown to be efficient [20]. Another efficient way of quality improvement is the utilization of pulse
voltage supply. It results generally in excellent quality holes due to the reduction of the heat
generated during the machining [10, 11, 12]. Figure 5 shows a cause and effect diagram of non-
predictable machining removal rate.
The voltage required for the gas film formation to occur. It is linked with critical current which depends on the current density and the electrode and electrolyte interfacing surface. The current density is 1 A/mm
10
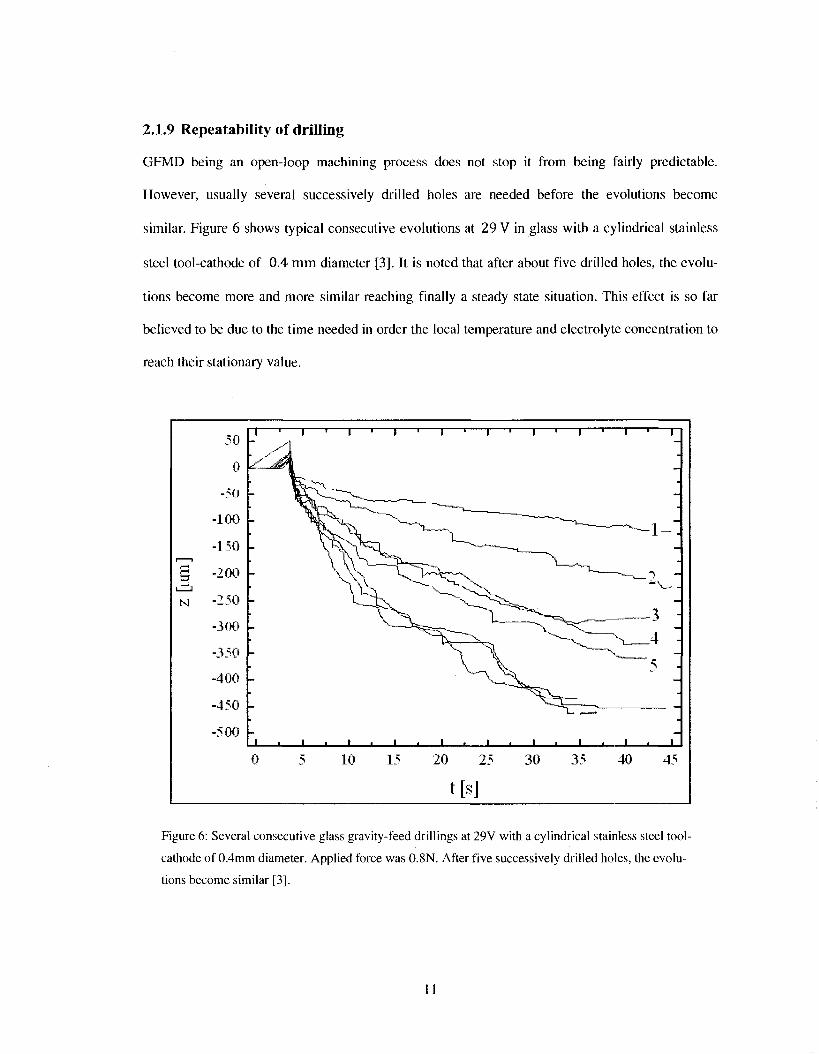
2.1.9 Repeatability of drilling
GFMD being an open-loop machining process does not stop it from being fairly predictable.
However, usually several successively drilled holes are needed before the evolutions become
similar. Figure 6 shows typical consecutive evolutions at 29 V in glass with a cylindrical stainless
steel tool-cathode of 0.4 mm diameter [3]. It is noted that after about five drilled holes, the evolu
tions become more and more similar reaching finally a steady state situation. This effect is so far
believed to be due to the time needed in order the local temperature and electrolyte concentration to
reach their stationary value.
Figure 6: Several consecutive glass gravity-feed drillings at 29V with a cylindrical stainless steel tool-
cathode of 0.4mm diameter. Applied force was 0.8N. After five successively drilled holes, the evolu
tions become similar [3].
11
2.1.10 Influence of inter-electrode resistance
It is well known that the gas film is unstable (i.e. the gas film often breaks and has to be building up
again). The gas film formation time is an important parameter for the mean machining speed of
SACE [4] and may become a significant limitation of the drilling speed. The more frequent the gas
films build-up and break-up is, the slower the drilling process will be. The gas film formation time
is, besides other parameters, controlled by the inter-electrode resistance [4]. Higher resistances
results in general a slower gas film formations.
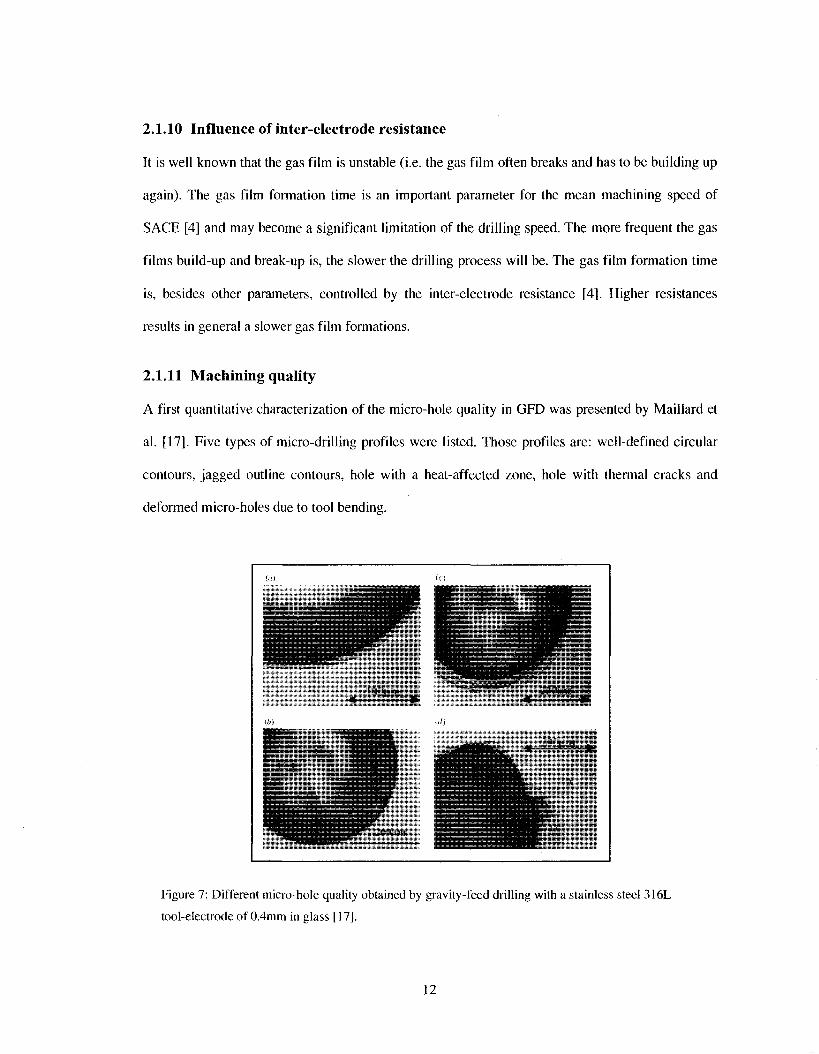
2.1.11 Machining quality
A first quantitative characterization of the micro-hole quality in GFD was presented by Maillard et
al. [17]. Five types of micro-drilling profiles were listed. Those profiles are: well-defined circular
contours, jagged outline contours, hole with a heat-affected zone, hole with thermal cracks and
deformed micro-holes due to tool bending.
Figure 7: Different micro-hole quality obtained by gravity-feed drilling with a stainless steel 316L
tool-electrode of 0.4mm in glass [17].
12

- Well defined cylindrical contours with smooth surface (figure 7a): The entrance of the
hole is well defined and characterized by a smooth surface.
- Jagged outline contours (figure 7b): The contour is no longer smooth but jagged.
- Hole with heat affected zone (figure 7c): The contour remains cylindrical.
- Hole with thermal cracks (figure 7d): The hole is characterized by cracks and a large
heat affected zone.
- Deformed holes (figure 8): The hole tends to be more elliptic in shape. This is caused by
the bending of the tool during the machining.
Figure 8: Sample of two micro-holes. Deformed micro-hole because of the tool bending (right) and
well-defined circular (left).
Figure 9: Evolution of SACE glass gravity-feed drilling in the machining voltage U - drilling depth z
plane [3].
13
Figure 9 summarizes the different types of micro-holes that are obtained by gravity-feed drilling in
function of the machining voltage and the drilling depth. At the discharge regime (less
than 100 urn) higher voltage results in faster drilling without loss of quality. However, as the tool is
going deeper into the work-piece, the difficulty in removing the melted material and insufficient
wetting of the tool tip increases. This causes the discharge to take place in the upper part of the tool,
resulting in a jagged contour and increase of the micro-hole diameter. As the drilling goes on, the
micro-hole diameter increases. In this situation the border of the hole is not heated enough to be
melted or etched. The micro-hole does no longer increase but a heat affected zone starts growing
instead. If the supplied heat power is too high thermal cracks appear.
According this description, deep holes should always have a lower quality than holes with a depth
less than typically 100 um.
Figure 10 shows some factors that cause poor quality in GFMD. The wrong choices of machining
voltage, electrode material and geometry or wrong choice of the gravity force seem to be the main
causes of the possible poor quality. In edition, the lack of electrolyte and the excess heat contribute
in producing micro-holes of poor quality.
14
D - D -
n-n \j \J
W rung Judgment Neclrudc
conducts i l \
D-D
\ \ rung judgment electrode rl:isfirif\
\ \ rong judgment
(•r:i\il> Uircc
No-Spark stains
\ \ roiig judi;iiii*iit machining
\l)llil«C
Ihdrodinu
I I I IL I I M I I I H (K'VIIIS
Tool vibriition m i l —
upplicd
„ "ish conduction
L lee Indite Ikll I t l IK'f 1 ( t i l l I ' l l I I I IJ» I I (111 1
hi !>as film
•• lonl hending —
\ \ roil}; judgment machining
wdlagc
(.;i.s film
Milumc is
<C bigger than
c\pcclcd
i __ 1 onglimc machining
\ \ rung
_ judgment in - / machining
\ ullage
Reaching 1 Ki l rodj naniic
regime
Access thermal
\ \ rung diameter
I leal »- alTeclcd —
/one
urnng pliicc
Poor \oltage adjustment —
control
Melted •• material mil —
evacuated
Spark occurs
.lagged / cracked
in « rong place
M i n n - holes Nullum ciiTiilar cylindrical
* Causes for
poor micro-hole
Figure 10: Cause and effect diagram of poor micro-hole quality in GFMD. D-D refers to lack of elec
trolyte at the tip of tool electrode.
2.2. Quality improvement strategy
According to six sigma techniques (figure 11), there are steps of improvement [18], which are:
- defining the process
- specifying process metrics and measurements
15

- analysing the measured data and observations
- improving the process.
-control the process by documenting the results and continuously improving the process.
This procedure is suggested to be followed as a guideline for the improvement. Shall this procedure
is followed; a new era of improvement can be achieved. This improvement is systematic, unlike the
traditional trial and error approaches.
Identify Problems •% #
Define Condition Define
Determine Causes Measure
^ Develop Solutions , j Analyse
1 Prepare action plans,
Implement improvements
Long Term Implementation
>"**„ Improve :
Verify Results > Control
Document, Communicate and Check for replication and sustainability
Figure 11: Step by step approach that is followed in this study [18].
2.3. Statistical process control
Statistical Process Control tools (SPC), including cause and effect diagram, pareto diagram, run
charts and capability analysis, should be used in order to determine the major causes of the process
variability, and then to obtain quantitative indications of the process improvement.
2.3.1 Process definition and initial documentation
The definition of the process is the first step in performing the improvement. Initial documentation
such as parameter diagram, cause and effect diagram are required to be created and then continu-
16
ously updated, in order to ease the handling of the knowledge about the process during the im
provement and changes.
2.3.2 Process variability
The variability in a process can be categorized as either common (random) or special caused
(assignable) variability [18]. The common cause (chance cause) variability is the natural variability
every process experiences. Its existence is due to randomness as we can find purely random
variability from one product to another. A process that operates with only common cause variability
is said to be in-control. The special cause (assignable cause) variability is a result of factors that are
not purely random. These factors cause significant differences in the process and as a result they
lead to low quality and poor process performance. The process that operates in the presence of
special causes of variability is said to be out-of-control. This type of variability can be detected with
run charts or control charts giving us the ability to remove its effect and therefore reduce the overall
variability. As a result, removing special causes leads to an improvement of the quality. In other
words guiding the process from out-of-control status to in-control status shall yield to a better
stability in the process. Figure 12 shows a summary of Edward2 Deming's approach of variability
[19].
2 An American statistician, widely known for his approaches in total quality management and for his recognizable work, on product quality improvement in Japan.
17
f ••iniiiuu irfatf- .rifl •jirrui < J'.I *, J.*IH ,=I _ JPror*« ont-of-control
ConeMismcfttStdbefcuetapabitm -«ud}
* M i a i
Pi ©cm (at from fits-get (mt-ao i; not do-.f io i.ugef) In 01 tier to improve- the c.ip.ifcitity msnti thfiitttt he
tiiivvii (1D;C IQ taigfrt
• «
l"
P.-.n", df Liih p i ( i d i^-'iindanldfiniK'n ii lujjh) In •-uisi Nunpioif- rlir i;i|i.ibi!itTS.:iui1;ird dcnr.ium
".ic.il'l l<r n-tliiird
• * • *
•
ll
Common c»ir;r; only pnetut PtocME in fomrol
Pi ocei% Opabittty Op = I [
«
: « 1 i
Figure 12: A visual summary of Edward Deming approach of variability [19].
2.3.3 Quality control tools
Cause and effect diagrams, pareto diagrams, process flow charts and run charts are some quality
control tools, that are known to assist in determining the major root causes. They are considered as
process documentation that should be updated and maintained whenever changes are applied to the
process. The changes are considered improvement changes if the process becomes less variable and
closer to the target. Figure 5, figure 10 and Appendix A.l are samples of cause and effect diagrams
that is used in this thesis. Appendix A.2 also shows a sample of a pareto diagram similar to those
used in this thesis.
18
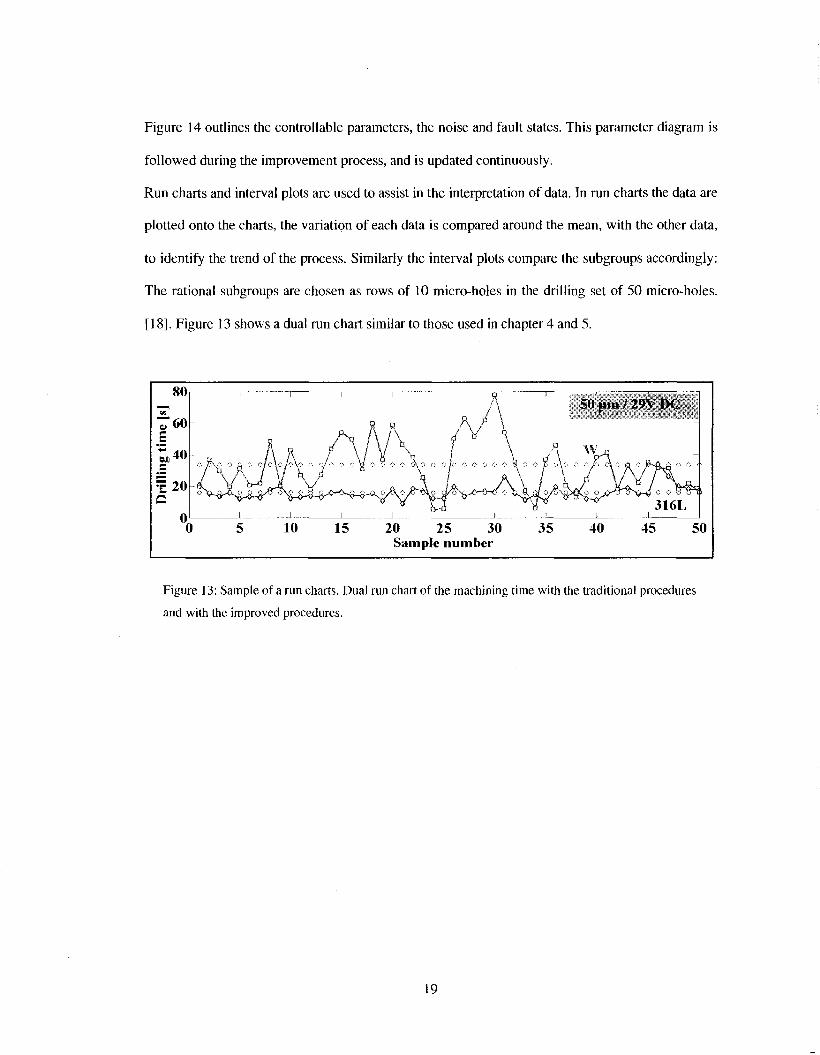
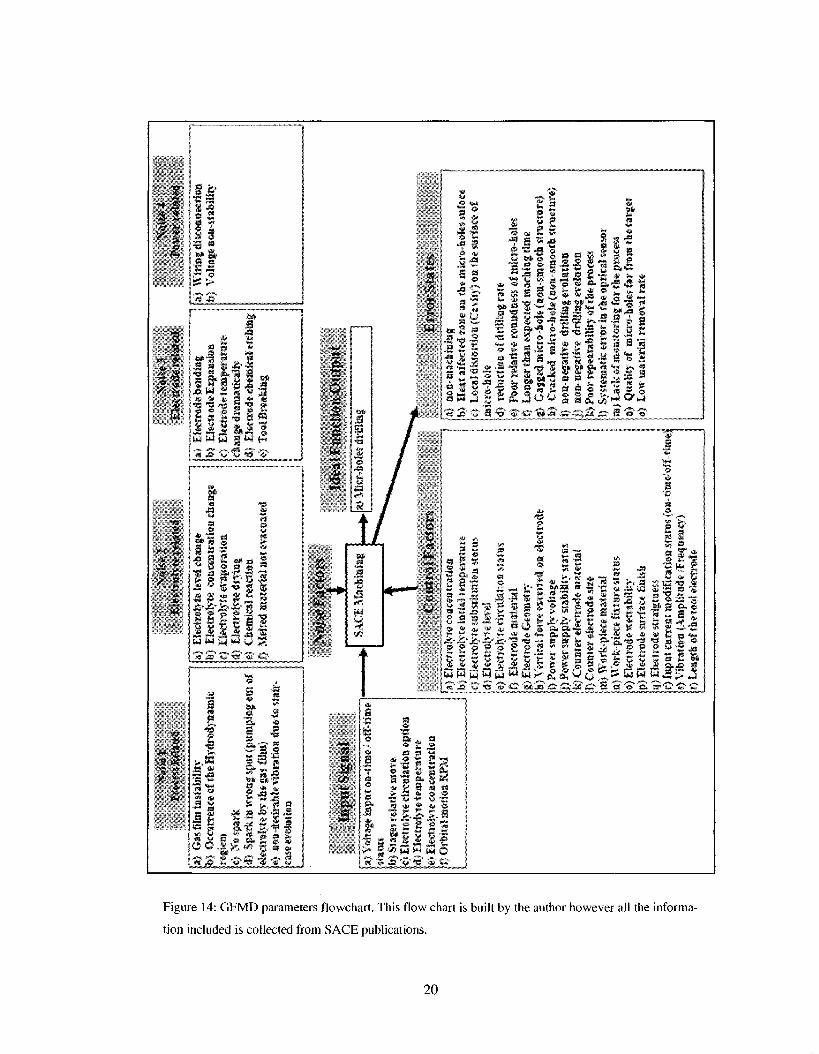
Figure 14 outlines the controllable parameters, the noise and fault states. This parameter diagram is
followed during the improvement process, and is updated continuously.
Run charts and interval plots are used to assist in the interpretation of data. In run charts the data are
plotted onto the charts, the variation of each data is compared around the mean, with the other data,
to identify the trend of the process. Similarly the interval plots compare the subgroups accordingly:
The rational subgroups are chosen as rows of 10 micro-holes in the drilling set of 50 micro-holes.
[18]. Figure 13 shows a dual run chart similar to those used in chapter 4 and 5.
Figure 13: Sample of a run charts. Dual run chart of the machining time with the traditional procedures
and with the improved procedures.
19
2*
«•* %
sec
If It
-.1
If
I US
o £1
• a * ?$
* p
22 £ is £ H «*
S U4 u3 U4 w 2?
)j£ *0
W" XS •&• C£°
1
3 £
II U 2 • !« ST £ , « St
£^ £) i & I H : 2
"* *g O SI *-„ »«, O s-fc 1* a *
S
" o
Jul
X I
9
s
1 : n
1 III! ! Hi!! !! IP 1I1IIH
ifliliilliii ffilfillilli
JUMIIIIIII
Figure 14: GFMD parameters flowchart. This flow chart is built by the author however all the informa
tion included is collected from SACE publications.
20
2.3.4 Process capability
The improvement can be measured in a quantitative fashion using the capability measures, which
are:
- Process Capability (Cp) is a simple and straightforward indicator of process capability. And can be
calculated as:
Cp = (USL - LSL)/6a (2)
Where:
USL: is the upper specification limits
LSL : is the lower specification limits
o~: is the standard deviation of the population
- Process lower half capability (Cpl). Can be calculated as:
Cpl = (Mean - LSL)/3a (3)
Where:
Mean: is the mean of the population
- Process upper half capability (Cpu). Can be calculated as:
Cpu = (USL - Mean) /3a (4)
- Process Capability Index (Cpk) is an adjustment of (Cp) for the effect of non-centred distribution.
And can be calculated as:
Cpk = Min(Cpl,Cpu) (5)
The ultimate desired process is the one in which the distribution of the population reside between
the upper and lower specification limits. In such process 99.73% of the values measured lie in
21

interval of width of six sigma (6a). Calibration and design of experiment are used to drive the
process to the desired target and to reduce the variability.
Figure 15: Process capability plots for different stages of the process.
Figure 15 shows thee stages of the process, which are:
- Instable process, where the variability is significant and the process is away from the target.
- Improved process, where the variability is minimized and the process is much closer to the target.
- Desired process, where the variability is eliminated and the process is at the target [18].
2.4. Summary
In this chapter the state of the art of GFMD is reviewed and found to have a potential for improve
ment. Although it is a cheap and simple process, it has neither predictable machining removal rate
nor predictable micro-hole quality. Both thermal and chemical effects need to be focused at. Six
sigma policy of improvement is proven to be effective. This improvement will be carried and
analyzed in this study and shall be evaluated and measured by using some quality tools such as
22

capability. Cause and effect diagrams are necessary to determine the major root causes of the non-
predictability of both machining removal rate and micro-hole quality. The pareto diagram is then
used to determine the major root causes to be eliminated or minimized.
23
Chapter 3 Gravity feed micro-drilling improvement
3.1. Potential for improvement
In GFMD quality and material removal rate are the most important aspects for improvement. To
improve quality, chemical etching should be promoted in order for the machining to progress
efficiently. Heat generated in the machining area should be correctly adjusted to avoid heat affected
zones and thermal cracks. Other factors relate to the material of the tool electrode and geometry.
Furthermore, to improve the material removal rate the following elements are known to be efficient:
tool motion (rotation and vibration) and addition of abrasives to the electrolyte. However, the
absence of systematic improvement strategies and lack of knowledge about several interactions in
the GFMD process are the major breaks towards improvement according to the author's prospec
tive. For example, the absence of improvement strategy yields to disorganized and non-systematic
improvement (trial and error approach) which delays the improvement process.
3.2. Thesis outline
Four topics are investigated in this study. Two are industrial engineering concerns and the other two
are fundamental aspects about the SACE process. The industrial engineering include presenting an
improvement policy and quality investigation. The fundamental study is investigating two major
factors in the GFMD which are the heat transfer during the process and the effect of the electrolyte
level and temperature on the machining. These aspects, where knowledge is still insufficient so far,
are important for further process improvements.
3.2.1 Presenting a strategy for improvement
As discussed in the previous chapter, six sigma procedures are introduced to be a good path to
follow during the improvement process. The parameter diagram and cause and effect diagrams are
24

used to simplify and summarize the considerable amount of knowledge that is accomplished over
the years. This builds the first base of process documentation. For the first time something exclud
ing trial and error is introduced. Quantitative measure of the overall process are provided according
to metrics that not only linked to quality of the fabricated parts but could be linked to one or more
other process metrics like time and non-machining magnitude3. Figure 15 outlines the controllable
parameters, the noise and fault states. This parameter diagram is followed during the improvement
process, and is updated continuously.
3.2.2 Investigating the heat transfer in the process
The interaction between tool-electrode thermal conductivity and both the material removal rate and
the quality of the micro-holes are investigated. The effect of the discharge activity and heat capacity
coefficient of the tool electrode material shall affect the drilling.
3.2.3 Investigating the pulse voltage
The machining time and micro-hole quality with pulse voltage is studied. They are then compared
with those of DC voltage machining.
The results of this investigation showed significant variability that could be related to insufficient
control of electrolyte level. This revelled that the electrolyte level is much more significant than
considered so far.
3.2.4 Investigating the electrolyte temperature and level
The electrolyte interaction with both the machining removal rate and quality of the micro-holes is
investigated. The direct effect of combining preheating the electrode with preheating the electrolyte
is noticed to minimize the non-machining magnitude and duration.
Non-machining magnitude is the positive evolution detected by the optical sensor at the first seconds of micro-drilling.
25
3.2.5 Introducing improvement procedures
Adding the pulse voltage and manual adjustment of the electrolyte to the preheating of the electrode
and electrolyte is offered as an alternative procedure. It minimizes the variability and non-
repeatability in both the machining time and micro-hole quality.
3.3. Benchmarking
In order to set the goals of improvement, an explicit knowledge about the competitive processes is
accumulated. Comparing SACE with other machining processes is completed to know the issues
that the improvement should focused at. Although GFMD has some advantages compared to most
of those processes - like its simplicity and its cheaper costs-, yet these processes have some major
advantages over GFMD especially when it comes to the quality of the machined parts and the
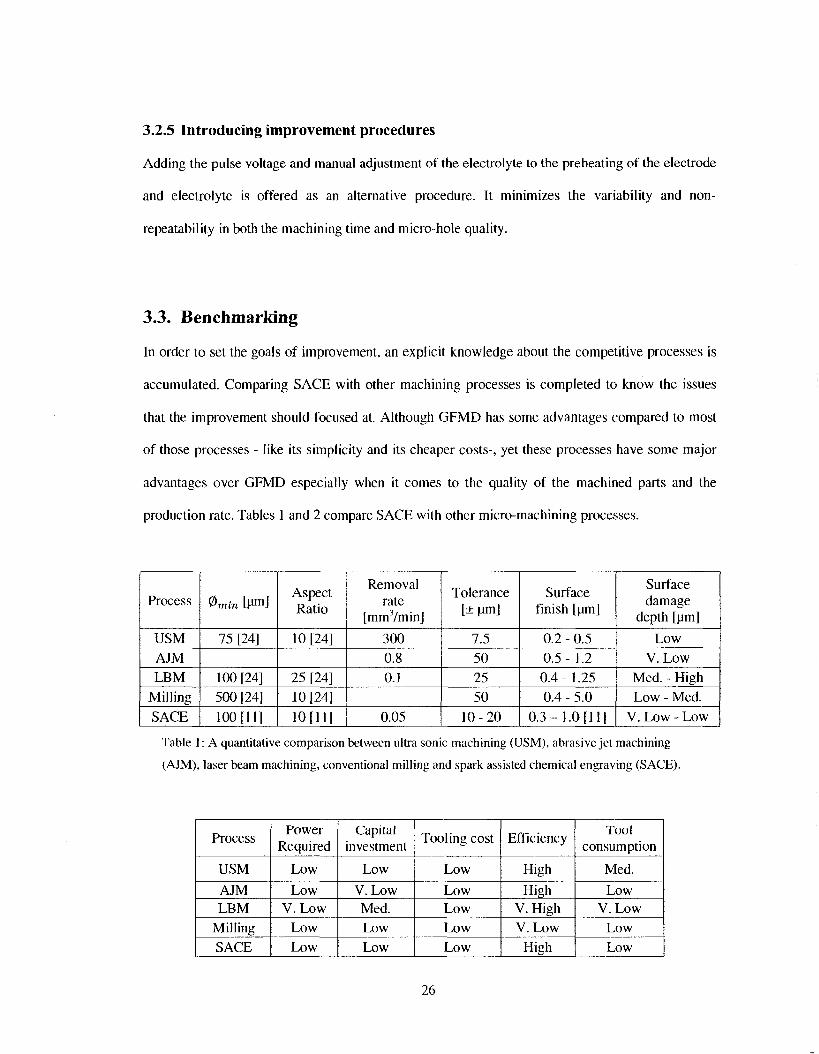
production rate. Tables 1 and 2 compare SACE with other micro-machining processes.
Process
USM AJM LBM
Milling SACE
®min [Mm]
75 [24]
100 [24] 500 [24] 100 [11]
Aspect Ratio
10 [24]
25 [24] 10 [24]
10[11]
Removal rate
[mm3/min]
300 0.8 0.1
0.05
Tolerance [±pm]
7.5 50 25 50
10-20
Surface finish [pm]
0.2 - 0.5 0.5- 1.2 0.4- 1.25 0.4 - 5.0
0.3 -1 .0 [11]
Surface damage
depth [|am]
Low V. Low
Med. - High Low - Med.
V. Low - Low
Table 1: A quantitative comparison between ultra sonic machining (USM), abrasive jet machining
(AJM), laser beam machining, conventional milling and spark assisted chemical engraving (SACE).
Process
USM
AJM LBM
Milling SACE
Power Required
Low
Low V.Low
Low Low
Capital investment
Low
V.Low Med. Low Low
Tooling cost
Low
Low Low Low Low
Efficiency
High
High V. High V. Low
High
Tool consumption
Med.
Low V. Low
Low Low
26

Table 2: A qualitative comparison between ultra sonic machining (USM), abrasive jet machining
(AJM), laser beam machining, conventional milling and spark assisted chemical engraving (SACE).
The use of bechmarking shall be used at further stages of the improvement combined with customer
survays and the focus groupes to determine the desired characterestics to be changes. One of this
thesis outcomes is to increase the machining removal rate of GFMD to compete with Laser Beam
Machining (LBM).
3.4. Summary
This chapter outlined the needs of improvement in the rising technology of SACE. The imple
mented efforts are listed. The competitive advantage gained by SACE is combining simplicity and
low-cost with high aspect ratio and smooth surface finish. As long as these values are well-
preserved and intensified, this process will take a share in the market of micro-fabrication.
The major issues that are focused at in this study are the properties of the tool electrode effect on the
drilling evolution. Pulse voltage is introduced to minimize the instability of the gas film formation,
the preheating of the electrode combined with preheating the electrolyte are introduced to minimize
both the non-machining magnitude and duration, and the manual level adjustment is proposed to
minimize the variability in the electrolyte level (electrode and electrolyte interfacing surface).
The following chapters shall include the topics related to the thermal properties of the tool, im
provement procedures and the quality evaluation of the traditional and new approaches.
27
Chapter 4 The heat generation in gravity feed micro-drilling
4.1. Introduction
This chapter studies the effect of thermal conductivity of tool electrode material on the evolution of
the tool electrode in both the discharge regime and the hydrodynamic regime. The non-machining
status, occurring in the first seconds of machining, assessment of its root cause and proposed
solutions are introduced and tested. Moreover machining with pulse voltage is implemented and
investigated. The importance of electrolyte level especially in pulse voltage machining is discussed.
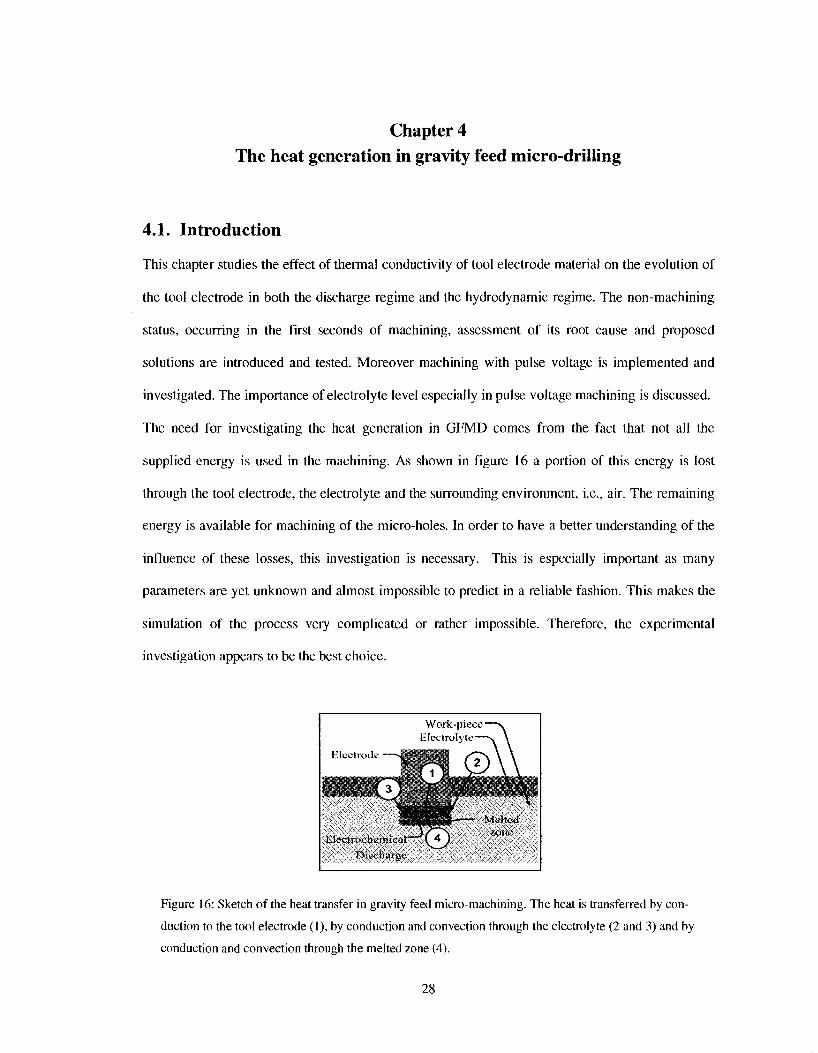
The need for investigating the heat generation in GFMD comes from the fact that not all the
supplied energy is used in the machining. As shown in figure 16 a portion of this energy is lost
through the tool electrode, the electrolyte and the surrounding environment, i.e., air. The remaining
energy is available for machining of the micro-holes. In order to have a better understanding of the
influence of these losses, this investigation is necessary. This is especially important as many
parameters are yet unknown and almost impossible to predict in a reliable fashion. This makes the
simulation of the process very complicated or rather impossible. Therefore, the experimental
investigation appears to be the best choice.
Figure 16: Sketch of the heat transfer in gravity feed micro-machining. The heat is transferred by con
duction to the tool electrode (1), by conduction and convection through the electrolyte (2 and 3) and by
conduction and convection through the melted zone (4).
28
4.2. Thermal conductivity of tool electrode
This investigation is performed in order to evaluate the effect of thermal conductivity of the tool
electrode material in both the discharge regime and the hydrodynamic regimes.
4.2.1 Experimental procedure
The experimental setup for theses series of experiments is similar to that described in figures 3 and
4. A controlled output power supply provides the required machining voltage (constant voltage)
between the tool electrode and the counter electrode. In addition, an optical sensor measures the tool
evolution in real time.
The work-piece is initially placed and clamped in position. The electrolyte is then poured inside the
electrolyte container in which the work-piece is immersed. After the initial preparation, the micro-
drilling starts by detecting the surface of the work-piece. Subsequently the power is switched on at a
constant voltage. The flexible holder leaves the tool electrode to move freely downwards, penetrat
ing the work-piece due to the electrochemical discharge activity (figure 3). The force pushing on the
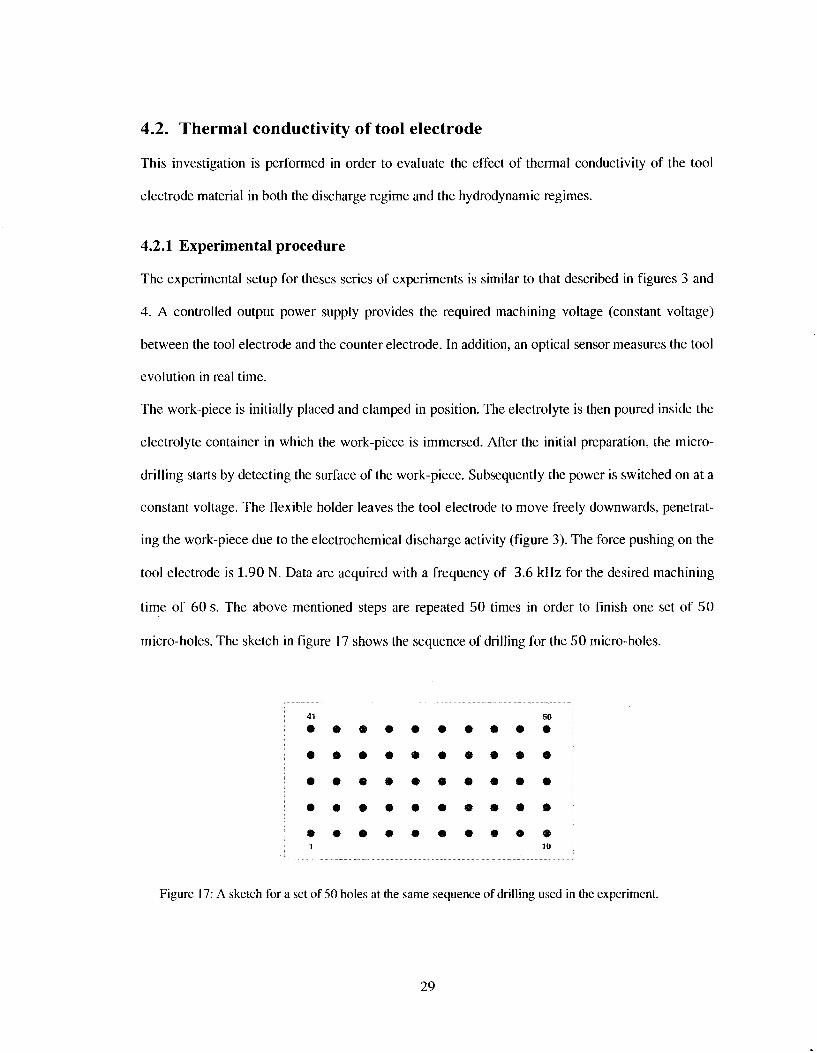
tool electrode is 1.90 N. Data are acquired with a frequency of 3.6 kHz for the desired machining
time of 60 s. The above mentioned steps are repeated 50 times in order to finish one set of 50
micro-holes. The sketch in figure 17 shows the sequence of drilling for the 50 micro-holes.
41 50
• • • • • • • • • •
• • • • • • • • • •
• • • • • • • • • •
• • • • « • • • • •
• • • • • • • • • • 1 10
Figure 17: A sketch for a set of 50 holes at the same sequence of drilling used in the experiment.
29

Data acquisition is performed with an XPS C — 8 controller (Newport) at 3.6 kHz. The power
supply is a Lambda Zup 60 — 3.5 operated in controlled output voltage mode. The electrolyte is
30%wt NaOH and the electrolyte level is adjusted between 1 and 2 mm above the work-piece
surface. Additional electrolyte is added if needed in order to keep the level constant during the
machining. At the beginning of each set of 50 micro-holes the temperature of the electrolyte is
room temperature. The counter electrode (anode) is a stainless steel ring of 10 cm in diameter. The
tool electrodes (cathode) are cylindrical rods of 0.5 mm in diameter chosen to be from four differ
ent materials with various thermal properties: stainless steel 316 L, high carbon steel, tungsten and
copper. Table 3 lists the thermal properties of these four materials. The shapes of the electrodes are
inspected with an optical microscope and if necessary corrected using emery paper. The work-
pieces are Menzel-Glaser 76 x 26 mm microscope slides with a thickness of 1 mm.
Material
Stainless steel ( 316L) High carbon steel (HCS)
Tungsten (W) Copper(Cu)
Thermal Conductivity W/(m • K)
at 300 K
16 50 173 401
Specific Heat Capacity
J/(kg«K) at 300 K
500 472 134 385
Thermal expansion rate
um/(m • K) at 300 K
15.9 11.0 4.5 16.5
Table 3: Thermal properties of the four tool electrode materials used in this study.
A total of sixteen sets are drilled. Each four of them are machined using one of the four different
tool electrodes with a machining voltages of 28, 29, 32 and 35 Volts. The data is analyzed using
Matlab. The first 10 micro-hole data are ignored and the average of the data of the rest of the 40
micro-holes is calculated. Neglecting the first 10 micro-hole data is based on the observation that
after 10 micro-holes a steady state evolution is reached.
30

Figure 18: Typical mean evolution of drilling for 0.5 mm diameter stainless steel( 316L), high carbon
steel (HCS) tungsten (W) and copper (Cu) electrodes, at various machining voltages (28,29,32 and 35
V).
4.2.2 Micro-drilling evolution
Figure 18 shows the typical mean evolution of micro-drilling with time for stainless steel 316 L,
high carbone steel, and tungsten and copper electrodes at different machining voltages. Let us first
discuss the situation for stainless steel 316 L, high carbon steel and copper. It is apparent that the
higher the thermal conductivity of the electrode is, the slower the machining is. This is attributed to
the increased amount of thermal energy transferred through the electrode to the surrounding media
with increased thermal conductivity of the electrode. Consequently, less thermal energy is available
for the micro-drilling. The temperature in the machining zone will therefore be lower, resulting in
higher viscosity of the material in the machining zone compared to the drilling with electrodes of
low thermal conductivity. This yields to slower evolution because gravity-feed micro-drilling is
limited by the drag force exerted on the tool in the hydrodynamic regime.
31
S6
S3
U 0
S3 S -3 0
S 6
316L
Jill 1. UlUiillLllj HlWil.lillllL IJL LlllUJil 10 20 30 40
Time [ms] 50 60 70
IK'S
10 20 30 40 Time [ms]
50 60 70
W
<-> o 0yiiiMHiiiiiii.ihijiy..iiJiiutiiii>iiiii,ii,umiiiu»ii
10 20 30 40 50 Time [ms]
60 70
30 40 Time [ms]
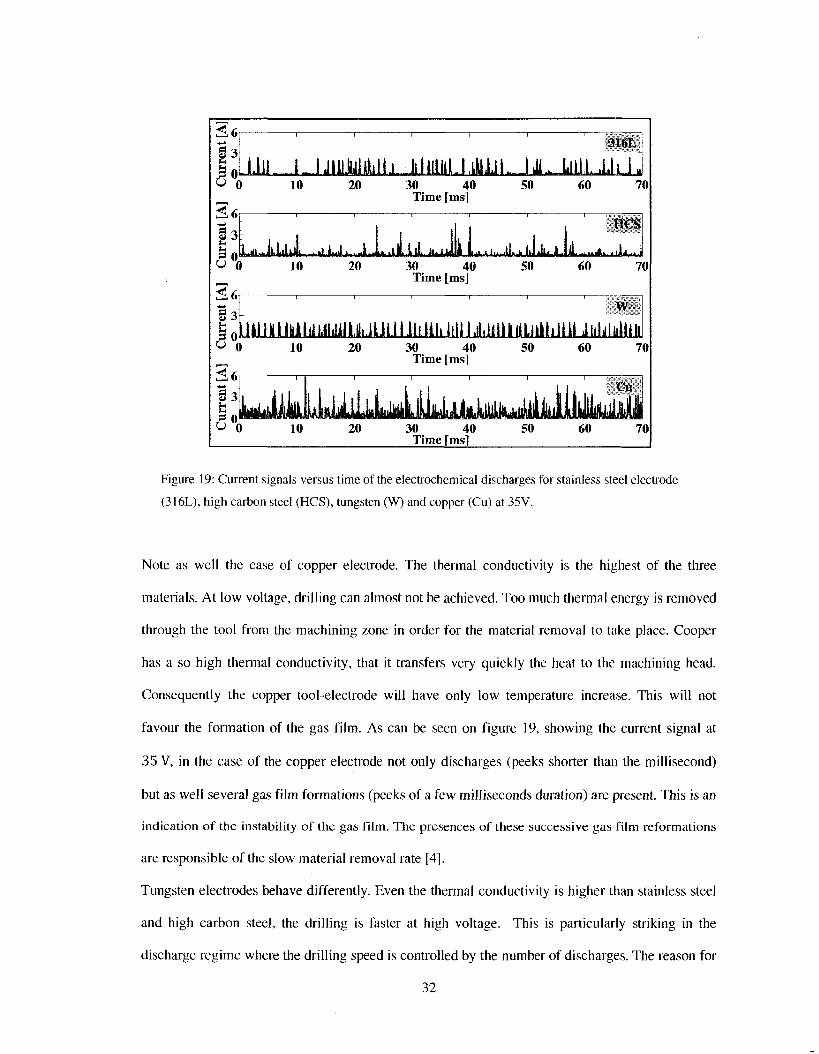
Figure 19: Current signals versus time of the electrochemical discharges for stainless steel electrode
(316L), high carbon steel (HCS), tungsten (W) and copper (Cu) at 35V.
Note as well the case of copper electrode. The thermal conductivity is the highest of the three
materials. At low voltage, drilling can almost not be achieved. Too much thermal energy is removed
through the tool from the machining zone in order for the material removal to take place. Cooper
has a so high thermal conductivity, that it transfers very quickly the heat to the machining head.
Consequently the copper tool-electrode will have only low temperature increase. This will not
favour the formation of the gas film. As can be seen on figure 19, showing the current signal at
35 V, in the case of the copper electrode not only discharges (peeks shorter than the millisecond)
but as well several gas film formations (peeks of a few milliseconds duration) are present. This is an
indication of the instability of the gas film. The presences of these successive gas film reformations
are responsible of the slow material removal rate [4].
Tungsten electrodes behave differently. Even the thermal conductivity is higher than stainless steel
and high carbon steel, the drilling is faster at high voltage. This is particularly striking in the
discharge regime where the drilling speed is controlled by the number of discharges. The reason for
32
this is that the number of discharges for tungsten is higher than the number of discharges of the
other materials studied as illustrated on figure 19. This can be explained if one recalls that electro
chemical discharges are most likely due to field assisted thermo emission [9]. Tungsten is the only
material in the series considered with high thermal conductivity and low heat capacity. Conse
quently a significantly higher temperature increase of the electrode will result than for the other
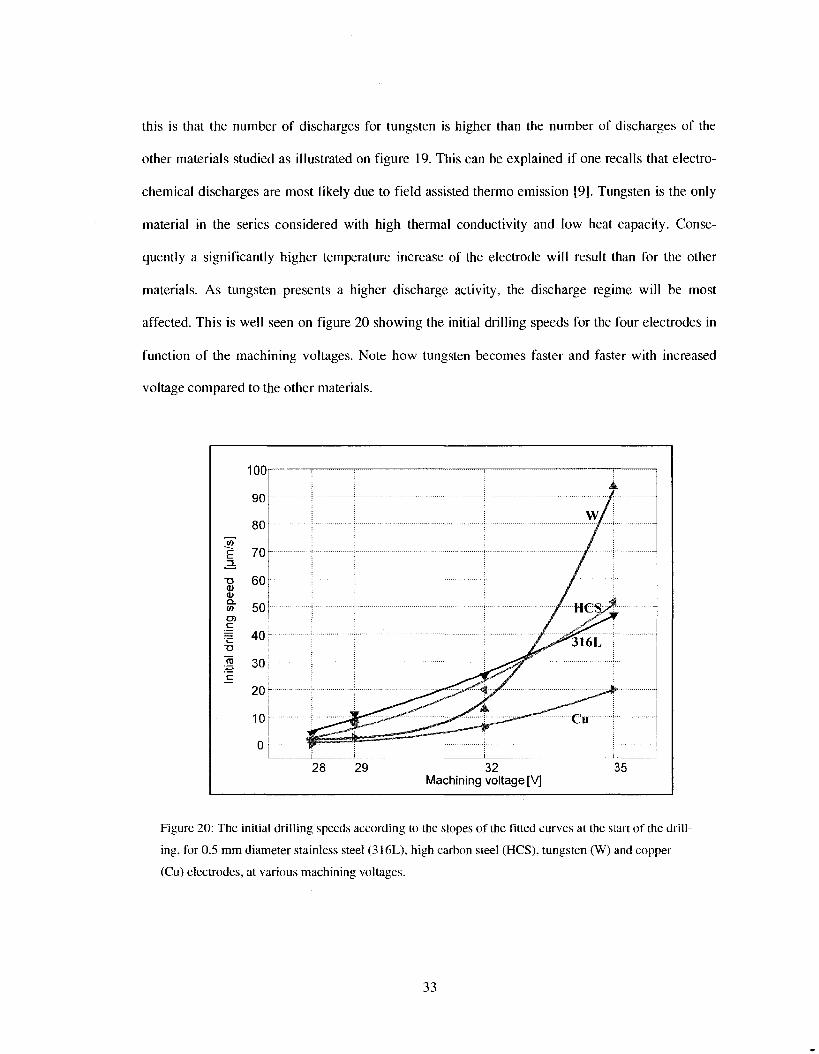
materials. As tungsten presents a higher discharge activity, the discharge regime will be most
affected. This is well seen on figure 20 showing the initial drilling speeds for the four electrodes in
function of the machining voltages. Note how tungsten becomes faster and faster with increased
voltage compared to the other materials.
28 29 32 35 Machining voltage [V]
Figure 20: The initial drilling speeds according to the slopes of the fitted curves at the start of the drill
ing, for 0.5 mm diameter stainless steel (316L), high carbon steel (HCS), tungsten (W) and copper
(Cu) electrodes, at various machining voltages.
33

4.2.3 Viscosity of the machining zone within the hydrodynamic regime
The dynamic viscosity of the machining zone in front of the tool tip during the hydrodynamic
regime is obtained for stainless steel and tungsten electrodes using Maillard's model [7, 8]. Know
ing the force used in gravity-feed micro-drilling (1.9 N in the present experiments), an estimation of
the viscosity in the machining zone can be given. The values of viscosities obtained are 1.7 x
108 kg/(m • s) for stainless steel 316 L electrodes, 2.9 x 10⁸ kg/(m • s) for high carbon steel,
3.3 x 10⁸ kg/(m • s) for tungsten electrodes and 3.9 x 10⁸ kg/(m • s) for copper electrodes. As
expected, the higher the tool electrode thermal conductivity is, the higher is the viscosity in the
machining zone.
Figure 21: Evolution of drilling depth as a function of time for stainless steel (316L) and tungsten (W)
electrodes with a diameter of 0.5 mm, at 28 V machining voltage.
34
4.2.4 First seconds of micro-drill ing
Figure 21 shows the evolution of the stainless steel and tungsten tool electrodes machining at 28 V.
At the start of drilling, one can observe a time interval in which the optical sensor reading for the
tool electrode evolution is positive. Micro-drilling with copper electrodes at low voltages follows
similar behaviour. In the first 60 s of drilling with copper electrode at 28 V the tool electrode
evolution is still positive (figure 18). This behaviour is most probably caused by the linear thermal
expansion of the tool electrode's tip. Since the thermal expansion coefficient of stainless steel is
about four times larger than that for tungsten's, the thermal expansion is more significant for the
stainless steel electrodes. The average of the amplitudes is around 20 m, which agrees with the
calculated expansion of stainless steel electrode assuming a temperature changes of 500 K during
the drilling. This temperature difference is based on the values measured by Raghuram et al. [26,
27] and Yerokhin et al. [25]. Figure 22 shows the correlation between the amplitude and the
duration of the tool expansion region for micro-drilling with stainless steel electrodes at 28 V.
o o
o
o O % °
°|̂ ::0,:;;:;;;;::::;,:;,:,:::,,::,::::,:::::::::::: . o;°
%\
0 I , L ^ , , ^ 1
0 10 20 30 40 50 60 Duration [s]
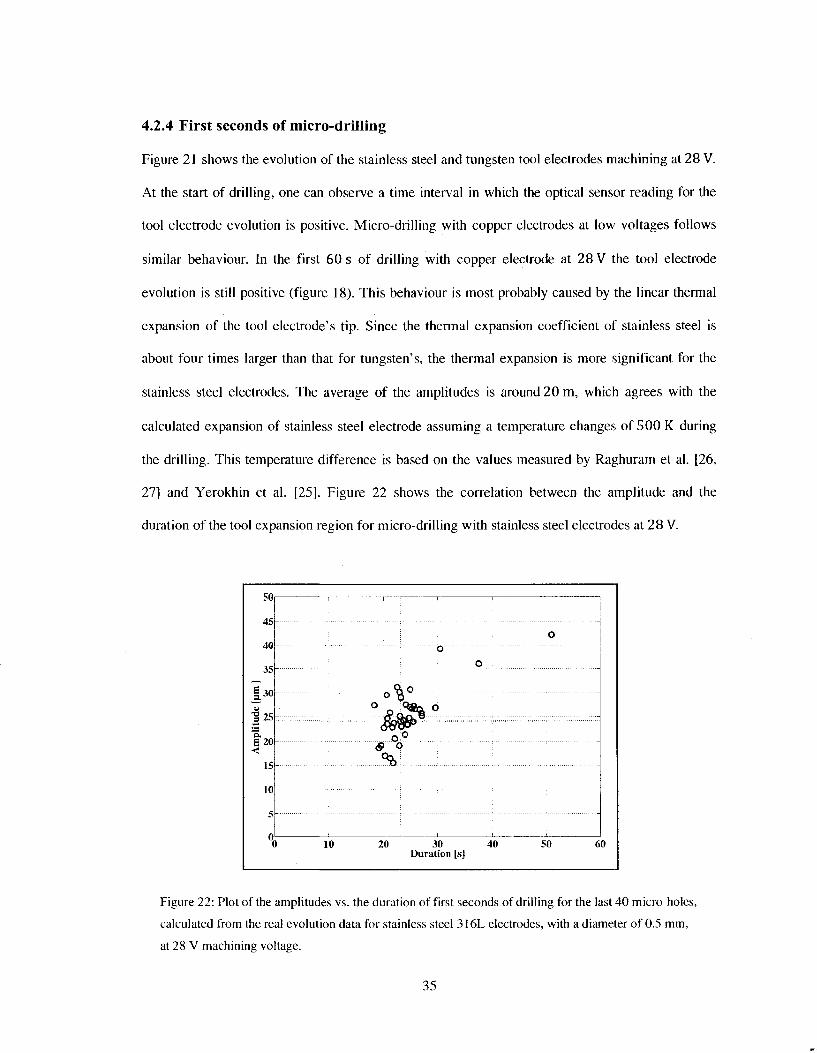
Figure 22: Plot of the amplitudes vs. the duration of first seconds of drilling for the last 40 micro-holes,
calculated from the real evolution data for stainless steel 316L electrodes, with a diameter of 0.5 mm,
at 28 V machining voltage.
45-
40
35
| 3 0 -
'gas--*̂ S20-<
15
10
5 -
35
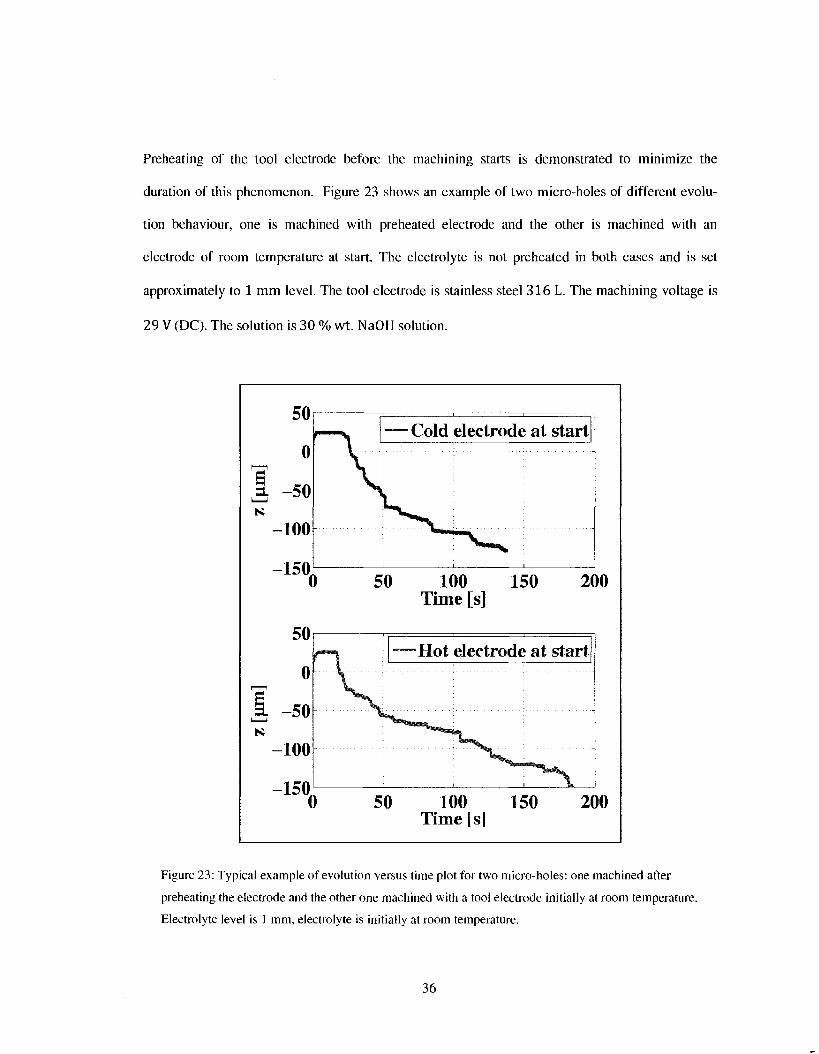
Preheating of the tool electrode before the machining starts is demonstrated to minimize the
duration of this phenomenon. Figure 23 shows an example of two micro-holes of different evolu
tion behaviour, one is machined with preheated electrode and the other is machined with an
electrode of room temperature at start. The electrolyte is not preheated in both cases and is set
approximately to 1 mm level. The tool electrode is stainless steel 316 L. The machining voltage is
29 V (DC). The solution is 30 % wt. NaOH solution.
50
0
A -50 N
100
-150
N
50
0
-50
100
150
r—%> — Cold electrode at start I
\ !
K ^ :
1 1
0 50 100 150 Time [s]
200
—Hot electrode at start
i
0 50 100 150 Time [s]
200
Figure 23: Typical example of evolution versus time plot for two micro-holes: one machined after
preheating the electrode and the other one machined with a tool electrode initially at room temperature.
Electrolyte level is 1 mm, electrolyte is initially at room temperature.
36
4.3. Applying pulse voltage
4.3.1 The goal of using pulse voltage
Pulse voltage is implemented experimentally as it was recommended by Zheng et al. [15] for
process improvement. Adjusting the ratio between the time-on Ton and the time-off T0ff is useful
in two ways. First, the problem of the gas film instability is practically eliminated. So that, by
choosing high frequency voltage pulses and small duty ratios Ton/(Ton + Toff), the machining can
be improved. Second, when the applied voltage is adjusted in timely fashion, the resulting thermal
energy at the tip of the electrode is adjusted accordingly.
4.3.2 Pulse voltage Circuit
Rjota l
L
itc
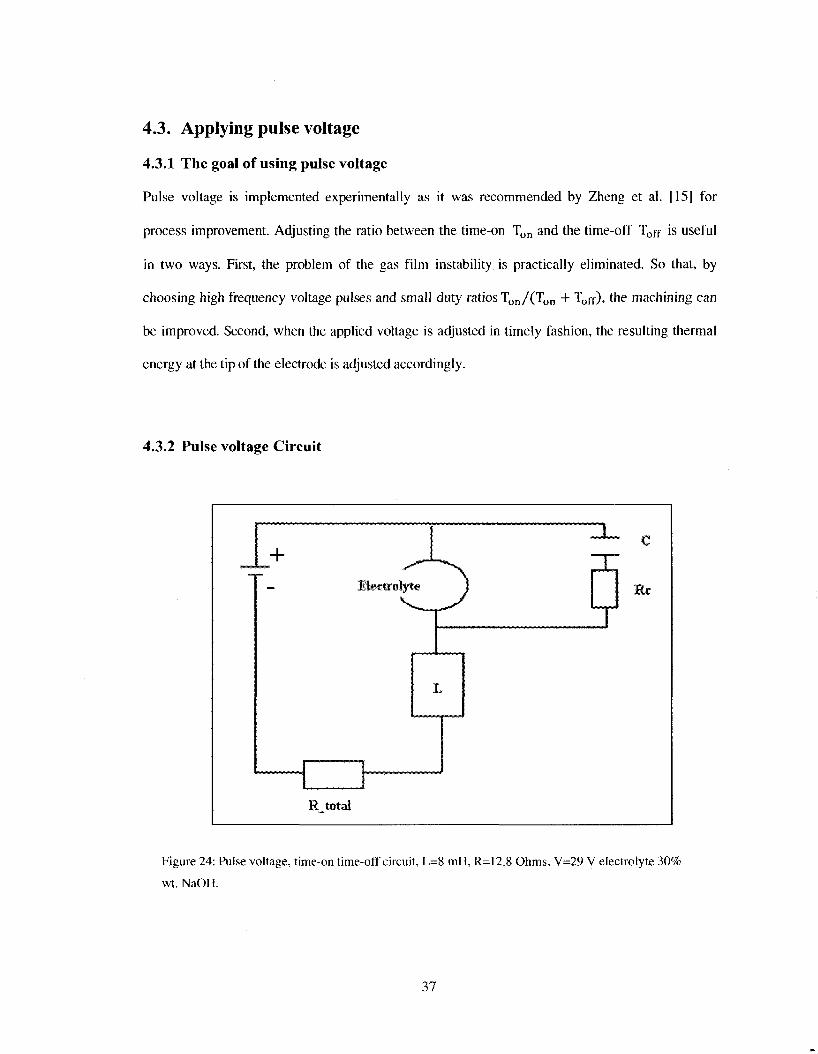
Figure 24: Pulse voltage, time-on time-off circuit, L=8 mH, R=12.8 Ohms, V=29 V electrolyte 30%
wt. NaOH.
37
To produced pulse voltage with the desired values of time on and time off, the circuit shown in
figure 24 is used as a result of a prototyping, very similar to Wehnelt's current interrupter4. Selec
tion of parameters for the circuit is done taking into account the response time of the power supply
and the electrical components. The pulse-on time Ton is chosen to be longer than the mean gas film
formation time, but short enough to avoid supplying excessive heat to the work-piece [11]. The
frequency of interruption can be controlled by inductance of the induction coil, resulting in high
frequencies for low values of the inductance [15]. Appendix C.l discusses the ideal signal to be
generated from the proposed pulse voltage. Figure 25 shows the current versus time plot for micro-
drilling with pulse voltage in different stages of drilling. It is the first time in history of SACE that
this type of circuit is used for pulsed voltage machining. This circuit was chosen for two reasons:
1- To investigate the possibility to use this simple circuit for SACE
2- To investigate the sensitivity of this circuit to the various parameters in SACE
It is demonstrated that such simple circuit is capable of producing a pulse voltage signal which
controls both the gas film stability and the heat generation. However it is noticed that the pulse
voltage is very reliant on the level of the electrolyte in the machining cell.
1 The first technological application, presented in 1899. for the electrochemical discharge. Using this interrupter 1000-2000 interruptions per second can be achieved.
38
S : : l l l i lWflMMi 0 0.05 0.1 0.15 0.2 0.25 0.3
Time [sj 0.35 0.4 0.45 0.5
«°-2
l o . i
U wiiyiyMiM^ mi 0.05 0.1 0.15 0.2 0.25 0.3
Time [sj 0.35 0.4 0.45 0.5
Figure 25: Current versus time plot for micro-drilling with pulse voltage at various depths, a) At the
beginning, b) At depth 25um and c) At 75um. RLC values are: L=8 mH, R=12.8 Ohms, V=29 V,
electrolyte 30% wt. NaOH.
4.3.3 Micro-drilling with pulse voltage
Figure 26 shows a comparison between the first three micro-holes evolution during drilling with
pulse voltage or DC voltage. The heat generated during machining with pulse voltage is definitely
inferior that in case of machining with DC voltage. This yields to longer non-machining states in
case of pulse voltage machining. The evolutions in case of drilling with DC voltage are less variable
than those of machining with pulse voltage.
39

Figure 26: Evolution versus plots of sample micro-drills with pulse voltage (P) and DC voltage (N).
The machining voltage is 29 V. The tool electrode is 0.5 mm stainless steel. The electrolyte is pre
heated to 60C and the electrode is preheated.
According to our experiments, it is observed that the issue in drilling with pulse voltage is the level
of the electrolyte. High level of electrolyte yields to longer machining. The thermal energy is lost in
the electrolyte. To achieve less variability in the evolution of the drilling when machining using
pulse voltage, it is recommended to use an adjusted amount of the electrolyte supplied by a pro
grammable syringe pump at the machining area. The amount of the electrolyte needed might be
smaller than it could be controlled by a level sensor. Furthermore it is recommended to do more
experiments to study the effect of the evolving bubbles that are formed due to the excess of the
electrolyte and the white deposits that are formed due to the shortage of electrolyte.
40

4.4. Electrolyte level and temperature
4.4.1 The importance of electrolyte level
The importance of the electrolyte level became evident during the pulse voltage machining investi
gations. Although pulse voltage machining is known for the excellent quality of its micro-holes
machining, remarkable variability of micro-holes quality is observed in our experimental investiga
tion. The reason is the way we apply the pulses which are highly dependent of the electrolyte level.
The variation in level caused a remarkable variation in the time of machining and a remarkable
variation in the quality of micro-holes as well. It was therefore decided to do further investigations
about the effect of the electrolyte level. Appendix C.2 discusses the theoretical aspects behind the
electrolyte level.
4.4.2 Electrolyte circulation and leveling system
On the other hand, it is noticed that the desired electrolyte level with pulse voltage machining is
very low. Such low-level could be hard to detect using level sensors.. A proposed solution to adjust
the level of the electrolyte without a levelling sensor is to make a new machining cell that contains
two containers: an inner container with an overflow opening - levelled with the work-piece surface
- and an outer container that collects the access electrolyte. This overflow bath should keep the level
of electrolyte adjusted, if as long as the electrolyte is continuously fed. However, more advanced
system with dispensing droplets of electrolyte at the position of drilling using syringe pump could
be used as well.
The implemented electrolyte circulation system equipped with a controlled hot plate with a tem
perature probe and a steering system is shown on figure 27. The variability of the concentration
between the start and end of the machining process is speculated to be not significant. A syringe
pump, or diaphragm set of pumps, can be used for the circulation. The diaphragm pump is used in
this study.
41
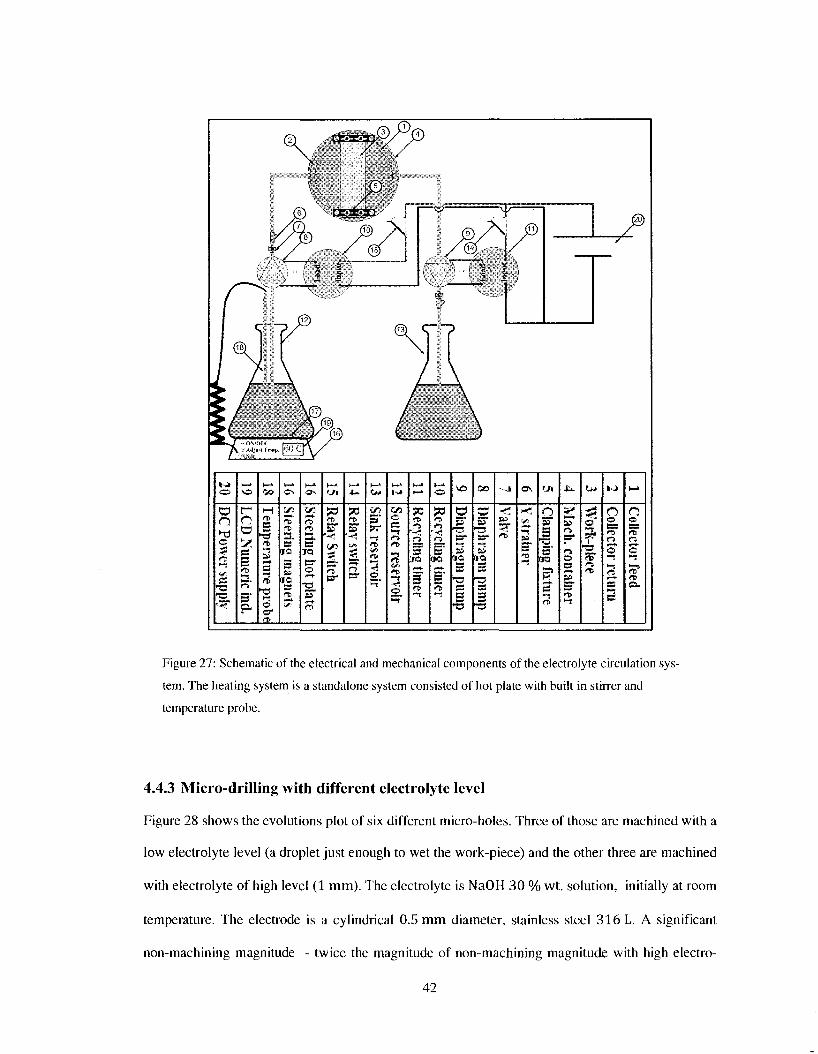
Figure 27: Schematic of the electrical and mechanical components of the electrolyte circulation sys
tem. The heating system is a standalone system consisted of hot plate with built in stirrer and
temperature probe.
4.4.3 Micro-drilling with different electrolyte level
Figure 28 shows the evolutions plot of six different micro-holes. Three of those are machined with a
low electrolyte level (a droplet just enough to wet the work-piece) and the other three are machined
with electrolyte of high level (1 mm). The electrolyte is NaOH 30 % wt. solution, initially at room
temperature. The electrode is a cylindrical 0.5 mm diameter, stainless steel 316 L. A significant
non-machining magnitude - twice the magnitude of non-machining magnitude with high electro-
42

lyte- is observed. The reason for this might be the gas film which is not developed yet at the start of
the machining with low-level electrolyte. Instead some bubbles are formed, pushing the tool
electrode upward. The expansion of the tool electrode that causes the non-machining status is not
continues any more because of the bubble breakage, this makes the tool go up and down frequently.
However it seams that a combination of causes including tool expansion and tool and surface
friction force play a major part of this phenomenon.
It is observed as well that low-levels electrolyte yield to faster evolution during the discharge
regime and slower evolution during the hydrodynamic regime. In the discharge regime, the small
amount of electrolyte in the case of low-level electrolyte is easier to be heated. This heating causes
the water content of the electrolyte to evaporate rapidly. As consequence the concentration of NaOH
increases locally (under the tip of the electrode), promoting the chemical etching at the melted zone,
and causing the drilling to be faster. However when the drilling goes on and reaches the hydrody
namic regime, the electrolyte is consumed rapidly along the way. Until some electrolyte leaks to the
micro-hole, a flat region will appear in the evolution curve and reflects the stoppage or slow speed
of the drilling.
43

Figure 28: Evolution plots of micro-drilling with high electrolyte level and with low electrolyte level.
Machining voltage is 29 V and electrode is stainless steel of 0.5 mm diameter.
4.4.4 Need of preheating the electrolyte
A portion of the supplied input energy is lost in warming up the electrolyte initially (surrounding
media of electrode). This energy spreads across the electrolyte volume causing the electrolyte
temperature to increase gradually during the machining. According to heat transfer rules, the
amount of heat transferred through the media (electrolyte in our case) decreases with decreasing the
variation of temperature (between the machining zone and the rest of electrolyte). This is assuming
a fairly constant temperature at the machining zone. Preheating of the electrolyte to 60 — 80 °C is
suggested and investigated. Yet the choice of initial temperature of the electrolyte might worth
some further investigation. Figure 29 shows the evolution plots of two micro-drills. One is drilled
with a warm electrolyte (80 °C) and the other one is drilled with cold electrolyte (23 °C). When the
hot electrolyte is used, the non-machining duration is reduced to the half. However, in the both
cases the electrodes are preheated initially which might explains this significant decline in the non-
machining magnitude. 44

Figure 29: Evolution plots of two micro-drilling one is drilled with 80°C electrolyte and the other one
is drilled without preheating the electrolyte initially. Machining voltage is 29 V and electrode is pre
heated before the start of the drilling, and it is 0.5 mm diameter stainless steel. The micro-hole depth is
50um.
4.4.5 Electrolyte level adjustment and pulse voltage effect on machining time
Figure 30 shows two machining time run charts. In the upper plot the machining is performed after
preheating the electrode and electrolyte. And in the lower plot pulse voltage and manual adjustment
are combined to the preheating. The variability is reduced. Furthermore the mean machining time is
reduced from 99 s in the first case to 59 s in the second case. The gas film instability is minimized
and random stair-case like evolution is minimized as well. Instead smooth drilling is achieved
(figure 26) with more repeatable machining time.
45
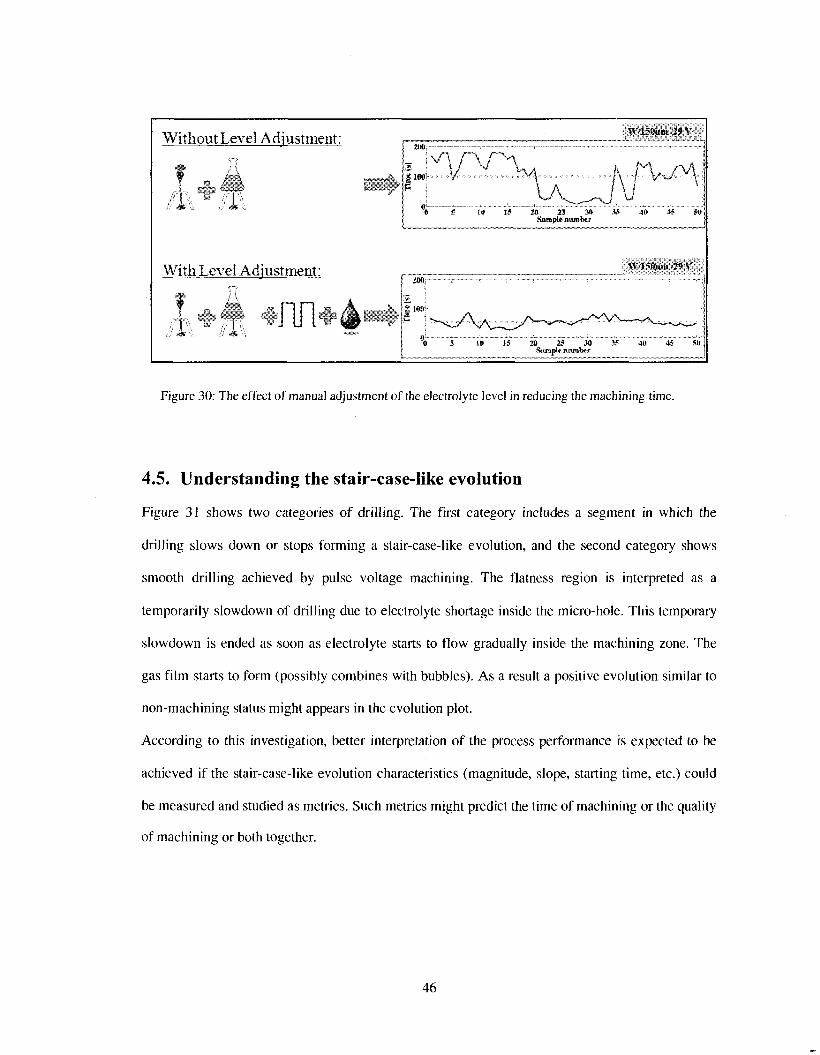
Figure 30: The effect of manual adjustment of the electrolyte level in reducing the machining time.
4.5. Understanding the stair-case-like evolution
Figure 31 shows two categories of drilling. The first category includes a segment in which the
drilling slows down or stops forming a stair-case-like evolution, and the second category shows
smooth drilling achieved by pulse voltage machining. The flatness region is interpreted as a
temporarily slowdown of drilling due to electrolyte shortage inside the micro-hole. This temporary
slowdown is ended as soon as electrolyte starts to flow gradually inside the machining zone. The
gas film starts to form (possibly combines with bubbles). As a result a positive evolution similar to
non-machining status might appears in the evolution plot.
According to this investigation, better interpretation of the process performance is expected to be
achieved if the stair-case-like evolution characteristics (magnitude, slope, starting time, etc.) could
be measured and studied as metrics. Such metrics might predict the time of machining or the quality
of machining or both together.
46
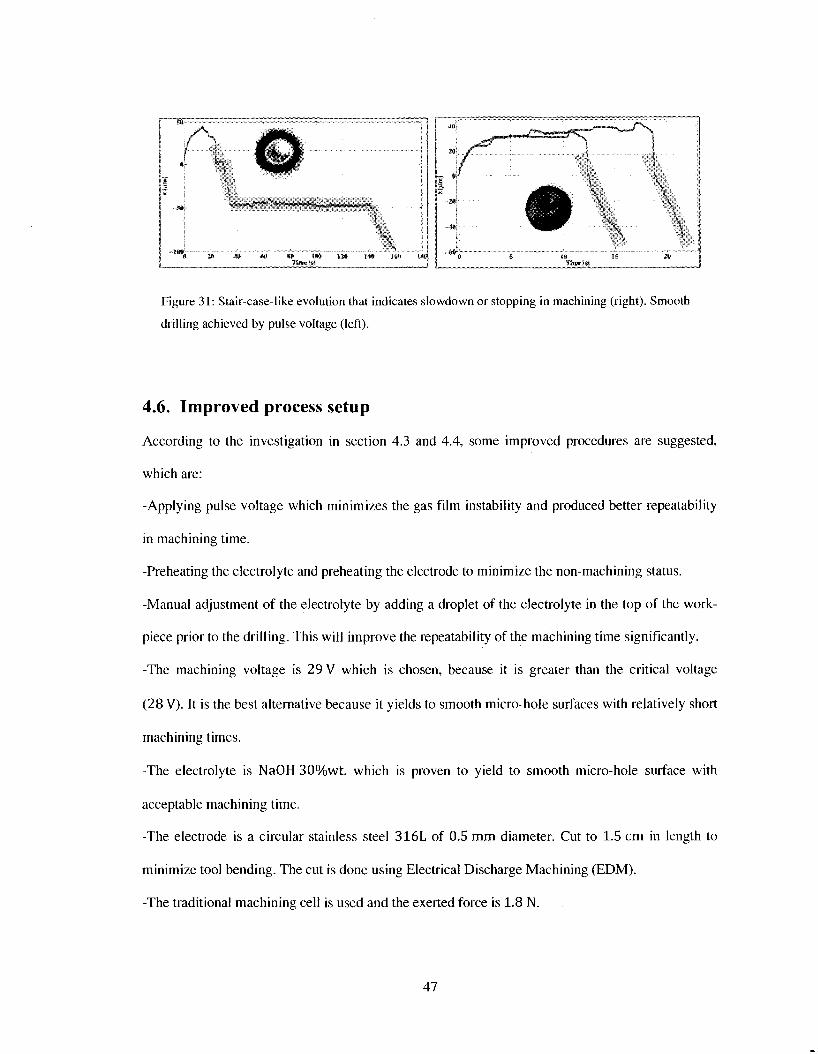
\ . .
*» m i # ii» Mn i » MW|
Figure 31: Stair-case-like evolution that indicates slowdown or stopping in machining (right). Smooth
drilling achieved by pulse voltage (left).
4.6. Improved process setup
According to the investigation in section 4.3 and 4.4, some improved procedures are suggested,
which are:
-Applying pulse voltage which minimizes the gas film instability and produced better repeatability
in machining time.
-Preheating the electrolyte and preheating the electrode to minimize the non-machining status.
-Manual adjustment of the electrolyte by adding a droplet of the electrolyte in the top of the work-
piece prior to the drilling. This will improve the repeatability of the machining time significantly.
-The machining voltage is 29 V which is chosen, because it is greater than the critical voltage
(28 V). It is the best alternative because it yields to smooth micro-hole surfaces with relatively short
machining times.
-The electrolyte is NaOH 30%wt. which is proven to yield to smooth micro-hole surface with
acceptable machining time.
-The electrode is a circular stainless steel 316L of 0.5 mm diameter. Cut to 1.5 cm in length to
minimize tool bending. The cut is done using Electrical Discharge Machining (EDM).
-The traditional machining cell is used and the exerted force is 1.8 N.
47
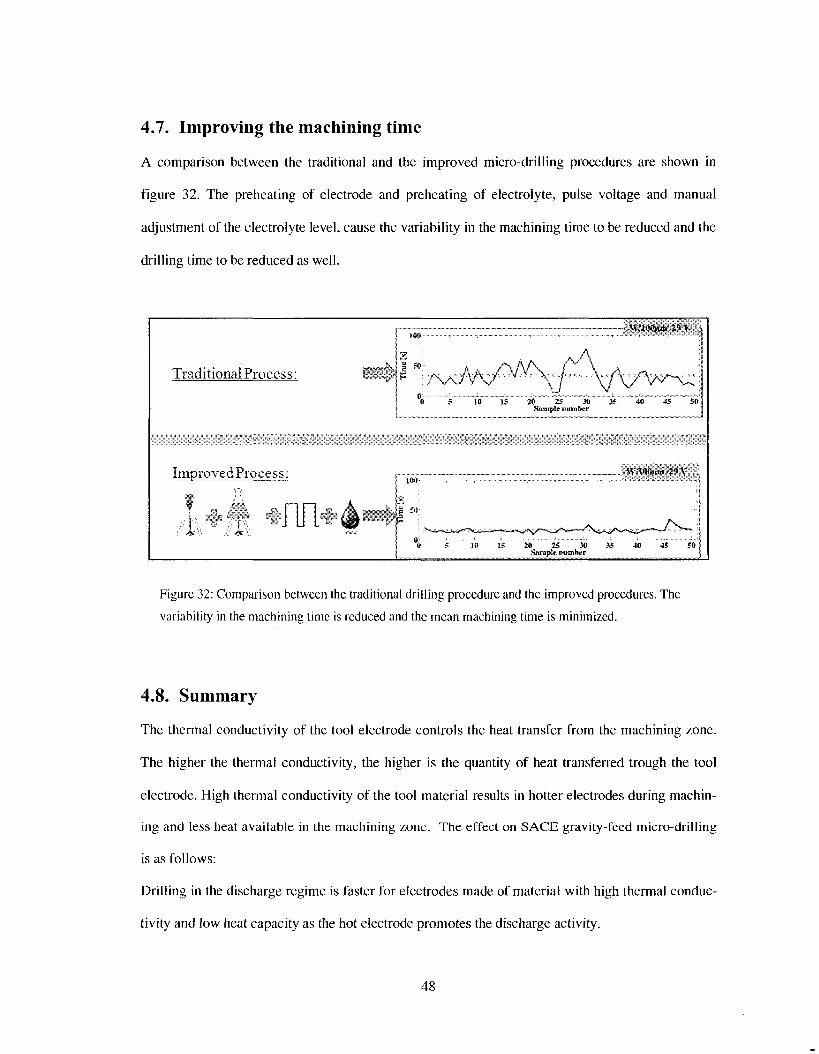
4.7. Improving the machining time
A comparison between the traditional and the improved micro-drilling procedures are shown in
figure 32. The preheating of electrode and preheating of electrolyte, pulse voltage and manual
adjustment of the electrolyte level, cause the variability in the machining time to be reduced and the
drilling time to be reduced as well.
W IvOiiin 2* \
Traditional Process: g Sti
lt) IS 20 2S 3» )f 40 45
Improved Process:
^nn^A1 j l 59)-
W |ii(1iiiii M l
» K M MS Saisple number
Figure 32: Comparison between the traditional drilling procedure and the improved procedures. The
variability in the machining time is reduced and the mean machining time is minimized.
4.8. Summary
The thermal conductivity of the tool electrode controls the heat transfer from the machining zone.
The higher the thermal conductivity, the higher is the quantity of heat transferred trough the tool
electrode. High thermal conductivity of the tool material results in hotter electrodes during machin
ing and less heat available in the machining zone. The effect on SACE gravity-feed micro-drilling
is as follows:
Drilling in the discharge regime is faster for electrodes made of material with high thermal conduc
tivity and low heat capacity as the hot electrode promotes the discharge activity.
48
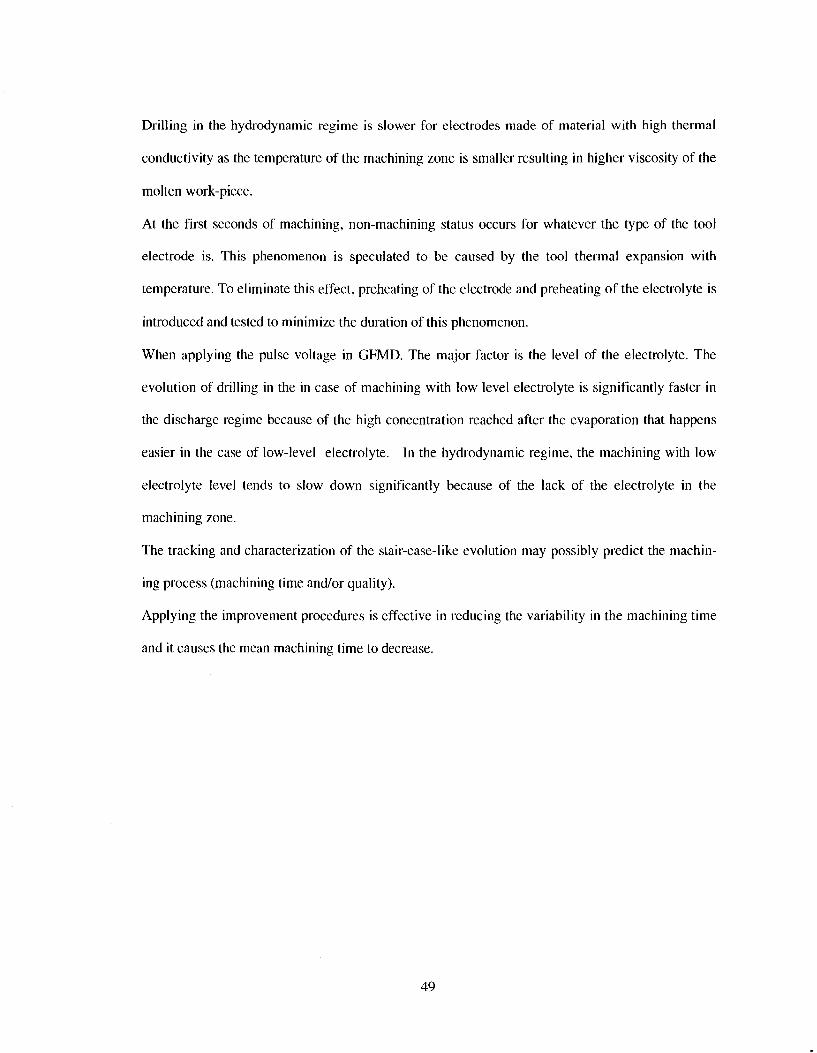
Drilling in the hydrodynamic regime is slower for electrodes made of material with high thermal
conductivity as the temperature of the machining zone is smaller resulting in higher viscosity of the
molten work-piece.
At the first seconds of machining, non-machining status occurs for whatever the type of the tool
electrode is. This phenomenon is speculated to be caused by the tool thermal expansion with
temperature. To eliminate this effect, preheating of the electrode and preheating of the electrolyte is
introduced and tested to minimize the duration of this phenomenon.
When applying the pulse voltage in GFMD. The major factor is the level of the electrolyte. The
evolution of drilling in the in case of machining with low level electrolyte is significantly faster in
the discharge regime because of the high concentration reached after the evaporation that happens
easier in the case of low-level electrolyte. In the hydrodynamic regime, the machining with low
electrolyte level tends to slow down significantly because of the lack of the electrolyte in the
machining zone.
The tracking and characterization of the stair-case-like evolution may possibly predict the machin
ing process (machining time and/or quality).
Applying the improvement procedures is effective in reducing the variability in the machining time
and it causes the mean machining time to decrease.
49

Chapter 5 Quality evaluation of the process
5.1. Introduction
This chapter studies the quality of micro-holes. An image processing program is customized to
evaluate the micro-hole entrance surface characteristics. The process capability is calculated for the
first time in this process to evaluate the effect of the implemented improvement.
Figure 33: Microscope image of a micro-hole, the vision program tracks the external profile, then
ellipse fitting is performed, a is semi-major axis and b is semi-minor axis. (Images are taken by Olym
pus BX60M microscope with Infinity X digital camera).
50

5.2. Quality evaluation metrics
An Olympus BX60M microscope with an Infinity X digital camera is used to obtain a photo
graphic image of the micro-holes. An image processing program is customized using Matlab Image
Processing Toolbox™ and other special Matlab functions such as (ELL1PSEFIT). A description of
the image processing system is briefed in Appendix B.l Three primary metrics are presented to
evaluate the micro-holes quality. Elliptic mean radius, elliptic shape factor, elliptic texture (rough
ness)
The vision program traces the edges of the micro-hole image. A contour of 1 X 1 pixel unit squares
is following upper edge of the micro-hole. Each unit square has an X and Y coordinates assigned to
it. This contour is then fitted to the best elliptic shape in order to determine the shape characteristics
by Least Squares Ellipse Fit function (ELLIPSEFIT) [23]. Figure 33 shows a sample of a micro-hole
image. The major diameter and minor diameter of the micro-hole is measured. Subsequently the
mean diameter (or mean radius), the shape factor and the texture are calculated accordingly to the
following:
5.2.1 Mean radius
The mean diameter is defined as follows:
M = c ( V ( a ) 2 + (b)z) (6)
M: is the mean radius of the fitted ellipse [um]
a: is the major radius of the fitted ellipse [Pixels]
b : is the minor radius of the fitted ellipse [Pixel]
. . ,. 230 r um n c: is the conversion factor = — ——-250 LPixelJ
51
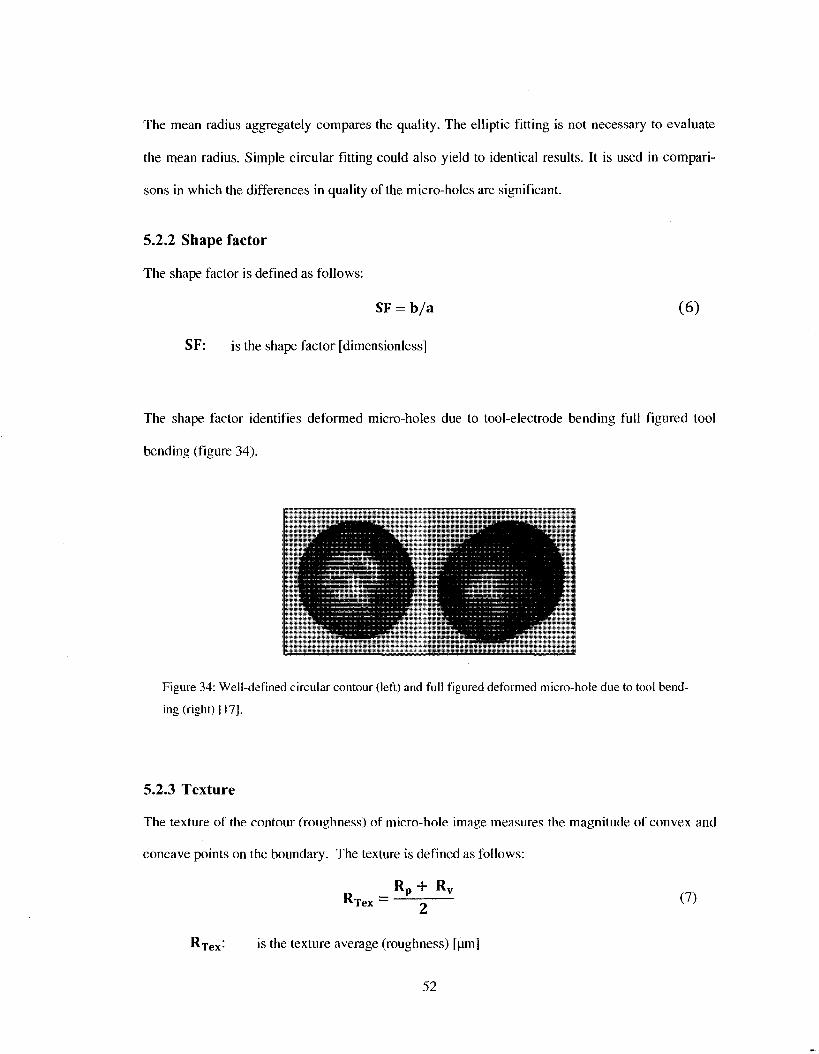
The mean radius aggregately compares the quality. The elliptic fitting is not necessary to evaluate
the mean radius. Simple circular fitting could also yield to identical results. It is used in compari
sons in which the differences in quality of the micro-holes are significant.
5.2.2 Shape factor
The shape factor is defined as follows:
SF = b / a
SF: is the shape factor [dimensionless]
(6)
The shape factor identifies deformed micro-holes due to tool-electrode bending full figured tool
bending (figure 34).
Figure 34: Well-defined circular contour (left) and full figured deformed micro-hole due to tool bend
ing (right) [17].
5.2.3 Texture
The texture of the contour (roughness) of micro-hole image measures the magnitude of convex and
concave points on the boundaiy. The texture is defined as follows:
Rp + Rv
^Tex —
Rxex: is the texture average (roughness) [urn]
52
(7)
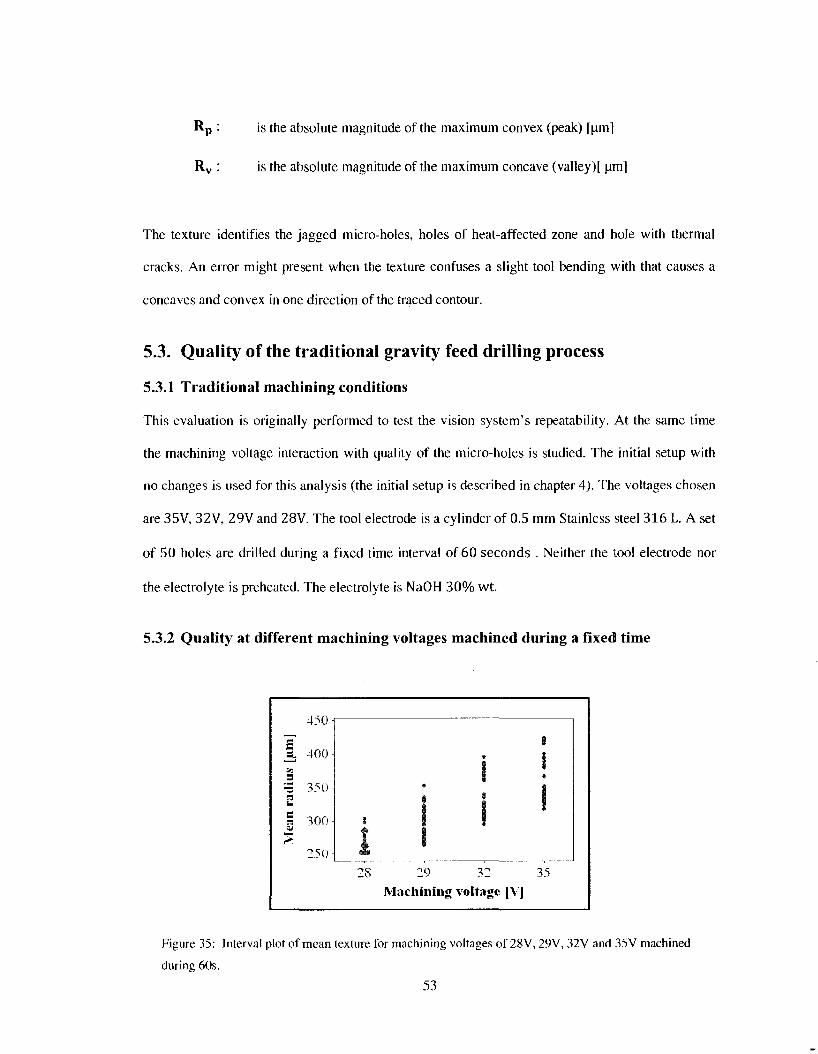
Rp : is the absolute magnitude of the maximum convex (peak) [[xm]
Rv : is the absolute magnitude of the maximum concave (valley) [ um]
The texture identifies the jagged micro-holes, holes of heat-affected zone and hole with thermal
cracks. An error might present when the texture confuses a slight tool bending with that causes a
concaves and convex in one direction of the traced contour.
5.3. Quality of the traditional gravity feed drilling process
5.3.1 Traditional machining conditions
This evaluation is originally performed to test the vision system's repeatability. At the same time
the machining voltage interaction with quality of the micro-holes is studied. The initial setup with
no changes is used for this analysis (the initial setup is described in chapter 4). The voltages chosen
are 35V, 32V, 29V and 28V. The tool electrode is a cylinder of 0.5 mm Stainless steel 316 L. A set
of 50 holes are drilled during a fixed time interval of 60 seconds . Neither the tool electrode nor
the electrolyte is preheated. The electrolyte is NaOH 30% wt.
5.3.2 Quality at different machining voltages machined during a fixed time
1 « * I I
28 29 32 35 Machining voltage [VJ
Figure 35: Interval plot of mean texture for machining voltages of 28V, 29V, 32V and 35V machined
during 60s.
53
4?>U
s. 400
s = 350 a i-
« 300 -
250 -
$

Figure 35 shows that the mean radius of the fitted ellipse increases as the machining voltage
increases. The least variability of elliptic mean radius is detected with machining at 28V. This is
possibly caused because the lower the voltage, the lower the variability is in the discharge activity
[11]. Another possibility is that, the more thermal energy (due to increase of voltage) is available for
machining, the higher the temperature of the tool-electrode is. AS well we can relay this on the fact
that the high machining voltage produces deeper micro-holes, in which the hydrodynamic regime
occurs. The shortage of electrolyte at this cases causes the discharges to occur at positions of
contact which might no necessary be the tip of the electrode. Such discharges are not desirable
because they yield to thermal cracks which contribute in increasing the mean radius of the micro-
hole.
The variability of texture (figure 36-right) follows this pattern as well. It is worth mentioning that
some other shape metrics are tested for experimental purposes and showed identical results. Some
of those metrics are non-linear eccentricity and linear eccentricity of the elliptic fitting. Figure 36-
left shows the interaction between the linear eccentricity and voltage, which is identical with the
relationship between the mean radius and machining voltage of the sample.
1 SL J 3 >, **: ^ < M *
f V* Si 1* ^ £ s ~m-.
- i
300
250 ^CHI
150
1 w
50
0
$ 1
I I ?'?
Machining voltage |VJ
' 1 i , = > « . • ™
\* : I. ) .w ;K X *» I
t = _ V
* •
l > n "
|t.H)
Ni'<
C i i i
n.;
-., ' ~ ' 1
;
Maclitatag voltag*' |V |
1
Figure 36: Interval plot of linear eccentricity (left) and texture of elliptic shape (right) with the machin
ing voltages at machining voltages of 28V, 29V, 32V, 35V machined during 60s.
54
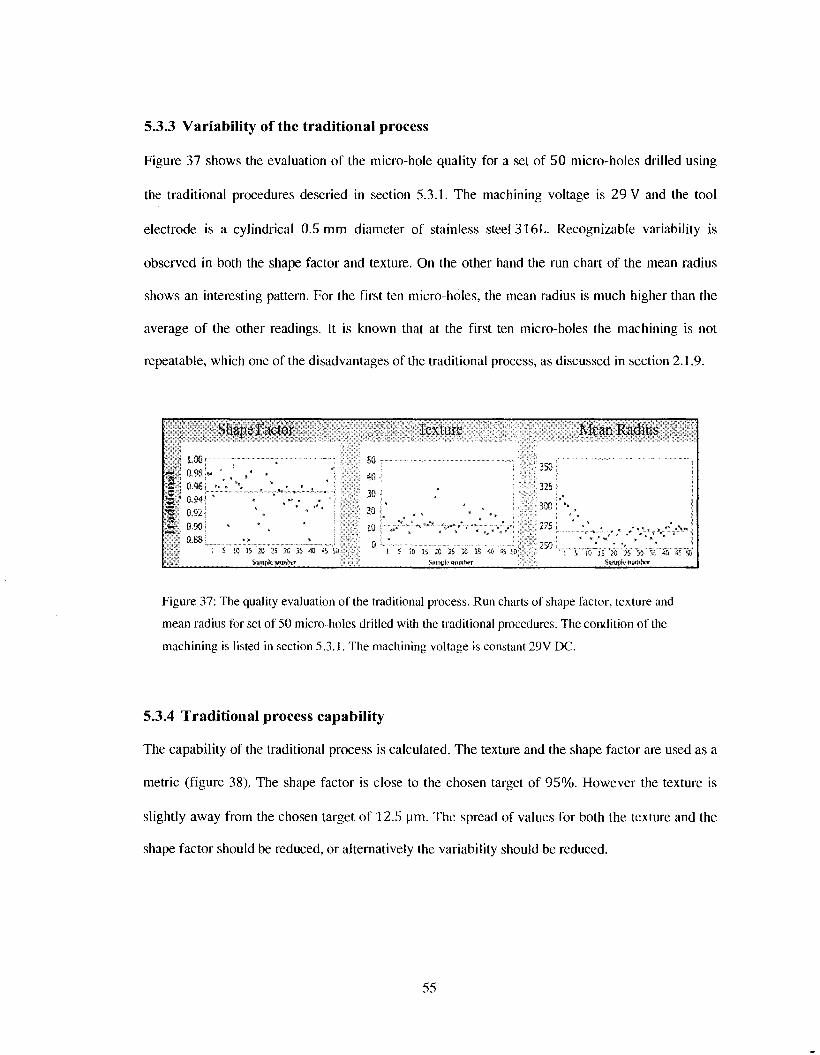
5.3.3 Variability of the traditional process
Figure 37 shows the evaluation of the micro-hole quality for a set of 50 micro-holes drilled using
the traditional procedures descried in section 5.3.1. The machining voltage is 29 V and the tool
electrode is a cylindrical 0.5 mm diameter of stainless steel 316L. Recognizable variability is
observed in both the shape factor and texture. On the other hand the run chart of the mean radius
shows an interesting pattern. For the first ten micro-holes, the mean radius is much higher than the
average of the other readings. It is known that at the first ten micro-holes the machining is not
repeatable, which one of the disadvantages of the traditional process, as discussed in section 2.1.9.
5
• ,r
i
32?
» L
Sh«]
«
1 5 SO
^ \ ;KtiM'
* ,»" .
. " ' 15 » 25 38 35 « * ys
Sswspk- Ksmiferr
40
30
20
10 ,.
0 • " !
k-XMilV
; \
*". *, ««?? , * . « . * . « . - *.. ' '
S m IS 20 " B 33 3S 40 4S 5 0 ^
Sample mmlm
.. 350 :
;:: 300!"
1:250 L
Mean Radius
*
S t . ;f K, ?*» 1C 1 c *n ^ %
^ « ^
Figure 37: The quality evaluation of the traditional process. Run charts of shape factor, texture and
mean radius for set of 50 micro-holes drilled with the traditional procedures. The condition of the
machining is listed in section 5.3.1. The machining voltage is constant 29V DC.
5.3.4 Traditional process capability
The capability of the traditional process is calculated. The texture and the shape factor are used as a
metric (figure 38). The shape factor is close to the chosen target of 95%. However the texture is
slightly away from the chosen target of 12.5 pm. The spread of values for both the texture and the
shape factor should be reduced, or alternatively the variability should be reduced.
55
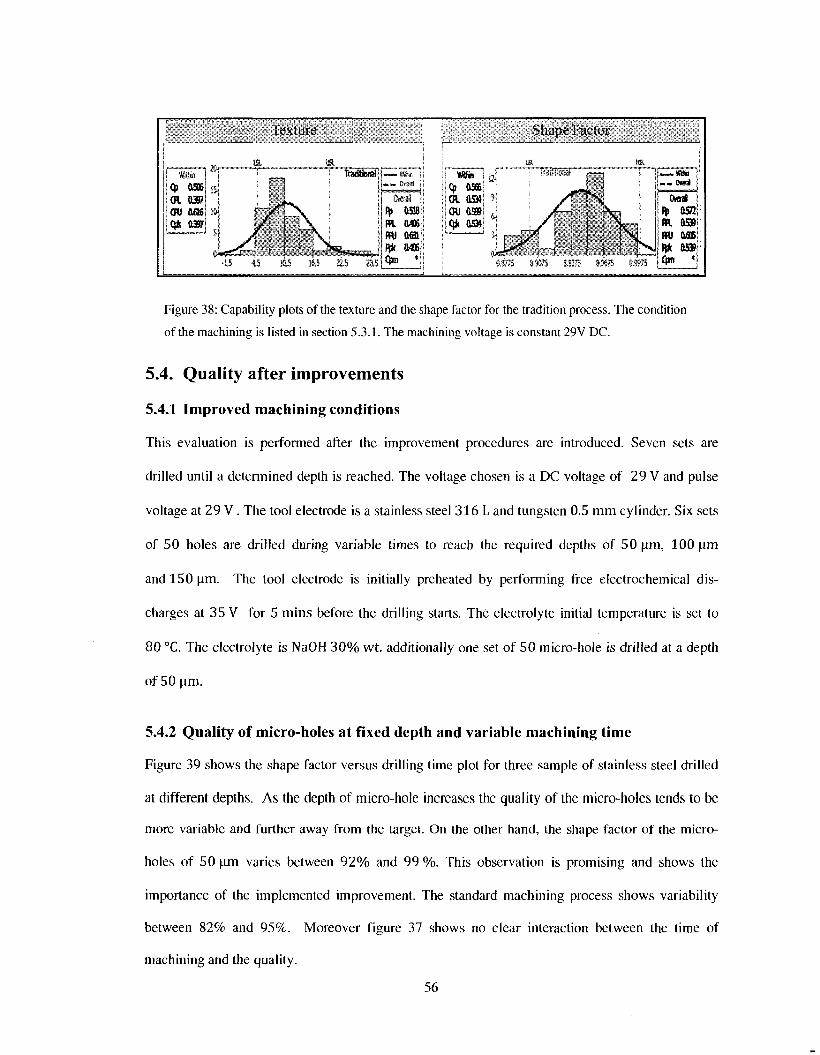
k'NtUIV Sliiipe! actor
«8* :
CR as? OVttSft c* ftaesr J r L _ J s
Mitel 1 i WHn s H
GN ' 6,875 mn 6.9375 aS67S «,99S fl"1
0KHI j ! (*> SOT: m ft»l IfU &605 ^ 0539:
Figure 38: Capability plots of the texture and the shape factor for the tradition process. The condition
of the machining is listed in section 5.3.1. The machining voltage is constant 29V DC.
5.4. Qual i ty after i m p r o v e m e n t s
5.4.1 Improved machining conditions
This evaluation is performed after the improvement procedures are introduced. Seven sets are
drilled until a determined depth is reached. The voltage chosen is a DC voltage of 29 V and pulse
voltage at 29 V. The tool electrode is a stainless steel 316 L and tungsten 0.5 mm cylinder. Six sets
of 50 holes are drilled during variable times to reach the required depths of 50 um, 100 um
and 150 um. The tool electrode is initially preheated by performing free electrochemical dis
charges at 35 V for 5 mins before the drilling starts. The electrolyte initial temperature is set to
80 °C. The electrolyte is NaOH 30% wt. additionally one set of 50 micro-hole is drilled at a depth
of 50 um.
5.4.2 Quality of micro-holes at fixed depth and variable machining time
Figure 39 shows the shape factor versus drilling time plot for three sample of stainless steel drilled
at different depths. As the depth of micro-hole increases the quality of the micro-holes tends to be
more variable and further away from the target. On the other hand, the shape factor of the micro-
holes of 50 um varies between 92% and 99 %. This observation is promising and shows the
importance of the implemented improvement. The standard machining process shows variability
between 82% and 95%. Moreover figure 37 shows no clear interaction between the time of
machining and the quality.
56

£0 .92 4)
£ °-9
0.88
0.86
0.84
V .v
^^S
O v
.37 ^
1 " 1» >-,
V
V "%
v Xr v v v
v w v
10 20 30 40 50 Drilling time [s]
60
V v
v
V 150mn > lOOum A50nm
70 80
Figure 39: Shape factor versus machining time for 3 sets of micro-holes machined at different depths.
The variability of shape factor increases with increasing the depth.
On the other hand, a strong dependency is noticed between the time of machining and the electro
lyte level (figure 40) is noticed. This relationship agrees with observations of section 4.4 and
magnifies the significance of this factor. The machining time is reduced to equal an average of 15
seconds when a very small amount of electrolyte is used. In this case, a droplet of electrolyte is
added prior to the drilling on the top of the dry work-piece.
57
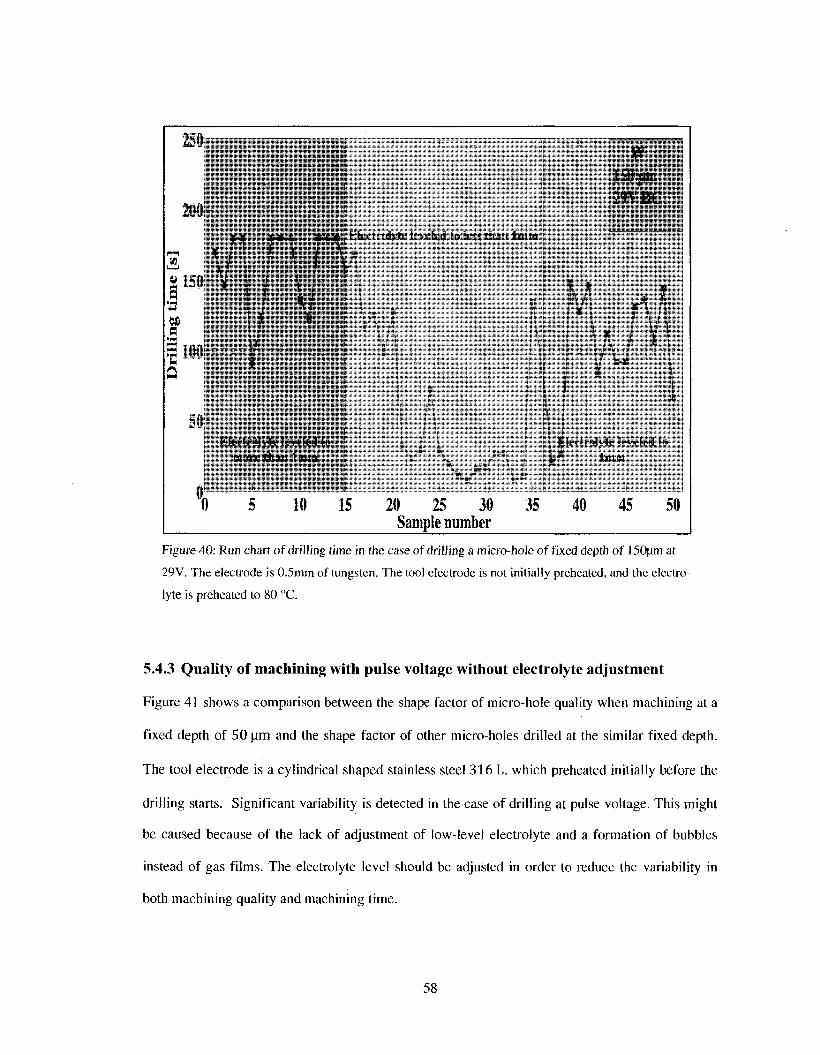
250
50 Hi-i'irulUi- Itvi'lril In
ninn- lli:in I nun
J'.k'itrohli- leveled to less Hum I mm
J
V 150 um
(li-t-trnr>ti>lei«-h>dni
10 15 25 30 35 40 45 50 Sample aumber
Figure 40: Run chart of drilling time in the case of drilling a micro-hole of fixed depth of 150umat
29V. The electrode is 0.5mm of tungsten. The tool electrode is not initially preheated, and the electro
lyte is preheated to 80 °C.
5.4.3 Quality of machining with pulse voltage without electrolyte adjustment
Figure 41 shows a comparison between the shape factor of micro-hole quality when machining at a
fixed depth of 50 pm and the shape factor of other micro-holes drilled at the similar fixed depth.
The tool electrode is a cylindrical shaped stainless steel 316 L, which preheated initially before the
drilling starts. Significant variability is detected in the case of drilling at pulse voltage. This might
be caused because of the lack of adjustment of low-level electrolyte and a formation of bubbles
instead of gas films. The electrolyte level should be adjusted in order to reduce the variability in
both machining quality and machining time.
58

O 29 V Normal voltage ^ 29 V Pulse voltage |
%
. J i i I
10 20 30 40 50 60 70 80 90 100 Drilling time [s]
Figure 41: Shape factor versus machining time for two sets of micro-holes machined one with is ma
chined using DC voltage and the other is machined using pulse voltage. The variability of pulse
voltage drills is more significant. Drilling depth is 50um.
5.4.4 Preheating the tool electrode
This procedure is demonstrated to reduce the non-machining status. Figure 42 shows two examples
of micro-holes, one drilled without preheating the electrode and the other one with preheating the
electrolyte. The electrolyte is NaOH30%wt . initially at room temperature. The electrode is
stainless steel 316 L of 0.5 mm in diameter. No significant difference in quality is observed.
However the preheating of electrode is demonstrated to decrease the non-machining duration.
0.98
uQM 3 u •a &0.94
ca
0.92
0.9
I I 1 1
o o° °
IPo^ V o _ % g 0 0
$ *> JO)17 0 0
, o , o ,
1
0
1
1
0 °
0 &
1
59

M= 260.45 jjm F=0.95 T=7.97 urn
M= 254.29 Jim F=0.94 T=ll . l l um
N
100
0
100F
-200
— Cold electrode to start
0
100
0
N - 1 0 0
s
-200.
50 100 150 200 Time [s]
—Hot electrode to start
0 50 100 150 200 Time [s]
Figure 42: The effect of preheating the tool electrode. The non-machining duration time is reduced. No
significant change in quality is detected.
5.4.5 Preheating the electrolyte
Heating up the electrolyte consumes some energy during the process, so that if the electrolyte initial
temperature is preheated to about 60 — 80°C the machining removal rate will be improved (figure
43) as discussed previously in section 4.4.
The quality of micro-holes drilled with preheated electrolyte and those drilled with cold electrolyte
at start (room temperature) is not investigated in this thesis.
60

25 30 Time [s]
Figure 43: Evolution plots of two micro-drilling one is drilled with 80°C electrolyte and the other one
is drilled without preheating the electrolyte (room temperature). Machining voltage is 29 V and elec
trode is preheated before the start of the drilling, and it is 0.5 mm diameter stainless steel. The micro-
hole depth is 50pm.
5.4.6 Variability of the micro-hole quality with the improved process
Figure 44 shows the run charts for shape factor, texture, and mean radius for both the traditional and
the improved process. It is obvious that the improved procedures yield to reducing the variability in
the process.
The trend of non-repeatability occurred in the mean radius plot is now eliminated in the improved
process. Such trend of non-repeatability could be caused because the tool electrode is not-preheated
and it takes some time to reach some temperature. The electrolyte is not preheated at the machining
as well. In the first ten micro-holes, it looks like more heat transfers through the tool electrode
instead of being used in the machining. Less depth is drilled and the gas film shape is not well
cylindrical, which makes the over-cut more superior in this case. This is not the case if the preheat
ing of both the electrode and electrolyte takes place.
61

IS •• c or)! pi
3* ,
*
e
linpr
1,00 D.98-0.96 0.94 0.92:
0.90
0,158
1.00 Q.9S 0.%
0.94 0.92 0.90
0.88
™ . _
Shape Factor
<
* " . • • ' * ** * *% * • * *
* * B »*,
* t*
: i"w 'is y 2i n 3̂ '-v •*, » Nafftjtte sssmher
- " »* »•" * * " »*„ *" *
* **" a * » «*
* * r f - f l ' i ' S ' ^
3 *> :0 IS " » /S O J5 * & &
NDID^V »HR)^r
40 -
30
20
10
0
50
•TO
30
20
10 ,,
0 '
-
' ! o \ t i i i v
„
•_ .
. • • " * * . * * ' * * * ' . * • * * ' / • * * . * , . • , * , • •
s :o is «o ;s s 'js <o -is » ViinffSv ftitmbifr
! * i r"ft"^>4
. *'->;,•„" «•/A" y;',~""
i ic :«, .o as 3c -<s <i 45 » ^3«ip^aBSi3wf
Mem lim'iiii-:
"* *
325 '
3 0 0 : ' " * ,
27S . , • , • „ - , , " * ,",„
250 ' " > " • » „ * i 5 !0 :'.. 2G J5 a 35 « 45 50
JaMi|>k ittMSiwr
350"
32S • ^ V * k . , ^
300 :
275
•*» a » s-*** ****» *"„ ""** ****** * *** ****** £ J W 1 5 IC 15 «P 2S J" '• 4 : « rs0
SatftjsSe- ssamiwr
Figure 44: The quality evaluation of the traditional and improved processes. Run charts of shape fac
tor, texture and mean radius for set of 50 micro-holes. Both the traditional and the improved processes
use the same setup, however in case of the improved process the electrode and electrolyte is initially
preheated, manual adjustment of the electrolyte is performed and the pulse voltage with 29V is used.
5.4.7 Capability of the improved process
Figure 45 shows the texture and shape factor capability plots. The texture capability index (Cpk) is
increased from 0.397 for the traditional process to 0.724 for the improved process, as a result of
reducing the variability. Similarly the shape factor capability index increased from 0.534 for the
traditional process to 0.960 for the improved process. Both the process texture and shape factor are
now more close to the target and show less spread around the target.
62
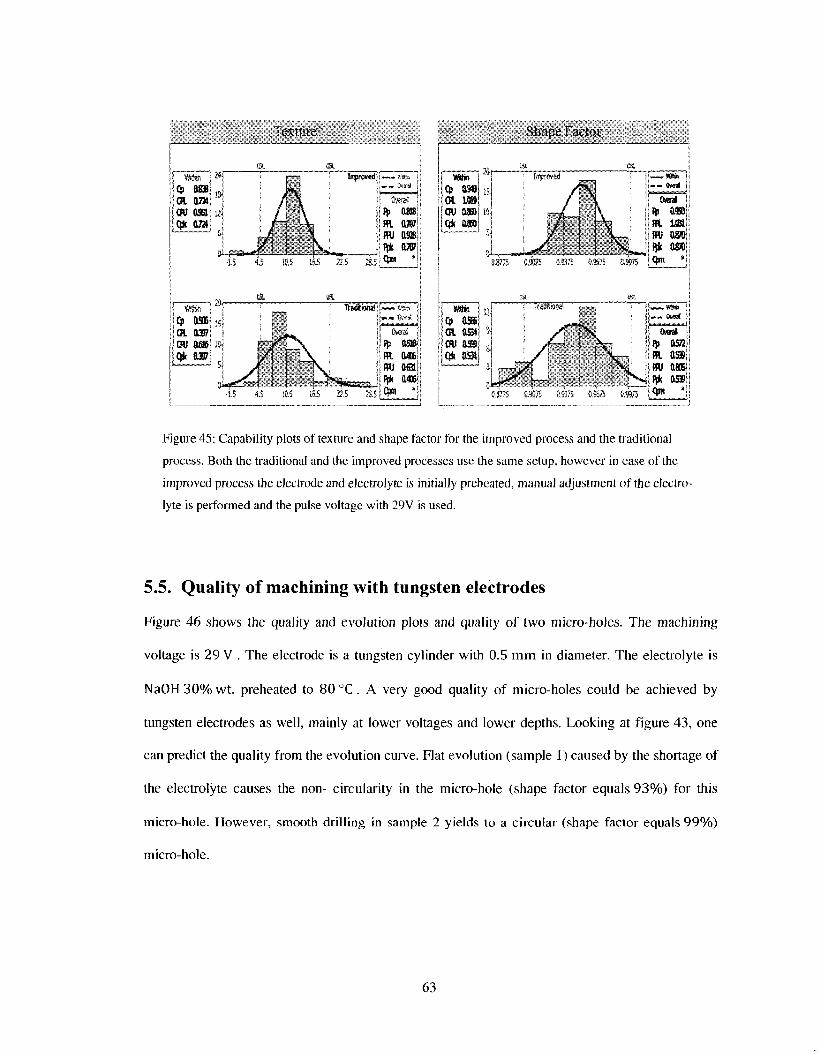
icxture Shape racier
«* ! Q> 01
0838 OMl
CPU O M
Q» 0W|
2^ i
• | i s
i2J j
si y
Improvedf!
f—I JL
JL. -1.5
h
1&5 22.5 is
$ m I * m. (W B* Qm
OSS! ftW! MS)
*!
1 Q> 0SS6-& lOt 03B? JW 086 .9-(qpk m
& m,
-KN
-is « 115 2?,5
(teal \
fp aasi
Mj a m
$&lfl
Cj) 390 01 U» CM OS CJk MB)
li-
ito
S-
/N
\ > . \
?
IH
* * * • « *
»75
. . m» Ov<ral
Oml
R> R
mi ®
.Opt
asoo VM 080
aso
!M8fc Q) 0566 CR &SH CfU & » Qk &SJ
n
9.
3
/ " V
LS-
! ™*»
. . M M ' ©***! *'
Owral i
, * — n. V w
^ H * ^ja-; <JB1
am,-m ww ttSS:
*
Figure 45: Capability plots of texture and shape factor for the improved process and the traditional
process. Both the traditional and the improved processes use the same setup, however in case of the
improved process the electrode and electrolyte is initially preheated, manual adjustment of the electro
lyte is performed and the pulse voltage with 29V is used.
5.5. Quality of machining with tungsten electrodes
Figure 46 shows the quality and evolution plots and quality of two micro-holes. The machining
voltage is 29 V . The electrode is a tungsten cylinder with 0.5 mm in diameter. The electrolyte is
NaOH 30% wt. preheated to 80 °C. A very good quality of micro-holes could be achieved by
tungsten electrodes as well, mainly at lower voltages and lower depths. Looking at figure 43, one
can predict the quality from the evolution curve. Flat evolution (sample 1) caused by the shortage of
the electrolyte causes the non- circularity in the micro-hole (shape factor equals 93%) for this
micro-hole. However, smooth drilling in sample 2 yields to a circular (shape factor equals 99%)
micro-hole.
63
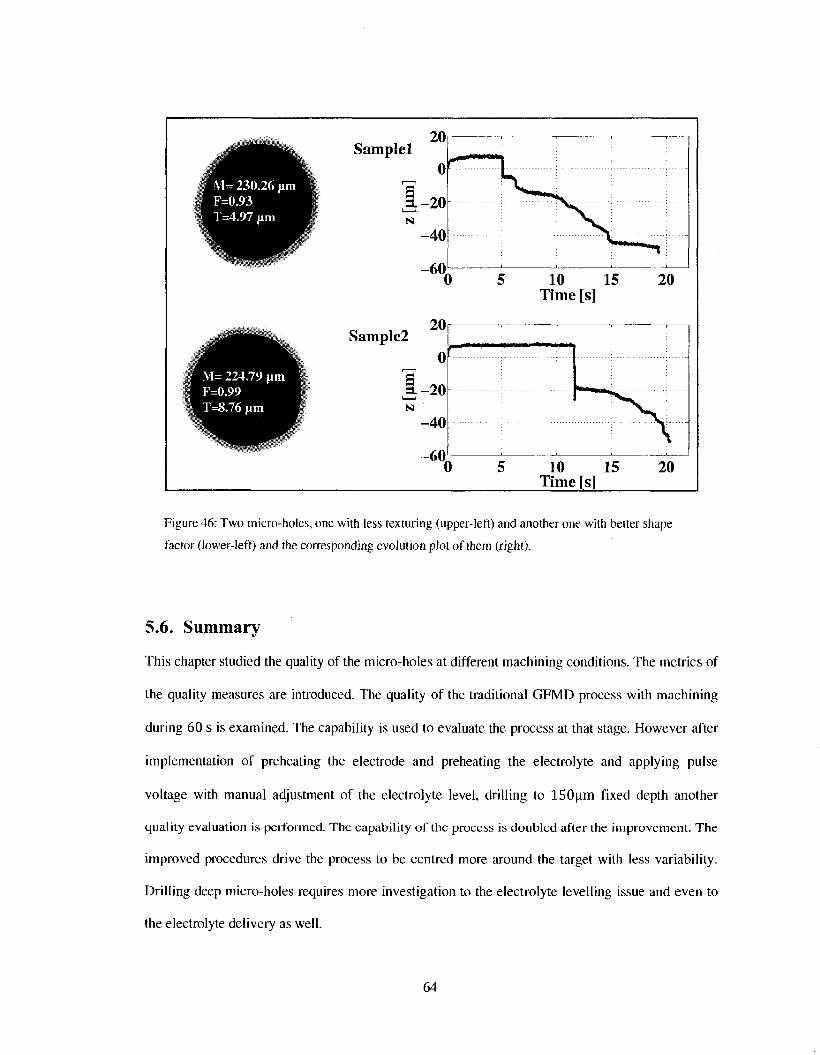
M= 230.26 urn F=0.93 T=4.97 Hm
M= 224.79 um F=0.99 T=8.76 rim
Samplel
Sample2
N
20
0
- 2 0
- 4 0
- 6 0 0
10 15 Time [s]
10 15 Time [s]
20
Figure 46: Two micro-holes, one with less texturing (upper-left) and another one with better shape
factor (lower-left) and the corresponding evolution plot of them (right).
5.6. Summary
This chapter studied the quality of the micro-holes at different machining conditions. The metrics of
the quality measures are introduced. The quality of the traditional GFMD process with machining
during 60 s is examined. The capability is used to evaluate the process at that stage. However after
implementation of preheating the electrode and preheating the electrolyte and applying pulse
voltage with manual adjustment of the electrolyte level, drilling to 150um fixed depth another
quality evaluation is performed. The capability of the process is doubled after the improvement. The
improved procedures drive the process to be centred more around the target with less variability.
Drilling deep micro-holes requires more investigation to the electrolyte levelling issue and even to
the electrolyte delivery as well.
64
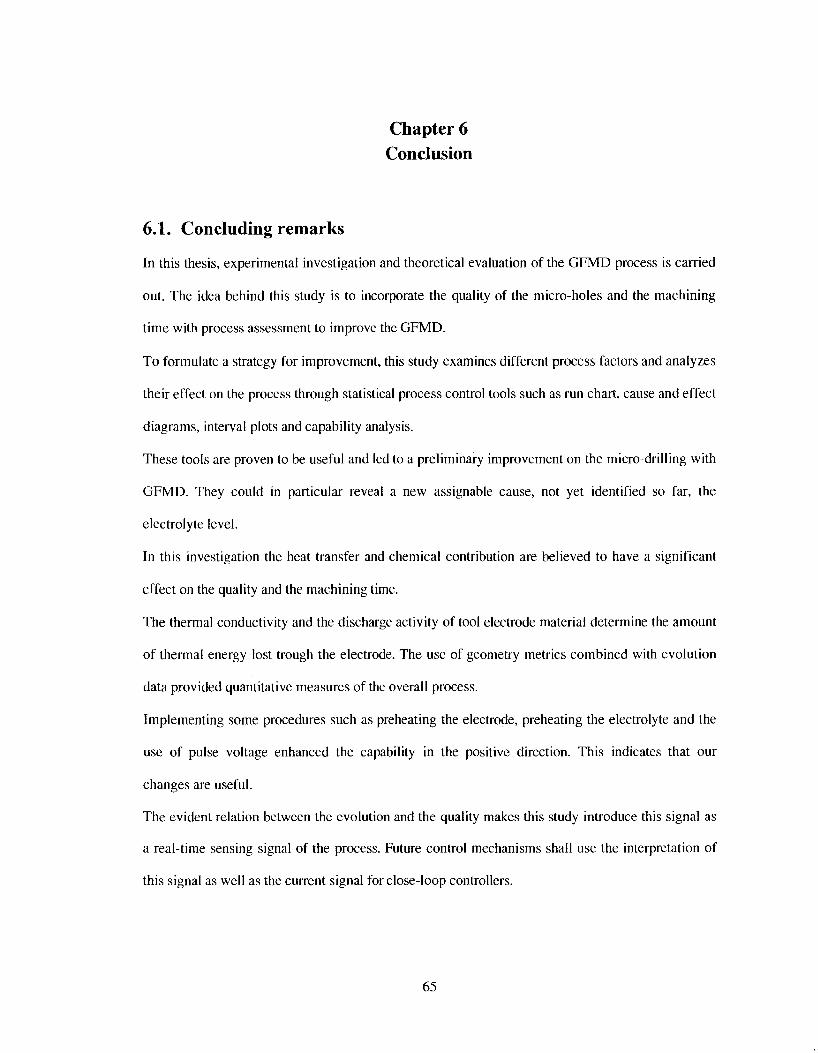
Chapter 6 Conclusion
6.1. Concluding remarks
In this thesis, experimental investigation and theoretical evaluation of the GFMD process is carried
out. The idea behind this study is to incorporate the quality of the micro-holes and the machining
time with process assessment to improve the GFMD.
To formulate a strategy for improvement, this study examines different process factors and analyzes
their effect on the process through statistical process control tools such as run chart, cause and effect
diagrams, interval plots and capability analysis.
These tools are proven to be useful and led to a preliminary improvement on the micro-drilling with
GFMD. They could in particular reveal a new assignable cause, not yet identified so far, the
electrolyte level.
In this investigation the heat transfer and chemical contribution are believed to have a significant
effect on the quality and the machining time.
The thermal conductivity and the discharge activity of tool electrode material determine the amount
of thermal energy lost trough the electrode. The use of geometry metrics combined with evolution
data provided quantitative measures of the overall process.
Implementing some procedures such as preheating the electrode, preheating the electrolyte and the
use of pulse voltage enhanced the capability in the positive direction. This indicates that our
changes are useful.
The evident relation between the evolution and the quality makes this study introduce this signal as
a real-time sensing signal of the process. Future control mechanisms shall use the interpretation of
this signal as well as the current signal for close-loop controllers.
65
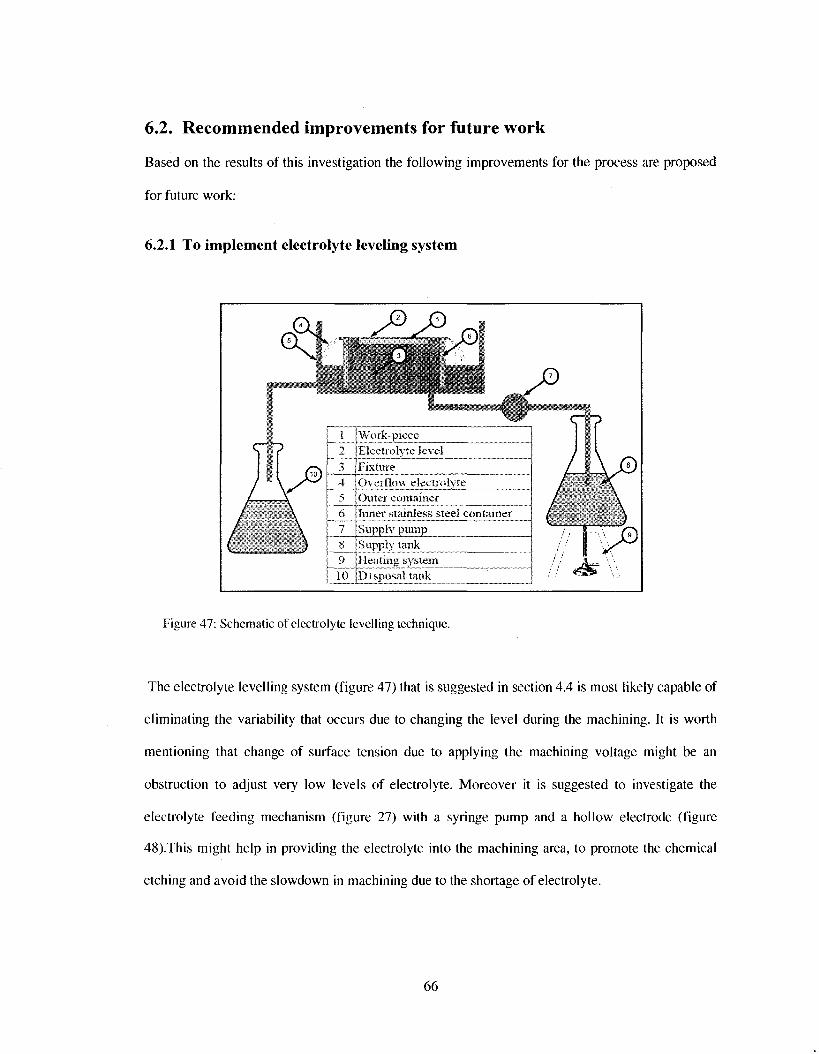
6.2. Recommended improvements for future work
Based on the results of this investigation the following improvements for the process are proposed
for future work:
6.2.1 To implement electrolyte leveling system
Figure 47: Schematic of electrolyte levelling technique.
The electrolyte levelling system (figure 47) that is suggested in section 4.4 is most likely capable of
eliminating the variability that occurs due to changing the level during the machining. It is worth
mentioning that change of surface tension due to applying the machining voltage might be an
obstruction to adjust very low levels of electrolyte. Moreover it is suggested to investigate the
electrolyte feeding mechanism (figure 27) with a syringe pump and a hollow electrode (figure
48).This might help in providing the electrolyte into the machining area, to promote the chemical
etching and avoid the slowdown in machining due to the shortage of electrolyte.
66
Tool electrode •Electrolyte
Work-piece
Figure 48: Cross-section of electrolyte injecting tool. The electrolyte is dispensed internally to the
machining zone to overcome the shortage throughout the drilling.
6.2.2 To implement tool electrode orbital motion
Although orbital motion was investigated for similar machining techniques, this is not yet imple
mented in GFMD. Such improvement might lead to well cylindrical micro-holes. This could by
either using cylindrical tool electrode or by using helical tool (figure 49). While rotating the helical
tool might feed electrolyte into the micro-hole during the drilling and at the same time might
improve the evacuation of the melted zone. The effect of the helical shaped tool on the material
removal rate and the quality of the micro-holes might be an interesting subject of the study.
67

Helical tool electrode
I Ir i i iuh ir
fork-pice
Figure 49: Helical tool electrode, to feed electrolyte into the machining zone to improve the chemical
etching and to evacuate the melted material.
6.2.3 Synchronizing the tool vibration pulse voltage and the dispensing
The significant drawback noticed in machining with pulse voltage that it is dependable extensively
on the electrolyte. Hence a vibratory motion is applied during the machining with pulse voltage and
combining both with electrolyte dispensing (figure 50). It is presumed that this might significantly
improve the quality of the micro-holes, due to the promotion of chemical etching and at the same
time it might improve the material removal rate which is known to be improved when the tool
electrode vibration is applied.
68

Current sensor Optical sensor Electrolyte temperature sensor
y— •>
^ - f - - —
S
V r Tool lutattun csmtrotler Position controller
Tool \ibration controller
Hectroiyte controller
Power controller
Figure 50: Sketch of overall control system for GFMD. The vibration, pulse voltage and electrolyte
feeding is synchronized.
6.2.4 Investigating the overall geometry of the micro-hole
Studying only the entrance surface of the micro-hole might not be enough to characterize the quality
of such micro-hole. It might be interesting to investigate the overall geometry of the micro-hole.
New measures and rather more significant metrics could be presented. The cylindricity, concentric
ity, circular run-out, and total run-out might contribute in detecting one or more deficiencies in the
machining .
6.2.5 Using stair-case-like evolution for predicting quality and machining time
The importance of studying the stair case evolution comes from the shortage of prediction metrics
in GFMD. This might increase our knowledge about the process itself. So far the current signal is
69

known to identify and predict the information that this evolution. A prediction model that can link
the characteristics of stair case evolution with the quality and the material removal rate could be a
major innovation in the GFMD.
6.3. Contribution to knowledge
Throughout the thesis was stressed that the GFMD has a potential for improvement, which are
necessary to become competitive with other micro-drilling processes. It was the main goal of the
study to lay the strategy and direction for improvement through statistical control tools. The
methodology and experimental observations gathered in this thesis can now be readily saved to
further improve and evaluate the process. The results obtained along with the proposed future work
form the conclusion shall prove useful in designing more complex GFMD- like processes in the
field of micro-drilling.
70
References
[I] Wiithrich R and Fascio V 2005 Machining of non-conductive materials using electrochemical
discharges phenomenon—an overview. Int. J. ofMach Tools Manuf. 45 1095-108
[2] Kurafuji H and Suda K 1968 Electrical discharge drilling of glass. Ann. CIRP 16 415-9
[3] Wiithrich R, Spaelter U, Wu Y, Bleuler H 2006 A systematic characterization method for
gravity-feed micro-hole drilling in glass with Spark Assisted Chemical Engraving (SACE). J.
Micromech. Microeng. 16 1891-1896
[4] Wiithrich R, Spaetler U, Bleuler H, 2006 The current signal in Spark Assisted Chemical
Engraving (SACE), what does it tell us ?. /. Micromech. MicroengA6 779-785
[5] Gautam N and Jain V K 1998 Experimental investigations into ECSD process using various
tool kinematics. Int. J. Mack Tools Manuf. 38 15-2
[6] Wiithrich R, Despont B, Maillard P, Bleuler H 2006 Improving drilling speed in Spark Assisted
Chemical Engraving (SACE) by tool vibration. J. Micromech. Microeng. 16 28-31
[7] Wiithrich R, Fujisaki K, Couthy Ph, Hof L A and Bleuler H 2005 Spark assisted chemical
engraving (SACE) in microfactory. J. Micromech. Microeng.
[8] Maillard P 2007 Investigation on material removal process in SACE glass machining design of
a force measuring set-up. Master thesis, Swiss Federal Institute of Technology, EPF Lausanne
[9] Jalali M, Maillard P, Mishra S P, Kadem L, Wiithrich R 2007 Modelling gravity feed micro hole
drilling by electrochemical discharge. 2nd Int. Conf. on Micro-Manufacturing, Greenville, South
Carolina, USA
[10] Kim D-J, Ahn Y, Lee S-H, Kim Y-K (2006) Voltage pulse frequency and duty ratio effects in a
electrochemical discharge micro-drilling process of Pyrex glass. Int. J. ofMach. Tools and Manuf.
46 p. 1064
[II] Wiithrich R (2007) Fundamentals and Application of Spark Assisted Chemical Engraving.
William Andrew Micro & Nano Technologies (MNT) Series (under-press).
71
[12] Zheng Z-P, Cheng W-H, Huang F-, Yan Y B-H (2007) 3D microstructuring of Pyrex glass
using the electrochemical discharge machining process. J. Micromech. Microeng.M p. 960
[ 13] West J, Jadhav A (2007) ECDM methods for fluidic interfacing through thin glass substrates
and the formation of spherical microcavities. J. Micromech. Microeng 17 403-409
[14] Jain V K, Rao P S , Choudhury S K , Rajurkar K P (1991) Experimental investigations into
travelling wire electrocheimical spark machining (TW-ECSM) of composites Trans. ASME.
Journal of Engineering for Industry 113 p. 75
[15] Zheng Z-P, Su H-C, Huang F-Y, Yan B-H (2007) The tool geometrical shape and pulse-off
time of pulse voltage effects in a Pyrex glass electrochemical discharge micro-drilling process
Journal of Micromechanics and Microengineering 17 p. 265
[16] Jain V K, Choudhury S K, Ramesh K M (2002) On the machining of alumina and glass. Int. J.
of Mack Tools andManuf 42 p. 1269-1276.
[17] Maillard P, Despont B, Bleuler H, Wiithrich R (2007) Geometrical characterization of micro-
holes drilled in glass by gravity-feed with spark assisted chemical engraving (SACE). J. Micro
mech. Microeng 17 1343-1349
[ 18] Oakland, J S (2003) Statistical Process Control Butterworth-Heinemann fifth edition
[19] Deming W E (1986) Out of the Crisis. MIT Centre for Advanced Engineering Study, Cam
bridge, Massachusetts.
[20] Wiithrich R, Hof L (2006) The gas film in spark assisted chemical engraving (SACE) - A key
element for micro-machining applications. Int. J. ofMach. Tools and Manuf. 46 p.828
[21 ] Box, G E P, Hunter W G, Hunter J S (1978) Statistics for Experimenters Wiley-Inter science
[22] Sarkar B R, Doloi B, Bhattacharyya B (2006) Parametric analysis on electrochemical dis
charge machining of silicon nitride ceramics. International Journal of Advanced Manufacturing
Technology 28 p.873-881
[23] http://www.mathworks.com/matlabcentral/files/! 5125/content/demo/htmI/ellipsedemo.html
72

[24] Thoe T B , Aspinwall D K , Wise M L H (1998) Review on ultrasonic machining. Int. J. of
Mach. Tools and Manuf. 38 p. 239-255
[25] Yerokhin A L, Nie X, Leyland A, Maetthews A, Dowey S.J. (1999) Plasma electrolysis for
surface engineering. Surf. Coat. Tech. 122 73-93
[26] Reghuram V (1994) Electrical and spectroscopic investigations in electrochemical discharge
machining Dissertation Thesis, Indian Institute of Technology, Madras and Indian Institute of
Technology, Kanpur
[27] Raghuram V, Pramila T, Srinivasa Y G, Narayanasamy K (1995) Effect of the circuit parame
ters on the electrolytes in the electrochemical discharge phenomenon. Journal of Material
Possessing Technologies 52 301-318
73

Appendices
74

Appendix A A.l. Cost analysis
Although the GFMD and SACE in general are simple and costly, this thesis presents an introduction to the
cost analysis as cause and effect diagram (figure 51) shows the possible cause of increasing the cost if
research and development set up is used as a production process.
B-B -<-
• A~A -f-
-
Not nil si i i iuK ; I I T
monitored
() i i ; i l i t \ imnn>\ omcni _ — » . • ' — .
c<isl\
!>t'«.i«n tit"
cxpcriMiL'iils oisis
Init i i i l cost —
Miiiiiti ' iLiiK'c' rt'|);iir cost
IMlOtO^liipIlN
\ isinti
l )a(n at(|iii>iiii)ii
system*, sensors unci •—,
actuators i'd<>l
K{|iii[)iiKitl and
i\v\ icrs e»\t
l>nnr rrpt; ir : ihi l t ( \ rt*\t
(unci'i t i l int ) )
I .ou i i - i i io\:t l r;iK- cost !u;ii(iii*4
tiim-)
Klt ' i i r t ihft* t-iri'iihilion <asUm
Kt?:il-finii' moni tnr i i i " :ind
controt costs
C auses for process
operation
costs
Figure 51: Cause and effect diagram of the process operational cost, if the research and development
setup is used as a production setup for GFMD. A-A and B-B are described in figure 5 and figure 10.
75

A.2. Significant root causes
After the root causes are determined using the cause and effect diagrams, a study of ordering those causes
from the most significant ones to the least significant ones should be carried out. Focus groups and customer
surveys are good tools to collect such information. The customer's opinion is giving this information
indirectly. The information collected by those surveys should be analyzed by an expert with the process
interactions. Looking to figure 52, one can observe three major root causes, which are:
- Electrolyte level variability
- Gas film instability
- Non-machining status
Other minor root causes can be left to the further stages of the improvement.
2 8 % /
Gas film instability
yw%
1
Electrolyte level
^75%
Non-machining
status
-^m%
Tool bending
98%
Excess force
100%
I Non-
desirable vibration
Figure 52: Pareto diagram of the major error states. The data is collected by an error frequency survey.
76

Appendix B B.l. Micro-hole edge tracking
This vision system is programmed using Matlab image processing tool box. The flowchart in figure 53
shows the procedure of the vision system. The contour that follows upper surface edge of the micro-holes is
determined, as a matrix of X and Y axis coordinates. These coordinates are used in calculating the mean
radius, the shape factor and the texture.
( lllllll'll llll.lllt'
1
. -
HIM:II\ Inum i n i ' l m
/>
i i
1 I . I K l - l ' j l t l III
IMII:H\ mum1
l imi . i i i ' l i i i i i i i i l i i i i
(irsiy seal*.11111:1*41' IS
Morpltolcmicalh npfii biii.11 j iin:im.'
B>\:ii'(,:i(i[H'ii
I.
I'tlli'd ellipse ini:i«;o Kllipslit
11
\ \ i I . I^III ; ; til it. •
i m l i l i i i
(
l i n u l i i l i:in.il\ i l ium-
/
Figure 53: The flow chart of the Micro-hole edge tracking vision system.
Figure 54 shows the output of each step of the vision system. The processing of each 20 micro-images takes
around 60 seconds in case of no image display.
77

Figure 54: The output of each step in the vision system.
78

Appendix C C.l. Pulse voltage circuit
To minimize the instability in the gas film, which affects the repeatability of machining, the pulse voltage
circuit is introduced. Figure 55 shows the implementation of the RL Circuit and its effect on the current
signal when connecting to the machining cell. When the critical current is reached the gas film is fully
developed, and acts as a capacitor. This blocks the current causing the discharges to occur, for very short
time. Then the current increases as the gas films grow up again until reaching the critical current again the
phenomenon is repeated again and again.
Figure 55: The ideal current signal from RL circuit (solid line) and the expected current response when
connecting to the machining cell (hidden line).
C.2. Electrolyte level interpretation
When the tool electrode is immersed in the electrolyte, the interfacing surface between the tool electrode the
electrolyte is represented as follows (in case of cylindrical electrode):
S = itr'2 + 2m-'L (8)
S : is interfacing surface [pm2]
79

r ' : is radius of electrode [urn]
L : is level of the electrolyte [um]
The increase in the electrolyte level yields to an increase in the critical current, which makes the gas film
formation takes shorter times in case of lower levels. The electrolyte level can be measured by the current
signal of the cell. The lower the level, the higher the magnitude of the current signal shall be. A plot of
critical current as a function of electrolyte level is shown in figure 56.
1= IP*S
s Surface
Ar^a-
(M (),<, 0,8 I 14 Electrolyte fevel from)
Figure 56: Interpreting the electrolyte level as the interfacing area between the electrode and electro
lyte. Ip is the current density of the cell, and S is the total interfacing area. The tool electrode is
0.5 mm in diameter and the current density is 1.0 -•
80