Quadratic Engel Curves and Consumer Demand James Banks ...uctp39a/Banks-Blundell-Lewbel-1997.pdf ·...
18
Quadratic Engel Curves and Consumer Demand James Banks; Richard Blundell; Arthur Lewbel The Review of Economics and Statistics, Vol. 79, No. 4. (Nov., 1997), pp. 527-539. Stable URL: http://links.jstor.org/sici?sici=0034-6535%28199711%2979%3A4%3C527%3AQECACD%3E2.0.CO%3B2-Z The Review of Economics and Statistics is currently published by The MIT Press. Your use of the JSTOR archive indicates your acceptance of JSTOR's Terms and Conditions of Use, available at http://www.jstor.org/about/terms.html. JSTOR's Terms and Conditions of Use provides, in part, that unless you have obtained prior permission, you may not download an entire issue of a journal or multiple copies of articles, and you may use content in the JSTOR archive only for your personal, non-commercial use. Please contact the publisher regarding any further use of this work. Publisher contact information may be obtained at http://www.jstor.org/journals/mitpress.html. Each copy of any part of a JSTOR transmission must contain the same copyright notice that appears on the screen or printed page of such transmission. The JSTOR Archive is a trusted digital repository providing for long-term preservation and access to leading academic journals and scholarly literature from around the world. The Archive is supported by libraries, scholarly societies, publishers, and foundations. It is an initiative of JSTOR, a not-for-profit organization with a mission to help the scholarly community take advantage of advances in technology. For more information regarding JSTOR, please contact [email protected]. http://www.jstor.org Tue Jun 26 17:36:14 2007
Transcript of Quadratic Engel Curves and Consumer Demand James Banks ...uctp39a/Banks-Blundell-Lewbel-1997.pdf ·...

Quadratic Engel Curves and Consumer Demand
James Banks; Richard Blundell; Arthur Lewbel
The Review of Economics and Statistics, Vol. 79, No. 4. (Nov., 1997), pp. 527-539.
Stable URL:
http://links.jstor.org/sici?sici=0034-6535%28199711%2979%3A4%3C527%3AQECACD%3E2.0.CO%3B2-Z
The Review of Economics and Statistics is currently published by The MIT Press.
Your use of the JSTOR archive indicates your acceptance of JSTOR's Terms and Conditions of Use, available athttp://www.jstor.org/about/terms.html. JSTOR's Terms and Conditions of Use provides, in part, that unless you have obtainedprior permission, you may not download an entire issue of a journal or multiple copies of articles, and you may use content inthe JSTOR archive only for your personal, non-commercial use.
Please contact the publisher regarding any further use of this work. Publisher contact information may be obtained athttp://www.jstor.org/journals/mitpress.html.
Each copy of any part of a JSTOR transmission must contain the same copyright notice that appears on the screen or printedpage of such transmission.
The JSTOR Archive is a trusted digital repository providing for long-term preservation and access to leading academicjournals and scholarly literature from around the world. The Archive is supported by libraries, scholarly societies, publishers,and foundations. It is an initiative of JSTOR, a not-for-profit organization with a mission to help the scholarly community takeadvantage of advances in technology. For more information regarding JSTOR, please contact [email protected].
http://www.jstor.orgTue Jun 26 17:36:14 2007
The Review of Economics and Statistics VOL. LXXIX NOVEMBER1997 NUMBER4
QUADRATIC ENGEL CURVES AND CONSUMER DEMAND
James Banks, Richard Blundell, and Arthur Lewbel*
Abstract-This paper presents a model of consumer demand that is consistent with the observed expenditure patterns of individual consumers in a long time series of expenditure surveys and is also able to provide a detailed welfare analysis of shifts in relative prices. A nonparametric analysis of consumer expenditure patterns suggests that Engel curves require quadratic terms in the logarithm of expenditure. While popular models of demand such as the Translog or the Almost Ideal Demand Systems do allow flexible price responses within a theoretically coherent structure, they have expenditure share Engel curves that are linear in the logarithm of total expenditure. We derive the complete class of integrable quadratic logarithmic expenditure share systems. A specification from this class is estimated on a large pooled data set of U.K. households. Models that fail to account for Engel curvature are found to generate important distortions in the patterns of welfare losses associated with a tax increase.
I. Introduction
DEMAND models play an important role in the evalua- tion of indirect tax policy reform. We argue that for
many commodities, standard empirical demand models do not provide an accurate picture of observed behavior across income groups. Our aim is to develop a demand model that can match patterns of observed consumer behavior while being consistent with consumer theory and thereby allowing welfare analysis.
The distributional analysis of commodity tax policy requires the accurate specification of both price and income effects. Crude utility-based demand models such as the linear expenditure system, however, impose strong and unwarranted restrictions on price elasticities (Deaton (1974)). Recognition of this spawned a large literature, first on flexible demand systems and later on semiparametric and nonparametric specifications of demands. Except for the estimation of Engel curves, these nonparametric methods are generally series rather than kernel based (see Barnett and Jonas (1983) or Gallant and Souza (1991)) because of the
Received for publication June 27, 1995. Revision accepted for publica- tion October 1, 1996.
* Institute for Fiscal Studies. Also University College London, Univer- sity College London, and Brandeis University, respectively.
This is a revised version of our earlier paper, "Quadratic Engel Curves, Tax Reform and Welfare Measurement." We would like to thank two anonymous referees as well as Martin Browning, Alan Duncan, Angus Deaton, Terrence Gorman, Costas Meghir, Jean-Marc Robin, James Stock, Thomas Stoker, Guglielmo Weber, and seminar participants at Brown, Harvard, INSEE, Nufiield, Northwestern, Stanford, and LSE for helpful comments. Financing for this research, provided by the ESRC Research Centre for the Micro Economic Analysis of Fiscal Policy at IFS and the NSF under Project SES-9011806, is gratefully acknowledged. Thanks are also due to the Department of Employment for providing the FES data used in this study. The usual disclaimer applies.
difficulty of imposing utility-derived structure (such as Slutsky symmetry) on kernel estimators.
Since incomes vary considerably across individuals and income elasticities vary across goods, the income effect for individuals at different points in the income distribution must be fully captured in order for a demand model to predict responses to tax refom usefully. ~ ~ d ~ ~ d , the study of the between and in-come (the Engel curve) has been at the center of applied micrOecOnOmic analysis since the early studies of Engel (1895), Working (1943), and Leser (1963). But a complete description of consumer behavior sufficient for welfare analysis requires a specification of both Engel curve and relative price effects consistent with utility maxirniza- tion. An important contribution of the Muellbauer (1976), Deaton and Muellbauer (1980), and Jorgenson et al. (1982) studies was to place the Worhng-Leser Engel curve specifi- cation within integrable consumer theory.
For many commodities, however, there is increasing evidence that the Working-Leser form underlying these specifications does not provide an accurate picture of individual behavior. A series of empirical Engel curve studies indicates that further terms in income are required for some, but not all, expenditure share equations (see, for example, Atkinson et al. (1990), Bierens and Pott-Buter (1987), Blundell et al. (1993), Hausman. et al. (1995), H2rdle and Jerison (1988), Hildenbrand (1994), and Lewbel (1991)). For welfare analysis we will show that if some commodities require these extra terms while others do not (as we find in our empirical analysis), then parsimony, coupled with utility theory, restricts the nonlinear term to being a quadratic in log income.
We derive a new class of demand systems that have log income as the leading term in an expenditure share model and additional higher order income terms. This preserves the flexibility of the empirical Engel curve findings while permitting consistency with utility theory and is shown to provide a practical specification for demands across many commodities, allowing flexible relative price effects. We show that the coefficients of the higher order income terms in these models must be price dependent and that these higher order terms have to include a quadratic logarithmic term. The demands generated by this class are shown to be rank 3 which, as proved in Gorman (1981), is the maximum possible rank for any demand system that is linear in functions of income. The quadratic logarithmic class nests
01997 by the President and Fellows of Harvard College and the Massachusetts Institute of Technology [ 527 1

528 THE REVIEW OF ECONOMICS AND STATISTICS
both the Almost Ideal (AI) model of Deaton and Muellbauer and the exactly aggregable Translog model of Jorgenson et al. (1982). Unlike these demand models, however, the quadratic logarithmic model permits goods to be luxuries at some income levels and necessities at others. The empirical analysis we report suggests that this is an important feature.
Using data from the U.K. Family Expenditure Survey (FES), under a variety of alternative parametric and nonpar- ametric estimation techniques, we are able to strongly reject the Working-Leser form for some commodities, while for others, in particular food, Engel curves do look very close to being linear in log income. This analysis confirms that share equations quadratic in the logarithm of total expenditure can provide a good approximation to the Engel relationship in the raw microdata.
It is interesting to note that Rothbarth and Engel equiva- lence scales of the sort discussed in Deaton and Muellbauer (1986) implicitly assume that Engel curves are monotonic in utility, and hence in total expenditures. The Engel curvature found in our data violates this assumption. For example, Rothbarth scales may use expenditureson alcohol or adult clothing to measure welfare. Our quadratic Engel curves for these goods invalidate such techniques since both rich and poor households could have the same expenditure on these commodities.
Having established the Engel curve behavior, a complete demand model is estimated on a pooled FES data set using data from 1970 to 1986. This model produces a data-coherent and plausible description of consumer behavior. The specific form we propose-the Quadratic Almost Ideal Demand System (QUA1DS)-is constructed so as to nest the A1 model and have leading terms that are linear in log income while including the empirically necessary rank 3 quadratic term. Regularity conditions for utility maximiza- tion, such as Slutsky symmetry, can be imposed on our model and are not statistically rejected. Regularity con-straints involving inequalities cannot hold globally for any demand system such as ours, which allows some Engel curves to be Worlung-Leser, because at suff~ciently high expenditure levels a budget share that is linear must go outside the permitted zero-to-one range.l Despite this, negative semidefiniteness of the Slutsky matrix is found to hold empirically in the majority of the sample, with the exceptions being the very high income households.
More specifically, let x equal deflated income, that is, income divided by a price index. One convenient feature of the A1 model is that the coefficients of In x in the budget share equations are constants. Our theorem 1 shows that any parsimonious rank 3 extension must be quadratic in lnx. Given this, it would be convenient2 if a rank 3 specification could be constructed in which the coefficients of both In x
Some globally regular demand systems do exist (Barnett and Jonas (1983) and Cooper and McLaren (1996), for example), but these are all examples of fractional demand systems, and none with rank higher than 2 have been implemented empirically.
It was shown by Blundell et al. (1993) to be empirically plausible.
and (In x ) ~ were constants. We find that a surprising implica- tion of utility maximization is that constant coefficients are not possible in such models-the coefficients of (In x)* must vary with prices. The QUAIDS model we propose makes this required price dependence as simple as possible.
The layout of the paper is as follows. Section I1 contains our assessment of the Engel curve relationship. In section I11 the theoretical results are presented, and the restrictions placed on the model by consumer demand theory are derived. Section IV presents estimates of relative price and income effects for our QUAIDS model of demand, which relaxes these restrictions. The restrictions are rejected, as are linear logarithmic preferences. In section V we illustrate the importance of our results for the welfare evaluation of indirect tax reform with two specific reforms which high- light differences in consumer behavior across goods. A brief summary and concluding comments are presented in sec- tion VI.
11. Assessing the Shape of the Engel Curve Relationship
Given the importance of the Engel relationship, we begin our analysis by providing a nonparametric description of the Working-Leser model. In this model each expenditure share is defined over the logarithm of deflated income or total expenditure. The evidence in the raw expenditure data from the U.K. FES for a quadratic extension to this linear relationship can be seen clearly from the preliminary data analysis presented below. Although we make comparisons across household types, in order to place emphasis on the shape of the Engel curve we use a relatively homogeneous subsample taken from the 1980-1982 surveys for which there are two married adults with the husband employed and who live in London and the South East.
This choice reflects the need to preserve homogeneity of composition since we have good reason to believe that the shape of Engel curves is likely to vary with labor market status and region (see Browning and Meghir (1991) and Blundell et al. (1993)). It also reflects our desire to pin down the shape of the Engel curve before moving to the time- series information on relative price movements in our repeated cross sections."
Figure 1 presents nonparametric kernel regressions, qua- dratic polynomial regressions, and pointwise confidence intervals for the nonparametric Engel curves of our five commodity groups in a three-year period in the middle of our sample. In all kernel regressions we use the Gaussian kernel with a mean integrated squared-error optimal smooth- ing parameter (see Hardle (1990)).%lthough the linear formulation appears to provide a reasonable approximation for the food share curve, for some groups, in particular
In addition we trim any observations that lie outside three standard deviations of the mean on either the logarithm of total expenditure or any of the five commodity expenditure shares.
"11 computations were canied out using Gauss and the Gauss-based interactive kernel regression package NP-REG (see Duncan and Jones (1992)).
I

529 QUADRATIC ENGEL CURVES AND CONSUMER DEMAND
FIGURE 1~.-NONPARAMETRIC ENGELCURVEFOR FOOD SHARES FIGURE 1~.-NONPARAMETRIC CURVE FUEL SHARES ENGEL FOR DOMESTIC
0 3 . 4 3.8 4.2 4.6 5.0 5.4 5.8 6.2 6.6 Log Expenditure
N
0
---- Kernel X
0... . ---- Polynomial x X
0
9)
I d i-
52 -v 3 8.
0
* z -/
N 9 '
( , , , , , , , , , , , , ,
O 3 . 4 3.8 4.2 4.6 5 0 5.4 5.8 6.2 6.6 Log Expenditure
3 4 3.8 4 2 4.6 5 0 5.4 5.8 6.2 6.6
Log Expenditure
alcohol and clothing. distinct nonlinear behavior is evident, at least in the raw data.
It is interesting to focus on a comparison with the simple second-order polynomial fit. Some guidance to the reliabil- ity of the quadratic approximation can be drawn from the pointwise confidence intervals (evaluated at decile points)
-Kernel Polynomial
0 ?0 3 4l . 3.8 ' . 4.2l , l , 5 '0 , D ' " t 6.2,4.6 5.4 5.8 J 6.6
Log Expenditure
m
T.
s ' " " " " " " 0 3 . 4 3.8 4.2 4.6 5.0 5.4 5.8 6.2 6.6
Log Expenditure
shown in the graphs. It is only where the data are sparse and the confidence bands relatively wide that the paths diverge. This appears to be the case for all five commodity groups across the span of the data period.
The need for higher order terms in the Engel curve relationship is also evident from the rank test results
0

530 THE REVIEW OF ECONOMICS AND STATISTICS
T.ABLEI.-RANK TESTSFOR FES D 4 ~ 4 1980-1982
Gill and Lewbel( 1992) Cragg and Donald ( 1995)Distribution
Test Function X' Statistic p - b l u e X' Statistic 11-Value
presented in table 1. This test examines the maximurrl rank of the coefficient matrix on a general set of income functions, as in Lewbel (1991). The first test uses the lower-diagonal-upper (LDU) Gaussian elimination decom- position as a basis for a nonparametric test (see Gill and Lewbel (1992)). The second test is an alternative improved distance measure related test proposed by Cragg and Donald (1995), which imposes the restriction that budget shares sum to 1.Our results refer to the 1980-1982 subset of data. Table 1 provides values for a sequence of asymptotic x2 tests against the alternative that the rank is greater than r. There is a strong suggestion that a rank 3 relationship is required, as would be the case in our second-order polynomial.
Detailed results (available from the authors) indicate stability in these overall patterns across time and across alternative bandwidth choices for the nonparametric regres- sions. It is perhaps more important to note that the overall picture is maintained for other demographic groups. For example, figure 2a shows shifts in the Engel curve for food as the household size varies. The overall shape is little affected by variations in the choice of kernel or smoothing parameter. Indeed, the behavior in the tails of the kernel regressions in figure I reflects low density in the data and is made more stable in figure 2a by the adoption of the computationally more expensive adaptive kernel.
These raw data analyses should be viewed with caution for a number of reasons. Most obviously one would expect additional covariates. This point is largely accounted for by the selection of a homogeneous subsample. Possibly of more importance are assumptions on the stochastic specification underlying the kernel regressions. The explanatory variable is the logarithm of (deflated) total expenditure on the sum of the five consumption categories. This is likely to be endog- enous. Our first line of analysis therefore is to assess to what extent the rejection of linearity can be attributed to one of these stochastic problems. To do this we follow both nonparametric and parametric approaches.
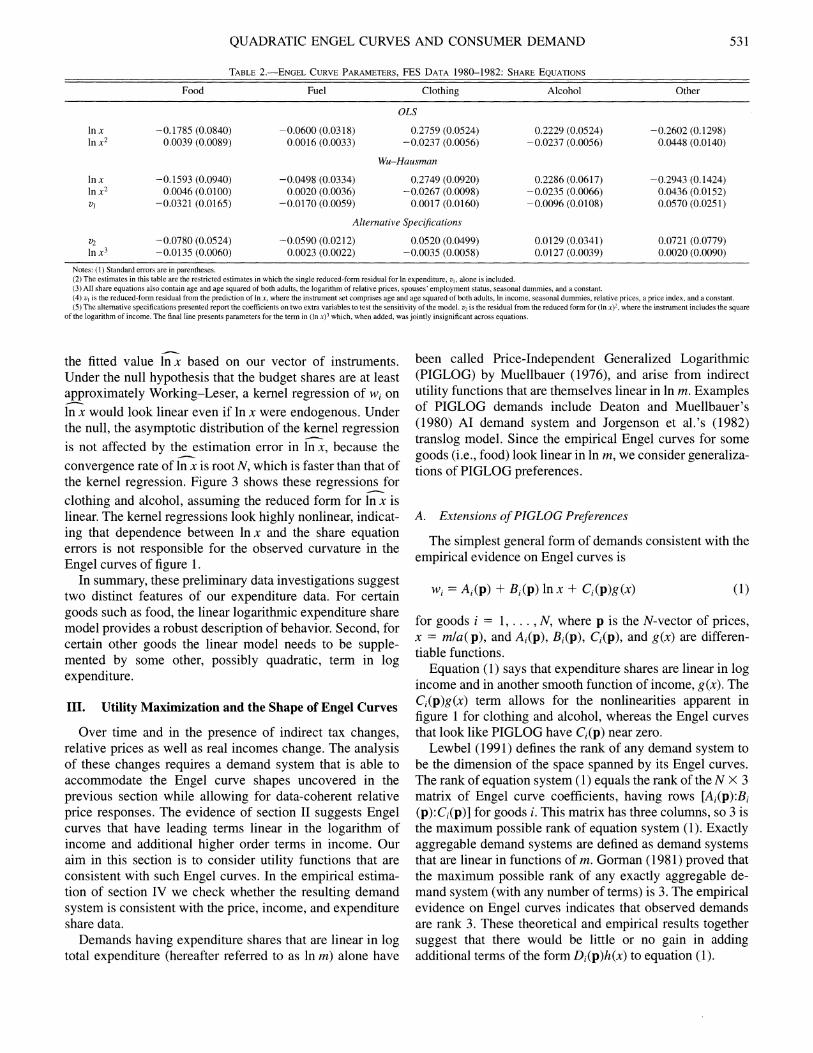
The ordinary least-squares (OLS) regression estimates corresponding to the quadratic approximation to the kernel regressions are given in table 2. As one might expect, they imply similar conclusions as the plots we have already discussed. Quadratic terms are significant for clothing, alcohol, and other goods, but linearity appears to be sufficient to explain expenditure shares on food and fuel. To allow for the possibility of endogeneity, we instrument log expenditure and its square by log income and its square. One way of computing this estimator is by the inclusion of the two reduced-form residuals in an extended OLS regression
(see Holly (1982)). This "Wu-Hausman" technique has the advantage of directly testing exogeneity through the joint significance of the two residual terms. Exogeneity of log expenditure is strongly rejected, but the residuals on the reduced form for the square of log expenditure (presented in the penultimate row of table 2) are not jointly significant. This suggests that including the reduced-form residual on log expenditure alone is sufficient to coritrol for endogeneity. Joint normality of log expenditure and the Engel curve disturbances would be sufficient to guarantee this result. In figure 2b we show the closeness to normality of the In x distribution in our data.
Table 2 also presents results for the quadratic model under this correction for endogeneity. These estimates differ from the OLS results but display the same overall patterns. As a final check on our specification we include higher-order terms in log expenditure, which are presented in the final row of table 2. These are also jointly insignificant.
As a descriptive alternative to this instrumental variable procedure, we show a more nonparametric picture of the robustness of our Engel curve results. For this we consider
O 4 0 4 5 5.0 5 5 6 0 6.5
Log Real Expendi ture
Log Expenditure
531 QUADRATIC ENGEL CURVES AND CONSUMER DEMAND
TABLE2.-ENGEL CURVE PARAMETERS, FES DATA 1 9 8 0 - 1 9 8 2 : SHAREEQUATIONS
Food Fuel Clothing Alcohol Other
OLS
Notes: ( 1 1 Standard errors are In parentheses. ( 2 )The estimate? in thl? tahle are the restricted eqtlmates In whlch the ~ ingle reduced-form residual for In eapendlture, r , . alone 15 included. (3)All ?hare equations al?o contain age and age squared of both adultc. the logar~thm of relative prices. ~pou?es' employment statu?. seaqonal dummies, and a conqtant. (4) u , is the reduced-form recidual irom the predtction of In x. where the inctm~nent set comprises age and age squared of both adults. In income. seasonal dummies. relatire prices. a prlce Index. and a constant. ( 5 ) The alternative ~pec~ticdtions on two extra variables to test the sensltlvit? of the model. ul IS the resldual irom ihe reduced form for (In 1 I?. % here the lnitrument 1nclude5 the square presented report the coeftic~ents
of the logar~thm of income. The final llne pre~ent? parameter? for the term In (In x)? whlch. when added. was jointly ~ns~gn~ficant acros equatlon5
the fitted value lnx based on our vector of instruments. Under the null hypothesis that the budget shares are at least approximately Working-Leser, a kernel regression of w,on In x would look linear even if In x were endogenous. Under the null, the asymptotic distribution of the kernel regression is not affected by the estimation error in In x, because the -convergence rate of In x is root N, which is faster than that of the kernel regression. Figure 3 shows these regressions for clothing and alcohol, assuming the reduced form for in x is linear. The kernel regressions look highly nonlinear, indicat- ing that dependence between In x and the share equation errors is not responsible for the observed curvature in the Engel curves of figure 1.
In summary, these preliminary data investigations suggest two distinct features of our expenditure data. For certain goods such as food, the linear logarithmic expenditure share model provides a robust description of behavior. Second, for certain other goods the linear model needs to be supple- mented by some other, possibly quadratic, term in log expenditure.
111. Utility Maximization and the Shape of Engel Curves
Over time and in the presence of indirect tax changes, relative prices as well as real incomes change. The analysis of these changes requires a demand system that is able to accommodate the Engel curve shapes uncovered in the previous section while allowing for data-coherent relative price responses. The evidence of section I1 suggests Engel curves that have leading terms linear in the logarithm of income and additional higher order terms in income. Our aim in this section is to consider utility functions that are consistent with such Engel curves. In the empirical estima- tion of section IV we check whether the resulting demand system is consistent with the price, income, and expenditure share data.
Demands having expenditure shares that are linear in log total expenditure (hereafter referred to as In m) alone have
been called Price-Independent Generalized Logarithmic (PIGLOG) by Muellbauer (1976), and arise from indirect utility functions that are themselves linear in In m. Examples of PIGLOG demands include Deaton and Muellbauer's (1980) A1 demand system and Jorgenson et al.'s (1982) translog model. Since the empirical Engel curves for some goods (i.e., food) look linear in In m, we consider generaliza- tions of PIGLOG preferences.
A. Extensions of PIGLOG Preferences
The simplest general form of demands consistent with the empirical evidence on Engel curves is
for goods i = 1, . . . ,N, where p is the N-vector of prices, x = mla(p), and A,(p), Bi(p), Ci(p), and g(x) are differen- tiable functions.
Equation (1) says that expenditure shares are linear in log income and in another smooth function of income, g(x). The Ci(p)g(x) term allows for the nonlinearities apparent in figure 1 for clothing and alcohol, whereas the Engel curves that look like PIGLOG have C,(p) near zero.
Lewbel(199 1) defines the rank of any demand system to be the dimension of the space spanned by its Engel curves. The rank of equation system (1) equals the rank of the N X 3 matrix of Engel curve coefficients, having rows [Ai(p):Bi (p):Ci(p)] for goods i . This matrix has three columns, so 3 is the maximum possible rank of equation system (1). Exactly aggregable demand systems are defined as demand systems that are linear in functions of m. Gorman (1981) proved that the maximum possible rank of any exactly aggregable de- mand system (with any number of terms) is 3. The empirical evidence on Engel curves indicates that observed demands are rank 3. These theoretical and empirical results together suggest that there would be little or no gain in adding additional terms of the form Di(p)h(x) to equation (1).

532 THE REVIEW OF ECONOMICS AND STATISTICS
FOR LINEAR CI'RVES:FIGURE34.-ROBUST TESTING ENGEL ALCOHOLSHARES term h is a difere~ztiable, homogeneous function of degree zero of prices p.
For a proof see appendix A.
Notice that when A(p) is independent of prices, the indirect utility function reduces to a form observationally equivalent to the PIGLOG class, which includes the A1 model and the translog model of Jorgenson et al. By Roy's identity the budget shares are given by
alna(p> a h b ( p ) ax 1 -+- ( lnx)+ -- (Inx)' ,,' =* (4)sf -Kernel I a h p , a h p , P, NP) a?A } - - Polynomial \ i
0 I which are quadratic in In x = In m - In a(p) .It can be seen 7 3 5 3 8 4 0 4 2 4 4 4 5 4 8 5 0 5 2 5 4 5 6 5 @ 6 0 6 2
that A, in equation (1 )corresponds to the ith In p deri~ativeLog Expenditure
of In a(p) ;similarly for B, and C,.This is precisely the Engel curve relationship fitted on the FES data in the previous section.
The empirical evidence on Engel curves appears to rule out condition (2) , since some goods. such as food, have budget shares nearly linear in In x whereas others display strong nonlinearities. Equation (2 ) would also require that the ratio of the coefficient on (In x)' to the coefficient on In x be the same for all goods, which is clearly violated by the estimates in table 2. As a result theorem 1 suggests that budget shares of the form of equation (4 ) should be considered.
Theorem 1 makes equation ( I ) demands satisfy homoge- neity and symmetry. Utility maximization also imposes inequality constraints on the functions comprising equations (2 ) and (3), resulting from concavity conditions. Our strat- egy will be to estimate the demand systems without impos- ing these inequality constraints and then check that our estimates of the required inequalities are in the range of our data.
COROLLARY Utility-derived demand systems in the form 1: of equation ( I ) can be constructedfor any regularjimction g(x), but all rank 3 exactly aggregable utility-derived dernand systems in the form of equation ( I ) have g(x) = (Inxj2.
To prove corollary 1, let G(x)= -J[xIn x + ,xg(x)]-' dx. Then the indirect utility function V = G(mla(p))+ b(p ) yields rank 2 demands in the form of equation ( I ) ,as can be verified directly using Roy's identity. This method can be used to construct rank 2 utility-derived equation (1) systems for any function g (subject only to restrictions required for cost function concavity and existence of the integral defining G, which is what is meant here by regularity). Given theorem 1, equations (3) and (4 ) prove the rank 3 case of corollary 1.
Corollary 1 shows that confining attention to exactly aggregable, utility-derived equation ( I ) forms does not by
FIGURE3~.-ROBUST TESTING ENGEL CLOTHINGFOR LINEAR CURVES: SHARES
-Kernel
Polynomialor - -- I 7 3 0 3 4 3 8 4 2 4 6 5 0 5 4 5 8 5 2 6 6
Log Expenditure
The following theorem characterizes demand systems that are consistent with equation ( 1 ) .
THEOREM All exactly aggregable demand systems in the I : ,form of equation ( I ) that are deri13ed from utility maximiza- tion either have
for some$4nction d(p) (so the rank is less than 3), or they are rank 3 quadratic logarithmic budget share systems having indirect utility functions of the fonn
where the term [In m - In a(p)]/b(p) is the indirect u t i l i ~ ,function of a PIGLOG demand systern (i.e., a systern with budget shares linear in log total expenditure), and the extra

533 QUADRATIC ENGEL CURVES AND CONSUMER DEMAND
itself force the quadratic logarithmic specification. It is the additional requirement that demands be rank 3 that forces g(x) to equal (In x ) ~ .
Since rank 3 forces g(x) = (ln x ) ~ , budget shares are quadratic in l n x = ln ln - In a(p) and therefore are quadratic in In m itself. Having proved this much, the actual characterization of rank 3 quadratic logarithmic demands given in equation (3) can be readily derived from analogous constructions in Howe et al. (1979) or van Daal and Merkies (1989). An additional contribution of theorem 1 is equation (2), which shows exactly how the coefficients collapse to rank 2 when the utility function does not have the quadratic logarithmic form of equation (3).
Fortunately every empirical Engel curve analyzed in section I1 does look either linear or quadratic in In x, and hence the observed Engel curves appear to be rank 3 and do not violate the restrictions required for utility maximization that are revealed in theorem 1.
The following corollary provides another surprising impli- cation of utility maximization that is revealed by theorem 1.
COROLLARY2: NO rank 3 exactly aggregable utility- derived equation system ( I ) exists that has both Bi(p) and C,(p) independent of prices.
To prove the corollary, for each commodity i, set the expressions for Bi(p) and Ci(p) implied by equation (4) equal to constants. The only solution to the resulting expressions for b(p) and h(p) are b(p) = IIpBi and X(p) proportional to b(p), which makes equation (2) hold and therefore causes the system to collapse to rank 2.
The A1 demand system has the form of equation (I), with each Bi constant (that is, independent of prices) and every C, = 0. The natural extension of the A1 system would be to let both Bi and C, be constants, with Ci nonzero for commodities being nonlinear in x budget shares, such as alcohol and clothing. For example, Blundell et al. (1993) obtain good fits estimating models in the form of equation (I), with Bi and Ci constant. They take Ai and Bi to be of the A1 system form, that is,
L
wi = C X ~+ y: In p + 2 Pij(ln x); + error,. ( 5 ) j=1
Unfortunately, by corollary 2, Bi and Ci cannot both be constants for all commodities i while maintaining rank 3, as is empirically required. For demand systems in the form of equation (3,theorem 1 and corollary 2 show that utility maximization rather unexpectedly forces
wi = cxi + y: In p + pil[ln x + ~ ( l nx ) ~ ]+ errori (6)
where E is some constant, requiring that all Engel curves have the same quadratic in In x expenditure shares. Figure 1 alone clearly rules out equation (6), so any model that is both
theoretically and empirically acceptable must have quadratic coefficients that vary with prices. The QUAIDS specifica- tion retains the overall form of the quadratic model in Blundell et al. (1993) but introduces this price dependence in a parsimonious way.
IV. Estimation of Income and Relative Price Effects
A. A Quadratic Almost Ideal Demand System
The analysis of the last two sections suggests that the quadratic demand systems in equation (4) provide a data- coherent structure for consumer preferences in the FES data. To construct a simple quadratic logarithmic specification consistent with equation (3), we begin by considering Deaton and Muellbauer's A1 demand ~ y s t e m . ~ The A1 model has an indirect utility function given by equation (3), but with the X term set to zero. In particular, In a(p) has the translog form
and b(p) is the simple Cobb-Douglas price aggregator defined above.
The A1 model is popular in part became it has budget shares that, conditional on a(p), are linear in In p and In x, which simplifies estimation. However, the analysis in section I1 shows that the A1 system, being linear in In x and rank 2, requires generalization. The results of section I1 show that a demand model consistent with both the predictions of demand theory and our empirical evidence must be rank 3 and have the form of equations (1) and (3).
Our goal is to construct a system that is as similar as possible to the convenient A1 model while allowing for the more general Engel curve shapes discovered in section 11. To do so, we define the indirect utility in V by equation (3) with
Equations (3), (7), (8), and (9) together define what we call QUAIDS. By equation (4) the corresponding expenditure
We could equally well work from the translog model of Jorgenson et al. (1982).

534 THE REVIEW OF ECONOMICS AND STATISTICS
share equation system is
where the impact of demographic and other household characteristics could be allowed to enter all terms.6 The QUAIDS model has the income flexibility and rank sug- gested by the Engel curve analysis of the previous two sections. it has the same degree of price flexibility as the usual A1 and translog models, it is as close to linearity in parameters as theorem 1 will permit, it has the A1 model nested within it as a special case, and it has as few additional parameters over the A1 model as possible, given all these features.
To calculate QUAIDS model elasticities, differentiate equation (10) with respect to In m and In pj, respectively, to obtain
The budget elasticities are given by e , = yilwi + 1, and with a positive p and a negative h (as suggested in section I1 for clothing and alcohol), will be seen to be greater than unity at low levels of expenditure, eventually becoming less than unity as the total expenditure increases and the term in hi becomes more important. Such commodities therefore have the characteristics of luxuries at low levels of total expendi- ture and necessities at high levels.
The uncompensated price elasticities are given by et", p i j l ~ ~ i- aij, where Sij is the Kronecker delta. We use the Slutsky equation, e:j = e ; + e i q , to calculate the set of compensated elasticities e:, and assess the symmetry and negativity conditions by examining the matrix with elements wi [ e ; ] , which should be symmetric and negative semidefi- nite in the usual way.
B. Estimating Relative Price and Income Effects
To estimate this model we take a sample of households from the repeated cross sections of the U.K. FES for the period of 1970-1986, adopting the same sample selection as
Note that rebasing pnces implies a rescaling of the a, and y, parameters. The demand system and implied welfare measures are invariant to such rebaslng.
in section 11. The selected sample has 4785 observations over 68 quarterly price points, and later price data at the appropriate aggregation are unavailable. We consider the system defined above for the five goods analyzed in section I1 (food, fuel, clothing, alcohol, and other nondurable nonhousing expenditures), imposing homogeneity by ex-pressing all prices relative to the price of "other" goods.
To deal with the possibility of endogeneity, measurement error, and nonnormality of errors, a generalized method of moments (GMM) estimation procedure is used. The system is nonlinear and estimation follows two stages. In the first stage an iterated moment estimator is adopted, which exploits the conditional linearity of equation (10) given a(p) and b(p). That is, given a(p) and b(p), the system is linear in parameters, and this suggests a natural iterative procedure conditioning on an updated a(p) and b(p) at each i t e r a t i~n .~ This technique preserves the adding-up and invariance properties of the system. To derive the symmetry-restricted estimates, the optimum minimum distance estimator was used at the second stage (see Blundell (1988) and Browning and Meghir (1991) for a full description of this technique). Incidentally, if we were to consider a household in the base period when all relative prices are unity, their price index In [a(p)] would simply be equal to cue, and since we require real expenditure to be positive, then the minimum level of log real expenditure observed in the data places an upper bound on In [a(p,)] and therefore in the base period."
C. Empirical Results
Table 3 presents the symmetry-restricted parameter esti- mates for our preferred quadratic specification. In line with the evidence in section 111, we restrict the coeffi- cients on the quadratic terms for the food and fuel equations to be zero. The full unrestricted model estimates are presented in appendix B. Given the homogeneity of our sample, we choose to allow only a limited number of additional factors to influence preferences (i.e., age, seasonal dummies, and a time trend) through a,in equation (10). Households are chosen to be demographically homogeneous which, given the large samples at our disposal, seems a reasonable way to proceed.
Table 3 clearly shows the importance of quadratic terms in real expenditure for clothing and alcohol, as the nonparamet- ric analysis suggested. As we will use the A1 model for comparison in the welfare analysis that follows, we report estimates of the corresponding A1 specification in appendix B. The diagnostics suggest that higher order price terms are not required and also that linearity in In m for food and fuel cannot be rejected. Moreover, in this QUAIDS specification the symmetry restrictions, tested with a x 2 statistic, are not
The consistency of this procedure and its asymptotic efficiency properties are described in Blundell and Robin (1996).
Our choice of the parameter a. follows the original discussion in Deaton and Muellbauer (1980) and is chosen to be just below the lowest value of In rn in our data. To check that this did not affect our results. we also chose a grid of values.


536 THE REVIEW OF ECONOMICS AND STATISTICS
Log E x p e n d t u r e
for this reform, the A1 model ~~nderstatesthe welfare losses FIGURE4~-RESIT)VALANALYVSOF T H ~ .QU~DRATIC~ P E C I F ~ C A T ~ O NFOR
ALCOHOLS114RFS for the majority of the distribution and overstates the welfare losses for the richer (and the very poorest) households, a
FIGURE44.-A RESIDUALANALYSISOF THF.QUADRATIC~ P E C I F ~ C A T I O NFOR FIGURE5.-WELFARELOSS:QUAI MODEL,17.5%TAXON CLOTHING FOODSHARES
, I VI. Summary and Conclusions
-+ +
-
+ ++* + x + * -
t + + + +
+ +A++++++++< ' + <+$+***, + ' * #
++* *** $+,++;+3p+
++& ,::t + ,++
*+ + * I
+ +&.&$3+" $+4 FGt++
-*p r tL?*
2
* O , result that is consistent with the A1 model not allowing
, ' I1 This paper was motivated by the need to provide an - - - - - - - -.----------- accurate analysis of the welfare cost of indirect tax reform.
- - - - -Analyses of household budget surveys have pointed to more
- - - - -- , curvature in the Engel curve relationship than is permitted0
oI _ ,', by the standard Worlung-Leser form. Our aim was to
Y S
2 2-z-
2 5.
rn u 5 :-0 Q 'J.-
9.-u,
0
a
* 9 . , . . . . . . .
adequate curvature in the Engel curve for clothing. Indeed, looking at reforms to goods with linear Engel curves does not produce nearly such pronounced patterns.
0
2 0
-1 &-ovidea detailed assessment of this result and to consider
O 4 0 4 2 4 4 4.6 4.8 5.0 5.2 5.4 5.6 5.8 6.0
Log of Real Expendi ture
0
N-
.', . 1
I
94(3.4 ' 318 ' 4:2 ' 4:6 ' 5:0 ' 5 '4 ' 5:8 ' 6:2 ' 6i6 the appropriate form of preferences that support generaliza-
LO^ Expend i tu re tions in the shape for the Engel curve relationship. This is
7 3 . 4 3 8 4.2 4.6 5.0 5.4 5.8 6.2 6.6
\ _ _ - -'.- - _ _ - - - - - - - - - - - - _ - - _ - - -
!
TABLE4.-ESTIM,ZTEDD E M ~ N DELASTICITIES
Food Fuel Clothing Alcohol Other
Comnpmsafed
Food -0.7817 (0.15) 0.1068(0.06) 0.2919 (0.13) 0.2914(0.08) 0.0888 (0.1 1 ) Fuel 0.4653(0.29) -0.7669 (0.22) -0.4590 (0.29) 0.6330(0.19) 0.1274(0.29) Clothing 1,0423(0.41) -0.3805 (0.17) -0.9606 (0.42) 0.0571(0.23) 0.2419 (0.34) Alcohol 1.5341(0.42) 0.7588 (0.21) 0.0580(0.41) -1.6392(0.44) -0.7017 (0.59) Other 0.0490(0.06) 0.0163 (0.03) 0.0390(0.07) -0.0769 (0.06) -0.0277 (0.10)
,-- ----;-----_______
- - - - - - _
\
L'ncompeizsated
Food -0.9593 (0.16) 0.0657 (0.06) 0.2474 (0.13) 0.2641 (0.08) -0.1860 (0.121 Fuel 0.3130(0.31) -0.8040 (0.21) -0.4946 (0.29) 0.6087 (0.19) -0.0988 (0.31) Clothing 0.7129 (0.44) -0.4546 (0.17) - 1.0535 (0.41) -0.0075 (0.23) -0.3358 (0.39) Alcohol 1.1543(0.44) 0.6720 (0.21) -0.0441 (0.40) -1.7212(0.44) -1.3397 (0.64) Other -0.3621 (0.07) -0.0641 (0.03) -0.0620 (0.07) -0.1491 (0.05) -0.6831 (0.11)
4
m
/ I /
Budget Meat1 Slzarec
Food 0.5680(0.11) 0.2968 Fuel 0.4753(0.20) 0.0675 Clothing 1.1388(0.38) 0.0800 Alcohol 1.2786(0.38) 0.0549 Other 1.2605(0.09) 0.5007
,/ I
,,z.,'
Note: Standard errors are I n parenthesei

537 QUADRATIC ENGEL CURVES AND CONSUMER DEMAND
FIGURE6.-BIAS W WELFARE FROM USINGLOSS THE A1 MODEL
' 4 . 0 4.2 4.4 4.6 4.8 5.0 5.2 5.4 5.6 5.8 6.0
Log o f Real Expendi ture
shown to be restricted to a class of quadratic logarithmic models. Given the importance of such models in understand- ing the impact of indirect tax reform, we consider the significance of our results in measuring the distribution of welfare gains for an indirect tax reform for the United Kingdom.
It seems clear that we can reject the linear Working-Leser form for certain commodity groups in the U.K. FES, although it is equally clear that for certain items, in particular food expenditures, linearity is unlikely to be rejected. Moreover, kernel regression analysis suggests that share equations quadratic in the logarithm of total expendi- ture provide a sufficiently general approximation to the Engel relationship in the raw microdata. In addition, models that require a constant ratio of linear to quadratic expendi- ture terms across commodity groups were also ruled out by our preliminary analysis.
We derive the unique class of quadratic Engel curve preferences that satisfy integrability without the requirement of the constant-ratio restriction. These demands are rank 3, which is the maximum possible rank for any demand system that is linear in functions of income. Furthermore it was shown that the coefficients of the quadratic term in these demands must be price dependent. This class nests the A1 and the exactly aggregable translog models while allowing the flexibility of a rank 3 quadratic specification.
Using these results we specify the QUAIDS model, an empirical demand system that, with a minimum number of parameters and departures from linearity, possesses both price flexibility and the Engel curve shape observed in the data. The estimated model was found to produce a data- coherent and plausible description of consumer behavior from which we could calculate welfare measures associated with price and tax changes. These welfare measures show important divergences from similar measures calculated for a standard model that is linear in log expenditure, reflecting the importance of including quadratic expenditure terms to account for goods being luxuries at some income levels and necessities at others.
The use of semiparametric or nonparametric methods as an alternative solution to this problem will often be impracti- cal. Kernel-based methods are not amenable to having Slutsky symmetry imposed on them. Series-based semipara- metric models have numbers of parameters that increase explosively with the number of terms in the expansion, and restrictions on homogeneity and Slutsky symmetry prevent adding income parameters without also adding price param- eters. Finally, nonparametric analyses of Engel curves and of residuals from the parametric QUAIDS model indicate that the QUAIDS is adequate, so no additional semiparametric terms are required. However, if desired in contexts having substantially more than the usual amount of price variation, expansion terms could be appended to the QUAIDS specifi- cation.
Our results indicate that studies based on A1 or translog preferences will badly misspecify the distribution of welfare losses by failing to model Engel curvature correctly. The empirical findings on the shape of Engel curves also show that welfare calculations based on Engel or Rothbarth scales must be invalid, since such scales require that Engel curves be monotonic in utility, and hence in total expenditures. For example, many Rothbarth scales use expenditures on alco- hol or clothing to measure welfare. Our empirical findings indicate that rich or poor households alike may have equal expenditures or budget shares on these goods.
REFERENCES
Atkinson, A. B., J. Gomulka, and N. H. Stem, "Spending on Alcohol: Evidence from the Family Expenditure Survey 1970-1983," Eco-nomic Journal 100 (1990), 808-827.
Banks, J. W., R. W. Blundell, and A. Lewbel, "Tax Reform and Welfare Measurement: Do We Need Demand System Estimation?" Eco-nomic Journal 106 (1996), 1227-1241.
Bamett, W. A., and A. Jonas, "The Muntz-Szatz Demand System: An Application of a Globally Well Behaved Series Expansion," Economics Letters 11 (1983), 337-342.
Bierens, H. J., and H. A. Pott-Buter, "Specification of Household Engel Curves by Nonparametric Regression," Econometric Reviews 9 (1987), 123-184.
Blundell, R. W., "Consumer Behaviour: Theory and Empirical Evidence," Economic Journal 98 (1988), 16-65.
Blundell, R. W., P. Pashardes, and G. Weber, "What Do We Learn about Consumer Demand Patterns from Micro-Data?," American Eco- nomic Review 83 (1993), 570-597.
Blundell, R. W., and J. M. Robin, "An Iterated Moment Estimated for Conditionally Linear Demand Systems," Institute for Fiscal Stud- ies, Working Paper 96/10 (1996).
Browning, M. J., and C. Meghir, "The Effects of Male and Female Labour Supply on Commodity Demands," Econornetrica 59 (1991), 925- 951.
Cooper, R. J., and K. R. McLaren, "A System of Demand Equations Satisfying Effectively Global Regularity Conditions," this REVIEW 78 (May 1996), 359-364.
Cragg, J. G., and S. G. Donald, "Inferring the Rank of a Matrix," mimeo, University of British Columbia, Journal of Econometrics (1995).
Deaton, A. S., "A Reconsideration of the Empirical Implications of Additive Preferences," Economic Journal 84 (1974), 338-348.
Deaton, A. S., and J. Muellbauer, "An Almost Ideal Demand System," American Economic Review 70 (1980), 312-336.
"On Measuring Child Costs: With Applications to Poor Coun- tries," Journal of Political Economy 94 (1986), 720-744.
Duncan, A. S., and A. S. Jones, "NP-REG: An Interactive Package for Kernel Densitv Estimation and Non-Parametric Regression." IFS
u
Working pape; W92/07 (1992).

538
01
THE REVIEW OF ECONOMICS AND STATISTICS
Engel, E., "Die Lebenskosten belgischer Arbeiter-Familien friiher and Muellbauer, J., "Community Preferences and the Representative Con-jetzt," International Statistical Institute Bulletin 9 (1895), 1-74. sumer," Econometrica 44 (1976), 525-543.
Gill, L., and A. Lewbel, "Testing the Rank of Estimated Matrices with van Daal, J., and A. H. Q. M. Merkies, "A Note on the Quadratic Applications to Factor, State Space, and ARMA Models," Journal Expenditure System," Econometriccr 57 (1989), 1439-1443. of the American Statistical Association 87 (Sept. 1992), 766-776. Working, H., "Statistical Laws of Family Expenditure," Journal of the
Gallant, R. A,, and G. Souza, "On the Asymptotic Normality of Fourier American Statistical Association 38 (1943), 43-56. Flexible Form Estimates," Journal of Econometrics 30 (1991), 329-353.
Gorman, W. M., "Some Engel Curves," in The Theory and Measurement of Consumer Behaviour; Angus Deaton (ed.) (Cambridge, UK: APPENDIX ACambridge University Press, 198 1).
Hardle, W., Applied Nonparametric Regression (Cambridge, UK: Cam- bridge University Press, 1990).
Hldle , W., and M. Jerison, "The Evolution of Engel Curves over Time," Proof of Theorem 1discussion paper A-178, SFB 303, University of Bonn (1988). The demand system in equation ( 1 ) has three terms, so its maximum
Hausman, J. A,, W. K. Newey, and J. L. Powell, "Nonlinear Errors in rank is 3. If equation ( 1 ) has rank 1, it must be homothetic, so B,(p) = Variables: Estimation of Some Engel Curves," Journal of Economet- C , ( p )= 0. If equation ( 1 ) has rank 2, the indirect utility function must have rics 65 (1995), 205-233. the form V = h[ln b ( p ) ,lnx] with .u = mla(p) for some a ( p ) and b ( p )
Hildenbrand, W., Market Demand: Theory and Empirical Evidence (Princeton. NJ: Princeton Universitv Press. 1994).
(Gorman (1981)).By Roy's identity we can write
Holly, A,, "A Remark on Hausman's Specification Test," Econometrica 50 (1982), 749-759.
M , = H ( b ( p ) ,X) + ---Howe, H., R. A. Pollak, and T. J. Wales, "Theory and Time Series a l n p , a l n p , '
Estimation of the Quadratic Expenditure System," Econometrica (A 1 ) 47 (1979), 1231-1248. -[ahla In b ( p ) ]
Jorgenson, D. W., L. J. Lau, and T. M. Stoker, "The Transcendental where H = Logarithmic Model of Aggregate Consumer Behavior," in R. dhla In .u
Basmann and G. Rhodes (eds.), Advances in Econometrics, vol. 1 (Greenwich, Ct: JAI Press, 1982). Equation ( 1 ) can be written in the form of equation ( A . l ) if and only if
Leser, C. E. V., "Forms of Engel Functions," Econometrica 31 (1963), H(b, x ) = H , ( b ) + H2(b)I n s + H,(b)g(x), malung B, = H2(b)[aIn 694-703. bld In p,] and C, = H3(b)[dIn bla lnp,] , so C,IB, = H21H3 d ( p )Finally,
Lewbel, A,, "Full Rank Demand Systems," International Economic if equation ( 1 )has rank 3, then applying Lewbel's (1990)characterization Review 3 1 ( 1 990), 289-300. of full rank demand systems shows that the only rank 3 system that is linear
"The Rank of Demand Systems: Theory and Nonparametric in In m and any other function of In m is the quadratic logarithmic, which Estimation," Econometrica 59 (1991), 71 1-730. has the indirect utility function V = q{[Ol(p) for+ 0 ? ( p )In m]-' + o ~ ( ~ ) ] "Consistent Non-Parametric Hypothesis Tests with an Application some monotonic function q . The proof then follows immediately from
to Slutsky Symmetry," Journal of Econometrics 67 (1995), 379- equation ( A , ] ) ,which is from Muellbauer's (1976) characterization of 401. PIGLOG demands.
APPENDIX B
TABLEB.1 .-UXRESTRICTED ESTIMATESOF QUAI MODEL
Food Fuel Clothing Alcohol
INTERCEP 1.18634 (0.1073) 0.25747 (0.0426) -0.43553 (0.1049) -0.39579 (0.0708) PFOOD -0.20752 (0.0582) 0.00671 (0.023 1 ) 0.05660 (0.0569) 0.10548 (0.0384) PFUEL -0.05564 (0.0407) -0.00328 (0.0162) 0.01605 (0.0398) 0.06259 (0.0268) PCLOTH 0.20247 (0.0550) -0.03374 (0.0219) -0.04032 (0.0538) -0.05403 (0.0363) PALC 0.16169 (0.0395) 0.06263 (0.0157) -0.16410 (0.0386) -0.10969 (0.0261) TREND 0.00860 (0.0166) -0.00673 (0.0066) -0.00277 (0.0163) 0.01438 (0.0110) SPRlNG -0.00292 (0.0034) 0.00624 (0.0013) -0.00528 (0.0033) -0.00530 (0.0022) SUMMER -0.00215 (0.0034) -0.00245 (0.0014) -0.00822 (0.0034) -0.00292 (0.0023) AUTUMN -0.00725 (0.0036) -0.01027 (0.0014) 0.00171 (0.0035) -0.00215 (0.0023) AGE 0.00972 (0.0010) 0.00564 (0.0004) -0.00402 (0.0009) -0.00598 (0.0006) AGE2 -0.00055 (0.0009) -0.00165 (0.0004) 0.00246 (0.0009) 0.00062 (0.0006) ln x -0.25719 (0.0419) -0.03351 (0.0167) 0.19981 (0.0410) 0.16438 (0.0277) ln x2 0.01368 (0.0043) -0.00011 (0.0017) -0.01942 (0.0042) -0.01562 (0.0029)
-0.02795 (0.0067) -0.00698 (0.0027) 0.02765 (0.0066) -0.00930 (0.0044)
Notes: (1) Standard errors are In parenthese5 (2) Instruments In all equations were ape and ape quared of both adults. tenure. durable osnersh~p dumrnles. Interest rates. trend and hlpher order trend terms. ~moker and wh~te collar durnrnles. pnces (~ncludlng
durables and housing). normal household Income and Income quared, and lnterdctlons of prlces and Incomes
Food Fuel Clothing Alcohol
PFOOD -0.16030 (0.041) PFC'EL -0.01491 (0.018) 0.00445 (0.014) PCLOTH 0.15760 (0.036) -0.01626 (0.012) -0.11995 (0.035) PALC 0.14359 (0.022) 0.05485 (0.013) -0.09948 (0.020) -0.11498 (0.024) In x -0.22234 (0.036) -0.03948 (0.015) 0.21132 (0.033) 0.18011 (0.023) ln x? 0.01020 (0.005) -0.00058 (0.002) -0.02053 (0.003) -0.01719 (0.003)
h'ote. Standard errors are ~n parentheses

539 QUADRATIC ENGEL CURVES AND CONSUMER DEMAND
TABLEB.3.-UNRESTRICTED ESTIMATES FOR ALMOSTIDEALMODEL
Food Fuel Clothing Alcohol
NTERCEP PFOOD PFUEL PCLOTH PALC TREND SPRING SUMMER A UTUMN AGE AGE2 In x u1
Note: (1) Standard errors are in parentheses. (2) Parameters for "other goods" not reported.
TABLEB.4.-ELASTICITIESOF ALMOSTIDEALSYSTEM
Food Fuel Clothing Alcohol
Compensated
Food -0.5845 (0.12) 0.1392 (0.06) 0.1822 (0.11) 0.1507 (0.07) Fuel 0.6095 (0.26) -0.7507 (0.22) -0.4599 (0.25) 0.6064 (0.18) Clothing 0.6473 (0.39) -0.3703 (0.20) -1.2813 (0.40) -0.0643 (0.23) Alcohol 0.7730 (0.35) 0.7100 (0.21) -0.0931 (0.34) -1.6230 (0.39)
Uncompensated
Food -0.7620 (0.13) 0.0981 (0.06) 0.1405 (0.11) 0.1210 (0.07) Fuel 0.4596 (0.27) -0.7873 (0.22) -0.491 1 (0.24) 0.5830 (0.18) Clothing 0.3158 (0.42) -0.4449 (0.20) -1.3820 (0.39) -0.1319 (0.23) Alcohol 0.4142 (0.37) 0.6282 (0.21) -0.1970 (0.33) -1.6962 (0.38)
Budget
Food Fuel Clothing Alcohol
Notes: (1) Standdrd errors are in parentheses. (2) Parameters for "other goods" not reported

You have printed the following article:
Quadratic Engel Curves and Consumer DemandJames Banks; Richard Blundell; Arthur LewbelThe Review of Economics and Statistics, Vol. 79, No. 4. (Nov., 1997), pp. 527-539.Stable URL:
http://links.jstor.org/sici?sici=0034-6535%28199711%2979%3A4%3C527%3AQECACD%3E2.0.CO%3B2-Z
This article references the following linked citations. If you are trying to access articles from anoff-campus location, you may be required to first logon via your library web site to access JSTOR. Pleasevisit your library's website or contact a librarian to learn about options for remote access to JSTOR.
[Footnotes]
2 What do we Learn About Consumer Demand Patterns from Micro Data?Richard Blundell; Panos Pashardes; Guglielmo WeberThe American Economic Review, Vol. 83, No. 3. (Jun., 1993), pp. 570-597.Stable URL:
http://links.jstor.org/sici?sici=0002-8282%28199306%2983%3A3%3C570%3AWDWLAC%3E2.0.CO%3B2-9
8 An Almost Ideal Demand SystemAngus Deaton; John MuellbauerThe American Economic Review, Vol. 70, No. 3. (Jun., 1980), pp. 312-326.Stable URL:
http://links.jstor.org/sici?sici=0002-8282%28198006%2970%3A3%3C312%3AAAIDS%3E2.0.CO%3B2-Q
References
Spending on Alcohol: Evidence from the Family Expenditure Survey 1970-1983A. B. Atkinson; J. Gomulka; N. H. SternThe Economic Journal, Vol. 100, No. 402. (Sep., 1990), pp. 808-827.Stable URL:
http://links.jstor.org/sici?sici=0013-0133%28199009%29100%3A402%3C808%3ASOAEFT%3E2.0.CO%3B2-I
http://www.jstor.org
LINKED CITATIONS- Page 1 of 4 -
NOTE: The reference numbering from the original has been maintained in this citation list.

Tax Reform and Welfare Measurement: Do We Need Demand System Estimation?James Banks; Richard Blundell; Arthur LewbelThe Economic Journal, Vol. 106, No. 438. (Sep., 1996), pp. 1227-1241.Stable URL:
http://links.jstor.org/sici?sici=0013-0133%28199609%29106%3A438%3C1227%3ATRAWMD%3E2.0.CO%3B2-9
Consumer Behaviour: Theory and Empirical Evidence--A SurveyRichard BlundellThe Economic Journal, Vol. 98, No. 389. (Mar., 1988), pp. 16-65.Stable URL:
http://links.jstor.org/sici?sici=0013-0133%28198803%2998%3A389%3C16%3ACBTAEE%3E2.0.CO%3B2-9
What do we Learn About Consumer Demand Patterns from Micro Data?Richard Blundell; Panos Pashardes; Guglielmo WeberThe American Economic Review, Vol. 83, No. 3. (Jun., 1993), pp. 570-597.Stable URL:
http://links.jstor.org/sici?sici=0002-8282%28199306%2983%3A3%3C570%3AWDWLAC%3E2.0.CO%3B2-9
The Effects of Male and Female Labor Supply on Commodity DemandsMartin Browning; Costas MeghirEconometrica, Vol. 59, No. 4. (Jul., 1991), pp. 925-951.Stable URL:
http://links.jstor.org/sici?sici=0012-9682%28199107%2959%3A4%3C925%3ATEOMAF%3E2.0.CO%3B2-8
Review: [Untitled]Reviewed Work(s):
Permanent Income, Wealth, and Consumption. by Thomas MayerAngus DeatonThe Economic Journal, Vol. 84, No. 333. (Mar., 1974), pp. 200-202.Stable URL:
http://links.jstor.org/sici?sici=0013-0133%28197403%2984%3A333%3C200%3APIWAC%3E2.0.CO%3B2-F
An Almost Ideal Demand SystemAngus Deaton; John MuellbauerThe American Economic Review, Vol. 70, No. 3. (Jun., 1980), pp. 312-326.Stable URL:
http://links.jstor.org/sici?sici=0002-8282%28198006%2970%3A3%3C312%3AAAIDS%3E2.0.CO%3B2-Q
http://www.jstor.org
LINKED CITATIONS- Page 2 of 4 -
NOTE: The reference numbering from the original has been maintained in this citation list.

On Measuring Child Costs: With Applications to Poor CountriesAngus S. Deaton; John MuellbauerThe Journal of Political Economy, Vol. 94, No. 4. (Aug., 1986), pp. 720-744.Stable URL:
http://links.jstor.org/sici?sici=0022-3808%28198608%2994%3A4%3C720%3AOMCCWA%3E2.0.CO%3B2-3
Testing the Rank and Definiteness of Estimated Matrices With Applications to Factor,State-Space and ARMA ModelsLen Gill; Arthur LewbelJournal of the American Statistical Association, Vol. 87, No. 419. (Sep., 1992), pp. 766-776.Stable URL:
http://links.jstor.org/sici?sici=0162-1459%28199209%2987%3A419%3C766%3ATTRADO%3E2.0.CO%3B2-L
A Remark on Hausman's Specification TestAlberto HollyEconometrica, Vol. 50, No. 3. (May, 1982), pp. 749-759.Stable URL:
http://links.jstor.org/sici?sici=0012-9682%28198205%2950%3A3%3C749%3AAROHST%3E2.0.CO%3B2-N
Theory and Time Series Estimation of the Quadratic Expenditure SystemHoward Howe; Robert A. Pollak; Terence J. WalesEconometrica, Vol. 47, No. 5. (Sep., 1979), pp. 1231-1247.Stable URL:
http://links.jstor.org/sici?sici=0012-9682%28197909%2947%3A5%3C1231%3ATATSEO%3E2.0.CO%3B2-O
Forms of Engel FunctionsC. E. V. LeserEconometrica, Vol. 31, No. 4. (Oct., 1963), pp. 694-703.Stable URL:
http://links.jstor.org/sici?sici=0012-9682%28196310%2931%3A4%3C694%3AFOEF%3E2.0.CO%3B2-I
Full Rank Demand SystemsArthur LewbelInternational Economic Review, Vol. 31, No. 2. (May, 1990), pp. 289-300.Stable URL:
http://links.jstor.org/sici?sici=0020-6598%28199005%2931%3A2%3C289%3AFRDS%3E2.0.CO%3B2-A
http://www.jstor.org
LINKED CITATIONS- Page 3 of 4 -
NOTE: The reference numbering from the original has been maintained in this citation list.

The Rank of Demand Systems: Theory and Nonparametric EstimationArthur LewbelEconometrica, Vol. 59, No. 3. (May, 1991), pp. 711-730.Stable URL:
http://links.jstor.org/sici?sici=0012-9682%28199105%2959%3A3%3C711%3ATRODST%3E2.0.CO%3B2-Q
Community Preferences and the Representative ConsumerJohn MuellbauerEconometrica, Vol. 44, No. 5. (Sep., 1976), pp. 979-999.Stable URL:
http://links.jstor.org/sici?sici=0012-9682%28197609%2944%3A5%3C979%3ACPATRC%3E2.0.CO%3B2-K
A Note on the Quadratic Expenditure ModelJan Van Daal; Arnold H. Q. M. MerkiesEconometrica, Vol. 57, No. 6. (Nov., 1989), pp. 1439-1443.Stable URL:
http://links.jstor.org/sici?sici=0012-9682%28198911%2957%3A6%3C1439%3AANOTQE%3E2.0.CO%3B2-C
Statistical Laws of Family ExpenditureHolbrook WorkingJournal of the American Statistical Association, Vol. 38, No. 221. (Mar., 1943), pp. 43-56.Stable URL:
http://links.jstor.org/sici?sici=0162-1459%28194303%2938%3A221%3C43%3ASLOFE%3E2.0.CO%3B2-S
http://www.jstor.org
LINKED CITATIONS- Page 4 of 4 -
NOTE: The reference numbering from the original has been maintained in this citation list.