QTMD Pre-Session Assignment
12
Pre-Session Assignment Quantitative Techniques for Managerial Decisions Question 1: Represent each of the data observation graphically and analyze the outputs. Solution: Here, I have presented the data collected from my QT survey in a pie-chart as well as a bar graph depending on the varied situations. A graphic representation of each set of data and its analysis is presented below: 1. Academic Background The academic background of my MBA classmates is highly inclined towards being BBA/BBS, i.e. core management. It covers 53% of the data. Tentatively, among 36 students, around 19 have come from a BBA or BBS background likewise. Similarly, following BBA is BE (Engineering) with 22%, which covers around 8 students from 36. Around 11% students have come from B.Sc. background. Few are from BBIS and exactly 3% students, i.e. 1 out of 36 are from BCIS, BIM and BSW. 53% 22% 11% 3% 3% 5% 3% BBA/BBS BE B.Sc. BCIS BIM BBIS BSW
Transcript of QTMD Pre-Session Assignment

8/12/2019 QTMD Pre-Session Assignment
http://slidepdf.com/reader/full/qtmd-pre-session-assignment 1/12
Pre-Session Assignment
Quantitative Techniques for Managerial Decisions
Question 1:
Represent each of the data observation graphically and analyze the outputs.
Solution:
Here, I have presented the data collected from my QT survey in a pie-chart as well as a bar graph
depending on the varied situations.
A graphic representation of each set of data and its analysis is presented below:
1. Academic Background
The academic background of my MBA classmates is highly inclined towards being
BBA/BBS, i.e. core management. It covers 53% of the data. Tentatively, among 36
students, around 19 have come from a BBA or BBS background likewise. Similarly,
following BBA is BE (Engineering) with 22%, which covers around 8 students from 36.
Around 11% students have come from B.Sc. background. Few are from BBIS and exactly
3% students, i.e. 1 out of 36 are from BCIS, BIM and BSW.
53%
22%
11%
3%3%
5%
3%
BBA/BBS
BE
B.Sc.
BCIS
BIM
BBIS
BSW
8/12/2019 QTMD Pre-Session Assignment
http://slidepdf.com/reader/full/qtmd-pre-session-assignment 2/12
From the observation, we can hence conclude that there is a majority of BBA and BBS
students in MBA I term.
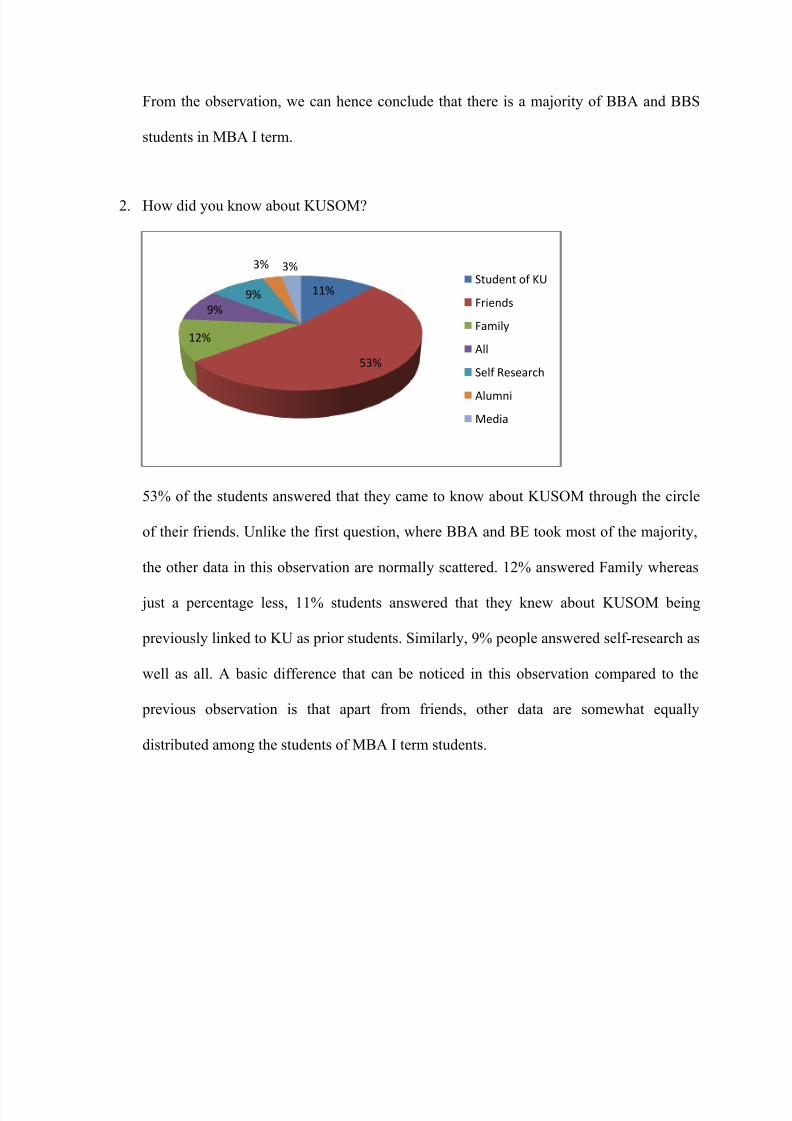
2. How did you know about KUSOM?
53% of the students answered that they came to know about KUSOM through the circle
of their friends. Unlike the first question, where BBA and BE took most of the majority,
the other data in this observation are normally scattered. 12% answered Family whereas
just a percentage less, 11% students answered that they knew about KUSOM being
previously linked to KU as prior students. Similarly, 9% people answered self-research as
well as all. A basic difference that can be noticed in this observation compared to the
previous observation is that apart from friends, other data are somewhat equally
distributed among the students of MBA I term students.
11%
53%
12%
9%
9%
3% 3%Student of KU
Friends
Family
All
Self Research
Alumni
Media

8/12/2019 QTMD Pre-Session Assignment
http://slidepdf.com/reader/full/qtmd-pre-session-assignment 3/12
3. Career after KUSOM?
Here, I have presented two charts for the question above as different people had different
choice of types of managers they wanted to be. The first pie chart tells us that around
40% of the students want to be a manager(irrespective of the type) after completing
graduation at KUSOM. Later, through the second bar chart, we can see that among the
40%, 6 of the students aim to be a project manager, 4 to be a professional manager,
31%
6%
40%
14%9% Enterpreneur
Consultant
Manager
Banker
Business
6
4
2
1 1
0
1
2
3
4
5
6
7
Project
Manager
Professional
Manager
Operations
Manager
Corporate
Manager
IT Manager

8/12/2019 QTMD Pre-Session Assignment
http://slidepdf.com/reader/full/qtmd-pre-session-assignment 4/12
2- operations manager and 1 student each corporate and IT manager. Similarly, just
slightly less percentage of students, i.e. 31% wants to be an entrepreneur. Other career
choices are slight less that these two. They are 14% Banker, 9% Business and 6%
Consultant.
4. Your expectation in career goal
This type of distribution is usually called a discrete distribution. In this type, a group of
data is taken instead of only one data. When the range of distribution is high and exact
values are not given, this type of distribution is taken. In the above distribution, around
46% students have 80%-90% expectations goal. This is the data with highest amount of
entries.37% answered 70%-80% while very few, i.e. 3% students have expectations
below 70% and above 100%. Hence the average expectation lies between 80%-90%,
which I feel is a good sign.
3%
37%
46%
11%
3%
Below 70%
70%-80%
80%-90%
90%-100%
Above 100%
8/12/2019 QTMD Pre-Session Assignment
http://slidepdf.com/reader/full/qtmd-pre-session-assignment 5/12
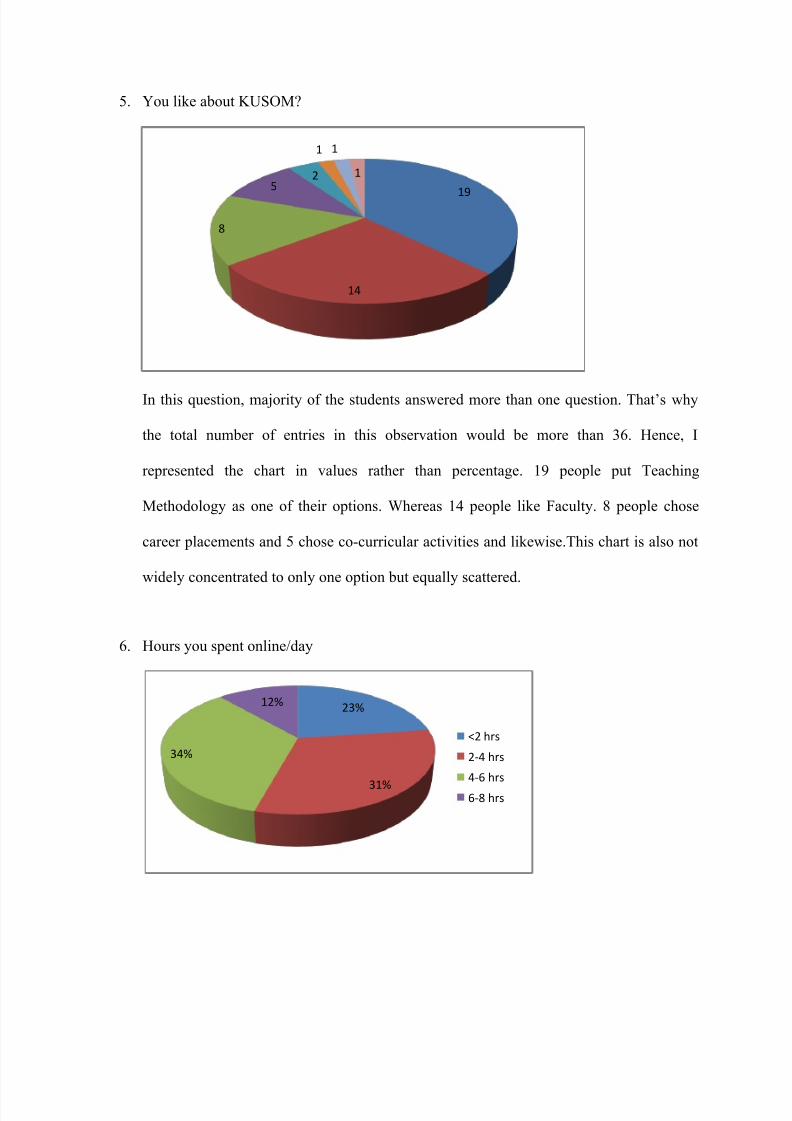
5. You like about KUSOM?
In this question, majority of the students answered more than one question. That’s why
the total number of entries in this observation would be more than 36. Hence, I
represented the chart in values rather than percentage. 19 people put Teaching
Methodology as one of their options. Whereas 14 people like Faculty. 8 people chose
career placements and 5 chose co-curricular activities and likewise.This chart is also not
widely concentrated to only one option but equally scattered.
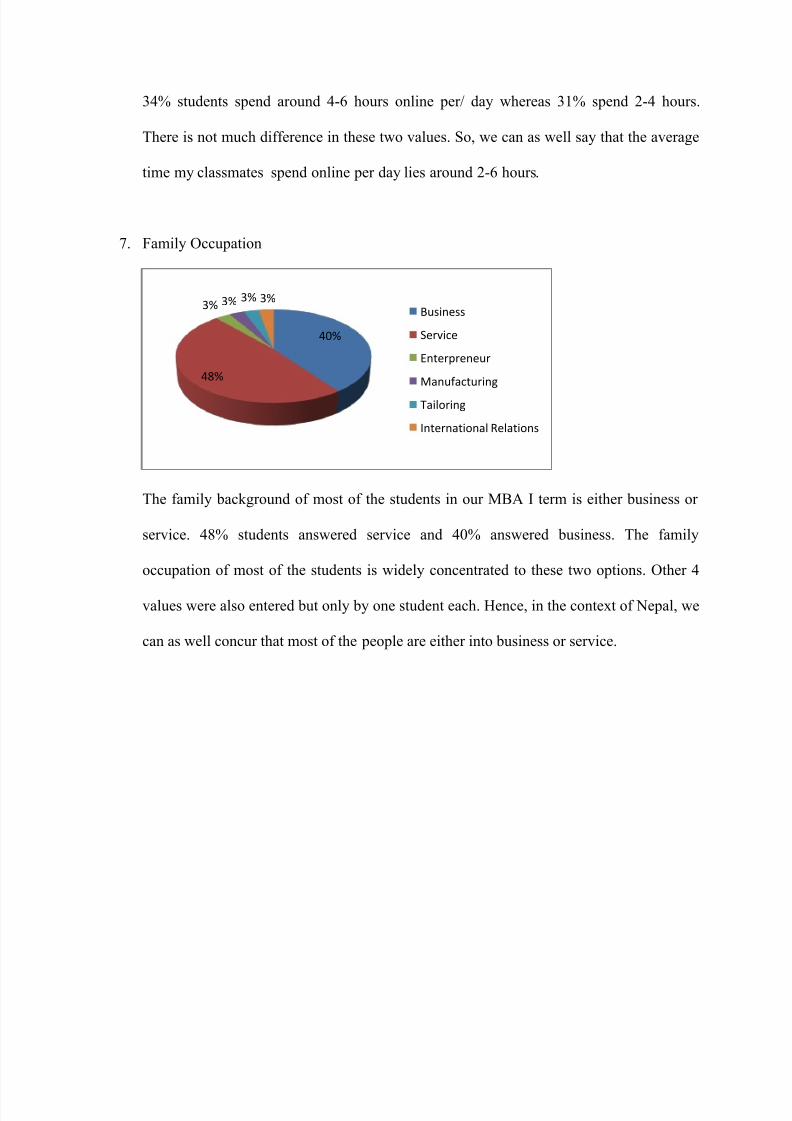
6. Hours you spent online/day
19
14
8
52
1 1
1
23%
31%
34%
12%
<2 hrs
2-4 hrs
4-6 hrs
6-8 hrs
8/12/2019 QTMD Pre-Session Assignment
http://slidepdf.com/reader/full/qtmd-pre-session-assignment 6/12
34% students spend around 4-6 hours online per/ day whereas 31% spend 2-4 hours.
There is not much difference in these two values. So, we can as well say that the average
time my classmates spend online per day lies around 2-6 hours.
7. Family Occupation
The family background of most of the students in our MBA I term is either business or
service. 48% students answered service and 40% answered business. The family
occupation of most of the students is widely concentrated to these two options. Other 4
values were also entered but only by one student each. Hence, in the context of Nepal, we
can as well concur that most of the people are either into business or service.
40%
48%
3% 3% 3% 3%Business
Service
Enterpreneur
Manufacturing
Tailoring
International Relations
8/12/2019 QTMD Pre-Session Assignment
http://slidepdf.com/reader/full/qtmd-pre-session-assignment 7/12
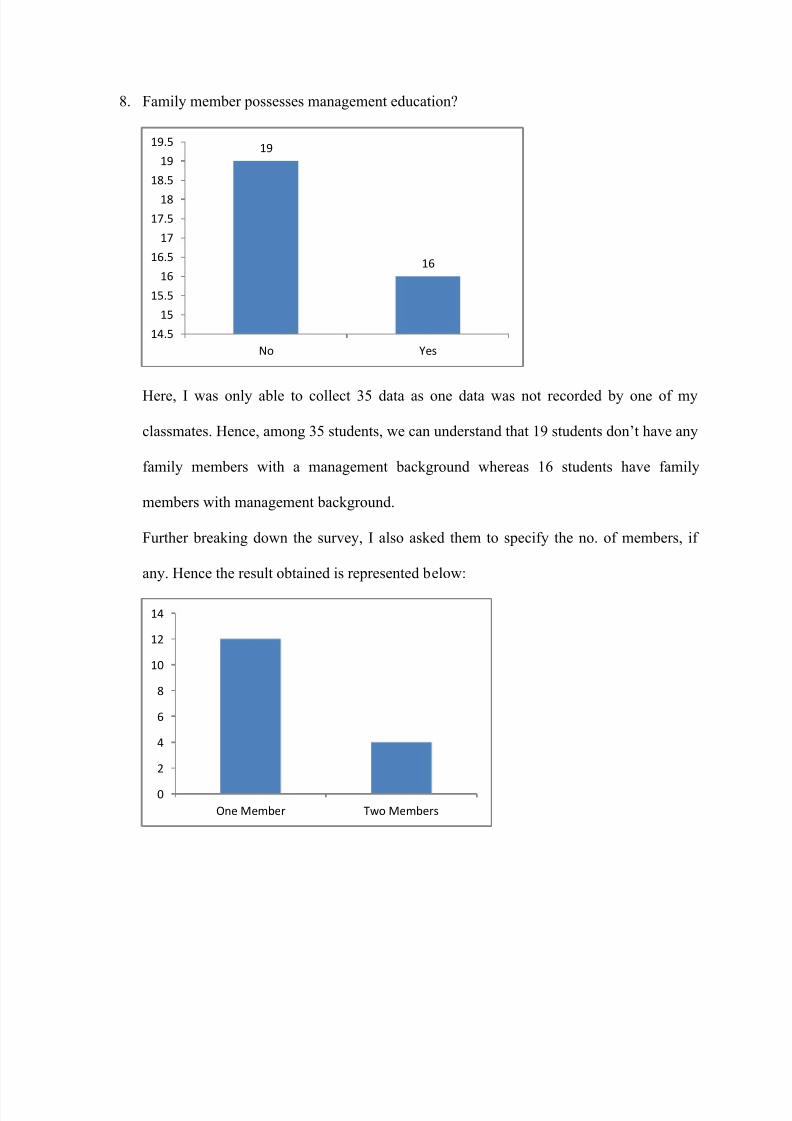
8. Family member possesses management education?
Here, I was only able to collect 35 data as one data was not recorded by one of my
classmates. Hence, among 35 students, we can understand that 19 students don’t have any
family members with a management background whereas 16 students have family
members with management background.
Further breaking down the survey, I also asked them to specify the no. of members, if
any. Hence the result obtained is represented below:
19
16
14.5
15
15.5
16
16.5
17
17.5
18
18.5
19
19.5
No Yes
0
2
4
6
8
10
12
14
One Member Two Members
8/12/2019 QTMD Pre-Session Assignment
http://slidepdf.com/reader/full/qtmd-pre-session-assignment 8/12
Hence, most of the students don’t have family member with management background
and among those who have, most of them have one member with management
background.
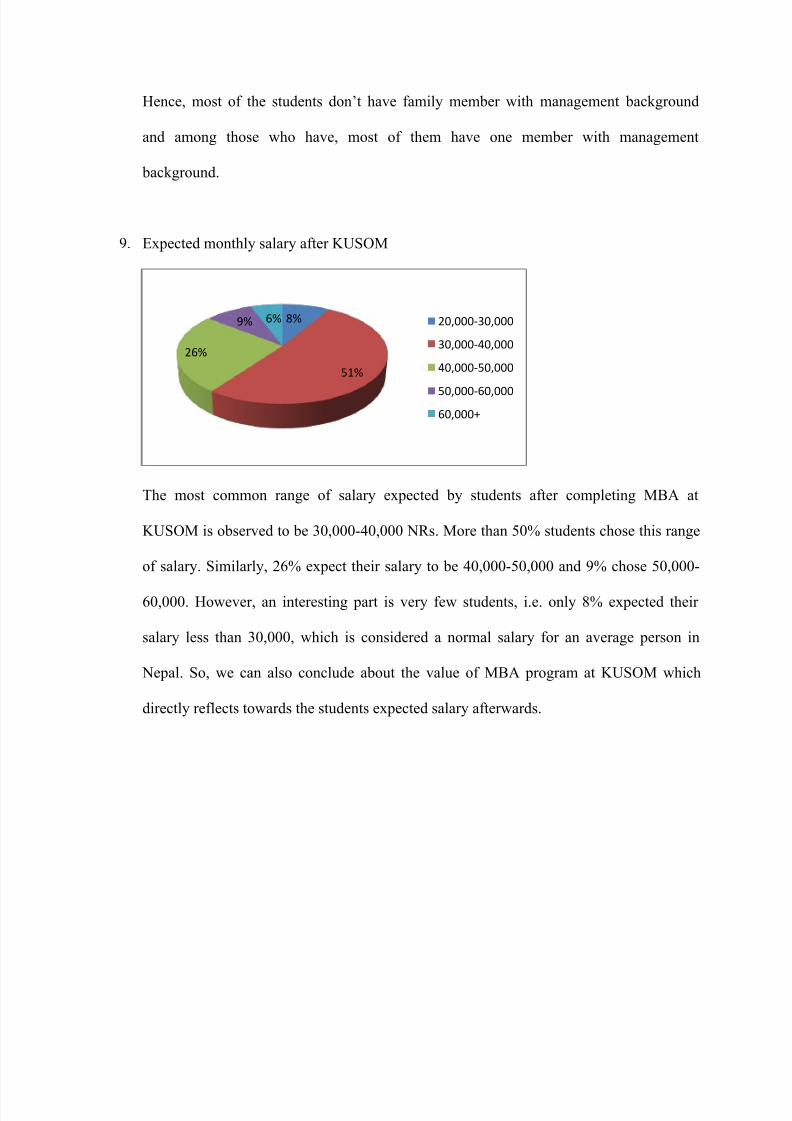
9. Expected monthly salary after KUSOM
The most common range of salary expected by students after completing MBA at
KUSOM is observed to be 30,000-40,000 NRs. More than 50% students chose this range
of salary. Similarly, 26% expect their salary to be 40,000-50,000 and 9% chose 50,000-
60,000. However, an interesting part is very few students, i.e. only 8% expected their
salary less than 30,000, which is considered a normal salary for an average person in
Nepal. So, we can also conclude about the value of MBA program at KUSOM which
directly reflects towards the students expected salary afterwards.
8%
51%
26%
9% 6% 20,000-30,000
30,000-40,000
40,000-50,000
50,000-60,000
60,000+
8/12/2019 QTMD Pre-Session Assignment
http://slidepdf.com/reader/full/qtmd-pre-session-assignment 9/12
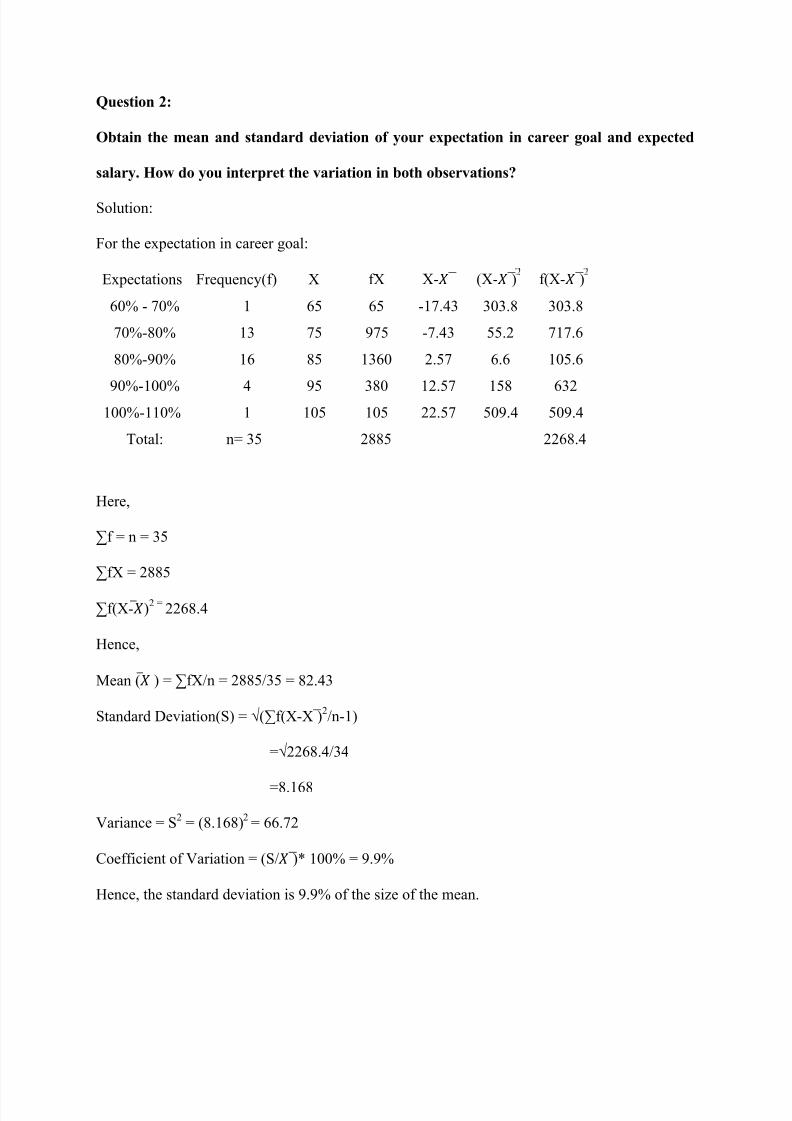
Question 2:
Obtain the mean and standard deviation of your expectation in career goal and expected
salary. How do you interpret the variation in both observations?
Solution:
For the expectation in career goal:
Expectations Frequency(f) X fX X- (X- f(X-
60% - 70% 1 65 65 -17.43 303.8 303.8
70%-80% 13 75 975 -7.43 55.2 717.6
80%-90% 16 85 1360 2.57 6.6 105.6
90%-100% 4 95 380 12.57 158 632100%-110% 1 105 105 22.57 509.4 509.4
Total: n= 35 2885 2268.4
Here,
∑f = n = 35
∑fX = 2885
∑f(X- ̅)2 =
2268.4
Hence,
Mean ( ̅ = ∑fX/n = 2885/35 = 82.43
tandard eviation( = (∑f(X-X )2/n-1)
=2268.4/34
=8.168
Variance = S2 = (8.168)
2= 66.72
Coefficient of Variation = (S/ 100 = 9.9
Hence, the standard deviation is 9.9% of the size of the mean.

8/12/2019 QTMD Pre-Session Assignment
http://slidepdf.com/reader/full/qtmd-pre-session-assignment 10/12
For the Expected Salary:
Expected
SalaryFrequency(f)
X(in
thousands)fX X- (X- 2
f(X- 2
20,000-30,000 3 25,000 75000 -15,143 229306209 687918626.9
30,000-40,000 18 35,000 630000 -5,143 26449009 476082161.6
40,000-50,000 9 45,000 405000 4,857 23591809 212326280.8
50,000-60,000 3 55,000 165000 14,857 220734609 662203826.9
60,000-70,000 2 65,000 130000 24,857 617877409 1235754818
Total: 35 1405000 3274285714
Here,
∑f = n = 35
∑fX = 1405000
∑f(X- ̅)2 =
3274285714
Hence,
= ∑fX/n = 1405000/35 = 40142.86
tandard eviation( = (∑f(X-X )2/n-1)
= 3274285714/34
= 9813.38
Variance = S2 = 96302521
Coefficient of Variation = (S/
100 = 24.4
Hence, standard deviation is 24.4% of the size of the mean.

8/12/2019 QTMD Pre-Session Assignment
http://slidepdf.com/reader/full/qtmd-pre-session-assignment 11/12
Now, comparing both expectation goal and expected salary, we can hence conclude that relative
to the mean, the expected salary of the students at MBA I term is much more variable than the
expectations in career goal.
Question 3:
What is the probability of getting monthly salary Rs.35000 or more after KUSOM?
Based on my observation, 22 out of 35 people have recorded their expected salary to be
Rs.35000 or more after KUSOM.
Hence the probability is (Number of occurrences /Total no. of events)
Probability = 22/35 = 0.629
Question 4:
What is the probability of your expectation lies between 35% - 55%?
None of the data recorded any expectation below 60%. Hence, the probability is 0.

8/12/2019 QTMD Pre-Session Assignment
http://slidepdf.com/reader/full/qtmd-pre-session-assignment 12/12
Question 5:
Based on the observation, analysis and interpretation of the above survey, what do you
suggest KUSOM management as well as the policy maker.
If I am to suggest KUSOM management on making some of the new policies and bringing
changes in the existing one based upon my analysis, here are the few points I would like to
suggest:
1. The students at KUSOM come from a varied background. But still the ratio of management
students to non-management students is very high. This may be due to various reasons. One of
them might be the lack of knowledge about the course structure and the scope it provides. So, to
keep variations of all backgrounds likewise, some workshops can be arranged for non-
management students about the MBA course at KUSOM so that students would know more
about it before applying.
2. Likewise, very few students, only 3-4 in my observation had said that they knew about KUSOM
from the media. So, more media exposure can be included to give students knowledge about
KUSOM MBA.
3. As most of the students aspire to be managers, management workshops can be organized.
4. The students were fairly distributed towards their likes about KUSOM. However, facilities and
learning environment received very few preferences. So, we can work towards developing these
structures as well.