QSS DRAFT 2-3 6PM - Cigna · Quarterly Results 4Q09 4Q08 3Q09 4Q09 4Q08 3Q09 4Q09 4Q08 3Q09 4Q09...
20
CIGNA Corporation Quarterly Statistical Supplement December 31, 2009 This document is dated February 4, 2010. The data contained in this document may not be accurate after such date and CIGNA does not undertake to update or keep it accurate after such date.
Transcript of QSS DRAFT 2-3 6PM - Cigna · Quarterly Results 4Q09 4Q08 3Q09 4Q09 4Q08 3Q09 4Q09 4Q08 3Q09 4Q09...

CIGNA Corporation
Quarterly Statistical Supplement December 31, 2009
This document is dated February 4, 2010. The data contained in this document may not be accurate after such date and CIGNA does not undertake to update or
keep it accurate after such date.
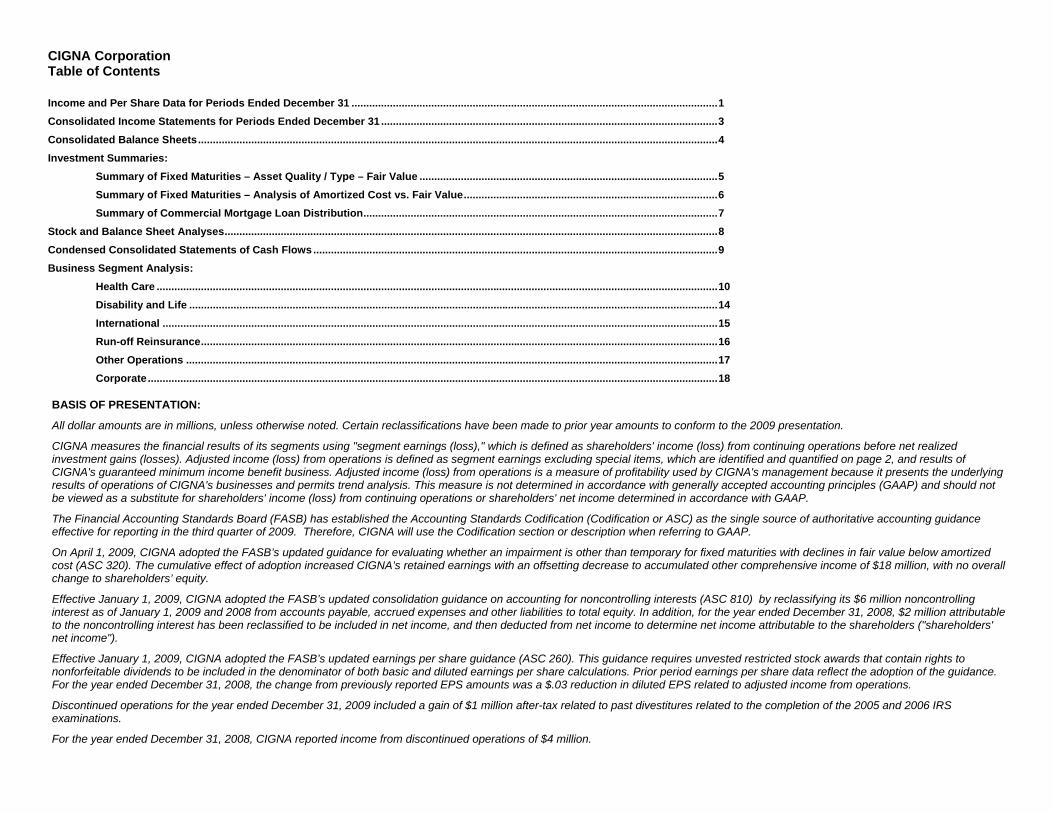
CIGNA Corporation Table of Contents Income and Per Share Data for Periods Ended December 31 ............................................................................................................................1 Consolidated Income Statements for Periods Ended December 31 ..................................................................................................................3 Consolidated Balance Sheets................................................................................................................................................................................4 Investment Summaries: Summary of Fixed Maturities – Asset Quality / Type – Fair Value .....................................................................................................5 Summary of Fixed Maturities – Analysis of Amortized Cost vs. Fair Value......................................................................................6 Summary of Commercial Mortgage Loan Distribution........................................................................................................................7 Stock and Balance Sheet Analyses.......................................................................................................................................................................8 Condensed Consolidated Statements of Cash Flows.........................................................................................................................................9 Business Segment Analysis: Health Care ..............................................................................................................................................................................................10 Disability and Life ...................................................................................................................................................................................14 International ............................................................................................................................................................................................15 Run-off Reinsurance...............................................................................................................................................................................16 Other Operations ....................................................................................................................................................................................17 Corporate.................................................................................................................................................................................................18
BASIS OF PRESENTATION:
All dollar amounts are in millions, unless otherwise noted. Certain reclassifications have been made to prior year amounts to conform to the 2009 presentation.
CIGNA measures the financial results of its segments using "segment earnings (loss)," which is defined as shareholders' income (loss) from continuing operations before net realized investment gains (losses). Adjusted income (loss) from operations is defined as segment earnings excluding special items, which are identified and quantified on page 2, and results of CIGNA's guaranteed minimum income benefit business. Adjusted income (loss) from operations is a measure of profitability used by CIGNA's management because it presents the underlying results of operations of CIGNA's businesses and permits trend analysis. This measure is not determined in accordance with generally accepted accounting principles (GAAP) and should not be viewed as a substitute for shareholders' income (loss) from continuing operations or shareholders' net income determined in accordance with GAAP.
The Financial Accounting Standards Board (FASB) has established the Accounting Standards Codification (Codification or ASC) as the single source of authoritative accounting guidance effective for reporting in the third quarter of 2009. Therefore, CIGNA will use the Codification section or description when referring to GAAP.
On April 1, 2009, CIGNA adopted the FASB’s updated guidance for evaluating whether an impairment is other than temporary for fixed maturities with declines in fair value below amortized cost (ASC 320). The cumulative effect of adoption increased CIGNA’s retained earnings with an offsetting decrease to accumulated other comprehensive income of $18 million, with no overall change to shareholders’ equity.
Effective January 1, 2009, CIGNA adopted the FASB’s updated consolidation guidance on accounting for noncontrolling interests (ASC 810) by reclassifying its $6 million noncontrolling interest as of January 1, 2009 and 2008 from accounts payable, accrued expenses and other liabilities to total equity. In addition, for the year ended December 31, 2008, $2 million attributable to the noncontrolling interest has been reclassified to be included in net income, and then deducted from net income to determine net income attributable to the shareholders ("shareholders' net income").
Effective January 1, 2009, CIGNA adopted the FASB’s updated earnings per share guidance (ASC 260). This guidance requires unvested restricted stock awards that contain rights to nonforfeitable dividends to be included in the denominator of both basic and diluted earnings per share calculations. Prior period earnings per share data reflect the adoption of the guidance. For the year ended December 31, 2008, the change from previously reported EPS amounts was a $.03 reduction in diluted EPS related to adjusted income from operations.
Discontinued operations for the year ended December 31, 2009 included a gain of $1 million after-tax related to past divestitures related to the completion of the 2005 and 2006 IRS examinations.
For the year ended December 31, 2008, CIGNA reported income from discontinued operations of $4 million.

1
CIGNA Corporation Income and Per Share Data (unaudited) (Dollars in millions, except per share amounts) Three Months Ended December 31, Year Ended December 31,
2009 2008 Change 2009 2008 Change ADJUSTED INCOME (LOSS) FROM OPERATIONS (1)
Health Care $ 194 $ 209 (7) % $ 729 $ 715 2 % Disability and Life 66 64 3 279 275 1 International 38 44 (14) 182 188 (3) Run-off Reinsurance 9 (179) - (24) (209) 89 Other Operations 23 23 - 85 87 (2) Corporate (45) (29) (55) (154) (110) (40) Total $ 285 $ 132 116 % $ 1,097 $ 946 16 %
SHAREHOLDERS' NET INCOME (LOSS)
Segment Earnings (Loss)
Health Care (3) (4) (5) (6) $ 182 $ 182 - % $ 731 $ 664 10 % Disability and Life(3) (4) (5) 64 62 3 284 273 4 International(3) (4) (5) 39 38 3 183 182 1 Run-off Reinsurance (2) 69 (394) - 185 (646) - Other Operations (5) 23 23 - 86 87 (1) Corporate(5) (6) (45) (29) (55) (142) (162) 12 Total $ 332 $ (118) - $ 1,327 $ 398 233 Net realized investment losses, net of taxes (2) (92) 98 (26) (110) 76 Shareholders' income (loss) from continuing operations $ 330 $ (210) - % $ 1,301 $ 288 352 % Shareholders' income from discontinued operations - 1 - 1 4 (75) Shareholders' net income (loss) $ 330 $ (209) - % $ 1,302 $ 292 346 %
DILUTED EARNINGS PER SHARE (7)
Adjusted income from operations (1) $ 1.03 $ 0.48 115 % $ 3.98 $ 3.39 17 % Results of guaranteed minimum income benefits business, after-tax (2) 0.22 (0.79) - 0.76 (1.57) - Net realized investment losses, net of taxes (0.01) (0.34) 97 (0.09) (0.40) 78 Special item(s), after-tax (3) (4) (5) (6) (0.05) (0.12) 58 0.08 (0.39) - Shareholders' income (loss) from continuing operations $ 1.19 $ (0.77) - % $ 4.73 $ 1.03 359 % Shareholders' income from discontinued operations - - - - 0.02 - Shareholders' net income (loss) $ 1.19 $ (0.77) - % $ 4.73 $ 1.05 350 %
Weighted Average Shares (in thousands) (7) 277,343 272,567 2 % 275,357 278,843 (1) % (1) Adjusted income (loss) from operations is segment earnings (loss) (shareholders' income (loss) from continuing operations before net realized investment gains (losses)) excluding results of CIGNA's guaranteed minimum
income benefits business and special items. See page 2 for a detailed reconciliation of adjusted income (loss) from operations to segment earnings (loss), shareholders' income from continuing operations and shareholders' net income presented in accordance with generally accepted accounting principles.
(2) The year ended December 31, 2008 includes a pre-tax charge of $202 million ($131 million after-tax) on the adoption of the FASB's fair value disclosure and measurement guidance (ASC 820) for guaranteed minimum income
benefit contracts. (3) The year ended December 31, 2009 reflects a pre-tax curtailment benefit of $46 million ($30 million after-tax) resulting from the decision to freeze CIGNA's pension plans.
- Pre-tax benefit of $39 million ($25 million after-tax) in Health Care; pre-tax benefit of $6 million ($4 million after-tax) in Disability and Life; and pre-tax benefit of $1 million ($1 million after-tax) in International. (4) The year ended December 31, 2009 includes a pre-tax charge of $44 million ($29 million after-tax) related to the previously announced cost reduction plan.
- Pre-tax charge of $37 million ($24 million after-tax) in Health Care; a pre-tax charge of $5 million ($4 million after-tax) in Disability and Life; and a pre-tax charge of $2 million ($1 million after-tax) in International. The year ended December 31, 2008 includes a pre-tax charge of $55 million ($35 million after-tax) related to the previously announced cost reduction plan. - Pre-tax charge of $44 million ($27 million after-tax) in Health Care; a pre-tax charge of $3 million ($2 million after-tax) in Disability and Life; and a pre-tax charge of $8 million ($6 million after-tax) in International for the fourth quarter of 2008.
(5) The year ended December 31, 2009 includes a net tax benefit of $20 million resulting from the completion of the 2005 and 2006 IRS examinations.
- After-tax benefit of $1 million in Health Care; after-tax benefit of $5 million in Disability and Life; after-tax benefit of $1 million in International; after-tax benefit of $1 million in Other Operations; and an after-tax benefit of $12 million in Corporate.
(6) The year ended December 31, 2008 includes pre-tax charges of $80 million ($52 million after-tax) in Corporate and $37 million ($24 million after-tax) in Health Care, both of which related to litigation matters. (7) Weighted average shares outstanding are impacted by the following factors:
1. The accounting change related to earnings per share guidance (ASC 260) effective January 1, 2009 which requires unvested restricted stock with non-forfeitable dividends to be treated as outstanding common shares. 2. Higher common stock equivalents when CIGNA’s stock price increases and exceeds the exercise price of its employees’ outstanding stock options.

2
CIGNA Corporation Supplemental Financial Information (unaudited) Reconciliation of Adjusted Income from Operations to Shareholders’ Net Income (Dollars in millions, except per share amounts)
Diluted Earnings Disability Run-off Other Per Share (1) (7) Consolidated Health Care & Life International Reinsurance Operations Corporate
Quarterly Results 4Q09 4Q08 3Q09 4Q09 4Q08 3Q09 4Q09 4Q08 3Q09 4Q09 4Q08 3Q09 4Q09 4Q08 3Q09 4Q09 4Q08 3Q09 4Q09 4Q08 3Q09 4Q09 4Q08 3Q09 Adjusted income (loss) from operations $ 1.03 $ 0.48 $ 1.13 $ 285 $ 132 $ 311 $ 194 $ 209 $ 204 $ 66 $ 64 $ 65 $ 38 $ 44 $ 40 $ 9 $ (179) $ 14 $ 23 $ 23 $ 23 $ (45) $ (29) $ (35)
Results of guaranteed minimum income benefits business, excluding charge on adoption of fair value measurements 0.22 (0.79) 0.06 60 (215) 16 - - - - - - - - - 60 (215) 16 - - - - - -
Special item(s), after-tax: Charge for cost reduction plan (3) (0.05) (0.12) (0.03) (13) (35) (7) (12) (27) (4) (2) (2) (1) 1 (6) (2) - - - - - - - - - Segment earnings (loss) 1.20 (0.43) 1.16 332 (118) 320 $ 182 $ 182 $ 200 $ 64 $ 62 $ 64 $ 39 $ 38 $ 38 $ 69 $ (394) $ 30 $ 23 $ 23 $ 23 $ (45) $ (29) $ (35)
Net realized investment gains (losses), net of taxes (0.01) (0.34) 0.03 (2) (92) 9
Shareholders' income (loss) from continuing operations (6) 1.19 (0.77) 1.19 330 (210) 329 Shareholders' income from discontinued operations - - - - 1 -
Shareholders' net income (loss) (6) $ 1.19 $ (0.77) $ 1.19 $ 330 $ (209) $ 329
Diluted Earnings Disability Run-off Other Per Share (1) (7) Consolidated Health Care & Life International Reinsurance Operations Corporate Year Ended December 31, 2009 2008 2009 2008 2009 2008 2009 2008 2009 2008 2009 2008 2009 2008 2009 2008 Adjusted income (loss) from operations $ 3.98 $ 3.39 $ 1,097 $ 946 $ 729 $ 715 $ 279 $ 275 $ 182 $ 188 $ (24) $ (209) $ 85 $ 87 $ (154) $ (110)
Results of guaranteed minimum income benefits business, after-tax: Charge on adoption of fair value measurements - (0.47) - (131) - - - - - - - (131) - - - -
Results of guaranteed minimum income benefits business, excluding charge on adoption of fair value measurements 0.76 (1.10) 209 (306) - - - - - - 209 (306) - - - -
Total 0.76 (1.57) 209 (437) - - - - - - 209 (437) - - - -
Special item(s), after-tax: Curtailment benefit (2) 0.11 - 30 - 25 - 4 - 1 - - - - - - - Charge for cost reduction plan (3) (0.10) (0.12) (29) (35) (24) (27) (4) (2) (1) (6) - - - - - - Completion of IRS examination (4) 0.07 - 20 - 1 - 5 - 1 - - - 1 - 12 - Charge associated with litigation matters (5) - (0.27) - (76) - (24) - - - - - - - - - (52)
Segment earnings (loss) 4.82 1.43 1,327 398 $ 731 $ 664 $ 284 $ 273 $ 183 $ 182 $ 185 $ (646) $ 86 $ 87 $ (142) $ (162)
Net realized investment losses, net of taxes (0.09) (0.40) (26) (110)
Shareholders' income from continuing operations (6) 4.73 1.03 1,301 288 Shareholders' income from discontinued operations - 0.02 1 4
Shareholders' net income (6) $ 4.73 $ 1.05 $ 1,302 $ 292
(1) All earnings per share figures reflect the adoption of the FASB’s updated earnings per share guidance (ASC 260), which requires non-vested restricted stock grants with non-forfeitable dividend rights to be included in weighted
average shares outstanding. (2) The year ended December 31, 2009 reflects a pre-tax curtailment benefit of $46 million ($30 million after-tax) resulting from the decision to freeze CIGNA's pension plans.
(3) The year ended December 31, 2009 includes a pre-tax charge of $44 million ($29 million after-tax) related to the previously announced cost reduction plan.
The year ended December 31, 2008 includes a pre-tax charge of $55 million ($35 million after-tax) related to the previously announced cost reduction plan. (4) The year ended December 31, 2009 includes a net tax benefit of $20 million resulting from the completion of the 2005 and 2006 IRS examinations. (5) The year ended December 31, 2008 includes pre-tax charges of $80 million ($52 million after-tax) in Corporate and $37 million ($24 million after-tax) in Health Care, both of which related to litigation matters. (6) Shareholders' income (loss) from continuing operations and shareholders' net income (loss) are presented in accordance with generally accepted accounting principles (GAAP). Effective January 1, 2009, CIGNA adopted the
FASB’s updated consolidation guidance (ASC 810), which requires income attributable to noncontrolling interests to be included in net income, but then subtracted to determine "shareholders' net income." (7) Weighted average shares outstanding are impacted by the following factors:
1. The accounting change related to earnings per share guidance (ASC 260) effective January 1, 2009 which requires unvested restricted stock with non-forfeitable dividends to be treated as outstanding common shares. 2. Higher common stock equivalents when CIGNA’s stock price increases and exceeds the exercise price of its employees’ outstanding stock options.

3
CIGNA Corporation Consolidated Income Statements (Dollars in millions) Three Months Ended December 31, Year Ended December 31,
2009 2008 Change 2009 2008 Change Revenues: Premiums and fees $ 3,992 $ 4,056 (2) % $ 16,041 $ 16,253 (1) % Net investment income 262 261 - 1,014 1,063 (5) Mail order pharmacy revenues (1) 338 322 5 1,282 1,204 6 Other revenues (2) 47 320 (85) 120 751 (84) Net realized investment losses (3) (142) 98 (43) (170) 75 Total revenues 4,636 4,817 (4) 18,414 19,101 (4) Benefits and Expenses: Health Care medical claims expense 1,701 1,772 (4) 6,927 7,252 (4) Other benefit expenses 856 1,408 (39) 3,407 4,285 (20) Mail order pharmacy cost of goods sold 274 257 7 1,036 961 8 Policy acquisition expenses 122 132 (8) 477 493 (3) Guaranteed minimum income benefits (income) expense (3) (89) 337 - (304) 690 - Other operating expenses excluding special items 1,244 1,194 4 4,966 4,866 2 Special item(s) (4) 20 55 (64) 7 172 (96) Total benefits and expenses 4,128 5,155 (20) 16,516 18,719 (12) Income (loss) from continuing operations before income taxes 508 (338) - 1,898 382 397 Income taxes (benefits): (5) Current 137 39 251 275 313 (12) Deferred 40 (167) - 319 (221) - Total taxes 177 (128) - 594 92 546 Income (loss) from continuing operations 331 (210) - 1,304 290 350 Income from discontinued operations - 1 - 1 4 (75) Net income (loss) $ 331 $ (209) - $ 1,305 $ 294 344 Less: net income attributable to noncontrolling interest 1 - - 3 2 50 Shareholders' net income (loss) $ 330 $ (209) - % $ 1,302 $ 292 346 %
(1) Reflects revenues for non-risk pharmacy mail order fulfillment services. (2) Includes pre-tax losses of $50 million for the fourth quarter of 2009 and $282 million for the year ended December 31, 2009, and pre-tax gains of $215 million for the fourth quarter of 2008 and $333
million for the year ended December 31, 2008 from futures contracts entered into as part of a dynamic hedge program to manage equity risks in CIGNA's run-off reinsurance operations. CIGNA recorded corresponding offsets in benefits and expenses to adjust liabilities for reinsured guaranteed minimum death benefit contracts. For more information, please refer to CIGNA's Form 10-K for the year ended December 31, 2009 which is expected to be filed on February 25, 2010.
(3) The year ended December 31, 2008 includes a pre-tax charge of $202 million ($131 million after-tax) on the adoption of the FASB's fair value disclosure and measurement guidance (ASC 820) for
guaranteed minimum income benefit contracts. (4) The year ended December 31, 2009 includes a pre-tax curtailment benefit of $46 million ($30 million after-tax) resulting from the decision to freeze CIGNA's pension plans, a pre-tax charge of $44
million ($29 million after-tax) related to the previously announced cost reduction plan, and a pre-tax charge of $9 million in conjunction with the completion of the 2005 and 2006 IRS examinations. The year ended December 31, 2008 includes a pre-tax charge of $55 million ($35 million after-tax) related to the previously announced cost reduction plan and pre-tax charges of $80 million ($52 million after-tax) in Corporate and $37 million ($24 million after-tax) in Health Care, both of which related to litigation matters.
(5) The year ended December 31, 2009 includes a tax benefit of $29 million resulting from the completion of the 2005 and 2006 IRS examinations. These tax benefits are partially offset by the pre-tax
charge of $9 million discussed in (4) above, resulting in a net after-tax benefit of $20 million. This amount was treated as a special item.

4
CIGNA Corporation Consolidated Balance Sheets (Dollars in millions) As of As of As of As of December 31, December 31, December 31, December 31, 2009 2008 2009 2008 Assets Liabilities Investments: Fixed maturities, at fair value (1) (amortized cost, $12,580 and $11,492) $ 13,443 $ 11,781 Contractholder deposit funds $ 8,484 $ 8,539 Equity securities, at fair value Future policy benefits 8,136 8,754 (cost, $137 and $140) 113 112 Unpaid claims and claim expenses 3,968 4,037 Commercial mortgage loans (2) 3,522 3,617 Health Care medical claims payable 921 924 Policy loans 1,549 1,556 Unearned premiums and fees 427 414 Real estate 124 53 Total insurance and contractholder liabilities 21,936 22,668 Other long-term investments 595 632 Short-term investments 493 236 Accounts payable, accrued expenses and other liabilities (3) 5,797 6,869 Total investments 19,839 17,987 Short-term debt 104 301 Long-term debt 2,436 2,090 Nonrecourse obligations 23 16 Cash and cash equivalents 924 1,342 Separate account liabilities 7,288 5,864 Accrued investment income 238 225 Total liabilities 37,584 37,808 Premiums, accounts and notes receivable 1,361 1,407 Reinsurance recoverables 6,597 6,973 Shareholders' Equity Deferred policy acquisition costs 943 789 Property and equipment 862 804 Common stock 88 88 Deferred income taxes, net 1,029 1,617 Additional paid-in capital 2,514 2,502 Goodwill 2,876 2,878 Net unrealized appreciation (depreciation)- fixed maturities (3) $ 378 $ (147) Other assets, including other intangibles 1,056 1,520 Net unrealized appreciation- equity securities 4 7 Separate account assets 7,288 5,864 Net unrealized depreciation- derivatives (30) (13) Net translation of foreign currencies (12) (60) Postretirement benefits liability adjustment (958) (861) Accumulated other comprehensive loss (618) (1,074) Retained earnings (3) 8,625 7,374 Less treasury stock, at cost (5,192) (5,298) Total shareholders' equity 5,417 3,592 Noncontrolling interest (3) 12 6 Total equity 5,429 3,598 Total assets $ 43,013 $ 41,406 Total liabilities and equity $ 43,013 $ 41,406
(1) Refer to the Summary of Fixed Maturities - Asset Quality / Type - Fair Value exhibit on page 5 and Summary of Fixed Maturities - Analysis of Amortized Cost vs. Fair Value
exhibit on page 6.
(2) Refer to the Summary of Commercial Mortgage Loan Distribution exhibit by property type and geographic region on page 7.
(3) Refer to Basis of Presentation for more information.
5
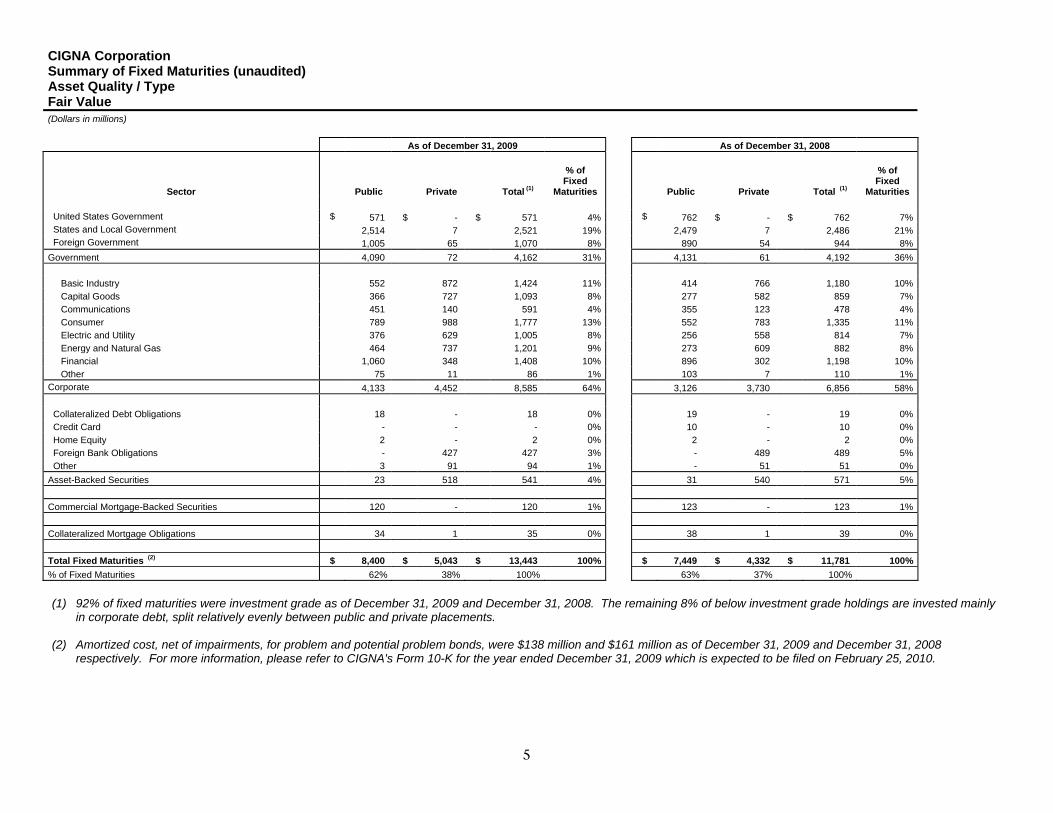
CIGNA Corporation Summary of Fixed Maturities (unaudited) Asset Quality / Type Fair Value (Dollars in millions)
As of December 31, 2009 As of December 31, 2008
Sector Public Private Total (1)
% of
Fixed Maturities Public Private Total (1)
% of
Fixed Maturities
United States Government $ 571 $ - $ 571 4% $ 762 $ - $ 762 7%
States and Local Government 2,514 7 2,521 19% 2,479 7 2,486 21%
Foreign Government 1,005 65 1,070 8% 890 54 944 8%
Government 4,090 72 4,162 31% 4,131 61 4,192 36%
Basic Industry 552 872 1,424 11% 414 766 1,180 10%
Capital Goods 366 727 1,093 8% 277 582 859 7%
Communications 451 140 591 4% 355 123 478 4%
Consumer 789 988 1,777 13% 552 783 1,335 11%
Electric and Utility 376 629 1,005 8% 256 558 814 7%
Energy and Natural Gas 464 737 1,201 9% 273 609 882 8%
Financial 1,060 348 1,408 10% 896 302 1,198 10%
Other 75 11 86 1% 103 7 110 1%
Corporate 4,133 4,452 8,585 64% 3,126 3,730 6,856 58%
Collateralized Debt Obligations 18 - 18 0% 19 - 19 0%
Credit Card - - - 0% 10 - 10 0%
Home Equity 2 - 2 0% 2 - 2 0%
Foreign Bank Obligations - 427 427 3% - 489 489 5%
Other 3 91 94 1% - 51 51 0%
Asset-Backed Securities 23 518 541 4% 31 540 571 5%
Commercial Mortgage-Backed Securities 120 - 120 1% 123 - 123 1%
Collateralized Mortgage Obligations 34 1 35 0% 38 1 39 0%
Total Fixed Maturities (2) $ 8,400 $ 5,043 $ 13,443 100% $ 7,449 $ 4,332 $ 11,781 100%
% of Fixed Maturities 62% 38% 100% 63% 37% 100%
(1) 92% of fixed maturities were investment grade as of December 31, 2009 and December 31, 2008. The remaining 8% of below investment grade holdings are invested mainly
in corporate debt, split relatively evenly between public and private placements. (2) Amortized cost, net of impairments, for problem and potential problem bonds, were $138 million and $161 million as of December 31, 2009 and December 31, 2008
respectively. For more information, please refer to CIGNA's Form 10-K for the year ended December 31, 2009 which is expected to be filed on February 25, 2010.

6
CIGNA Corporation Summary of Fixed Maturities (unaudited) Analysis of Amortized Cost vs. Fair Value (Dollars in millions)
As of December 31, 2009 As of December 31, 2008
Sector Amortized
Cost Unrealized
Appreciation Unrealized
Depreciation Fair Value Amortized
Cost Unrealized
Appreciation Unrealized
Depreciation Fair Value United States Government $ 398 $ 174 $ 1 $ 571 $ 359 $ 403 $ - $ 762 States and Local Government 2,341 188 8 2,521 2,391 117 22 2,486 Foreign Government 1,040 38 8 1,070 882 70 8 944 Government 3,779 400 17 4,162 3,632 590 30 4,192 Basic Industry 1,349 86 11 1,424 1,237 26 83 1,180 Capital Goods 1,040 67 14 1,093 958 18 117 859 Communications 550 45 4 591 494 7 23 478 Consumer 1,678 110 11 1,777 1,397 32 94 1,335 Electric and Utility 953 59 7 1,005 817 28 31 814 Energy and Natural Gas 1,103 103 5 1,201 904 21 43 882 Financial 1,390 62 44 1,408 1,310 24 136 1,198 Other 85 3 2 86 101 11 2 110 Corporate 8,148 535 98 8,585 7,218 167 529 6,856 Collateralized Debt Obligations 20 - 2 18 22 - 3 19 Credit Card - - - - 10 - - 10 Home Equity 2 - - 2 2 - - 2 Foreign Bank Obligations 377 54 4 427 365 128 4 489 Other 95 1 2 94 57 - 6 51 Asset-Backed Securities 494 55 8 541 456 128 13 571 Commercial Mortgage-Backed Securities 125 5 10 120 148 - 25 123 Collateralized Mortgage Obligations 34 1 - 35 38 1 - 39 Total Fixed Maturities $ 12,580 $ 996 $ 133 $ 13,443 $ 11,492 $ 886 $ 597 $ 11,781
7
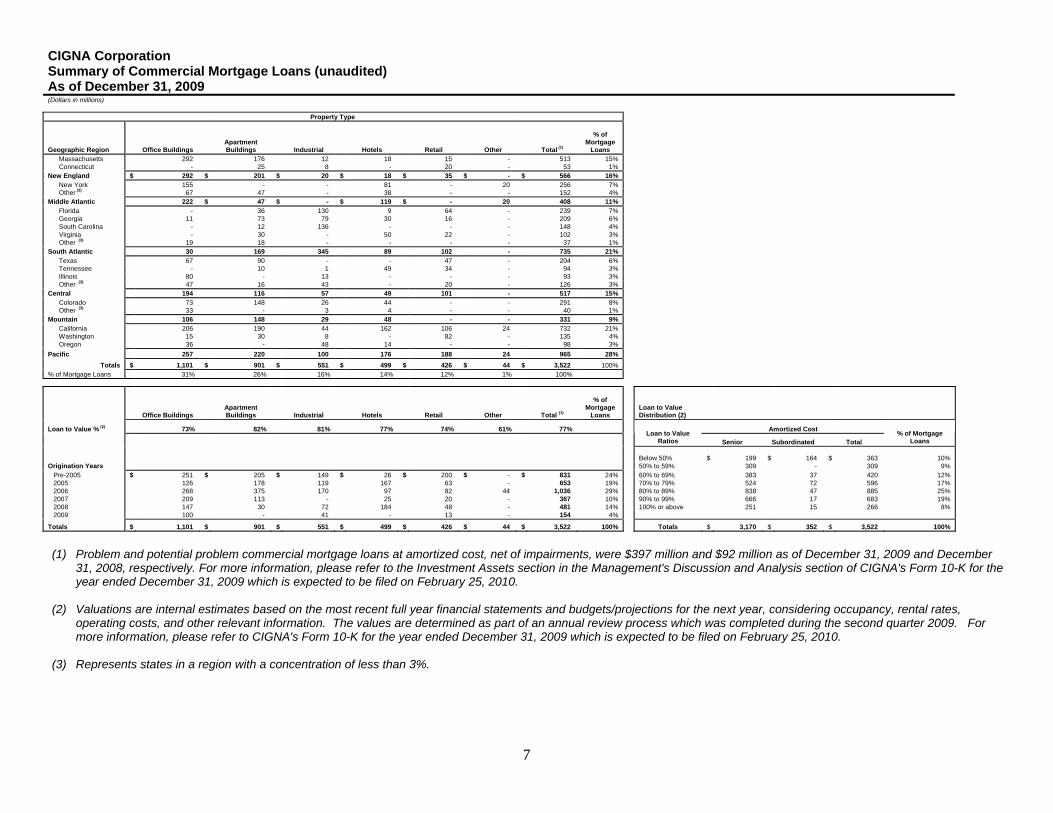
CIGNA Corporation Summary of Commercial Mortgage Loans (unaudited) As of December 31, 2009 (Dollars in millions)
Property Type
Geographic Region Office Buildings Apartment Buildings Industrial Hotels Retail Other Total (1)
% of Mortgage
Loans Massachusetts 292 176 12 18 15 - 513 15% Connecticut - 25 8 - 20 - 53 1% New England $ 292 $ 201 $ 20 $ 18 $ 35 $ - $ 566 16% New York 155 - - 81 - 20 256 7% Other (3) 67 47 - 38 - - 152 4% Middle Atlantic 222 $ 47 $ - $ 119 $ - 20 408 11% Florida - 36 130 9 64 - 239 7% Georgia 11 73 79 30 16 - 209 6% South Carolina - 12 136 - - - 148 4% Virginia - 30 - 50 22 - 102 3% Other (3) 19 18 - - - - 37 1% South Atlantic 30 169 345 89 102 - 735 21% Texas 67 90 - - 47 - 204 6% Tennessee - 10 1 49 34 - 94 3% Illinois 80 - 13 - - - 93 3% Other (3) 47 16 43 - 20 - 126 3% Central 194 116 57 49 101 - 517 15% Colorado 73 148 26 44 - - 291 8% Other (3) 33 - 3 4 - - 40 1% Mountain 106 148 29 48 - - 331 9% California 206 190 44 162 106 24 732 21% Washington 15 30 8 - 82 - 135 4% Oregon 36 - 48 14 - - 98 3% Pacific 257 220 100 176 188 24 965 28%
Totals $ 1,101 $ 901 $ 551 $ 499 $ 426 $ 44 $ 3,522 100% % of Mortgage Loans 31% 26% 16% 14% 12% 1% 100%
Office Buildings Apartment Buildings Industrial Hotels Retail Other Total (1)
% of Mortgage
Loans Loan to Value Distribution (2)
Loan to Value % (2) 73% 82% 81% 77% 74% 61% 77% Amortized Cost
Loan to Value
Ratios Senior Subordinated Total % of Mortgage
Loans Below 50% $ 199 $ 164 $ 363 10% Origination Years 50% to 59% 309 - 309 9% Pre-2005 $ 251 $ 205 $ 149 $ 26 $ 200 $ - $ 831 24% 60% to 69% 383 37 420 12% 2005 126 178 119 167 63 - 653 19% 70% to 79% 524 72 596 17% 2006 268 375 170 97 82 44 1,036 29% 80% to 89% 838 47 885 25% 2007 209 113 - 25 20 - 367 10% 90% to 99% 666 17 683 19% 2008 147 30 72 184 48 - 481 14% 100% or above 251 15 266 8% 2009 100 - 41 - 13 - 154 4%
Totals $ 1,101 $ 901 $ 551 $ 499 $ 426 $ 44 $ 3,522 100% Totals $ 3,170 $ 352 $ 3,522 100%
(1) Problem and potential problem commercial mortgage loans at amortized cost, net of impairments, were $397 million and $92 million as of December 31, 2009 and December
31, 2008, respectively. For more information, please refer to the Investment Assets section in the Management's Discussion and Analysis section of CIGNA's Form 10-K for the year ended December 31, 2009 which is expected to be filed on February 25, 2010.
(2) Valuations are internal estimates based on the most recent full year financial statements and budgets/projections for the next year, considering occupancy, rental rates,
operating costs, and other relevant information. The values are determined as part of an annual review process which was completed during the second quarter 2009. For more information, please refer to CIGNA's Form 10-K for the year ended December 31, 2009 which is expected to be filed on February 25, 2010.
(3) Represents states in a region with a concentration of less than 3%.

8
CIGNA Corporation Stock and Balance Sheet Analyses (unaudited) Three Months Ended December 31, Year Ended December 31, (In millions, except per share data) 2009 2008 2009 2008
Price range of common stock: High $ 38.12 $ 34.47 $ 38.12 $ 56.98 Low $ 26.83 $ 8.00 $ 12.68 $ 8.00 Market price (as of end of period) $ 35.27 $ 16.85 Dividends declared per share $ - $ - $ 0.040 $ 0.040 Common dividends declared $ - $ - $ 11 $ 11 As of December 31, 2009 2008 Common shares outstanding (in thousands) 274,257 271,036 Book value per share $ 19.75 $ 13.25

9
CIGNA Corporation Condensed Consolidated Statements of Cash Flows (Dollars in millions) Year Ended December 31,
2009 2008
CASH FLOWS FROM OPERATING ACTIVITIES Net income $ 1,305 $ 294 Adjustments to reconcile net income to net cash provided by operating activities: (Income) from discontinued operations (1) (4)Insurance liabilities (357) 485 Reinsurance recoverables 30 63 Deferred policy acquisition costs (109) (74)Premiums, accounts and notes receivable 49 219 Other assets 452 (860)Accounts payable, accrued expenses and other liabilities (1,321) 1,466 Current income taxes 55 (72)Deferred income taxes 319 (221)Realized investment losses 43 170 Depreciation and amortization 268 244 Gains on sales of businesses (excluding discontinued operations) (32) (38)Proceeds from sales of mortgage loans held for sale 1 1 Other, net 43 (17)Net cash provided by operating activities 745 1,656 Net cash (used in) investing activities (1,485) (2,572) Net cash provided by financing activities 307 314 Effect of foreign currency rate changes on cash and cash equivalents 15 (26) Net decrease in cash and cash equivalents (418) (628) Cash and cash equivalents, beginning of period 1,342 1,970 Cash and cash equivalents, end of period $ 924 $ 1,342

10
CIGNA Corporation Health Care Segment Earnings (Dollars in millions) Three Months Ended December 31, Year Ended December 31,
2009 2008 Change 2009 2008 Change
Revenues: Premiums and fees $ 2,806 $ 2,905 (3) % $ 11,384 $ 11,665 (2) % Net investment income 49 46 7 181 200 (10) Mail order pharmacy revenues 338 322 5 1,282 1,204 6 Other revenues 61 68 (10) 262 267 (2) Segment revenues 3,254 3,341 (3) 13,109 13,336 (2) Benefits and Expenses: Health Care medical claims expense 1,701 1,772 (4) 6,927 7,252 (4) Other benefit expenses 35 42 (17) 169 193 (12) Mail order pharmacy cost of goods sold 274 257 7 1,036 961 8 Policy acquisition expenses 32 38 (16) 141 138 2 Other operating expenses excluding special items 915 914 - 3,708 3,695 - Special item(s) (1) 17 44 (61) (2) 81 - Benefits and expenses 2,974 3,067 (3) 11,979 12,320 (3) Income before income taxes 280 274 2 1,130 1,016 11 Income taxes (2) 98 92 7 399 352 13
Segment earnings, after-tax 182 182 - 731 664 10
Less: Special items, after-tax(1) (2) (12) (27) 56 2 (51) -
Adjusted income from operations $ 194 $ 209 (7) % $ 729 $ 715 2 %
Net realized investment losses, net of taxes $ (2) $ (36) 94 % $ (19) $ (13) (46) %
(1) The year ended December 31, 2009 includes a curtailment benefit of $39 million ($25 million after-tax) resulting from the decision to freeze CIGNA's pension plans and a pre-
tax charge of $37 million ($24 million after-tax) related to the previously announced cost reduction plan. The year ended December 31, 2008 includes pre-tax charges of $44 million ($27 million after-tax) related to the previously announced cost reduction program and $37 million ($24 million after-tax) related to litigation matters.
(2) The year ended December 31, 2009 includes a $1 million tax benefit resulting from the completion of the 2005 and 2006 IRS examinations.
11
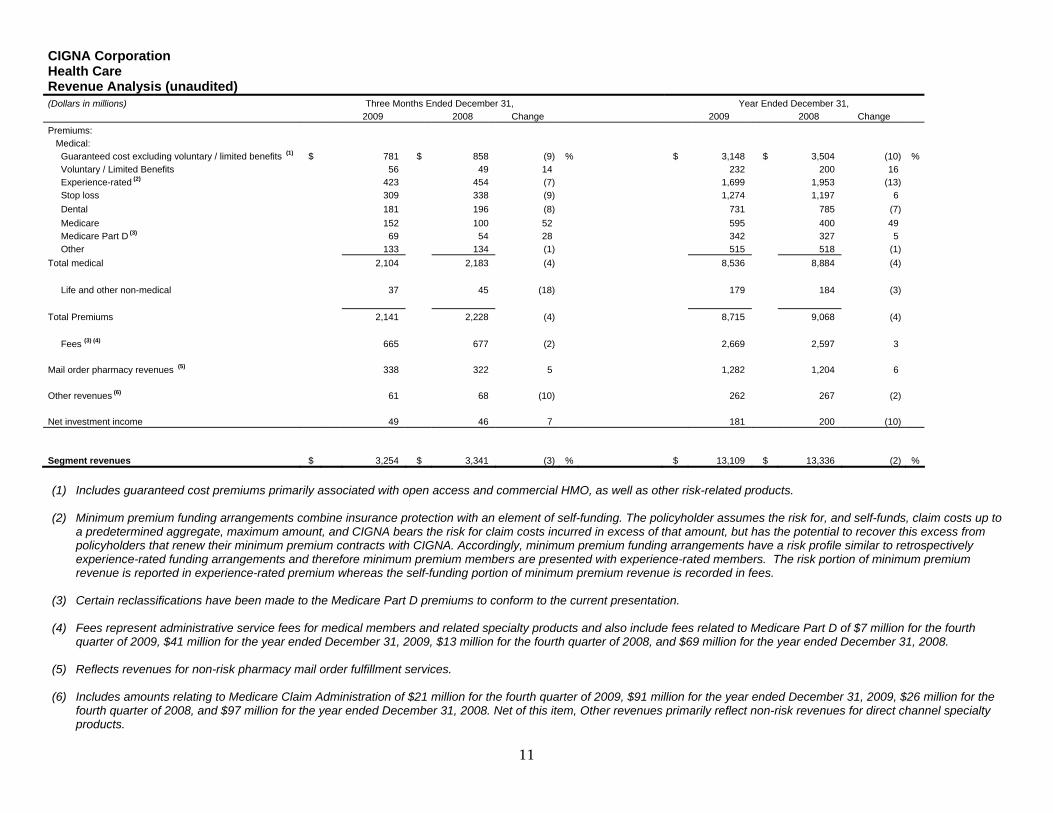
CIGNA Corporation Health Care Revenue Analysis (unaudited) (Dollars in millions) Three Months Ended December 31, Year Ended December 31,
2009 2008 Change 2009 2008 Change Premiums: Medical: Guaranteed cost excluding voluntary / limited benefits (1) $ 781 $ 858 (9) % $ 3,148 $ 3,504 (10) % Voluntary / Limited Benefits 56 49 14 232 200 16 Experience-rated (2) 423 454 (7) 1,699 1,953 (13) Stop loss 309 338 (9) 1,274 1,197 6 Dental 181 196 (8) 731 785 (7) Medicare 152 100 52 595 400 49 Medicare Part D (3) 69 54 28 342 327 5 Other 133 134 (1) 515 518 (1) Total medical 2,104 2,183 (4) 8,536 8,884 (4) Life and other non-medical 37 45 (18) 179 184 (3) Total Premiums 2,141 2,228 (4) 8,715 9,068 (4) Fees (3) (4) 665 677 (2) 2,669 2,597 3 Mail order pharmacy revenues (5) 338 322 5 1,282 1,204 6 Other revenues (6) 61 68 (10) 262 267 (2) Net investment income 49 46 7 181 200 (10) Segment revenues $ 3,254 $ 3,341 (3) % $ 13,109 $ 13,336 (2) %
(1) Includes guaranteed cost premiums primarily associated with open access and commercial HMO, as well as other risk-related products. (2) Minimum premium funding arrangements combine insurance protection with an element of self-funding. The policyholder assumes the risk for, and self-funds, claim costs up to
a predetermined aggregate, maximum amount, and CIGNA bears the risk for claim costs incurred in excess of that amount, but has the potential to recover this excess from policyholders that renew their minimum premium contracts with CIGNA. Accordingly, minimum premium funding arrangements have a risk profile similar to retrospectively experience-rated funding arrangements and therefore minimum premium members are presented with experience-rated members. The risk portion of minimum premium revenue is reported in experience-rated premium whereas the self-funding portion of minimum premium revenue is recorded in fees.
(3) Certain reclassifications have been made to the Medicare Part D premiums to conform to the current presentation. (4) Fees represent administrative service fees for medical members and related specialty products and also include fees related to Medicare Part D of $7 million for the fourth
quarter of 2009, $41 million for the year ended December 31, 2009, $13 million for the fourth quarter of 2008, and $69 million for the year ended December 31, 2008. (5) Reflects revenues for non-risk pharmacy mail order fulfillment services.
(6) Includes amounts relating to Medicare Claim Administration of $21 million for the fourth quarter of 2009, $91 million for the year ended December 31, 2009, $26 million for the
fourth quarter of 2008, and $97 million for the year ended December 31, 2008. Net of this item, Other revenues primarily reflect non-risk revenues for direct channel specialty products.

12
CIGNA Corporation Health Care Key Metrics (unaudited) (Dollars in millions) Three Months Ended December 31, Year Ended December 31,
2009 2008 Change 2009 2008 Change OTHER OPERATING EXPENSES EXCLUDING SPECIAL ITEMS: Pharmacy expenses (1) $ 43 $ 44 (2) % $ 174 $ 182 (4) % Medicare Part D expenses 11 16 (31) 51 58 (12) Disease management expenses 41 42 (2) 169 171 (1) Transformation amortization expenses 1 19 (95) 40 83 (52) Voluntary / limited benefits expenses (2) 16 16 - 63 64 (2) Medicare claim administration 19 25 (24) 91 96 (5) Great-West Integration (3) 9 16 (44) 51 55 (7) Other operating expenses 775 736 5 3,069 2,986 3 Other operating expenses excluding special items $ 915 $ 914 - % $ 3,708 $ 3,695 - %
(1) Includes expenses supporting both mail order and retail pharmacy operations.
(2) Represents operating expenses of the Star HRG voluntary / limited benefits business acquired in July 2006.
(3) Acquisition of Great-West Healthcare effective April 1, 2008.
Three Months Ended December 31, Change Year Ended December 31, Change RATIOS: 2009 2008 Better (Worse) 2009 2008 Better (Worse) Guaranteed Cost care ratio (excluding voluntary / limited benefits) (4) 86.3 % 85.7 % (0.6) 85.5 % 84.8 % (0.7) Guaranteed Cost care ratio (including voluntary / limited benefits) (4) 84.4 % 84.0 % (0.4) 83.9 % 83.4 % (0.5) Medicare Part D care ratio (including fees) 60.1 % 64.8 % 4.7 81.8 % 80.1 % (1.7) Medicare Part D care ratio (excluding fees) (5) 70.9 % 89.8 % 18.9 91.6 % 96.9 % 5.3 (4) The Guaranteed Cost care ratio excludes the stop loss products associated with experience-rated and service members. (5) Certain reclassifications have been made to the Medicare Part D care ratio to conform to the current presentation.

13
CIGNA Corporation Health Care Estimated Covered Lives (unaudited) As of December 31, As of December 31, COVERED LIVES BY FUNDING TYPE: 2009 2008 Change COVERED LIVES BY MARKET SEGMENT: (5) 2009 2008 Change (Lives in thousands) (Lives in thousands) Medical membership : Medical membership : Guaranteed cost excluding voluntary / limited benefits (1) 780 891 (12) % Voluntary / Limited Benefits 221 201 10 National Accounts 4,165 4,586 (9) % Medicare 52 35 49 Total guaranteed cost 1,053 1,127 (7) Middle Market 6,166 6,299 (2) Experience-rated (2) 761 864 (12) Select 571 686 (17) Service 9,226 9,688 (5) Other, including Individual 138 108 28 Total medical membership 11,040 11,679 (5) % Total medical membership 11,040 11,679 (5) % Non-medical membership : Medicare Part D (3) 305 326 (6) %
Dental (4) 9,873 10,615 (7) %
Behavioral care (4) 17,647 18,316 (4) %
Pharmacy (4) 6,451 6,203 4 %
(1) Includes guaranteed cost premiums primarily associated with open access and commercial HMO, as well as other risk-related products. (2) Includes minimum premium members, who have a risk profile similar to experience-rated funding arrangements. Also, includes certain non-participating cases for which special customer level reporting of experience is required. (3) Reflects members enrolled in CIGNA’s Medicare Part D program, which provides access to prescription medications through a nationwide pharmacy network. (4) Reflects members enrolled in CIGNA’s dental, behavioral care or managed pharmacy programs, which provide access to services through a nationwide network. These members may also be medical members, or they may have stand-alone dental, behavioral care or pharmacy coverage. The managed pharmacy members in 2009 include the fourth quarter 2009 conversion of members from Great-West Healthcare.
(5) Estimated Covered Lives by Market Segment generally reflects the following: ~ the National Accounts market segment includes multi-site employers with more than 5,000 employees; ~ the Middle Market segment includes multi-site employers with more than 250 but fewer than 5,000 employees and single-site employers with more than 250 employees; ~ the Select market segment includes employers with more than 50 but fewer than 250 employees; and ~ Other includes Individual, Small business, which generally includes employers with 2-50 employees, and Medicare, which includes Individual and Group Medicare Private Fee for Service.

14
CIGNA Corporation Disability and Life Segment Earnings (Dollars in millions) Three Months Ended December 31, Year Ended December 31,
2009 2008 Change 2009 2008 Change Revenues: Premiums and fees: Life $ 314 $ 338 (7) % $ 1,301 $ 1,261 3 % Disability 268 255 5 1,057 1,004 5 Other 65 73 (11) 276 297 (7) Total premiums and fees 647 666 (3) 2,634 2,562 3 Net investment income 64 63 2 244 256 (5) Other revenues 26 27 (4) 113 117 (3) Segment revenues 737 756 (3) 2,991 2,935 2 Benefits and Expenses: Benefit expenses 474 511 (7) 1,922 1,914 - Policy acquisition expenses 4 2 100 6 6 - Other operating expenses excluding special items 165 153 8 671 630 7 Special item(s) (1) 3 3 - (1) 3 - Benefits and expenses 646 669 (3) 2,598 2,553 2 Income before income taxes 91 87 5 393 382 3 Income taxes (2) 27 25 8 109 109 -
Segment earnings, after-tax
64 62 3 284 273 4
Less: Special items, after-tax(1) (2) (2) (2) - 5 (2) -
Adjusted income from operations $
66 $ 64 3 % $ 279 $ 275 1 %
Net realized investment gains (losses), net of taxes $
1 $ (25) - % $ (1) $ (48) 98 %
(1) The year ended December 31, 2009 includes a curtailment benefit of $6 million ($4 million after-tax) resulting from the decision to freeze CIGNA's pension plans and a pre-tax
charge of $5 million ($4 million after-tax) related to the previously announced cost reduction plan. The year ended December 31, 2008 includes a pre-tax charge of $3 million ($2 million after-tax) related to the previously announced cost reduction plan.
(2) The year ended December 31, 2009 includes a $5 million tax benefit resulting from the completion of the 2005 and 2006 IRS examinations.

15
CIGNA Corporation International Segment Earnings (Dollars in millions) Three Months Ended December 31, Year Ended December 31,
2009 2008 Change 2009 2008 Change Revenues: Premiums and fees $ 504 $ 448 13 % $ 1,882 $ 1,870 1 % Net investment income 19 17 12 69 79 (13) Other revenues 8 6 33 22 18 22 Segment revenues 531 471 13 1,973 1,967 - Benefits and Expenses: Benefit expenses 295 238 24 1,080 1,003 8 Policy acquisition expenses 84 90 (7) 324 343 (6) Other operating expenses excluding special items 87 74 18 312 325 (4) Special item(s)(1) (2) - 8 - 1 8 (88) Benefits and expenses 466 410 14 1,717 1,679 2 Income before income taxes 65 61 7 256 288 (11) Income taxes (3) 25 23 9 70 104 (33) Income attributable to noncontrolling interest 1 - - 3 2 50
Segment earnings, after-tax 39 38 3 183 182 1
Less: Special items, after-tax(1) (2) (3) 1 (6) - 1 (6) -
Adjusted income from operations $
38 $ 44 (14) % $ 182 $ 188 (3) %
Net realized investment gains (losses), net of taxes $
1 $ (1) - % $ 2 $ (3) - %
(1) The year ended December 31, 2009 includes a pre-tax charge of $2 million ($1 million after-tax) related to the previously announced cost reduction plan.
The year ended December 31, 2008 includes a pre-tax charge of $8 million ($6 million after-tax) related to the previously announced cost reduction plan. (2) The year ended December 31, 2009 includes a curtailment benefit of $1 million ($1 million after-tax) resulting from the decision to freeze CIGNA's pension plans. (3) The year ended December 31, 2009 includes a $1 million tax benefit resulting from the completion of the 2005 and 2006 IRS examinations.

16
CIGNA Corporation Run-off Reinsurance Segment Earnings (Dollars in millions) Three Months Ended December 31, Year Ended December 31,
2009 2008 Change 2009 2008 Change Revenues: Premiums and fees $ 6 $ 8 (25) % $ 29 $ 43 (33) % Net investment income 27 34 (21) 113 104 9 Other revenues (1) (49) 214 - (283) 331 - Segment revenues (16) 256 - (141) 478 - Benefits and Expenses: Benefit expenses (44) 520 - (146) 782 - Guaranteed minimum income benefits (income) expense (2) (89) 337 - (304) 690 - Other operating expenses 9 4 125 31 27 15 Benefits and expenses (124) 861 - (419) 1,499 - Income (loss) before income taxes 108 (605) - 278 (1,021) - Income taxes (benefits) 39 (211) - 93 (375) - Segment income (loss), after-tax 69 (394) - 185 (646) - Results of guaranteed minimum income benefits business, after-tax: Charge on adoption of fair value measurements - - - - (131) -
Results of guaranteed minimum income benefits business, excluding charge on adoption of fair value measurements (3) 60 (215) - 209 (306) - Total 60 (215) - 209 (437) - Adjusted income (loss) from operations $ 9 $ (179) - % $ (24) $ (209) 89 % Net realized investment gains (losses), net of taxes $ - $ (14) - % $ (2) $ (19) 89 %
(1) Includes pre-tax losses of $50 million for the fourth quarter of 2009 and $282 million for the year ended December 31, 2009, and pre-tax gains of $215 million for the fourth
quarter of 2008 and $333 million for the year ended December 31, 2008 from futures contracts entered into as part of a dynamic hedge program to manage equity risks in CIGNA's run-off reinsurance operations. CIGNA recorded corresponding offsets in benefits and expenses to adjust liabilities for reinsured guaranteed minimum death benefit contracts. For more information, please refer to CIGNA's Form 10-K for the year ended December 31, 2009 which is expected to be filed on February 25, 2010.
(2) The year ended December 31, 2008 includes a pre-tax charge of $202 million ($131 million after-tax) on the adoption of the FASB's fair value disclosure and measurement
guidance (ASC 820) for guaranteed minimum income benefit contracts. (3) Results of guaranteed minimum income benefits business include "Guaranteed minimum income benefits (income) expense," as well as net investment income and income
taxes associated with this business.

17
CIGNA Corporation Other Operations Segment Earnings (Dollars in millions) Three Months Ended December 31, Year Ended December 31,
2009 2008 Change 2009 2008 Change Revenues: Premiums and fees $ 29 $ 29 - % $ 112 $ 113 (1) % Net investment income 103 101 2 407 414 (2) Other revenues 15 17 (12) 64 71 (10) Segment revenues 147 147 - 583 598 (3) Benefits and Expenses: Benefit expenses 100 101 (1) 398 408 (2) Policy acquisition expenses 2 2 - 6 6 - Other operating expenses excluding the special item 11 11 - 53 54 (2) Special item(s) (1) - - - 9 - - Benefits and expenses 113 114 (1) 466 468 - Income before income taxes 34 33 3 117 130 (10) Income taxes (2) 11 10 10 31 43 (28)
Segment earnings, after-tax
23 23 - 86 87 (1)
Less: Special items, after-tax (2) - - - 1 - -
Adjusted income from operations $
23 $ 23 - % $ 85 $ 87 (2) %
Net realized investment losses, net of taxes $
(2) $ (16) 88 % $ (6) $ (27) 78 %
(1) The year ended December 31, 2009 reflects a $9 million pre-tax charge in conjunction with completion of the 2005 and 2006 IRS examination. See Note 2 below for more
information. (2) The year ended December 31, 2009 includes a tax benefit of $10 million resulting from completion of the 2005 and 2006 IRS examinations. This tax benefit is substantially
offset by the pre-tax charge of $9 million discussed in (1) above, resulting in a net after-tax benefit of $1 million. This amount was treated as a special item.

18
CIGNA Corporation Corporate (Dollars in millions) Three Months Ended December 31, Year Ended December 31,
2009 2008 Change 2009 2008 Change Revenues: Net investment income $ - $ - - % $ - $ 10 - % Other revenues (1) (14) (12) (17) (58) (53) (9) Segment revenues (14) (12) (17) (58) (43) (35) Benefits and Expenses: Benefit expenses (1) (4) (4) - (16) (15) (7) Other operating expenses 57 38 50 191 135 41 Special item(s) (3) - - - 80 - Benefits and expenses 53 34 56 175 200 (13) Loss before income tax benefits (67) (46) (46) (233) (243) 4 Income tax benefits (2) (22) (17) (29) (91) (81) (12)
Loss, after-tax (45) (29) (55) (142) (162) 12
Less: Special items, after-tax(2) (3) - - - 12 (52) -
Adjusted loss from operations $ (45) $ (29) (55) % $ (154) $ (110) (40) %
Net realized investment gains (losses), net of taxes $ - $ - - % $ - $ - - %
(1) Other revenues and Benefit expenses include amounts for elimination of intercompany revenues and expenses. (2) The year ended December 31, 2009 includes a $12 million tax benefit resulting from the completion of the 2005 and 2006 IRS examinations. (3) The year ended December 31, 2008 reflects a pre-tax charge of $80 million ($52 million after-tax) related to litigation matters.