History of EOH. The Beginning Departments Take the Stage 1906-1942.

Page 1 of 8
QlikView’s Ability to Connect
Multiple Data Sources
M a y 2 0 1 4

Page 2 of 8
Table of Contents
Overview Of QlikView ...................................................................................... 3
QlikView’s Connectivity Technology ................................................................ 4
QlikView’s Engine ............................................................................................ 5
List Of Data Sources........................................................................................ 6
The EOH Applications & QlikView Alliance ...................................................... 7
Contacts .......................................................................................................... 8
References ...................................................................................................... 8
Page 3 of 8
OVERVIEW OF QLIKVIEW
Effective decision-making is based on having the right information available within a few
clicks. This facility enables managers to transform their decisions into tangible actions, in a shorter
space of time than ever before. This sums up what Business Intelligence (BI) means.
QlikView has become known as the most flexible Business Intelligence platform for turning data
into knowledge. More than 24,000 organisations worldwide have enabled
their users to easily consolidate, search, and visually analyse all their data for
unprecedented business insight using QlikView’s simplicity.
The Business Application Research Center (BARC) BI Survey is the world's
largest survey of business intelligence software users. This year’s survey is
based on analysis of the experiences of over 2,000 users of 30 leading
Business Intelligence products. According to an Analyst Report: “We’re
pleased to announce that QlikTech is a top performer in all three of the Peer
Group categories reviewed: Large International Vendor, Dashboard Vendor, and Visual Analysis
and Data Discovery.”
Taking just minutes to learn, the automatic associations of QlikView create endless possibilities for
making ad hoc queries without requiring tediously defined structures and hierarchies, as is typical
in other data analysis tools. Added to this benefit is that there is no longer a need to refer to data
and reports from various information sources within the company and the different departments
within it. The common problem of silo’s within an organisation can also be eradicated with a BI tool
of this nature.
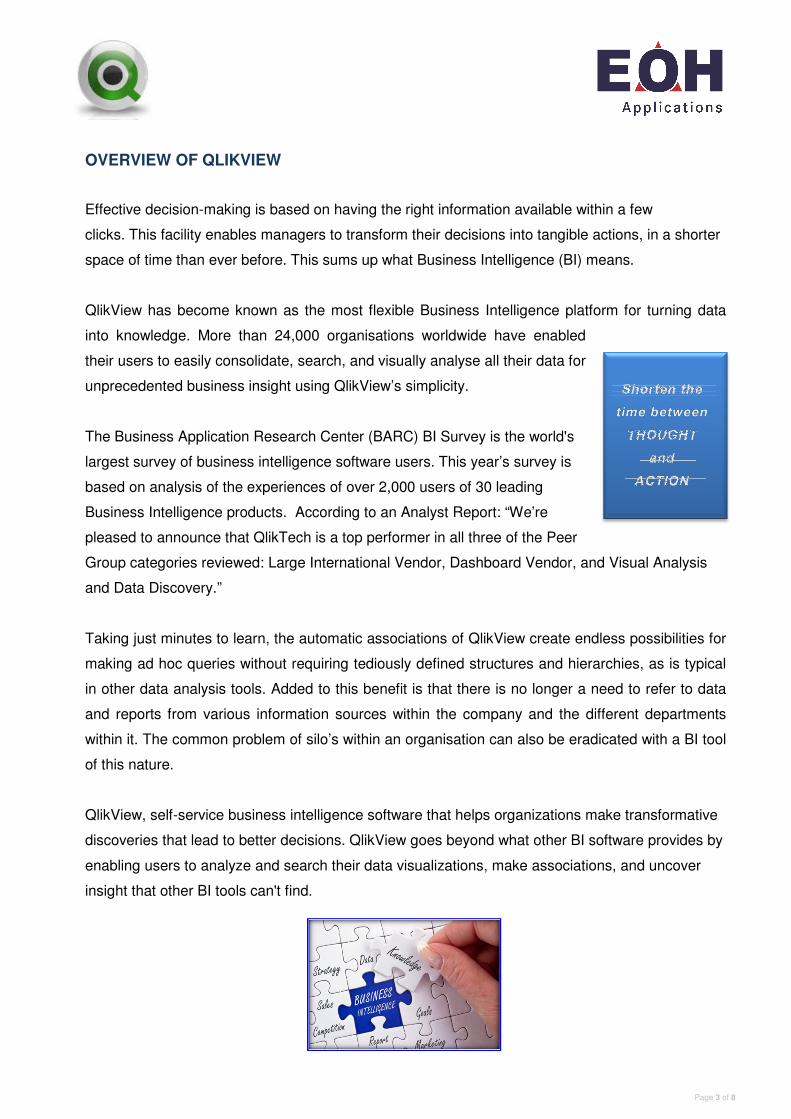
QlikView, self-service business intelligence software that helps organizations make transformative
discoveries that lead to better decisions. QlikView goes beyond what other BI software provides by
enabling users to analyze and search their data visualizations, make associations, and uncover
insight that other BI tools can't find.

Page 4 of 8
QLIKVIEW’S CONNECTIVITY TECHNOLOGY
One of the unique features of QlikView is that it enables you to connect your data from different
sources, such as databases, spreadsheets, websites, and custom data sources. You can blend
data sources from different vendors and data suppliers in the same QlikView application, to gain
insight into your data. QlikView’s connectivity technology makes this possible.
Figure 1 depicts these relationships.
FIGURE 1. QlikView extracts data from multiple, heterogeneous sources and creates a homogenous data set suitable for analysis and visualization.
HOW DOES IT WORK?
QlikView offers connectivity technology in the following ways:
▲ Files
o Use QlikView’s built-in data wizard to connect to data sources such as spreadsheets,
XML and web pages.
▲ Databases
o Pull data using the ODBC connector or native connectors from QlikTech, database
vendors, or third parties.
▲ Direct database queries
o Query databases using the DirectDiscovery connection.
▲ Custom data sources
o Build your own data source connector using QVX technology.

Page 5 of 8
QLIKVIEW’S ENGINE
The QlikView engine provides a unique associative capability to the data that has been loaded.
This means that data that is sourced from multiple systems can be treated as a single data entity
within the engine for the purpose of analytics, regardless of where the data came from. QlikView
applies associations between the data from the various systems by automatically mapping fields
that have the same name and same data type. This allows users to interrogate and make
discoveries in their data as if it were a single table of data, rather than data coming from a variety
of disparate and unconnected systems.
Once the data is loaded into the in-memory associative engine, a large variety of very powerful,
and real time, analytics capabilities are available. This is because of the rapid and highly-flexible
nature of QlikView’s in-memory technology.

Page 6 of 8
LIST OF DATA SOURCES
The list below contains the different data sources that QlikView is able to connect to, as at 1 May 2014.
A - I M - P S - Z
Actian Vectorwise MapR Sage 500
Amazon EC2 MicroStrategy Salesforce
Amazon Redshift Microsoft Access SAP
Aster Data nCluster Microsoft Dynamics NAV (Navision) SAP HANA
Cloudera Hadoop Hive Microsoft Excel SAP NetWeaver Business Warehouse
Cloudera Impala Microsoft SharePoint Siebel
CSV Microsoft SQL Server Sybase ASE
DataStax MySQL SYSPRO
Epicor Scala OData SybaseIQ
EMC Greenplum ODBC Teradata
Firebird Oracle Web pages
Google BigQuery Oracle Hyperion XML
Hortonworks Hadoop Hive Oracle JD Edwards
HP Vertica Oracle Peoplesoft
IBM DB2 ParAccel
IBM Netezza ParStream
IBM (Lotus) Notes PostgreSQL
Infor Lawson Progress OpenEdge
Intuit QuickBooks
Informatica Powercenter

Page 7 of 8
THE EOH APPLICATIONS & QLIKVIEW ALLIANCE
EOH Applications, which is a Business Unit within EOH, delivers Business Intelligence as it’s
meant to be, by offering QlikView as part of its suite of products and services.
Apart from selling the software EOH Applications provides the following services in support of it:
Identify the needs of the
business
- Via Business Intelligence Workshops facilitated by our
Business Analyst
Extract data from the
various sources into
QlikView
Data Warehouse
consolidation
- SQL Data Warehouse and/or QlikView Data Warehouse
Build QlikView data extraction
models
- Finance, HR, Sales, Stock etc
Develop the formulas and analysis
views
- Formulas eg. Stock Turnover, Profit/Loss etc
- Analysis eg. Averages of Sales Figures etc
Design Dashboards
and Reports
Administration - set up of:
- QlikView Server
- Security and access requirements (network, internet and mobile devices)
- Report scheduling
Ad hoc Consulting and
Development

Page 8 of 8
CONTACTS
If you would like to view Case Studies from your industry, or see this tool in action, using your
company data, please contact Lynda Benn, as follows:
Lynda Benn Regional Director – Western Cape
EOH Applications tel: +27 (21) 525 7200 | cell: +27 (83) 658 2988 [email protected] | www.eoh.co.za | www.eohapplications.co.za Consulting | Technology | Outsourcing
REFERENCES
1. http://www.qlik.com
2. http://www.qlikview.co.za/?m=1