
,QF - etouches · ,qwurgxfwlrq 3uhvhqwdwlrq 2emhfwlyhv 3duw ([sodlq dqg ghprqvwudwh wkh fdofxodwlrq...
100
REVENUE REQUIREMENT 2016 CGA Regulatory Course Michelle Carman FortisBC Energy Inc. 1
-
Upload
nguyenhanh -
Category
Documents
-
view
216 -
download
0
Transcript of ,QF - etouches · ,qwurgxfwlrq 3uhvhqwdwlrq 2emhfwlyhv 3duw ([sodlq dqg ghprqvwudwh wkh fdofxodwlrq...

REVENUE REQUIREMENT2016 CGA Regulatory Course
Michelle CarmanFortisBC Energy Inc.
1

IntroductionPresentation Objectives
Part 1: Explain and demonstrate the calculation of revenue requirement for the cost of service form of regulation
Part 2: Explain Regulatory Approval of Capital Expenditures
2

Revenue RequirementPart 1
Revenue RequirementExplain and demonstrate the calculation ofRevenue Requirement for the Cost of ServiceForm of Regulation
3

Revenue RequirementPart 1 : Presentation Overview
Introduction Generally Accepted Regulatory Principles Rate Base Cost of Capital Cost of Gas Sold Operating, Maintenance and Administration Expense Depreciation and Amortization Expense Revenue Forecast Income Tax Regulator’s Decision
4

Gas WellsProducing
Basin
Compressor Stations
LNG
City Gate(Meters / Regs)
Large VolumeCustomer
Gas ProcessingPlant
Distribution Mains
Meter/ Regulator
UndergroundStorage
ResidentialCustomer
CommercialCustomer
Transmission Lines
Part 1: IntroductionNatural Gas Industry Schematic
5

Part 1: IntroductionCustomer-Related Activities
6
Customer Account ManagementMeter Management Billing
Payments Collections
Collection Agencies
Financial Reporting
Accounts Receivable Bad debt

Part 1: IntroductionIntegrated Energy Utility
Areas of Focus
7

Part 1: IntroductionRegulatory Compact Bargain between
regulator and regulated utility
Private property put to use in the public interest
Government will protect the interests of both the consumer and the utility
Utility has both rights and responsibilities
Regulator
Utility
Customer
Shareholder /Owner

Part 1: IntroductionRevenue Requirement
Revenue Requirement:The revenue that a regulated utility needs to earn in a test year in order to provide adequate service to its customers and a fair return for its shareholders.
9

Part 1: IntroductionCOST OF SERVICE / RATE OF RETURN REGULATION
Forecast of Revenues at Existing RatesResidential, Commercial, Industrial
(sales and transportation) + Other Revenue
= “Revenue Forecast”Forecast of Expenses for the yearCost of gas + OM&A + property taxes
+ Depreciation / Amortization + Incometaxes + rate base return (interest, ROE)
= “Revenue Requirement”
If Revenue Requirement < Revenue ForecastUtility applies forRate Decrease
If Revenue Requirement > Revenue ForecastUtility applies forRate Increase
10

Part 1: IntroductionCost or Value
Who determines the price? The provider - Cost based
• Price determined by the cost incurred by the provider of the product or a service and not by the price the purchasers are willing to pay.
The purchaser - Value based (market value)• Price based on what purchasers are willing to pay.• Purchasers make decisions by comparing prices of similar products or services offered by other competing providers.• In a perfectly competitive market, the cost-based price of the most efficient producer will set the market price. Less efficient producers must meet this price to stay in business; an incentive to be efficient.
11

Part 1: IntroductionTop Down vs. Bottom up
= Revenue Requirement+ Cost of Gas+ OM&A+ Depreciation+ Interest+ TaxesNet income (ROE)
Revenue- Cost of Goods Sold- Operating expenses- Depreciation- Interest- Taxes= Net income
Competitive Business Regulated Gas Utility
12

Part 1: IntroductionRate Case Evidence
Test Year – budget forecast for future year
Bridge Year or Base Year – budget estimate for current year
Historical Year – financial results for the last completed year
13
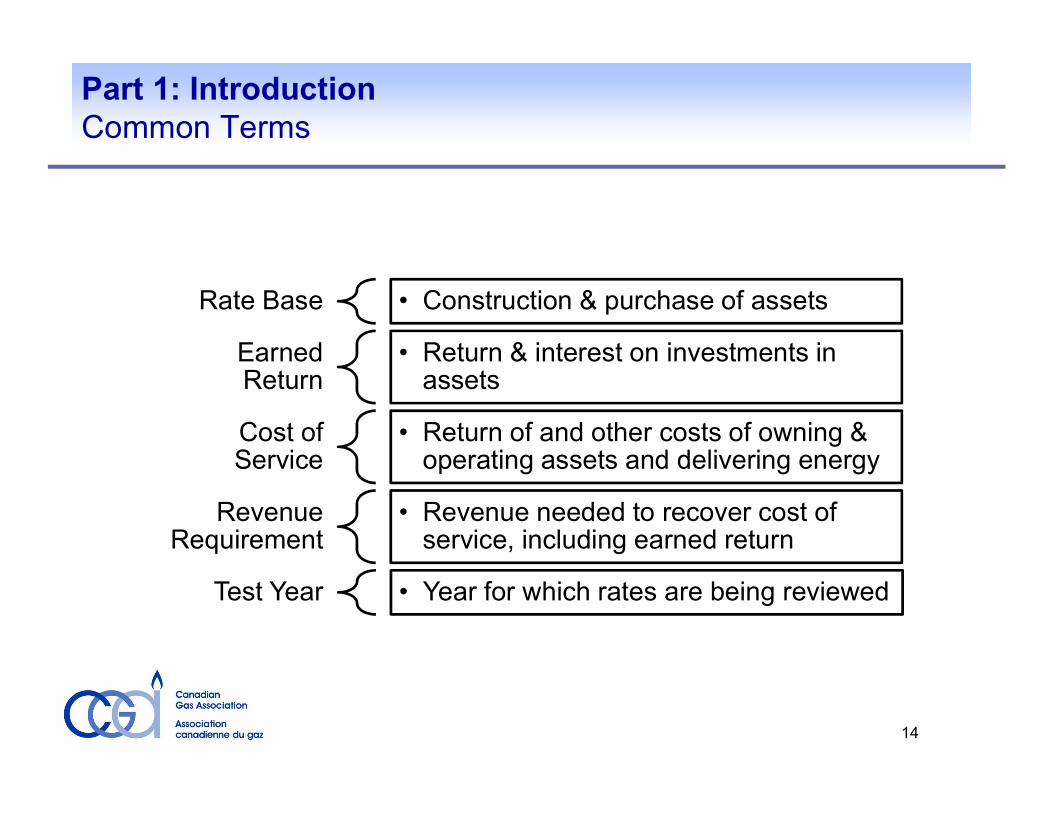
Part 1: IntroductionCommon Terms
14
Rate Base • Construction & purchase of assetsEarned Return • Return & interest on investments in assetsCost of Service • Return of and other costs of owning & operating assets and delivering energy
Revenue Requirement • Revenue needed to recover cost of service, including earned returnTest Year • Year for which rates are being reviewed

Part 1: IntroductionRevenue Requirement Formula
RR = G + OMA + D + T + r(RB)RR = revenue requirement r = return on rate baseRB = rate base = (OC - AD)OC = original cost of assets when placed in serviceAD = accumulated depreciation on assets since placed in serviceG= cost of gas soldOMA = operating, maintenance and administration expenseD = depreciation and amortization expenseT = income tax expense r(RB) = return on rate base or cost of capitalG + OMA + D + T is sometimes referred to as “cost of service” while others refer to revenue requirement as “cost of service”
15

Part 1: IntroductionTypical Corporate Structure
Gas Distribution DivisionRegulated Utility
Gas Storage DivisionRegulated Utility
Gas Transmission DivisionRegulated Utility
Non-utility Business DivisionUnregulated
SubsidiaryGas Company
Commodity Marketing DivisionUnregulated
Retail Services DivisionUnregulated
SubsidiaryEnergy Services Company
Parent Energy CompanyUnregulated
16
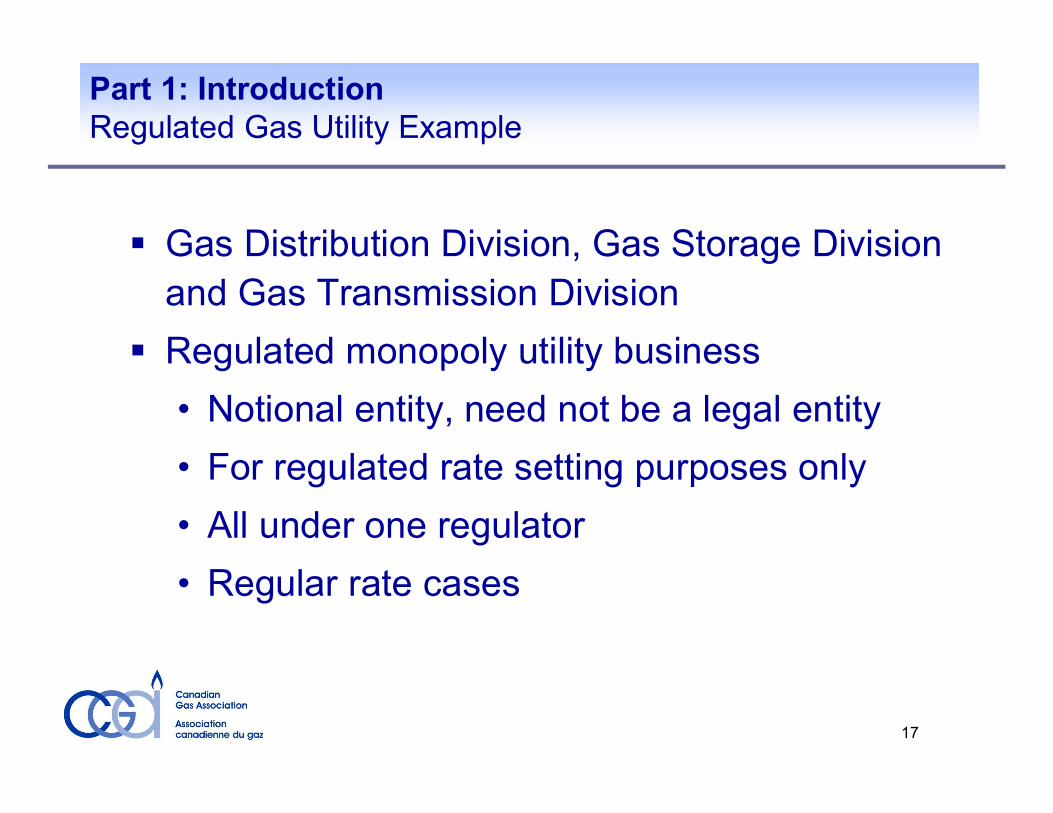
Part 1: IntroductionRegulated Gas Utility Example
Gas Distribution Division, Gas Storage Division and Gas Transmission Division
Regulated monopoly utility business• Notional entity, need not be a legal entity• For regulated rate setting purposes only• All under one regulator• Regular rate cases
17

Generally Accepted Regulatory Principles
(GARP)
18
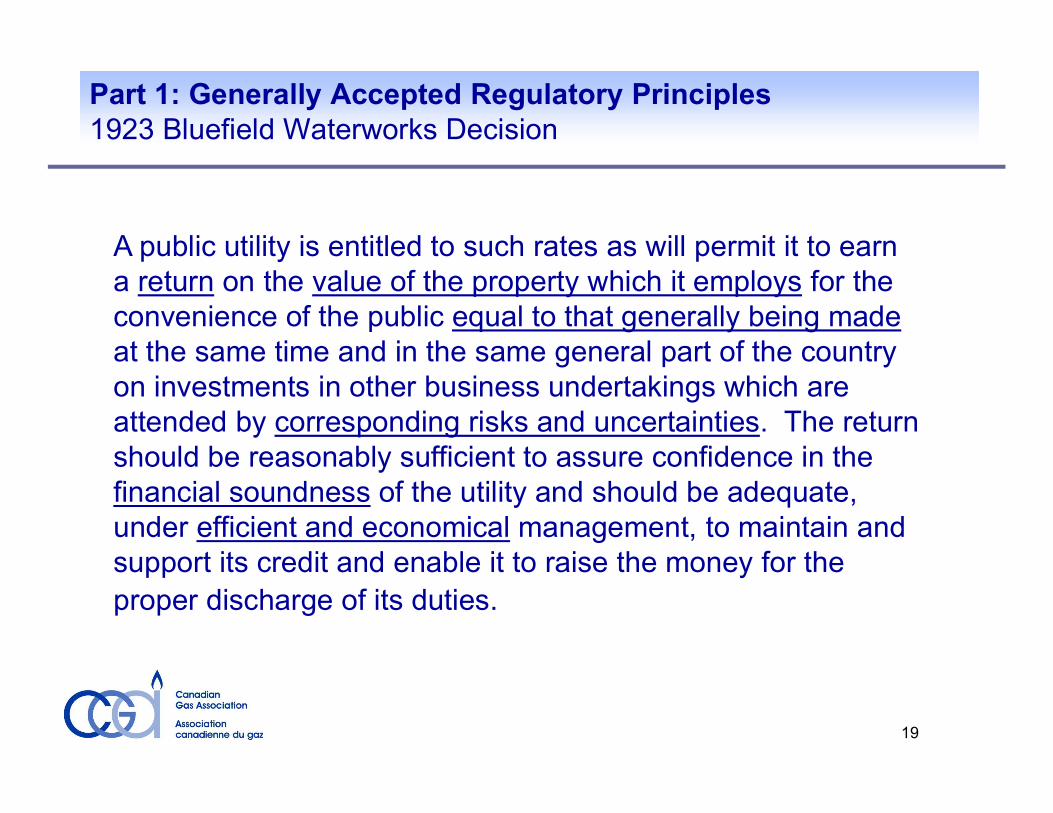
Part 1: Generally Accepted Regulatory Principles 1923 Bluefield Waterworks Decision
A public utility is entitled to such rates as will permit it to earn a return on the value of the property which it employs for the convenience of the public equal to that generally being madeat the same time and in the same general part of the country on investments in other business undertakings which are attended by corresponding risks and uncertainties. The return should be reasonably sufficient to assure confidence in the financial soundness of the utility and should be adequate, under efficient and economical management, to maintain and support its credit and enable it to raise the money for the proper discharge of its duties.
19

Part 1: Generally Accepted Regulatory Principles GARP
20
Generally Accepted Regulatory Principles• Rates based on reasonable costs prudently incurred in providing necessary service to ratepayers• Annual rates are based on annual costs• All costs including taxes are on a utility stand-alone basis• Utility evidence is presented from ratepayer perspective • Fairness to ratepayers and shareholders

Part 1: Generally Accepted Regulatory Principles CIAC, AFUDC and IDC
CIAC: Contribution-in-aid-of-Construction• Funds contributed by a customer toward a capital project
AFUDC: Allowance for Funds Used During Construction• a charge permitted by the regulator to cover the financing
of a utility capital project while under construction• AFUDC is based on approved cost of capital (i.e. it has
debt and equity components)• AFUDC added to the project capital cost on completion.
IDC: Interest During Construction• Like AFUDC only based on debt interest costs only
21

Part 1: Generally Accepted Regulatory Principles GARP and GAAP Balance Sheet
Left Side Right SideGAAP
Assets Net of accumulated depreciation at a point in time, may include interest but excluding CIAC or Equity Financing Costs
Liabilities & Owners’ EquityAt a point in time
GARP
Rate BaseAnnual average net of accumulated depreciation, excluding CIAC, but including AFUDC or Interest
Capital StructureAnnual average
22

Revenue Requirement ExampleFortisBC Energy Inc.
2015 Test Year
23
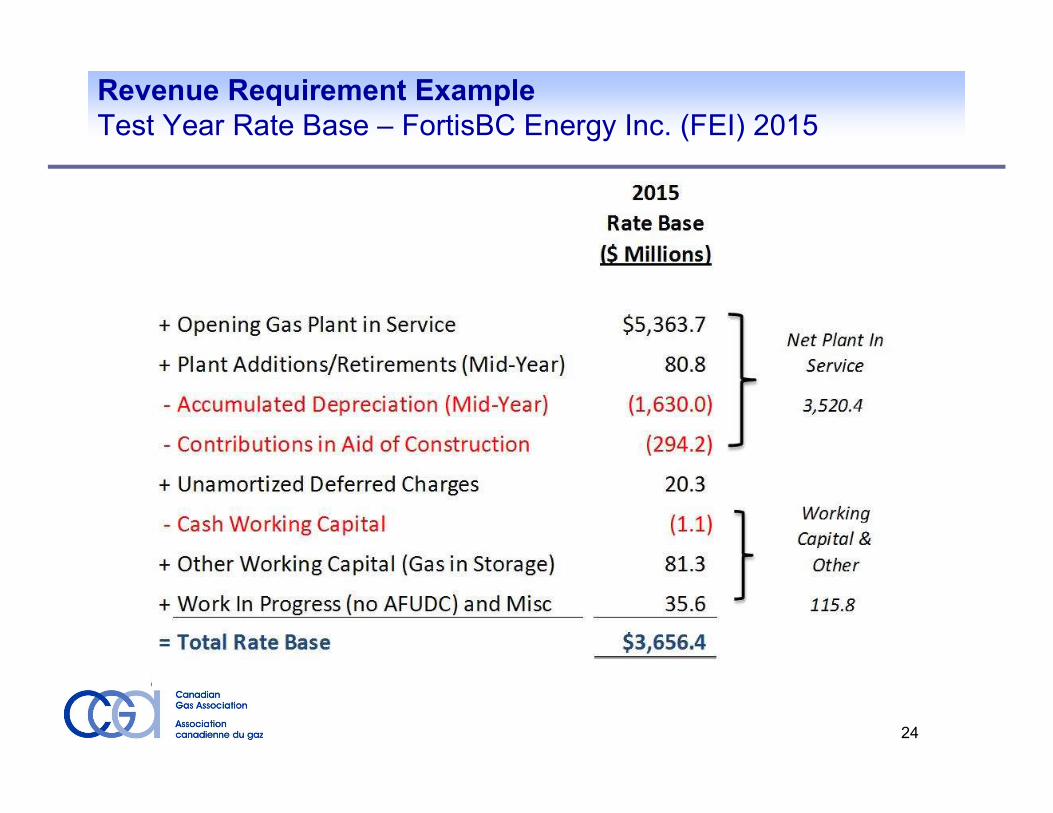
Revenue Requirement Example Test Year Rate Base – FortisBC Energy Inc. (FEI) 2015
24

Revenue Requirement Example Test Year Capital Structure and Return – FEI 2015
25
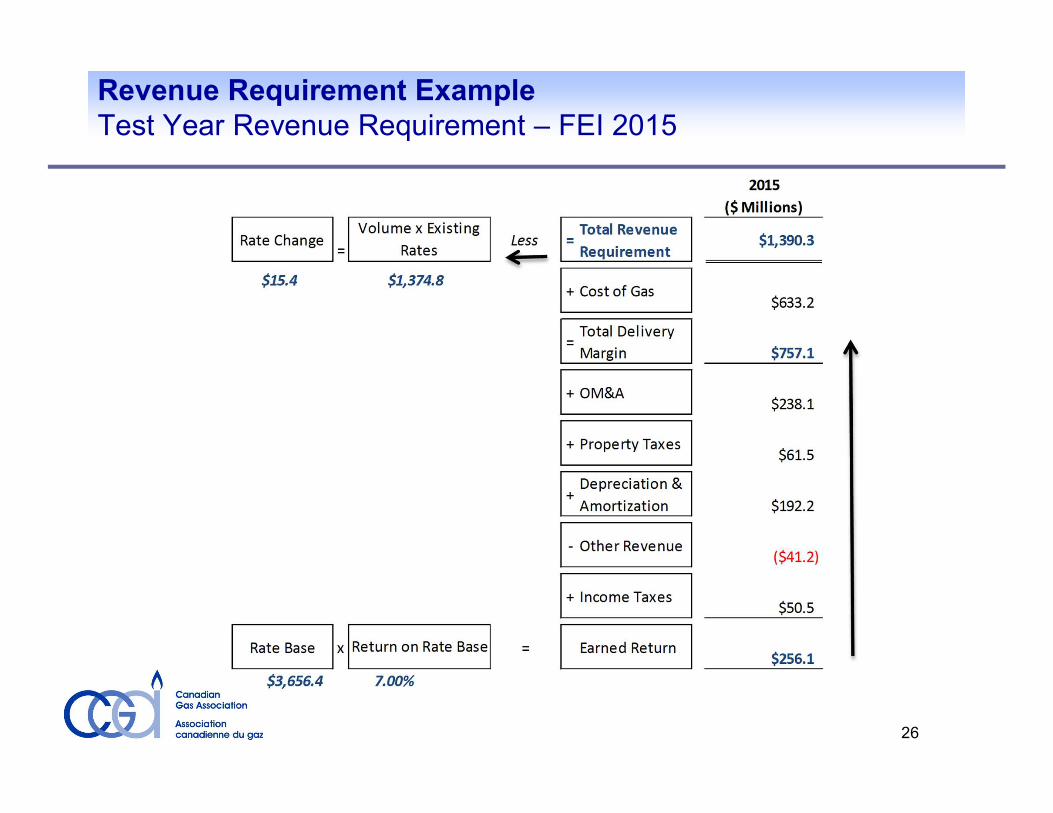
Revenue Requirement Example Test Year Revenue Requirement – FEI 2015
26

Revenue Requirement Example Factors leading to 2015 Revenue Deficiency
27
2.440
1.685 10.135
4.125 1.522
(0.796)
1.572 15.379
-
2.000
4.000
6.000
8.000
10.000
12.000
14.000
16.000
18.000
DemandForecast
Other Revenue O&M Depreciation &Amortization
Financing andReturn on
EquityTaxes 2015 Deficiency
Formula
Forecast
(1.179)
2.03% Delivery Rate Impact

Revenue Requirement Example Revenue Requirement and Rate Increase Summary
($millions)RR = G + OMA + D + T + r(RB) RR = 633.2 + (238.6 + 61) + 192.2 + 50.5 + 256.1RR = 1,431.5Revenue at Existing Rates (+ Other Revenue) = 1,416.0Revenue Deficiency or Rate Increase = 15.4Revenue Requirement or
Revenue at Proposed Rates = $1,431.5
28
Rate Base“…the value of the property which [the utility] employs for the convenience of
the public…”
29

Part 1: Rate Base Rate Base Components and Categories
Rate Base Components $ Millions Account Categories
Property, Plant and Equipment (forecast average, net of CIAC, net of accumulated depreciation- net gas plant in service)
$3,520.4 Storage PlantTransmission PlantDistribution PlantGeneral Plant
Allowance for Working Capital & Other (forecast for the Test Year)
115.8 Gas-in-storageMaterials & Supplies InventorySecurity DepositsCash Working Capital
Deferred Charges (Regulatory Assets & Liabilities)
20.3 Energy Cost Variance AccountsDSM incentivesNon-Controllable Cost VariancesApplication CostsAccounting Related
Total Rate Base (total average Test Year assets providing service to ratepayers)
$3,656.4
Revenue Requirement
To Cost of Service
30

Rate Base: Storage Plant
Liquefied Natural Gas Facility
31

Rate Base: Transmission Plant Southern Crossing Pipeline Compressor Station
32

Rate Base: Distribution Plant
Service Line Tie-in to MainMeter Installation
33

Rate Base: General PlantOperations Centre / Office Building
34

Part 1: Rate Base Rate Base Calculation Principles
Rate base - the net value of utility’s assets used in providing service to customers
Revenue Requirement
Original Cost AFUDC/IDC Accumulated DepreciationContributions In Aid or Contributed Capital
Net Gas Plant In Service
Average
35

Part 1: Rate Base Calculation of Rate Base Average
Simple Annual Average• (opening balance + closing balance)/2
Average of Monthly Averages• ((month1 avg) + (month2 avg) + …+ (month 12 avg))/12• The formula can be restated as follows:• (Jan.1)/24 + (Jan.31+Feb.28+…Nov.30)/12 + (Dec.31)/24
13-Month Average• (Jan.1 + Jan.31 + Feb.28 +…+ Nov.30 + Dec.31)/13
36

Part 1: Rate Base Regulatory Treatment of Work-in-Progress
37
Work-in-progress (“WIP”) is not in rate base (if AFUDC or IDC is charged)
Allowed to charge AFUDC or IDC to recover capital project financing costsAFUDC or IDC is added to asset cost
AFUDC or IDC is recovered through depreciation expense charged in rates over the life of the asset

2015 Revenue RequirementsFormula Based Capital Expenditures
$90,131
38
$(20.0) $-
$20.0 $40.0 $60.0 $80.0
$100.0 $120.0 $140.0 $160.0 $180.0
2015 Formula GrowthCapex
2015 Formula OtherCapex Total 2015
2014 Base Inflation Customer Growth Non-Formula
Different Growth Factors

Part 1: Rate Base Original Cost- Capital Budget vs. Rate Base Additions
Revenue Requirement
Formula Driven
39
Line 2015 No. Particulars Forecast
(1) (2)1 CAPITAL EXPENDITURES 23 Growth Capital Expenditures $ 28,480 4 Sustaiment and Other Capital Expenditures 117,213 5 Forecast Capital Expenditures 10,611 6 CIAC 6,448 7 Total Regular Capital Expenditures $ 162,752 89 Special Projects - CPCN's 1011 Huntingdon Station 7,654 12 Tilbury Expansion 156,463 13 Total CPCN's $ 164,117 1415 TOTAL CAPITAL EXPENDITURES $ 326,869 16

Part 1: Rate Base Original Cost + AFUDC- Capital Budget vs. Rate Base Additions
Revenue Requirement
From O&M
Rate Base
40
Line 2015No. Particulars Forecast
(1) (2)18 RECONCILIATION OF CAPITAL EXPENDITURES TO PLANT ADDITIONS1920 Regular Capital21 Regular Capital Expenditures 162,752$ 22 Add - Opening WIP 64,926 23 Less - Closing WIP (60,516) 24 Subtotal 167,162 25 Add - AFUDC 1,996 26 Add - Overhead Capitalized 32,548 2728 TOTAL REGULAR CAPITAL ADDITIONS TO GAS PLANT IN SERVICE 201,706$ 2930 Special Projects - CPCN's31 CPCN Expenditures 164,117$ 32 Add - Opening WIP 150,677 33 Less - Closing WIP (329,488) 34 Subtotal (14,694) 35 Add - AFUDC 14,694 3637 TOTAL CPCN ADDITIONS -$ 3839 TOTAL PLANT ADDITIONS 201,706$ 40
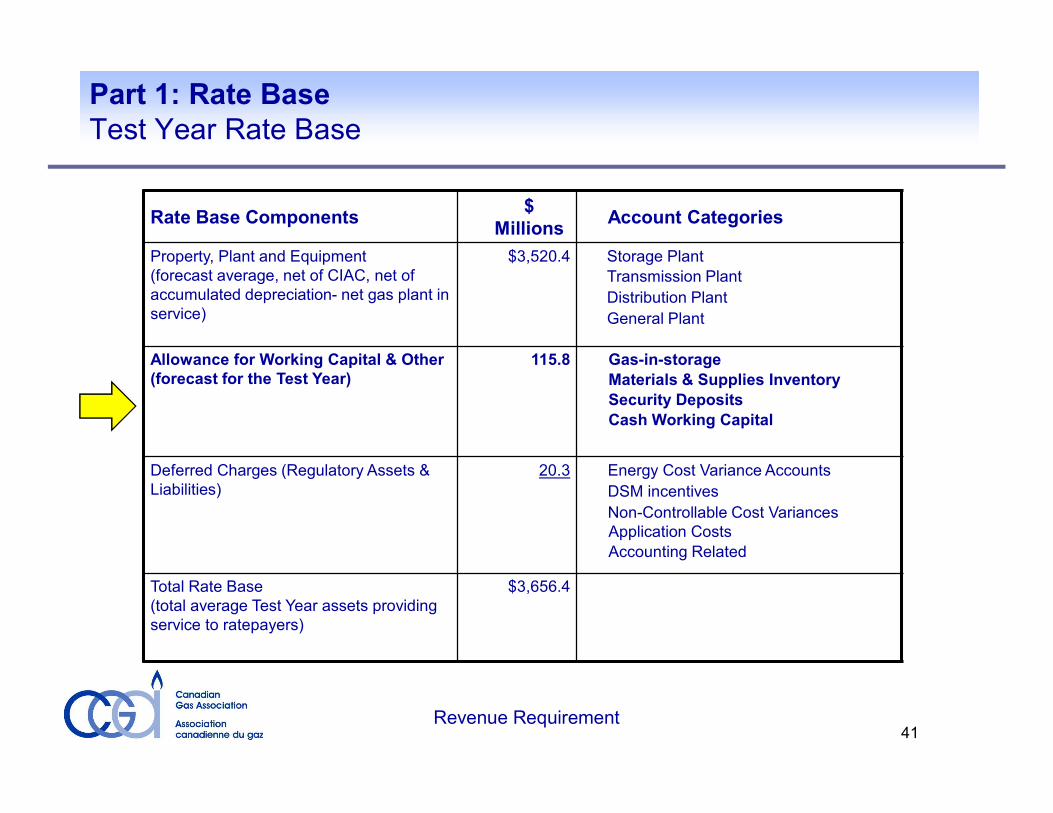
Part 1: Rate Base Test Year Rate Base
Revenue Requirement 41
Rate Base Components $ Millions Account Categories
Property, Plant and Equipment (forecast average, net of CIAC, net of accumulated depreciation- net gas plant in service)
$3,520.4 Storage PlantTransmission PlantDistribution PlantGeneral Plant
Allowance for Working Capital & Other (forecast for the Test Year)
115.8 Gas-in-storageMaterials & Supplies InventorySecurity DepositsCash Working Capital
Deferred Charges (Regulatory Assets & Liabilities)
20.3 Energy Cost Variance AccountsDSM incentivesNon-Controllable Cost VariancesApplication CostsAccounting Related
Total Rate Base (total average Test Year assets providing service to ratepayers)
$3,656.4

Part 1: Rate Base Working Capital Calculation
Determined on an annual average basis• Different from financial statements, which is at a point in time (Current Assets –Current Liabilities)
Cash working capital• Allowance for timing of cash inflows & outflows• Lead Lag Study (most common)• Varies amongst utilities
Other Working Capital• Primarily gas in storage• Determined using forecast balances of gas in storage and forecast forward prices
Revenue Requirement 42
Accounts for the net financing costs associated with day to day operations

Part 1: Rate Base Working Capital Allowance
Revenue Requirement
Lead Lag Study
13 Month Average
43
2015Line Existing 2014 RevisedNo. Particulars Rates Rates
(1) (3) (4)1 Cash Working Capital 2 Cash Required for 3 Operating Expenses $ 11,727 $ 12,097 456 Less - Funds Available: 78 Reserve for Bad Debts (7,927) (7,927)910 Withholdings From Employees (5,292) (5,292)1112 Subtotal (1,492) (1,122)1314 Other Working Capital Items 15 Construction Advances (13) (13)16 Transmission Line Pack Gas 2,251 2,251 17 Gas in Storage 77,811 77,811 18 Inventory - Materials & Supplies 1,567 1,567 19 Refundable Contributions (298) (298)2021 Subtotal 81,318 81,318 2223 Total $ 79,826 $ 80,196

Part 1: Rate Base Test Year Rate Base
Revenue Requirement 44
Rate Base Components $ Millions Account Categories
Property, Plant and Equipment (forecast average, net of CIAC, net of accumulated depreciation- net gas plant in service)
$3,520.4 Storage PlantTransmission PlantDistribution PlantGeneral Plant
Allowance for Working Capital & Other (forecast for the Test Year)
115.8 Gas-in-storageMaterials & Supplies InventorySecurity DepositsCash Working Capital
Deferred Charges (Regulatory Assets & Liabilities)
20.3 Energy Cost Variance AccountsDSM incentivesNon-Controllable Cost VariancesApplication CostsAccounting Related
Total Rate Base (total average Test Year assets providing service to ratepayers)
$3,656.4

Part 1: Rate Base Deferred Charges (Regulatory Assets & Liabilities)
Common examples of deferral accounts are in the following areas:• Cost of Gas – Purchased Gas Variance Account or PGVA• Taxes - Income or property tax changes not anticipated in the test year • Interest rates• Demand Side Management incentive grants• Extraordinary losses caused by disasters and other unusual circumstances
Rate base treatment of deferral accounts varies by jurisdiction
Revenue Requirement 45
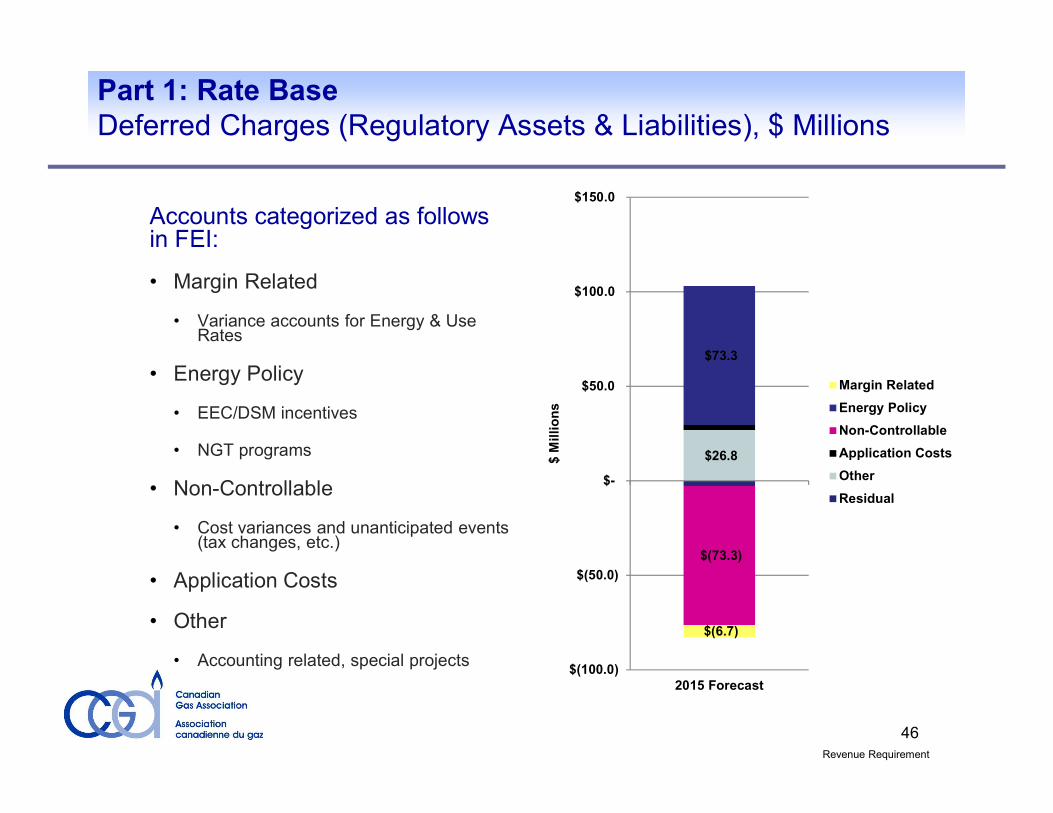
Accounts categorized as follows in FEI:• Margin Related
• Variance accounts for Energy & Use Rates• Energy Policy
• EEC/DSM incentives• NGT programs
• Non-Controllable• Cost variances and unanticipated events (tax changes, etc.)
• Application Costs• Other
• Accounting related, special projects
Part 1: Rate Base Deferred Charges (Regulatory Assets & Liabilities), $ Millions
Revenue Requirement46
$26.8
$(73.3)
$73.3
$(6.7)
$(100.0)
$(50.0)
$-
$50.0
$100.0
$150.0
2015 Forecast
$ Millio
ns
Margin RelatedEnergy PolicyNon-ControllableApplication CostsOtherResidual
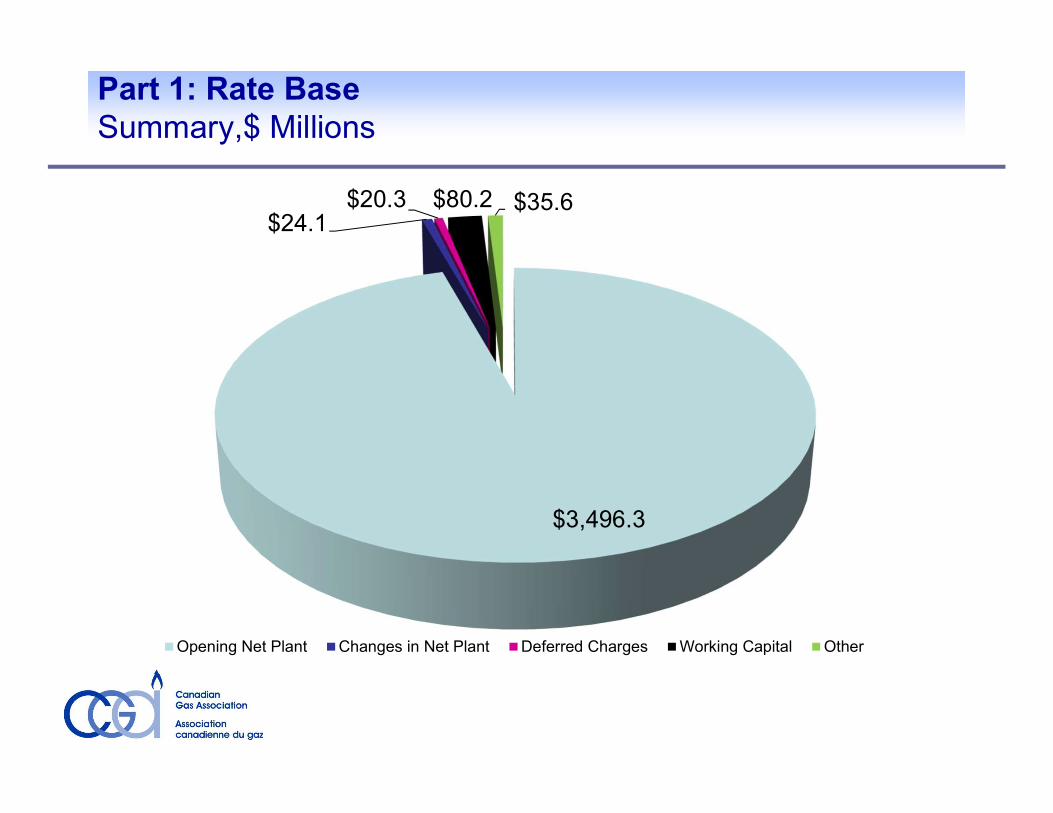
Part 1: Rate Base Summary,$ Millions
$3,496.3
$24.1 $20.3 $80.2 $35.6
Opening Net Plant Changes in Net Plant Deferred Charges Working Capital Other

Cost of Capital“…a return … equal to that generally being made at the same time… on investments in other business undertakings which are attended by corresponding risks and uncertainties. The return should be reasonably sufficient to assure confidence in the financial soundness of the utility … to maintain and support its credit and enable it to raise the money for the proper discharge of its duties.”
48

Part 1: Cost of Capital Test Year Cost of Capital and Return on Rate Base
49

Part 1: Cost of CapitalComponents of Capital Structure
Long Term Debt• Amounts are averages of existing and forecast amounts• Net of un-amortized finance charges and profit/loss on redemption• Existing debt and preference capital – at actual rates• New debt and preference capital – at forecast rates from economic forecast
Short Term Debt• Short term debt amount is the amount required to balance rate base –actual and forecast amounts of short term debt are not used• Rate is obtained from the economic forecast of rates on a monthly basis for the test yearCommon Equity• The amount is usually deemed by the regulator based on the risk of the utility’s business – actual common equity is not used• The utility requests approval of a return on equity (“ROE”) for the test year based on evidence of economists• In some jurisdictions a formula is used to determine the allowed ROE
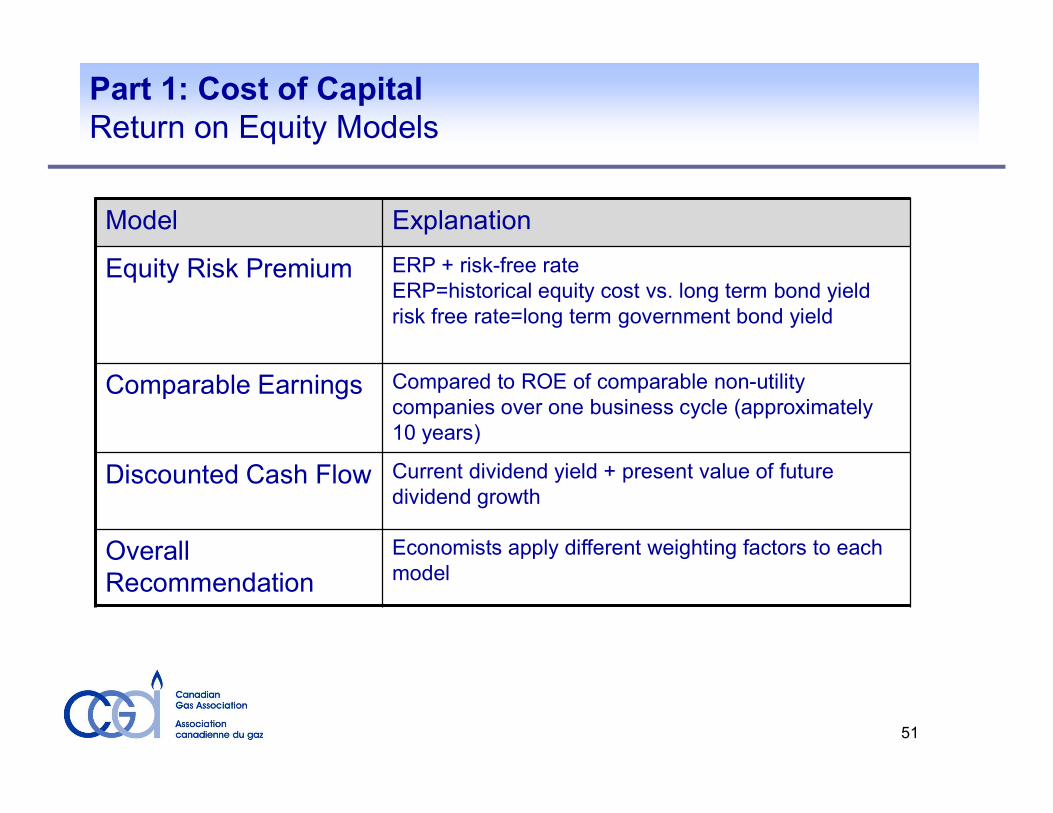
Part 1: Cost of Capital Return on Equity Models
Model ExplanationEquity Risk Premium ERP + risk-free rate
ERP=historical equity cost vs. long term bond yield risk free rate=long term government bond yield
Comparable Earnings Compared to ROE of comparable non-utility companies over one business cycle (approximately 10 years)
Discounted Cash Flow Current dividend yield + present value of future dividend growth
Overall Recommendation
Economists apply different weighting factors to each model
51

Part 1: Cost of Capital Formula Based Return on Equity Model
• Benchmark ROE set at 8.75%
• If Long Canada Bond is > 3.80% reset ROE– Benchmark ROE + 50% of change in Long Canada
Bond forecast + 50% of change in A rated Utility bond spread
52

Part 1: Revenue Requirement Revenue Requirement Equation
($millions)RR = G + OMA + D + T + r(RB) RR = G + OMA + D + T + (7.0% x $3,656.4) RR = G + OMA + D + T + 256.1
53

Cost Of Gas Sold
54

Part 1: Cost of Gas
Commodity-related costs receive different treatment from the cost of service of delivery-related cost components• Natural gas pricing is market-based.• Commodity options available – customer can select marketer or default utility options.
Commodity rate changes handled on a “flow-through” basis • Two commodity-related cost streams for FortisBC- commodity and mid-stream
Deferral accounts common to capture commodity cost variances
55

Part 1: Revenue RequirementSample Customer Bill
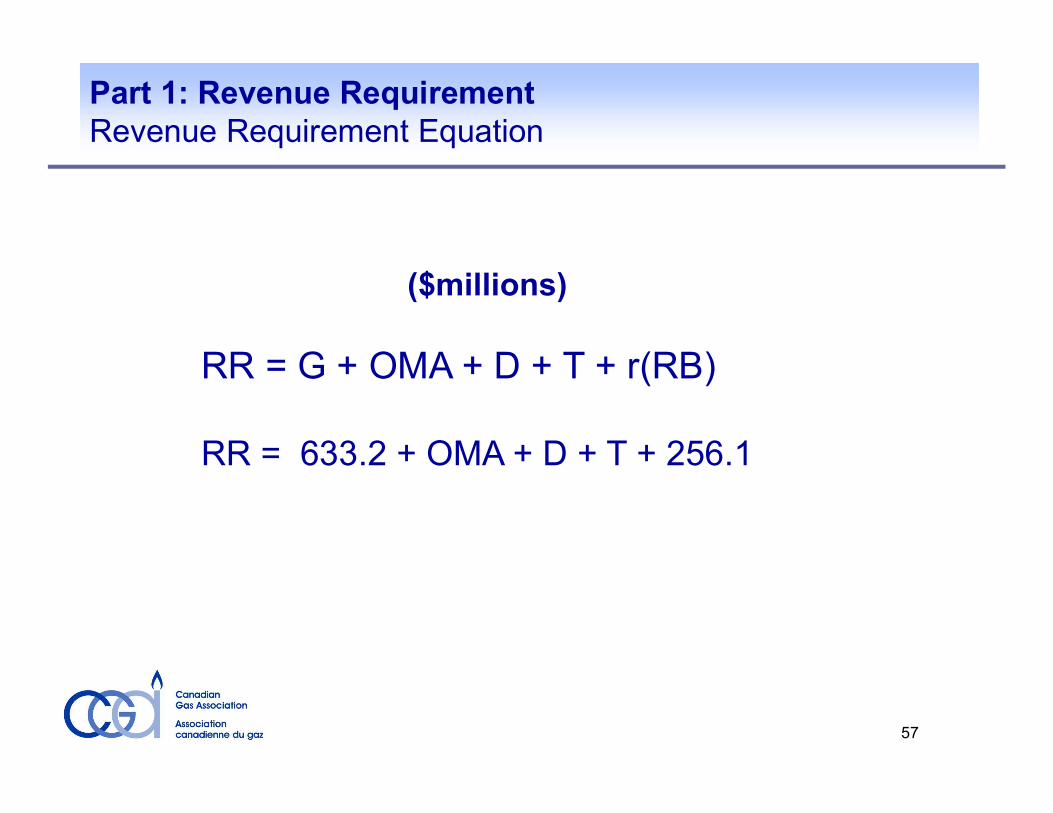
Part 1: Revenue Requirement Revenue Requirement Equation
($millions)RR = G + OMA + D + T + r(RB) RR = 633.2 + OMA + D + T + 256.1
57

Operating, Maintenance and Administration Expense
“…under efficient and economical management…”
58

Part 1: Operating, Maintenance and Administration Expense OM&A Categories
OM&A Account CategoriesPlant Operating and Maintenance Storage Plant O&M
Transmission O&MDistribution O&MGeneral Plant O&M
Customer Care and Marketing Meter readingCustomer Billing & AdministrationCall centreBad debt & Credit ManagementProgram marketing, e.g. DSM
Administration H.O., Finance & General AdministrationLegalInsuranceEmployee Benefits
59

Part 1: OM&A Expense
Two main views of OM&A expenses Activity-based view
• What are the activities carried out in a particular department or business unit (e.g. leak surveys, odorant costs, meter reading, billing, responding to service requests and customer enquiries, etc.)
Resource view• What resources are employed in delivering OM&A
activities (e.g. labour & benefits, materials, vehicle expenses, etc.)
60

2015 Revenue RequirementsFormula Based O&M Expense ($000)
“X” Factor
To Capital Additions
61
Line Description1 2014 Base O&M 234.0$ 2 x (1 + Net Inflation) 0.203%3 x (1 + Growth Factor) 0.614%4 2015 Formula O&M 235.9$ 5 Forecast O&M 35.4 6 Total Gross O&M 271.2 7 Capitalized Overhead (12%) (32.5) 8 Biomethane O&M transferred (0.6) 910 Net O&M 238.1$
$ millions

Part 1: OM&A Expense – Property Taxes
Property Taxes• Taxing authority granted to various municipal, provincial
and other public bodies by statute and regulation.• Property taxes are generally based on assessed
property values and mill rates but in some cases there are revenue-based taxes
• Utility property tax rates tend to be among the highest
62
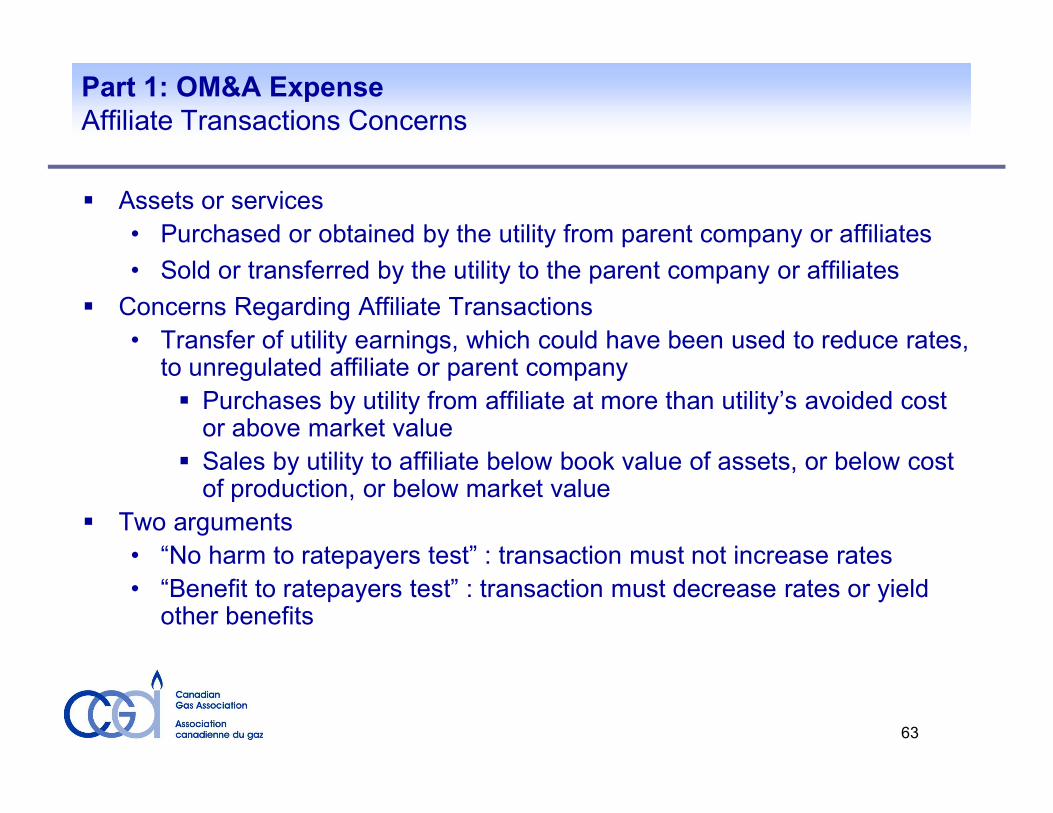
Part 1: OM&A ExpenseAffiliate Transactions Concerns Assets or services
• Purchased or obtained by the utility from parent company or affiliates• Sold or transferred by the utility to the parent company or affiliates
Concerns Regarding Affiliate Transactions• Transfer of utility earnings, which could have been used to reduce rates, to unregulated affiliate or parent company
Purchases by utility from affiliate at more than utility’s avoided cost or above market value Sales by utility to affiliate below book value of assets, or below cost of production, or below market value
Two arguments• “No harm to ratepayers test” : transaction must not increase rates • “Benefit to ratepayers test” : transaction must decrease rates or yield other benefits
63

Part 1: Revenue Requirement Revenue Requirement Equation
($millions)
RR = G + OMA + D + T + r(RB)
RR = 633.2 + (238.1+61.5) + D + T + 256.1
64

Depreciation and Amortization Expense
“…the value of the property which [the utility] employs for the convenience of the public…”
65

Part 1: Depreciation and Amortization Expense Test Year Depreciation and Amortization Expense
Depreciation & Amortization
Expense$millions
Storage Plant $ 7.4Transmission Plant 30.5Distribution Plant 87.3General Plant 39.1Total Depreciation Expense 164.3Amortization of CIAC (8.9)Amortization of Deferred Charges 36.8Total $ 192.2
Revenue Requirement
Example
66

Part 1: Depreciation and Amortization Expense General Concepts
Revenue Requirement
Pooled AssetsDepreciation Rate Based on “Useful” Life of Pool
Rates determined by Third Party Study
Code of Accounts as Determined by Regulator
Varying Amortization Periods for Deferred Charges
67

Part 1: Depreciation and Amortization Expense Distribution Plant Depreciation Expense
Gross Plant Balance
Depreciation Rate
Depreciation Expense
$ millions % $ millionsLand 4.2 0.0 % 0.0Services 1,026.5 2.37 % 24.2Mains 1,311.1 1.55% 20.5Meters 231.2 7.82% 17.5Other 451.6 25.1Total 87.3
68

Part 1: Depreciation and Amortization Expense General Calculation of Depreciation Expense
Revenue Requirement
Opening Gas Plant BalanceGas Plant Additions Gas Plant Retirements Depreciation Rate Depreciation Expense
Adjusted for Timing
69

Part 1: Depreciation and Amortization Expense Net Mains Cost in Rate Base
Opening Balance
Additions Retirements RetirementCosts
Closing Balance
$millions $millions $millions $millions $millionsGross Plant 1,311.1 29.5 (1.4) 1,339.3Accumulated Depreciation
(416.6) *(20.5) 1.4 (435.7)
Net Plant 894.5 9.0 **0.0 903.6
* Accumulated depreciation additions are the annual deprecation expense**Note that ordinary retirements do not change rate base
70
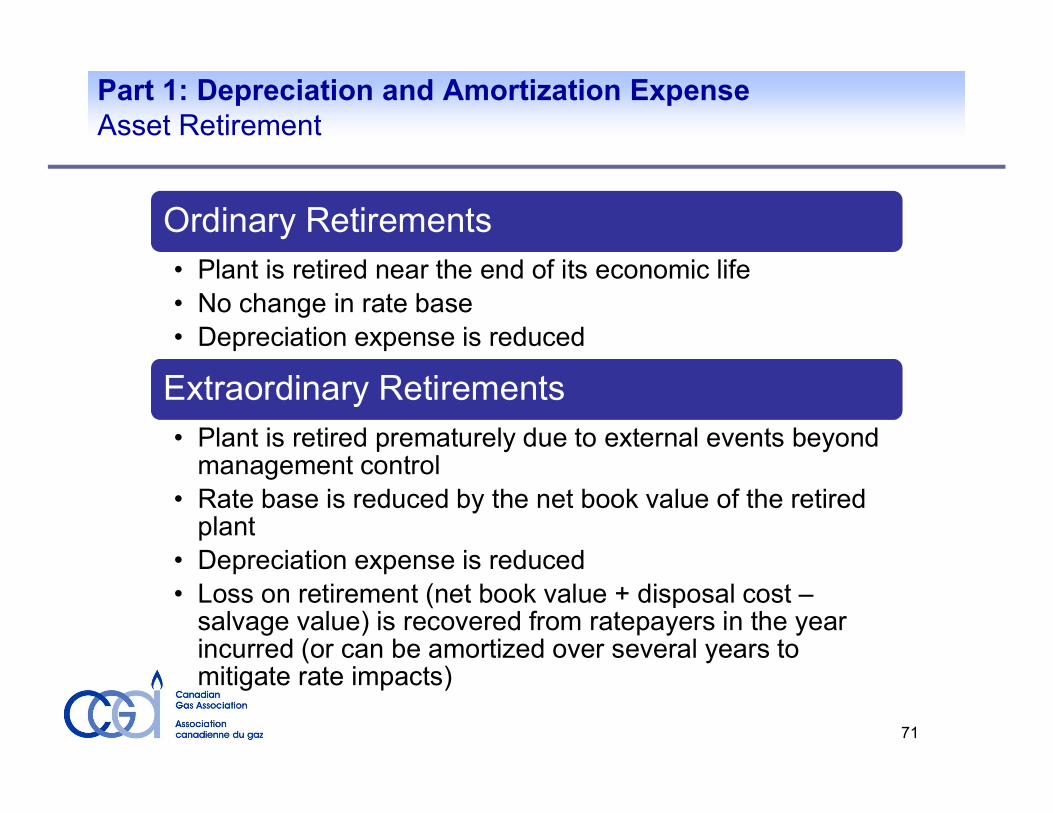
Part 1: Depreciation and Amortization Expense Asset Retirement
Ordinary Retirements• Plant is retired near the end of its economic life • No change in rate base • Depreciation expense is reduced
Extraordinary Retirements• Plant is retired prematurely due to external events beyond management control• Rate base is reduced by the net book value of the retired plant• Depreciation expense is reduced• Loss on retirement (net book value + disposal cost –salvage value) is recovered from ratepayers in the year incurred (or can be amortized over several years to mitigate rate impacts)
71

Part 1: Revenue Requirement Revenue Requirement Equation
($millions)
RR = G + OMA + D + T + r(RB)
RR = 633.2 + (238.1+61.5) + 192.2 + T + 256.1
72

Revenue Forecast “…under efficient and
economical management…”
73

Part 1: Revenue Forecast Use per Customer Rates
• Use rate forecast x number of customers (per rate schedule) to get forecast demand
• Decline in use per customer creates rate challenges as the addition of new customers is currently not great enough to offset
74
FEI Normalized Residential Use Per Customer FEI Normalized Residential Demand

Part 1: Revenue Forecast Forecast Volumes and Margin
75
Notes:1 Rate Schedule 12 Rate Schedules 2, 3, 233 Rate Schedules 4, 5, 6, 6P, 16, 46, 7, 22, 25, 27, BurrardThermal, Joint Venture, BC Hydro/Island Cogeneration Project

Part 1: Revenue Forecast Regulation of Other Revenue What is other revenue?
• Other revenue is generally utility revenue which is not rate regulated, I.e. its rates are not set by an order of the regulator• Utility assets and employees are used to generate other revenue• Examples: NGV programs; appliance sales, rentals and service; agent billing and collection service, transactional services
How is it regulated?• Utility may need to demonstrate that the rate of return (ROR) on utility assets used for other revenue is equal to or greater than the allowed base allowed by the regulator• If ROR is less than the allowed, then the regulator may impute revenue to this business to bring it up to the allowed ROR• Imputed revenue is a notional increase in other revenue which is not earned by the utility and reduces the allowed rate increase
76

Income Tax
77
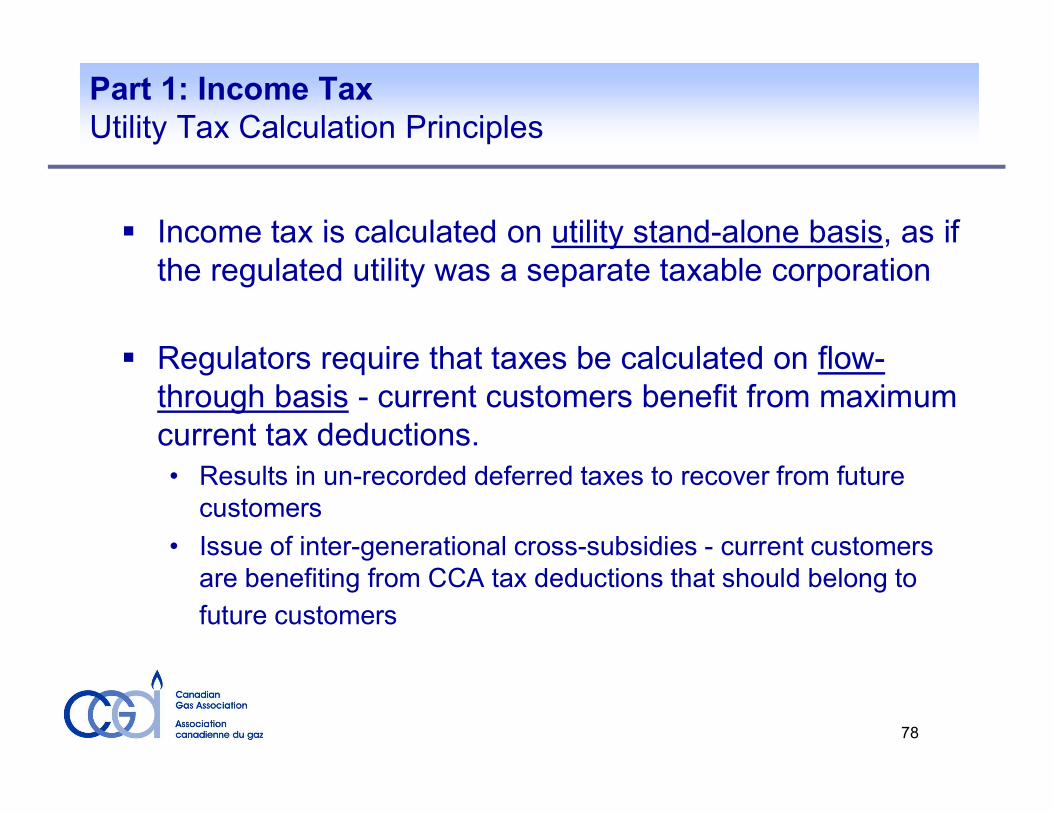
Part 1: Income Tax Utility Tax Calculation Principles
Income tax is calculated on utility stand-alone basis, as if the regulated utility was a separate taxable corporation
Regulators require that taxes be calculated on flow-through basis - current customers benefit from maximum current tax deductions.• Results in un-recorded deferred taxes to recover from future
customers • Issue of inter-generational cross-subsidies - current customers
are benefiting from CCA tax deductions that should belong to future customers
78

Part 1: Income Tax Utility Income Before Interest and Income Tax
$millions $millionsTotal Revenue at Existing Rates $1,416.0Less Expenses:
Cost of Gas Sold 633.2OM&A Expense 238.1Property Tax 61.5Depreciation and Amortization Expense 192.2
Total Expenses 1,124.9Income before Interest & Income Tax $291.1
79

Part 1: Income Tax Taxable Income
Amount$millions
Income before Interest and Income Tax $291.1Deduct: Interest Expense (132.9)Add Non-deductible Items:
Depreciation / Amortization Expense 192.2Other Non-deductible Items 35.5
Subtract Deductible Items: Capital Cost Allowance (tax depreciation) (154.8)Capitalized Deductible Items (overhead costs) (10.8)Grossed-up Part VI.1 Tax (re: Preferred Shares)Other Deductible Items (41.6)
Taxable Income $178.7
80

Part 1: Income Tax Income Tax on Forecast Revenue at Existing Rates
Combined Federal / Provincial$millions
Taxable Income $178.7Income Tax Rate 26.0%
Income Tax on Revenues at Existing Rates $46.5
81
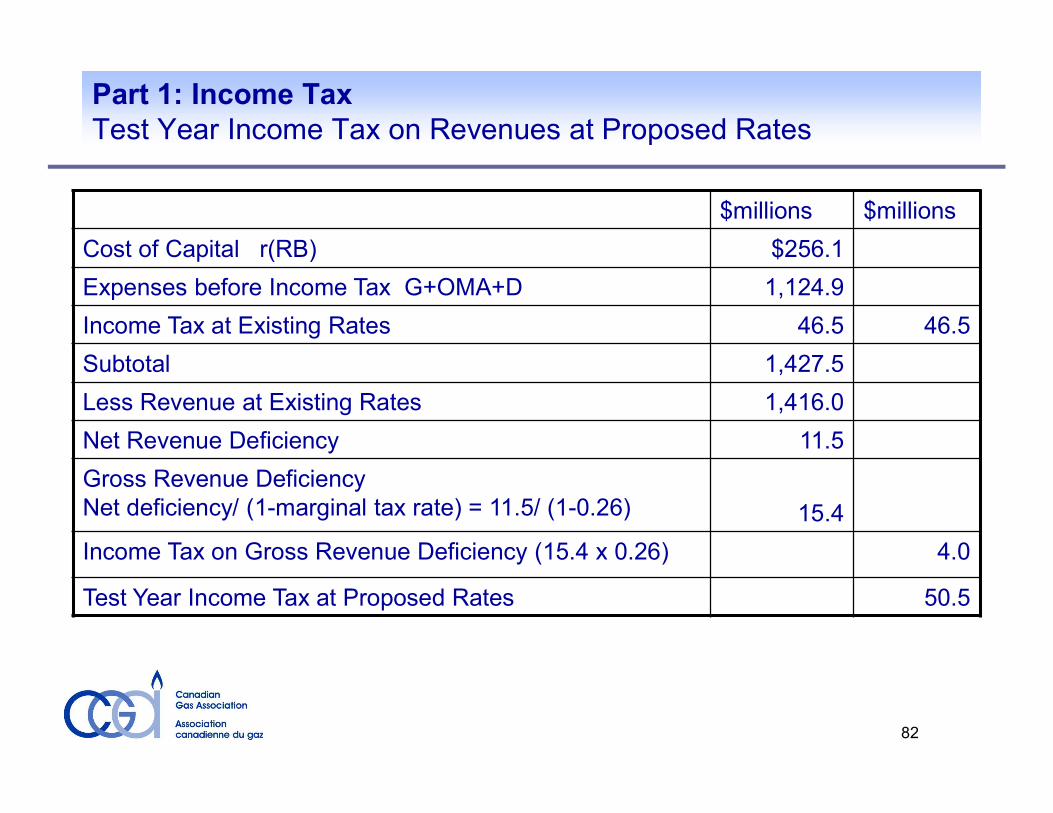
Part 1: Income Tax Test Year Income Tax on Revenues at Proposed Rates
$millions $millionsCost of Capital r(RB) $256.1Expenses before Income Tax G+OMA+D 1,124.9Income Tax at Existing Rates 46.5 46.5Subtotal 1,427.5Less Revenue at Existing Rates 1,416.0Net Revenue Deficiency 11.5Gross Revenue Deficiency Net deficiency/ (1-marginal tax rate) = 11.5/ (1-0.26) 15.4Income Tax on Gross Revenue Deficiency (15.4 x 0.26) 4.0Test Year Income Tax at Proposed Rates 50.5
82

Revenue Requirement Example Revenue Requirement and Rate Increase Summary
83
($millions)RR = G + OMA + D + T + r(RB) RR = 633.2 + (238.6 + 61) + 192.2 + 50.5 + 256.1RR = 1,431.5Revenue at Existing Rates (+ Other Revenue) = 1,416.0Revenue Deficiency or Rate Increase = 15.4Revenue Requirement or
Revenue at Proposed Rates = $1,431.5

Part 1: Revenue Requirement Recovery of Revenue Requirement from Ratepayers
Revenue Requirement increase is allocated to customer classes
Rates are designed to recover all of the Revenue Requirement in the test year based on forecast volumes• Revenue/year = number customers x volume/customer/year x revenue/volume• Rate = Revenue requirement / unit volume
More on cost allocation and rate design in later sessions
84

The Decision
85

Part 1: The Decision Regulator Balances Interests
For CustomersUtility service at fair and reasonable rates without undue discrimination or preference
For the UtilityRecover costs of providing service including a fair and reasonable return on the property employed in providing utility service.

Part 1: The Decision Regulator Balances Interests
Shareholders Existing Customers
Future CustomersSociety at Large
87
Revenue Requirements Rate Design
Cost AllocationCapital Projects

Part 1: The Decision Regulator Adjusts Revenue Requirement
Potential Areas of Adjustment
• Effect is reduced rate base, r(RB), depreciation expense, taxesDoes not approve certain capital expenditures
• Increases sales volumes and revenue forecast (with corresponding cost of gas) – revenue deficiency decreasesDecides that the revenue forecast is understated
• imputes additional revenue and decreases revenue deficiencyDecides that other revenue business should be at the allowed rate of return
• reduces OM&A costs and revenue deficiencyDecides that OM&A cost forecast is overstated
• ROE change affects r(RB) and taxes, interest change affects r(RB)Reduces ROE or debt interest rates
88

Part 1: The Decision Adjustments to Revenue Requirement – FEI 2015
89
$ Million
% Rate Change
Proposed Rate Change 15.4 2.03%Adjustments:
Update forecast inflation & interest rates to current information 0.4Increase to forecast Residential Customer use rate (6.0)Decrease to forecast NGT O&M (0.4)Revision to CIAC amortization* (2.2)Update to actual opening plant & deferral balances (1.4)Adjustments related to Amalgamation Decision (0.6)
Total Adjustments (10.2)Revised Rate Change 5.1 0.67%*oversight identified by FEI in preparing compliance filing
2015$
Million% Rate Change
Proposed Rate Change 15.4 2.03%Adjustments:
Update forecast inflation & interest rates to current information 0.4Increase to forecast Residential Customer use rate (6.0)Decrease to forecast NGT O&M (0.4)Revision to CIAC amortization* (2.2)Update to actual opening plant & deferral balances (1.4)Adjustments related to Amalgamation Decision (0.6)
Total Adjustments (10.2)Revised Rate Change 5.1 0.67%*oversight identified by FEI in preparing compliance filing
2015

Part 1: Cost of Service Regulation - Review & Summary Regulatory Process
Annual or regular rate hearings where the company is able to adjust rates on an annual basis in response to changes in costs Adequate evidence on each revenue requirement item to justify recovery in rates Forward test year - the company generally only spends what the regulator approves Company is at risk for forecast accuracy of revenue requirement components which are generally under management control Costs not under management control or otherwise subject to deferral are deferred and amortized in approved manner
• Variance accounts collect variances from forecast costs• Deferral accounts collect un-budgeted costs
90

Part 1: Cost of Service Regulation - Review & Summary Regulatory Process
ApplicationProcedural OrderNotificationInterventionProcedural ConferenceWorkshopDiscovery ProcessPre-Hearing or Procedural ConferenceOral Public HearingEvidentiary Record ClosedArgumentsDecision
Duration can be 3 months to over 1 yearDuration can be 3 months to over 1 year

Part 1: Cost of Service Regulation - Review & Summary Advantages of Cost of Service Regulation
Ability to recover the cost of providing service to existing customers
Ability to recover the cost of adding new customers Ability to minimize risk by the adjustment of forecasts,
generally on an regular basis Ability of utility shareholders to receive a stable ROE
over a long period of time
92

Part 1: Cost of Service Regulation - Review & Summary Disadvantages of Cost of Service Regulation
Long and expensive hearings to determine if the utility’s cost forecasts are reasonable.Suspicion that the utility is overstating costs and understating revenues in its forecasts.Little incentive for the utility to cut costs since future savings are passed on to customers. Prone to micro-management of the utility by the regulatorLimited flexibility to respond to changing market conditions.It is difficult for utility investors to earn a greater than allowed ROE even for superior performance. PBR may be a solution to some of these problems.
93

Regulatory Approval of Capital Expenditures An Overview
Approval of Capital Expenditures Part 2
94
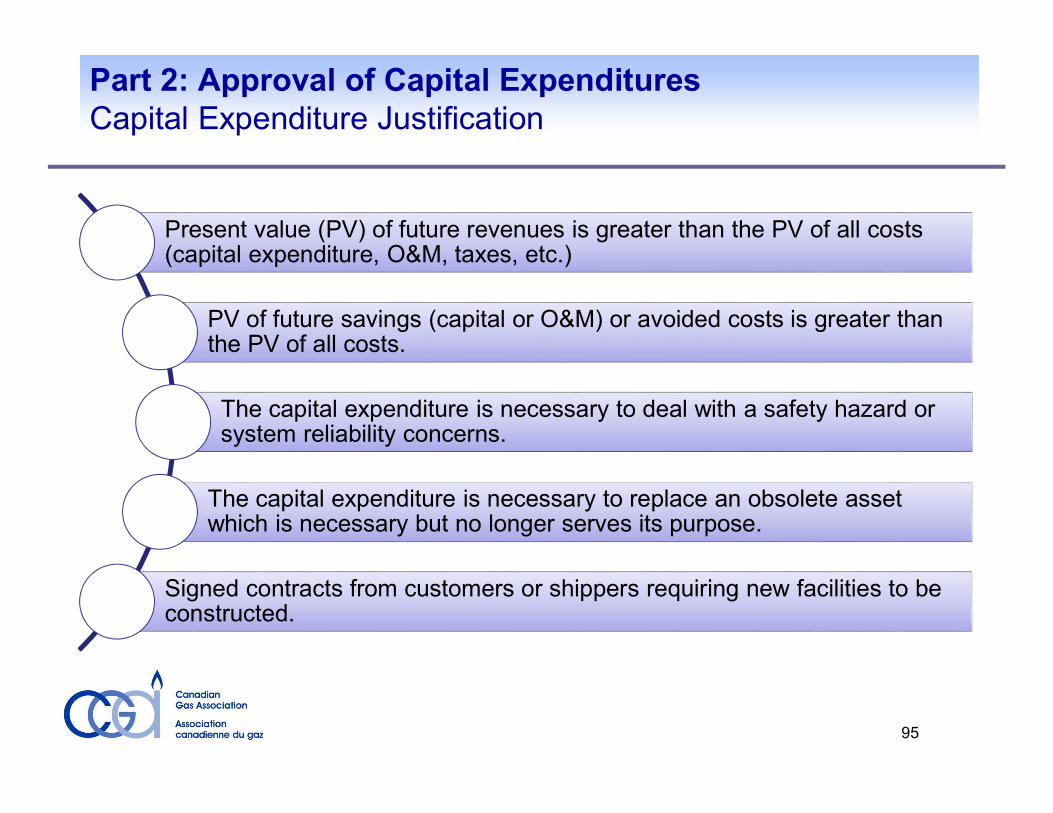
Part 2: Approval of Capital Expenditures Capital Expenditure Justification
Present value (PV) of future revenues is greater than the PV of all costs (capital expenditure, O&M, taxes, etc.)PV of future savings (capital or O&M) or avoided costs is greater than the PV of all costs.The capital expenditure is necessary to deal with a safety hazard or system reliability concerns.
The capital expenditure is necessary to replace an obsolete asset which is necessary but no longer serves its purpose. Signed contracts from customers or shippers requiring new facilities to be constructed.
95

Part 2: Approval of Capital Expenditures Cost Estimates of Capital Expenditures Engineering estimates based on similar recent projects “Courtesy bids” from contractors Quotes from vendors, preferably more than one In addition to the direct capital costs the estimate
includes:• Environmental costs• Contingency costs• Overhead costs• Regulatory approval costs
96
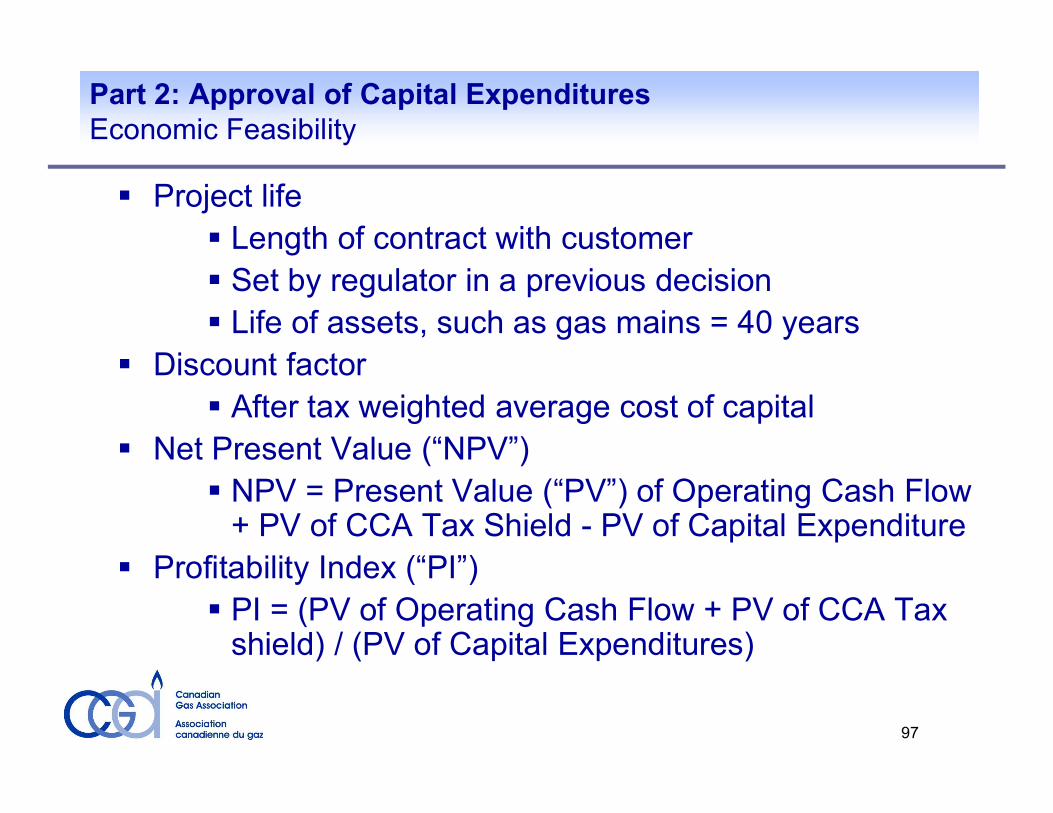
Part 2: Approval of Capital Expenditures Economic Feasibility Project life
Length of contract with customer Set by regulator in a previous decision Life of assets, such as gas mains = 40 years
Discount factor After tax weighted average cost of capital
Net Present Value (“NPV”) NPV = Present Value (“PV”) of Operating Cash Flow + PV of CCA Tax Shield - PV of Capital Expenditure
Profitability Index (“PI”) PI = (PV of Operating Cash Flow + PV of CCA Tax shield) / (PV of Capital Expenditures)
97

Part 2: Approval of Capital Expenditures Decision by the Regulator The regulator balances the interests of shareholders, current customers, prospective customers, and the society at large. Generally a capital project will increase rates in the near term with current customers bearing the burden of the higher rates initially to the benefit of future customers. Later in the project life this may reverse with the cross-subsidy from the new customers to current customers. The regulator determines what level of intergenerational cross-subsidy is not undue. If the level of cross-subsidy is found to be undue, the regulator may not approve the project or may approve it but require that new customers pay a contribution-in-aid-of-construction. The regulator may have obligations to review any environmental impacts of the project and how they can be mitigated. The regulator may have obligations to determine if there are any landowner compensation or First Nations issues and if they have been adequately dealt with.
98

Part 2: Approval of Capital Expenditures Addition to Rate Base on Completion of Capital Project
Potential disallowance of costs if the regulator is unconvincedNot all costs can be added to rate base.
Is the original justification still valid?Re-do economic justification based on actual costs
Explanation of variancesUnforeseen events, weather Poor cost estimates
Are actual costs different than forecast?
99
Revenue Requirement and Performance Based Regulation Bibliography Bonbright, James C.; Danielsen, Albert L.; Kamerschen, David R.; Principles
of Public Utility Rates, Second Edition; Public Utility Reports, Inc, Arlington, Virginia, 1988
Phillips, Charles F. Jr.; The Regulation of Public Utilities – Theory and Practice; Public Utilities Reports; Arlington, Virginia, 1993
American Gas Association: Gas Rate Fundamentals, Fourth Edition; AGA, Arlington, Virginia, 1987
Mansell, Robert L.; Church, Jeffrey R.; Traditional and Incentive Regulation -Applications to Natural Gas Pipelines in Canada; The Van Horne Institute for International Transportation and Regulatory Affairs; Calgary, Alberta, 1995
Morin, Roger A., Regulatory Finance – Utilities’ Cost of Capital; Public Utilities Reports; Arlington, Virginia, 1994
Schmidt, Michael R.; Performance-Based Ratemaking: Theory and Practice; Pubic Utilities Reports; Vienna, Virginia, 2000
Lowry, Mark Newton, Kaufmann, Lawrence: Performance Based Regulation of Utilities; 23 Energy L. J. 399 (2002)
100


![,%0 (QJLQHHULQJ 6SHFLILFDWLRQ * %DVHOLQH … · >6rxufh (8 5hjxodwlrq ri wkh (xurshdq 3duoldphqw dqg ri wkh &rxqflo ri -xo\ frqfhuqlqj wkh h[sruw dqg lpsruw ri kd]dugrxv fkhplfdov@](https://static.fdocuments.us/doc/165x107/5ec4520f3574b640aa2d98ef/0-qjlqhhulqj-6shflilfdwlrq-dvholqh-6rxufh-8-5hjxodwlrq-ri-wkh-xurshdq.jpg)
![Chanukah Notebooking Activity · 8]]ldk wkh frppdqghu ri wkh ghihqvh irufhv dqg wkh hoghuv ri wkh wrzq wulhg wr fdop wkh 3DJH RI SRSXODFH ZLWKRXW VXFFHVV )LQDOO\ WKH\ SOHDGHG ³*LYH](https://static.fdocuments.us/doc/165x107/5e10b69692860a5fec500ae6/chanukah-notebooking-activity-8ldk-wkh-frppdqghu-ri-wkh-ghihqvh-irufhv-dqg-wkh.jpg)


