QEMSCAN® (Quantitative Evaluation of Minerals by … · PROCEEDINGS, Thirty-Seventh Workshop on...
11
PROCEEDINGS, Thirty-Seventh Workshop on Geothermal Reservoir Engineering Stanford University, Stanford, California, January 30 - February 1, 2012 SGP-TR-194 QEMSCAN ® (QUANTITATIVE EVALUATION OF MINERALS BY SCANNING ELECTRON MICROSCOPY): CAPABILITY AND APPLICATION TO FRACTURE CHARACTERIZATION IN GEOTHERMAL SYSTEMS Bridget Ayling 1 , Peter Rose 1 , Susan Petty 2 , Ezra Zemach 3 and Peter Drakos 3 1 Energy & Geoscience Institute, The University of Utah, Salt Lake City, UT 84108, USA 2 AltaRock Energy Inc., Seattle, WA 98103, USA 3 Ormat Nevada Inc., Reno, NV 89511, USA [email protected] ABSTRACT Fractures are important conduits for fluids in geothermal systems, and achieving and maintaining fracture permeability is a fundamental aspect of EGS (Engineered Geothermal System) development. Hydraulic or chemical stimulation techniques are often employed to achieve this. In the case of chemical stimulation, an understanding of the minerals present in the fractures themselves is desirable to better design a stimulation effort (i.e. which chemical to use and how much). Borehole televiewer surveys provide important information about regional and local stress regimes and fracture characteristics (e.g. aperture), and XRD is useful for examining bulk rock mineralogy, but neither technique is able to quantify the distribution of these minerals in fractures. QEMSCAN ® is a fully-automated micro-analysis system that enables quantitative chemical analysis of materials and generation of high-resolution mineral maps and images as well as porosity structure. Initial applications of QEMSCAN ® technology were predominantly in the minerals industry and application to geothermal problems has remained limited to date. In this pilot study, the application of QEMSCAN ® technology to fracture characterization in geothermal systems was evaluated using samples from Newberry Volcano (Oregon) and Brady‟s geothermal field (Nevada). QEMSCAN ® results were compared with XRD and petrographic techniques. Nine samples were analyzed from each field, collected from the drill core in the 3400 – 4900 ft depth range in two shallow wells (GEO-N2 at Newberry Volcano and BCH-3 at Brady‟s). The samples were prepared as polished thin sections for QEMSCAN ® analysis. Results indicate that a sampling resolution of 10 μm is sufficient to resolve fracture morphology, mineral zonation (where multiple episodes of mineralization occurred), and elemental distribution, and enables relatively fast data acquisition (3 cm² can be analyzed in approximately 3 hours). Finer resolutions (down to 2.5 μm) take significantly longer, but can be used to provide additional spatial detail in areas of interest preceding a low resolution (10 μm) scan. Use of XRD and electron microprobe techniques in conjunction with QEMSCAN ® data is sometimes needed to distinguish geothermal alteration minerals with similar chemical compositions (smectite clays and chlorite), however overall the technique appears to have excellent potential for geothermal applications. 1.0 INTRODUCTION QEMSCAN ® (Quantitative Evaluation of Minerals by Scanning Electron Microscopy) is a fully- automated micro-analysis system that enables quantitative chemical analysis of materials and generation of high-resolution mineral maps and images as well as porosity structure (Gottlieb et al., 2000). It uses a scanning electron microscopy platform (SEM) with an electron beam source in combination with four energy-dispersive X-ray spectrometers (EDS). The measured backscattered electron and electron-induced secondary X-ray emission spectra are used to classify sample mineralogy. A variety of quantitative information can be obtained including distribution, composition, and angularity of minerals, and the fabric, distribution, texture and porosity of materials. QEMSCAN ® technology was developed in the late 1970‟s by CSIRO in Australia (the earliest model was called QEM*SEM), and applications were predominately in the minerals industry to complement bulk chemical assay data and to guide decisions in exploration, mining, mineral processing and metal refining (e.g. Miller et al, 1982; Reid et al., 1984). Refinement and modification of the technology has broadened its application to other
Transcript of QEMSCAN® (Quantitative Evaluation of Minerals by … · PROCEEDINGS, Thirty-Seventh Workshop on...

PROCEEDINGS, Thirty-Seventh Workshop on Geothermal Reservoir Engineering Stanford University, Stanford, California, January 30 - February 1, 2012 SGP-TR-194
QEMSCAN® (QUANTITATIVE EVALUATION OF MINERALS BY SCANNING
ELECTRON MICROSCOPY): CAPABILITY AND APPLICATION TO FRACTURE CHARACTERIZATION IN GEOTHERMAL SYSTEMS
Bridget Ayling1, Peter Rose
1, Susan Petty
2, Ezra Zemach
3 and Peter Drakos
3
1Energy & Geoscience Institute, The University of Utah, Salt Lake City, UT 84108, USA
2AltaRock Energy Inc., Seattle, WA 98103, USA
3Ormat Nevada Inc., Reno, NV 89511, USA
ABSTRACT
Fractures are important conduits for fluids in geothermal systems, and achieving and maintaining fracture permeability is a fundamental aspect of EGS (Engineered Geothermal System) development. Hydraulic or chemical stimulation techniques are often employed to achieve this. In the case of chemical stimulation, an understanding of the minerals present in the fractures themselves is desirable to better design a stimulation effort (i.e. which chemical to use and how much). Borehole televiewer surveys provide important information about regional and local stress regimes and fracture characteristics (e.g. aperture), and XRD is useful for examining bulk rock mineralogy, but neither technique is able to quantify the distribution of these minerals in fractures. QEMSCAN
® is a fully-automated micro-analysis
system that enables quantitative chemical analysis of materials and generation of high-resolution mineral maps and images as well as porosity structure. Initial applications of QEMSCAN
® technology were
predominantly in the minerals industry and application to geothermal problems has remained limited to date. In this pilot study, the application of QEMSCAN
® technology to fracture characterization
in geothermal systems was evaluated using samples from Newberry Volcano (Oregon) and Brady‟s geothermal field (Nevada). QEMSCAN
® results
were compared with XRD and petrographic techniques. Nine samples were analyzed from each field, collected from the drill core in the 3400 – 4900 ft depth range in two shallow wells (GEO-N2 at Newberry Volcano and BCH-3 at Brady‟s). The samples were prepared as polished thin sections for QEMSCAN
® analysis. Results indicate that a
sampling resolution of 10 µm is sufficient to resolve fracture morphology, mineral zonation (where multiple episodes of mineralization occurred), and
elemental distribution, and enables relatively fast data acquisition (3 cm² can be analyzed in approximately 3 hours). Finer resolutions (down to 2.5 µm) take significantly longer, but can be used to provide additional spatial detail in areas of interest preceding a low resolution (10 µm) scan. Use of XRD and electron microprobe techniques in conjunction with QEMSCAN
® data is sometimes needed to distinguish
geothermal alteration minerals with similar chemical compositions (smectite clays and chlorite), however overall the technique appears to have excellent potential for geothermal applications.
1.0 INTRODUCTION
QEMSCAN
® (Quantitative Evaluation of Minerals
by Scanning Electron Microscopy) is a fully-automated micro-analysis system that enables quantitative chemical analysis of materials and generation of high-resolution mineral maps and images as well as porosity structure (Gottlieb et al., 2000). It uses a scanning electron microscopy platform (SEM) with an electron beam source in combination with four energy-dispersive X-ray spectrometers (EDS). The measured backscattered electron and electron-induced secondary X-ray emission spectra are used to classify sample mineralogy. A variety of quantitative information can be obtained including distribution, composition, and angularity of minerals, and the fabric, distribution, texture and porosity of materials. QEMSCAN
® technology was developed in the late
1970‟s by CSIRO in Australia (the earliest model was called QEM*SEM), and applications were predominately in the minerals industry to complement bulk chemical assay data and to guide decisions in exploration, mining, mineral processing and metal refining (e.g. Miller et al, 1982; Reid et al., 1984). Refinement and modification of the technology has broadened its application to other
sectors, including oil and gas (e.g. Edwards and Butcher, 1999; Butcher and Botha, 2010), forensics (Pirrie et al., 2004), planetary geology (e.g. Botha et al., 2008) and general geosciences (e.g. Liu et al., 2005; Grauch et al., 2008). Application to geothermal problems has been limited to date (e.g. Hardardottir et al., 2010), but recent improvements in QEMSCAN
® software capabilities (refer to Haberleh
et al., 2010) that enable customization of raw data interpretation protocols to better suit geothermal mineral assemblages suggest that the potential is immense. The Newberry Volcano EGS Project is a DOE-funded project operated by AltaRock Energy Inc. The project commenced in 2010, and is forecast to conclude in May 2013. The project objective is to demonstrate the development and operation of an EGS system. The project has several phases including site and resource investigation, stimulation of an existing well to create a geothermal reservoir, production well drilling and completion, testing of well productivity and reservoir characteristics, and conceptual modeling of a commercial-scale EGS well-field and power plant. The Brady‟s EGS Project is a DOE-funded project operated by Ormat Nevada Inc. The project objective is to stimulate a tight well (15-12) and improve its connectivity to the existing producing field. This project is also multi-staged: progress to date includes development of a structural model for the Brady‟s field, installation of a seismic monitoring array, geophysical logging (borehole televiewer and FMS) of well 15-12 and petrologic analysis of core and cuttings from well 15-12 and BCH-3. It is anticipated that the next phase of work will involve hydraulic and/or chemical stimulation of well 15-12. For this study, 14 samples of mineralized fractures were collected from core extracted from a shallow (<4500 ft depth) well (GEO-N2) in the Newberry Volcano project area; GEO-N2 is located approximately 1 km from the proposed EGS well (NWG 55-29; ~10,000 ft deep). The GEO-N2 samples were collected in the 3400 – 4380 ft depth range. At the Brady‟s geothermal field, 24 samples were collected from the BCH-3 well in the 3780-4900 ft depth range, from both the Tertiary volcanics and pre-Tertiary basement. BCH-3 is immediately adjacent to the proposed EGS well (15-12; 5096 ft deep). Collectively, these initial samples were sub-sampled and prepared as polished thin sections. After petrographic observation, 18 samples were selected for QEMSCAN
® analysis.
2.0 METHODS
2.1 QEMSCAN®
analytical protocols
The analyses were completed at the Energy and Geoscience Institute at the University of Utah, on a QEMSCAN
® 4300, which is built on a Zeiss Evo 50
SEM platform with four light element Bruker Xflash energy dispersive X-ray detectors. Energy-dispersive X-ray spectral analysis (EDX) involves the interpretation of secondary X-ray spectra to determine elemental composition, and ultimately mineralogy. The QEMSCAN
® system is automated
and enables measurement of the EDX spectra along a grid. For information about analytical modes and methodology, refer to Gottlieb et al. (2000) and Pirrie et al. (2004). This instrument is currently testing beta versions of iMeasure v.5.2 software for the data acquisition, and iDiscover v.5.2 for the spectral interpretation and data processing. The measurements were collected in field-scan mode, and X-ray data were collected every 10µm on the polished thin sections. Analysis at higher resolutions (5 µm and 2.5 µm) was trialed for a couple of samples: results are presented in the following sections. For this study, total areas measured were ~ 3cm² per sample, which equates to an analysis time of approximately 3 hours. Prior to each analysis, standard instrument tuning was performed, including beam focusing, beam alignment and calibration of the X-Ray detectors and backscatter. A measurement procedure is entered and the analyses are automated. The QEMSCAN
® was
operated using an accelerating voltage of 20 kV and a specimen current of approximately 5 nA.
2.2 QEMSCAN®
classification protocols
For best results, a suitable classification protocol must be used. Depending on the desired outcome, a user may use an existing Species Identification Protocol (SIP), modify an existing SIP, or create a new SIP. For example, a SIP developed for measurement of ore deposits and oxides would deliver suboptimal performance when applied to a felsic alumino-silicate rock (e.g. a rhyolite). Mineral definitions included in each SIP can be based on synthetic (i.e. ideal) empirical formulae for mineralogy using the new QEMSCAN® Spectral Analysis Engine (SAE) (which generates synthetic X-ray spectra for a mineral) or, from analysis of standards. Alternatively, examination of a sample under a petrographic microscope for mineral identification followed by analysis by QEMSCAN
®
enables interactive matching of mineralogy to chemical composition for a sample, and this definition is then the most reasonable for the particular location/project area. XRD or ion-microprobe analyses are also complementary,

allowing identification of clay minerals and mineral polymorphs: for this study, ten samples were analyzed by XRD for comparison with the QEMSCAN
® results, in addition to petrographic
observation and spot-testing of mineral compositions using an electron microprobe. As there is no geothermal-specific SIP that has been developed to date, the SIP used for interpretation of the spectral data in this study was based on a sedimentary SIP, and modified to include geothermal and volcanic-system minerals as needed. Typical geothermal alteration minerals were included in addition to minerals that are known to be present at the Newberry Volcano (as reviewed in Bargar and Keith (1999)) and the Brady‟s geothermal field (Lutz et al., 2011). There are two levels at which the user may affect the final mineral classification: first through the elements that are „allowed‟ to be interpreted from the raw X-ray spectra (a maximum of 72 elements are available), and secondly through the mineral definitions that are included in SIP. The first stage limits the minerals that can be present: for example, if a Sr-rich calcite is defined in the mineral list, Sr must be present in the element list. It is important to limit the number of elements that can be extracted from the raw X-ray spectra to minimize the number of non-unique solutions to the X-ray spectra. Many elemental peaks overlap, and if too many elements are enabled, the number of spurious element results increase (i.e. number of elements for each analysis point) and therefore greater likelihood of not being able to classify each point as a particular mineral because these spurious elements were not included in the mineral definition. For this pilot study, several element lists were trialed, and the final selection included 21 elements.
2.3 Electron Microprobe
Analyses were performed at the University of Utah on a Cameca SX-50 electron microprobe with four wavelength-dispersive spectrometers. Analytical conditions were 15 keV accelerating voltage, 25 nA beam current and a nominal beam diameter of 10 μm, and a combination of natural and synthetic standards were employed. Raw X-ray intensities were corrected for matrix effects with a phi-rho-z algorithm (Pouchou and Pichoir, 1991). The nominal detection limit for these operating conditions is 0.03 wt %. One sample each from Newberry Volcano and Brady‟s geothermal field was selected for targeted analyses using the electron microprobe. Key alteration minerals were targeted (e.g. chlorite, illite and smectite) and compared with the mineral definitions as specified in the geothermal SIP.
3.0 RESULTS
3.1 Mineralogy
Selected mineralogy maps for representative samples from Newberry Volcano and Brady‟s are presented in Figures 1 and 2. All scans were acquired at 10 µm resolution and reflect approximately 3cm² of scan area. For each sample analyzed by QEMSCAN
®, there is
often a portion of the scan that is not classified (referred to as Other). For these geothermal samples, this value averages 6%. It does not mean that the elemental composition of these points is unknown, simply that there was no mineral definition in the SIP that was consistent with the measured spectra. Typically these points reflect boundary phases between mineral grains, where the X-Ray spectra generated are composite signals. Alternatively it may represent mineral species that are not defined in the SIP library. The percentage „Other‟ could be reduced by meticulously defining new „composite‟ mineral definitions for the boundary phases present (or new minerals altogether), or alternatively using some of the tools in iDiscover to improve this (e.g. the boundary-phase preprocessor or the measurement de-bugger).
3.2 Accuracy of mineral classification – validation using XRD + electron microprobe
XRD and QEMSCAN®
results for representative samples from Newberry Volcano and Brady‟s are presented in Tables 1 and 2. Comparison of the XRD and QEMSCAN
® data indicates broad agreement
between the two techniques. It is reasonable to assume that one will never achieve 100% agreement, reasons being that differences in sampling location may have an effect (i.e. the analyses are collected on adjacent rock surfaces but are still not exactly the same piece of material), the QEMSCAN
® numbers
are for a surface area whereas XRD represents volumetric mass fractions, and also the analytical techniques are different. The QEMSCAN
® measures
secondary X-rays that are emitted from the sample in response to being hit with an incident electron beam; the secondary X-rays are emitted when electrons jump from a higher-energy shell in an atom to a lower-energy shell, and the number and intensity of the X-rays that are emitted are characteristic for each element. XRD is based on the elastic scattering (diffraction) of X-rays by the electron clouds that surround individual atoms in the sample, and is used to characterize crystallographic structure and mineralogy. XRD is thus able to differentiate mineral polymorphs (e.g. calcite vs. aragonite) whereas QEMSCAN
® cannot. However, XRD is unable to

Figure 1: Representative mineralogy maps for samples from the GEO-N2 well at Newberry Volcano, all acquired at a 10µm analysis resolution on the QEMSCAN
®. (a) In this basalt, a complex fracture with multiple stages of
mineralization includes smectite clays, calcite and quartz. (b) This rhyolite tuff has experienced extensive alteration of the matrix to chlorite and smectite clays, and has experienced later-stage infilling with calcite and dolomite. The oscillatory nature of the calcite and dolomite mineralization suggests changes in fluid chemistry occurred while these minerals were being deposited. (c) This vesicular basaltic andesite has been altered and little primary porosity remains in the vesicles. The matrix is pervasively altered to smectite, the vesicles are infilled with calcite, illite, smectite and anhydrite, and the fracture zone is dominated by illite clays and sulphide precipitation.

Figure 2: Representative mineralogy maps for samples from the BCH-3 well at Brady’s geothermal field, all acquired at a 10µm analysis resolution on the QEMSCAN
®.(a) This sample of brecciated volcanic basement is
cross-cut by an extensive network of calcite veins; calcite mineralization postdates the earlier quartz mineralization as indicated by their spatial relationships. (b) This volcani-clastic basement is pervasively altered to smectite clays and micas. The QEMSCAN
® image indicates that the fracture is dominated by calcite mineralization, however
quartz and chlorite are also present. (c) This sample of volcani-clastic basement has experienced extensive quartz mineralization in the matrix and fracture zone.
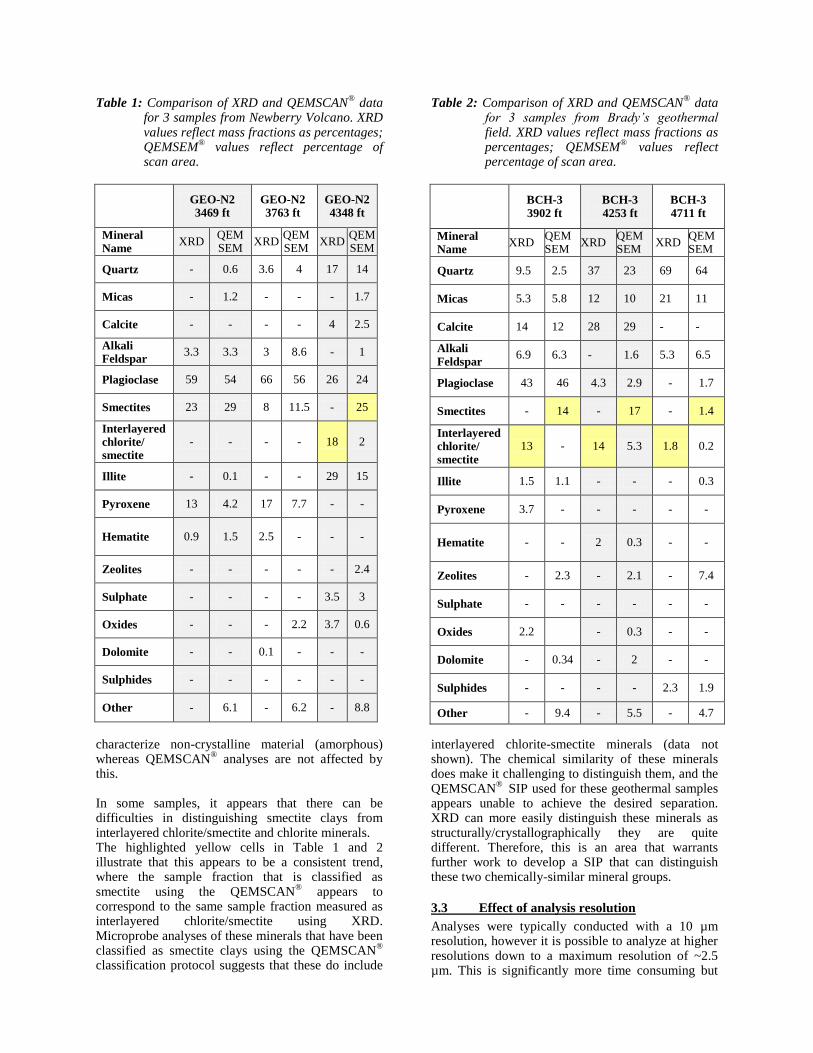
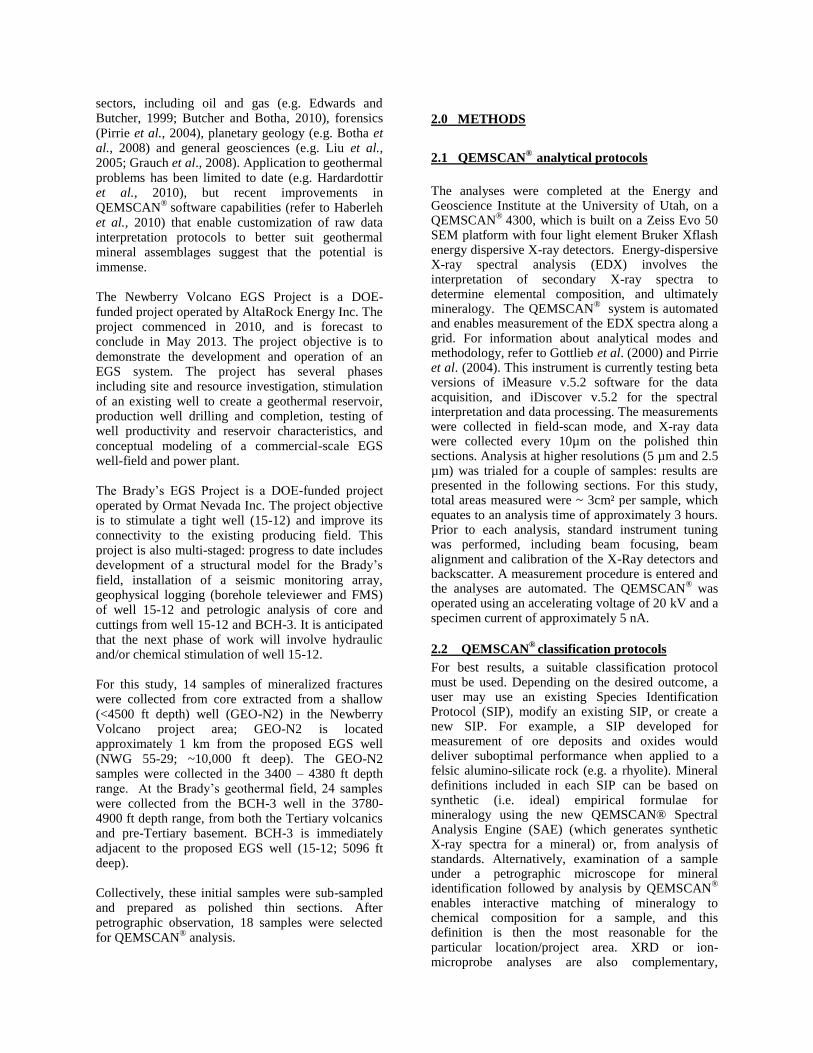
Table 1: Comparison of XRD and QEMSCAN®
data for 3 samples from Newberry Volcano. XRD values reflect mass fractions as percentages; QEMSEM
® values reflect percentage of
scan area.
GEO-N2 3469 ft
GEO-N2 3763 ft
GEO-N2 4348 ft
Mineral Name
XRD QEMSEM
XRD QEM SEM
XRD QEMSEM
Quartz - 0.6 3.6 4 17 14
Micas - 1.2 - - - 1.7
Calcite - - - - 4 2.5
Alkali Feldspar
3.3 3.3 3 8.6 - 1
Plagioclase 59 54 66 56 26 24
Smectites 23 29 8 11.5 - 25
Interlayered chlorite/ smectite
- - - - 18 2
Illite - 0.1 - - 29 15
Pyroxene 13 4.2 17 7.7 - -
Hematite 0.9 1.5 2.5 - - -
Zeolites - - - - - 2.4
Sulphate - - - - 3.5 3
Oxides - - - 2.2 3.7 0.6
Dolomite - - 0.1 - - -
Sulphides - - - - - -
Other - 6.1 - 6.2 - 8.8
Table 2: Comparison of XRD and QEMSCAN®
data for 3 samples from Brady’s geothermal field. XRD values reflect mass fractions as percentages; QEMSEM
® values reflect
percentage of scan area.
BCH-3
3902 ft
BCH-3
4253 ft
BCH-3
4711 ft
Mineral Name
XRD QEM SEM
XRD QEM SEM
XRD QEM SEM
Quartz 9.5 2.5 37 23 69 64
Micas 5.3 5.8 12 10 21 11
Calcite 14 12 28 29 - -
Alkali
Feldspar 6.9 6.3 - 1.6 5.3 6.5
Plagioclase 43 46 4.3 2.9 - 1.7
Smectites - 14 - 17 - 1.4
Interlayered chlorite/ smectite
13 - 14 5.3 1.8 0.2
Illite 1.5 1.1 - - - 0.3
Pyroxene 3.7 - - - - -
Hematite - - 2 0.3 - -
Zeolites - 2.3 - 2.1 - 7.4
Sulphate - - - - - -
Oxides 2.2
- 0.3 - -
Dolomite - 0.34 - 2 - -
Sulphides - - - - 2.3 1.9
Other - 9.4 - 5.5 - 4.7
characterize non-crystalline material (amorphous) whereas QEMSCAN
® analyses are not affected by
this. In some samples, it appears that there can be difficulties in distinguishing smectite clays from interlayered chlorite/smectite and chlorite minerals. The highlighted yellow cells in Table 1 and 2 illustrate that this appears to be a consistent trend, where the sample fraction that is classified as smectite using the QEMSCAN
® appears to
correspond to the same sample fraction measured as interlayered chlorite/smectite using XRD. Microprobe analyses of these minerals that have been classified as smectite clays using the QEMSCAN
®
classification protocol suggests that these do include
interlayered chlorite-smectite minerals (data not shown). The chemical similarity of these minerals does make it challenging to distinguish them, and the QEMSCAN
® SIP used for these geothermal samples
appears unable to achieve the desired separation. XRD can more easily distinguish these minerals as structurally/crystallographically they are quite different. Therefore, this is an area that warrants further work to develop a SIP that can distinguish these two chemically-similar mineral groups.
3.3 Effect of analysis resolution
Analyses were typically conducted with a 10 µm resolution, however it is possible to analyze at higher resolutions down to a maximum resolution of ~2.5 µm. This is significantly more time consuming but
can provide greater detail in mineralogy or elemental variations across a fracture (see Figure 3). As expected, the calculated areal extents of each mineral/element are not affected by changes in resolution, as statistically there are no changes in operating conditions (i.e. beam properties remain the same): the analysis points are just more closely
spaced. Figure 3 illustrates the effect of increasing analysis resolution on a fractured sample from Newberry Volcano, from 10 µm to 2.5 µm point spacing. Both mineralogy and elemental (in this case sulphur) spatial variability are better constrained at a 2.5 µm analysis resolution.
Figure 3: Effect of varying the QEMSEM
® analysis resolution. (a) Mineralogy map across a narrow fracture in a
sample from Newberry Volcano collected at 4318 ft depth; analysis resolution 10 µm. (b) the same area scanned at a 2.5 µm resolution. Micro-texture and spatial variations in pyrite and anhydrite mineralization are better resolved at this resolution. (c) an elemental map illustrating variation in sulphur content across the fracture zone for a 10 µm analysis resolution. The percentage scale reflected in the legend represents an internal instrument-specific measurement related to the spectral analysis engine used in iDiscover 5.2: it is thus useful for a relative indication of sulphur concentration but does not reflect absolute concentration in this instance. (d) sulphur element map for a 2.5µm scan resolution.
3.4 Elemental zonation
Geothermal fluids moving through fractured rock in geothermal systems often transport a range of elements in solution as dissolved species and complexes; common examples include calcium, sulphate, carbonate and silica. These precipitate from the fluid to form veins. Mapping changes in element chemistry across a fracture zone may allow examination of changes in fluid chemistry through time, for example different trace element components of common secondary minerals (e.g. calcite) can be explored. New capabilities in the iDiscover 5.2 software enable fast generation of single-element SIPs (species identification protocols). The element-percentages that are generated in this way are not absolute concentrations and can only be used in a relative sense. Absolute concentrations of elements can be achieved once matrix effects on X-Ray generation have been resolved. Matrix effects include absorption (A) and fluorescence (F) in the sample, and electron backscattering and penetration which vary with atomic number (Z). These aspects form the basis of the ZAF corrections that are applied to raw X-ray data to extract quantitative elemental information. To date, matrix effects have not been examined or measured at EGI; in addition the performance of ZAF corrections on mixed spectra is not well understood (pers. comm. D. Haberlah). These aspects will be addressed in a future study. This usefulness of the single-element SIPs was explored on selected samples, using iron (Fe) and calcium (Ca) SIPs (Figure 4 and 5).
4.0 SUMMARY
Automated mineralogy analysis using QEMSCAN®
technology is a powerful tool for evaluating spatial distribution of key alteration minerals on the micron-scale and for assessing the relative temporal evolution of fluid chemistries and alteration in a geothermal system. In addition, proportions of these minerals can easily be extracted using the iDiscover software, which has excellent potential for quantifying extensiveness and relative proportions of secondary cements in geothermal fracture systems. QEMSCAN
® analyses are complementary to XRD
data, benefiting from external validation of major mineral constituents and yet providing significant insight into how these are distributed in the rock. Although there are some differences between the XRD and QEMSCAN
® proportions, this pilot study
has shown that the results are broadly consistent when the differences in actual sample analyzed and each measurement technique are considered and appreciated.
ACKNOWLEDGEMENTS
David Langton at EGI is thanked for help in laying out core from the GEO-N2 well and other wells from the Newberry Crater area. Ezra Zemach is thanked for providing access for B.Ayling to visit the Bradys Geothermal field to sample the BCH-3 core on multiple occasions. Clay Jones and Louise Spann are thanked for their assistance in performing and interpreting the XRD results. Clay Jones and Jessica Allen are both thanked for their time and willingness to share their expertise in operation of the QEMSCAN
® instrument. Joe Moore is thanked for
the invaluable knowledge and enthusiasm he instills when answering my questions about geothermal alteration mineralogy. Financial support for analytical costs associated with this work was provided through DOE grant DE-EE0002777/004 (Newberry Volcano) and DOE grant DE-
FG36‐08GO18200 (Bradys EGS project). Financial support for B. Ayling‟s work at the University of Utah was provided by Geoscience Australia.
REFERENCES
Botha, P.W.S.K., Butcher, A.R., Horsch, H.E.,
Rickman, D., Wentworth, S.J., Schrader, C.M., Stoeser, D., Benedictus, A., Gottlieb, P., and McKay, D. (2008), “Ultrafast Phase Mapping of Thin-Sections from An Apollo 16 Drive Tube – a New Visualization of Lunar Regolith”. GSA 2008 Joint Annual Meeting, 5-9 October 2008, Houston, Texas, Abstract 345-3.
Barger, K.E., and Keith, T.E.C. (1999),
“Hydrothermal Mineralogy of Core from Geothermal Drill Holes at Newberry Volcano, Oregon”. U.S.G.S. Professional Paper 1578, 92pp.
Butcher, A.R, and Botha, P.W.S.K. (2010),
“Automated mineralogy derives key characteristics directly from reservoir rock”. The American Oil & Gas Reporter, January 2010, 4pp.
Edwards, G.V., and Butcher, A.R. (1999), “A new
application for QEMSCAN – quantifying the mineralogy of drill cuttings from oil and gas exploration and production wells”. CSIRO Report, DMR-1140, 97pp.
Goodall, W.R., Scales, P.J., and Butcher, A.R.
(2005), “The use of QEMSCAN and diagnostic leaching in the characterization of visible gold in complex ores”. Minerals Engineering, Vol. 18(8), pp 877–886.

Figure 4: Element maps illustrating the distribution of iron (Fe) in selected samples from Newberry Volcano and Brady’s. The percentage scale reflected in the legend represents an internal instrument-specific measurement related to the spectral analysis engine used in iDiscover 5.2: it is thus useful for a relative indication of iron concentration but does not reflect absolute concentration in this instance. (a) In this multi-stage fracture, the relative concentration of iron is variable; highest concentrations in the fracture are associated with smectite clays. (b) In this sample from Brady’s, the greatest relative iron concentrations are in the fracture zone, and are associated with chlorite precipitation. (c) In this sample, relative iron concentrations are highest in the matrix, reflecting the extensive chlorite alteration in this sample. In addition, episodic variations in iron content in the void space correspond to successive episodes of calcite vs. dolomite mineralization.

Figure 5: Element maps illustrating the distribution of calcium (Ca) in selected samples from Newberry Volcano and Brady’s. The percentage scale reflected in the legend represents an internal instrument-specific measurement related to the spectral analysis engine used in iDiscover 5.2: it is thus useful for a relative indication of calcium concentration but does not reflect absolute concentration in this instance. (a) In this sample from Brady’s, there is a bimodal distribution of calcium concentrations. Lower concentrations are associated with feldspar grains, while relatively-high concentrations are associated with calcite precipitation in fractures. (b) Calcite infilling in the voids of this tuff is apparent with the relatively high calcium concentrations; again changes in fluid chemistry through time are reflected in the elemental zoning in the void. (c) This sample from Brady’s is characterized by calcite mineralization. An absence of elemental zoning as illustrated in (b) suggests that fluid chemistry remained stable during this mineralization event.
Gottlieb, P., Wilkie, G., Sutherland, D., Ho-Tun, E., Suthers, S., Perera, K., Jenkins, B., Spencer, S., Butcher, A., Rayner, J. (2000), “Using quantitative electron microscopy for process mineralogy applications”. Journal of the Minerals, Metals and Materials Society, Vol. 52(4), pp 24-25.
Grauch, R.I., Eberl, D.D., Butcher, A.R., and Botha,
P.W.S.K. (2008), “Quantitative mineralogy of fine-grained sedimentary rocks: a preliminary look at QEMSCAN®”. Microscopy and Microanalysis, Vol. 14(2), pp 532-533.
Haberlah, M., Owen, M., Botha, P.W.S.K., and
Gottlieb, P., (2011) “SEM-EDS based protocol for subsurface drilling mineral identification and petrological classification”. Presented at the 10th International Congress for Applied Mineralogy (ICAM 2011) in Trondheim, Norway, 1-5 August 2011, pp265-273.
Hardardóttir, V., Hannington, M., Hedenquist, J.,
Kjarsgaard,I., and Hoal, K. (2010), “Cu-Rich Scales in the Reykjanes Geothermal System, Iceland”. Economic Geology, Vol. 105, pp 1143–1155.
Liu, Y., Gupta, R., Sharma, A., Wall, T., Butcher, A.,
Miller, G., Gottlieb, P., and French, D., (2005), “Mineral matter-organic matter association characterisation by QEMSCAN and applications in coal utilization” Fuel, Vol.
84(10), pp 1259-1267. Lutz, S.J., Zutshi, A., Robertson-Tait, A., Drakos, P.,
and Zemach, E. (2011), “Lithologies, Hydrothermal Alteration, and Rock Mechanical Properties in Wells 15-12 and BCH-3, Bradys Hot Springs, Nevada”. Geothermal Resources Council Transactions, Vol. 35.
Miller, P.R., Reid, A.F., and Zuiderwyk, M.A. (1982), “QEM*SEM image analysis in the determination of modal assays, minerals associations and mineral liberation”. Proceedings of the 14
th International Mineral
Processing Congress, October 17-23, Toronto, Canada.
Pirrie, D., Butcher, A.R., Power, M.R., Gottlieb, P.,
Miller, G.L., (2004), “Rapid quantitative mineral and phase analysis using automated scanning electron microscopy (QEMSCAN
®);
potential applications in forensic geoscience”. In: Pye, K., Croft, D.J. (Eds.), Forensic Geoscience, Principles, Techniques and Applications, Vol. 232. Geological Society Special Publication, London, pp 23–136.
Pouchou, J.-L., and Pichoir, F. (1991), “Quantitative
analysis of homogeneous or stratified microvolumes, applying the model "PAP."” In K.F.J. Heinrich & D.E. Newbury, Eds. Electron ProbeQ, p. 3l-75. Plenum Press, New York.
Reid, A.F., Gottlieb, P., MacDonald, K.J. and Miller,
P.J. (1984), “QEM*SEM image analysis of ore minerals: volume fraction, liberation and observational variances”. Proceedings of the 2
nd
International Congress on Applied Mineralogy in the Minerals Industry, February 22-25, Los Angeles, California.