qec Quartely Report - Questerre Energy
48
2019 Q2 QUARTERLY REPORT QUESTERRE ENERGY CORPORATION
Transcript of qec Quartely Report - Questerre Energy

2019Q2
QUARTERLY REPORTQUESTERRE ENERGY
CORPORATION

2019QUESTERRE ENERGY CORPORATION IS AN ENERGY TECHNOLOGY
AND INNOVATION COMPANY. IT IS LEVERAGING ITS EXPERTISE
GAINED THROUGH EARLY EXPOSURE TO LOW PERMEABILITY
RESERVOIRS TO ACQUIRE SIGNIFICANT HIGH-QUALITY RESOURCES.
WE BELIEVE WE CAN SUCCESSFULLY TRANSITION OUR ENERGY
PORTFOLIO. WITH NEW CLEAN TECHNOLOGIES AND INNOVATION
TO RESPONSIBLY PRODUCE AND USE ENERGY, WE CAN SUSTAIN
BOTH HUMAN PROGRESS AND OUR NATURAL ENVIRONMENT.
QUESTERRE IS A BELIEVER THAT THE FUTURE SUCCESS OF THE
OIL AND GAS INDUSTRY DEPENDS ON A BALANCE OF ECONOMICS,
ENVIRONMENT AND SOCIETY. WE ARE COMMITTED TO BEING
TRANSPARENT AND ARE RESPECTFUL THAT THE PUBLIC MUST
BE PART OF MAKING THE IMPORTANT CHOICES FOR OUR
ENERGY FUTURE.
QUESTERRE’S COMMON SHARES ARE TRADED ON THE
TORONTO STOCK EXCHANGE AND OSLO STOCK EXCHANGE
UNDER THE SYMBOL QEC.
1 President’s Message3 Management’s Discussion & Analysis 26 Condensed Consolidated Interim
30 Notes to the Condensed Consolidated
Interim Financial Statements
Questerre Energy Corporation
Financial Statements
2019 Quarterly Report 1
President’s Message
We are convinced that our idea to use different approaches and new clean technologies to create zero emissions
gas production in Quebec is the right one.
An aspirational goal of near zero environmental impact has transformed how we look at development of our
resources and our approach to social acceptability. The conventional incremental approach focused only on
economic solutions is no longer good enough. People understand we need to balance the environment and the
economy but they are looking for a leap forward.
Our goal is to achieve true sustainability with projects aimed at near zero environmental impacts. We are revisiting
our business plan with the idea of taking this approach throughout our business.
Highlights
Farm-in partner exercises option to drill fourth well at Kakwa North
Agreements reached with Schlumberger and SNC-Lavalin to advance the Clean Tech Energy project in
Quebec
Invited by Government of Jordan to apply for concession agreement for oil shale project
Average daily production of 2,035 boe/d for the quarter with adjusted funds flow from operations of $2.66
million
During the quarter, we continued to build support for our Clean Tech Energy project. Teamsters Canada, one of
the largest trade unions in Canada, publicly declared their support for natural gas development proceeding in
Quebec. SNC-Lavalin, a Quebec-based engineering firm, was engaged to develop the engineering for our project
and validate its feasibility and environmental benefits. We also formed a relationship with Schlumberger to apply
their stewardship tool to model and measure environmental impacts.
While the vision for this project is ambitious - producing zero emissions natural gas with zero fresh water usage
and zero toxic chemicals below ground - we are confident it can be done. By integrating new and existing
technologies, Quebec could become a leader in clean natural gas production. In addition to replacing imports, the
natural gas could provide the feedstock for cleaner high value products such as fertilizer and methanol.
Communicating these economic and environmental benefits to the government and other stakeholders is taking
longer than we originally hoped. It is, however, a prerequisite to any approvals. On the basis that our discussions
for the Clean Tech Energy project continue and to allow SNC-Lavalin time to complete the engineering, we are
applying to extend the deferral of our judicial review until early next year.
At Kakwa North, our partner continues to delineate producing intervals in the Montney. A third earning well was
completed in the quarter with initial results in line with the previous wells. Based on these results, they elected to
drill the next well and it should spud shortly.
Next year we could see our first joint well at Kakwa North. It will benefit from the ongoing work to optimize
completions. The goal is to balance the sand tonnage, water volumes and fracture treatment spacing to increase
both initial production and ultimate recoverable reserves.

2 Questerre Energy Corporation
We are growing more optimistic about a third interval lower in the Montney formation at both Kakwa North and
Kakwa Central. If proved up, it could increase the number of undrilled locations. The largest operator in the Kakwa
area reported positive results from a triple stack, or three stacked wells with each of them targeting one specific
interval into the Upper, Middle and Lower Montney. We are discussing with both operators a test of this interval
next year subject to commodity prices.
Our oil shale project in Jordan is moving to the next stage. The Government recently invited us to apply for a
concession agreement to include work program commitments and other fiscal terms. These negotiations will start
soon and will leverage the engineering by Red Leaf to prove the commerciality of their EcoShale process.
Operating & Financial
Relatively unchanged from last year, production of 2,035 boe/d in the quarter reflects the investment in Kakwa
Central last year as well as incremental royalty volumes from Kakwa North. With materially lower oil prices in 2019,
adjusted funds flow from operations for the quarter of $2.66 million remained consistent with the first quarter but
declined over the second quarter of last year. Capital expenditures for the six months ended June 30, 2019 were
$10.44 million with 90% invested at Kakwa Central.
Outlook
In Quebec, our plans are to align the schedule for the technical work with the timeline for social acceptability and
regulatory approvals. Given the considerable work needed to build this support by stakeholders, our step by step
approach is very important. We are targeting to complete the preliminary engineering work by this year end and
the local acceptability needed for the Clean Tech Energy project next year.
Michael Binnion
President and Chief Executive Officer

2019 Quarterly Report 3
Management’s Discussion And Analysis
This Management’s Discussion and Analysis (“MD&A”) was prepared as of August 9, 2019. This interim MD&A
should be read in conjunction with the unaudited condensed consolidated interim financial statements of Questerre
Energy Corporation (“Questerre” or the “Company”) as at June 30, 2019 and for the three and six month periods
ended June 30, 2019 and 2018 (the “Q2 Statements”), and the audited annual consolidated financial statements
of the Company for the year ended December 31, 2018 and the MD&A prepared in connection therewith.
Additional information relating to Questerre, including Questerre’s Annual Information Form (“AIF”) for the year
ended December 31, 2018, is available on SEDAR under Questerre’s profile at www.sedar.com.
Questerre is an energy technology and innovation company. It is leveraging its expertise gained through early
exposure to low permeability reservoirs to acquire significant high quality resources. Questerre is committed to
the economic development of its resources in an environmentally conscious and socially responsible manner.
The Company’s Class “A” Common voting shares (“Common Shares”) are listed on the Toronto Stock Exchange
and Oslo Stock Exchange under the symbol “QEC”.
Basis of Presentation
Questerre presents figures in the MD&A using accounting policies within the framework of International Financial
Reporting Standards (“IFRS”) as issued by the International Accounting Standards Board, representing generally
accepted accounting principles (“GAAP”). All financial information is reported in Canadian dollars, unless otherwise
noted.
Forward-Looking Statements
Certain statements contained within this MD&A constitute forward-looking statements. These statements relate
to future events or our future performance. All statements other than statements of historical fact may be forward-
looking statements. Forward-looking statements are often, but not always, identified by the use of words such as
“anticipate”, “assume”, “believe”, “budget”, “can”, “commitment”, “continue”, “could”, “estimate”, “expect”,
“forecast”, “foreseeable”, “future”, “intend”, “may”, “might”, “plan”, “potential”, “project”, “will” and similar
expressions. These statements involve known and unknown risks, uncertainties and other factors that may cause
actual results or events to differ materially from those anticipated in such forward-looking statements.
Management believes the expectations reflected in those forward-looking statements are reasonable, but no
assurance can be given that these expectations will prove to be correct and such forward-looking statements
included in this MD&A should not be unduly relied upon. These statements speak only as of the date of this MD&A.
This MD&A contains forward-looking statements including, but not limited to, those pertaining to the following:
drilling plans and the development and optimization of producing assets;
future production of oil, natural gas and natural gas liquids and the weighting thereof;
future commodity prices;
prospectivity of the Lower Montney on the Company’s acreage;

4 Questerre Energy Corporation
the Company’s goal to produce energy with zero emissions using safe processes that do not affect drinking
water;
the Company’s commitment to science-based research and full transparency of data and results for its
Clean Tech Energy pilot in Quebec;
deferral of its judicial review of the validity of the Regulations;
the Clean Tech project in Quebec and the timing of engineering and field work;
legislative and regulatory developments in the Province of Quebec;
the Company’s engagement with the Government of Quebec;
liquidity and capital resources;
the Company’s intention to use the EcoShale process to produce oil from shale in Jordan and to identify
potential optimization opportunities;
the engineering and optimization of the retorting processes to improve economic returns on the
Company’s Jordan assets, including use of the EcoShale process;
the Company’s plans to enter into negotiations for a concession agreement in Jordan;
the Company’s expectations with respect to any further losses pursuant to its Red Leaf investment;
ability of the Company to meet its foreseeable obligations;
the Company’s compliance with the terms of its credit facility;
timing of the next review of the Company’s credit facility by its lender;
ability of the Company to meet its foreseeable obligations;
capital expenditures and the funding thereof;
the Company’s methods to address financial exposure;
Questerre’s reserves and resources;
impacts of capital expenditures on the Company’s reserves and resources;
average royalty rates;
commitments and Questerre’s participation in future capital programs;
risks and risk management;
potential for equity and debt issuances and farm-out arrangements;
counterparty creditworthiness, related provisions for credit losses and the fulfillment of obligations by
counterparties;
joint venture partner willingness to participate in capital programs;
insurance;
use of financial instruments; and
critical accounting estimates.
The actual results could differ materially from those anticipated in these forward-looking statements as a result of
the risk factors set forth below and elsewhere in this MD&A, the AIF, and the documents incorporated by reference
into this document:
volatility in market prices for oil, natural gas liquids and natural gas;
counterparty credit risk;
access to capital;
the terms and availability of credit facilities;

2019 Quarterly Report 5
changes or fluctuations in oil, natural gas liquids and natural gas production levels;
liabilities inherent in oil and natural gas operations;
adverse regulatory rulings, orders and decisions;
attracting, retaining and motivating skilled personnel;
uncertainties associated with estimating oil and natural gas reserves and resources;
competition for, cost and availability of, among other things, capital, acquisitions of reserves, undeveloped
lands, equipment, skilled personnel and services;
incorrect assessments of the value of acquisitions and targeted exploration and development assets;
fluctuations in foreign exchange or interest rates;
stock market volatility, market valuations and the market value of the securities of Questerre;
failure to realize the anticipated benefits of acquisitions;
the impact of the Regulations in Quebec and the outcome of the Company’s challenge of the validity of
certain restrictive Regulations;
actions by governmental or regulatory authorities, including changes in royalty structures and programs,
and income tax laws or changes in tax laws and incentive programs relating to the oil and gas industry;
limitations on insurance;
changes in environmental, tax, or other legislation applicable to the Company’s operations, and its ability
to comply with current and future environmental and other laws; and
geological, technical, drilling and processing problems, and other difficulties in producing oil, natural gas
liquids and natural gas reserves.
Statements relating to “reserves” or “resources” are by their nature deemed to be forward-looking statements,
as they involve the implied assessment, based on certain estimates and assumptions that the reserves and
resources described can be profitably produced in the future. The discounted and undiscounted net present values
of future net revenue attributable to reserves and resources do not represent the fair market value thereof.
Readers are cautioned that the foregoing lists of factors are not exhaustive. The forward-looking statements
contained in this MD&A are expressly qualified by this cautionary statement. We do not undertake any obligation
to publicly update or revise any forward-looking statements except as required by applicable securities laws. Certain
information set out herein with respect to forecasted results is “financial outlook” within the meaning of applicable
securities laws. The purpose of this financial outlook is to provide readers with disclosure regarding the Company’s
reasonable expectations as to the anticipated results of its proposed business activities. Readers are cautioned
that this financial outlook may not be appropriate for other purposes.
BOE Conversions
Barrel of oil equivalent (“boe”) amounts may be misleading, particularly if used in isolation. A boe conversion ratio
has been calculated using a conversion rate of six thousand cubic feet of natural gas (“Mcf”) to one barrel of oil
(“bbl”), and the conversion ratio of one barrel to six thousand cubic feet is based on an energy equivalent
conversion method application at the burner tip and does not necessarily represent an economic value equivalent
at the wellhead. Given that the value ratio based on the current price of crude oil as compared to natural gas is

6 Questerre Energy Corporation
significantly different from the energy equivalent of six to one, utilizing a conversion on a six to one basis may be
misleading as an indication of value.
Non-GAAP Measures
This document contains certain financial measures, as described below, which do not have standardized meanings
prescribed by GAAP. As these measures are commonly used in the oil and gas industry, the Company believes
that their inclusion is useful to investors. The reader is cautioned that these amounts may not be directly
comparable to measures for other companies where similar terminology is used.
This document contains the term “adjusted funds flow from operations”, which is an additional non-GAAP
measure. The Company uses this measure to help evaluate its performance.
As an indicator of Questerre’s performance, adjusted funds flow from operations should not be considered as an
alternative to, or more meaningful than, net cash from operating activities as determined in accordance with GAAP.
Questerre’s determination of adjusted funds flow from operations may not be comparable to that reported by other
companies. Questerre considers adjusted funds flow from operations to be a key measure as it demonstrates the
Company’s ability to generate the cash necessary to fund operations and support activities related to its major
assets.
Adjusted Funds Flow From Operations Reconciliation
Three months ended June 30, Six months ended June 30,
($ thousands) 2019 2018 2019 2018
Net cash from operating activities $ 3,098 $ 6,877 $ 2,599 $ 6,525
Interest received (34) – (35) –
Interest paid 181 50 355 128
Change in non-cash operating working capital (583) (915) 2,290 4,011
Adjusted Funds Flow from Operations $ 2,662 $ 6,012 $ 5,209 $ 10,664
This document also contains the terms “operating netbacks” and “working capital surplus (deficit)”, which are
non-GAAP measures.
The Company considers operating netbacks to be a key measure as it demonstrates its profitability relative to
current commodity prices. Operating netbacks as presented do not have any standardized meaning prescribed by
GAAP and may not be comparable with the calculation of similar measures for other entities. Operating netbacks
have been defined as revenue less royalties, transportation and operating costs. Netbacks are generally discussed
and presented on a per boe basis.
The Company also uses the term “working capital surplus (deficit)”. Working capital surplus (deficit), as presented,
does not have any standardized meaning prescribed by GAAP and may not be comparable with the calculation of
similar measures for other entities. Working capital surplus (deficit), as used by the Company, is calculated as
current assets less current liabilities excluding any current portion of risk management and lease liabilities.
2019 Quarterly Report 7
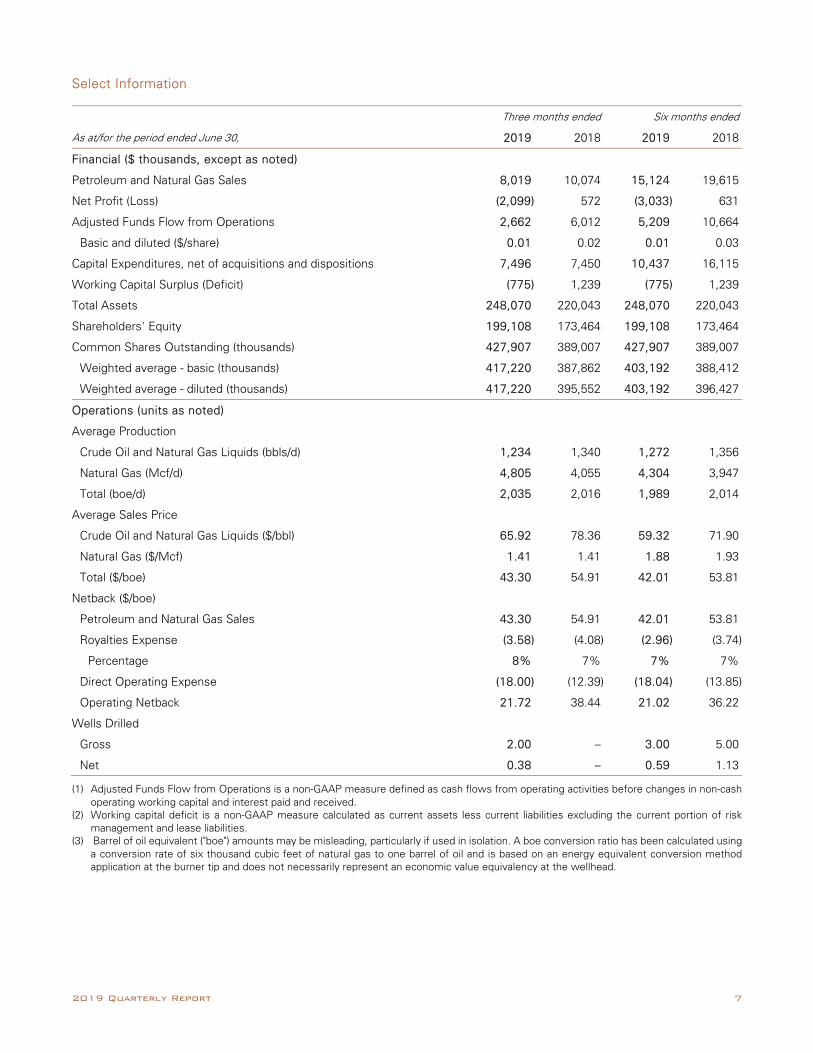
Select Information
Three months ended Six months ended
As at/for the period ended June 30, 2019 2018 2019 2018
Financial ($ thousands, except as noted)
Petroleum and Natural Gas Sales 8,019 10,074 15,124 19,615
Net Profit (Loss) (2,099) 572 (3,033) 631
Adjusted Funds Flow from Operations 2,662 6,012 5,209 10,664
Basic and diluted ($/share) 0.01 0.02 0.01 0.03
Capital Expenditures, net of acquisitions and dispositions 7,496 7,450 10,437 16,115
Working Capital Surplus (Deficit) (775) 1,239 (775) 1,239
Total Assets 248,070 220,043 248,070 220,043
Shareholders' Equity 199,108 173,464 199,108 173,464
Common Shares Outstanding (thousands) 427,907 389,007 427,907 389,007
Weighted average - basic (thousands) 417,220 387,862 403,192 388,412
Weighted average - diluted (thousands) 417,220 395,552 403,192 396,427
Operations (units as noted)
Average Production
Crude Oil and Natural Gas Liquids (bbls/d) 1,234 1,340 1,272 1,356
Natural Gas (Mcf/d) 4,805 4,055 4,304 3,947
Total (boe/d) 2,035 2,016 1,989 2,014
Average Sales Price
Crude Oil and Natural Gas Liquids ($/bbl) 65.92 78.36 59.32 71.90
Natural Gas ($/Mcf) 1.41 1.41 1.88 1.93
Total ($/boe) 43.30 54.91 42.01 53.81
Netback ($/boe)
Petroleum and Natural Gas Sales 43.30 54.91 42.01 53.81
Royalties Expense (3.58) (4.08) (2.96) (3.74)
Percentage 8% 7% 7% 7%
Direct Operating Expense (18.00) (12.39) (18.04) (13.85)
Operating Netback 21.72 38.44 21.02 36.22
Wells Drilled
Gross 2.00 – 3.00 5.00
Net 0.38 – 0.59 1.13
(1) Adjusted Funds Flow from Operations is a non-GAAP measure defined as cash flows from operating activities before changes in non-cash operating working capital and interest paid and received.
(2) Working capital deficit is a non-GAAP measure calculated as current assets less current liabilities excluding the current portion of risk management and lease liabilities.
(3) Barrel of oil equivalent ("boe") amounts may be misleading, particularly if used in isolation. A boe conversion ratio has been calculated using a conversion rate of six thousand cubic feet of natural gas to one barrel of oil and is based on an energy equivalent conversion method application at the burner tip and does not necessarily represent an economic value equivalency at the wellhead.
8 Questerre Energy Corporation
Highlights
Farm-in partner exercises option to drill fourth well at Kakwa North
Agreements reached with Schlumberger and SNC-Lavalin to advance the Clean Tech Energy project in
Quebec
Invited by Government of Jordan to apply for concession agreement for oil shale project
Average daily production of 2,035 boe/d for the quarter with adjusted funds flow from operations of $2.66
million
Second Quarter 2019 Activities
The Company is re-evaluating its business plan. It believes the approach in Quebec towards near-zero
environmental impacts will be the future for the industry in a world increasingly concerned about balancing human
progress with environmental impacts. The Company is looking to leverage the learnings, experience and clean
technologies from its Quebec project throughout its business.
Kakwa, Alberta
Development continued at both the Company’s Kakwa Central and Kakwa North acreage during the quarter.
The operator at Kakwa North finished drilling and completed its third earning well in the quarter. The 100/01-30-63-
06W6M well, with a lateral length of approximately 3000m, will be tied in the local gathering system shortly. Based
on the initial results that are in line with the other wells, they exercised their option to drill a fourth well.
Upon completion of this fourth well, the operator will own a 50% interest in Kakwa North and Kakwa South.
Questerre will hold a royalty interest in these four wells converting to a 50% working interest after payout. It
anticipates a joint drilling program could commence late in the fourth quarter.
At Kakwa Central, the operator drilled the 103/11-12-63-06W6M (the “103/11-12 Well”), with a lateral of 2617m.
The 103/11-12 Well was completed together with the 102/11-12-63-06W6M and will be tied in early in the third
quarter. Questerre holds an average 19% working interest in these wells. Subject to results, Questerre expects to
participate in up to two (0.42 net) additional wells in the fourth quarter of this year.
Offsetting the Company’s acreage, the largest operator in the area recently reported production results from a well
drilled into the Lower Montney. Based on these results and an internal technical review, the Company believes the
Lower Montney is prospective on its acreage.
St. Lawrence Lowlands, Quebec
Questerre continued its efforts to secure social acceptability for its Clean Tech Energy project in Quebec. The goal
is to produce energy with zero emissions using safe processes that do not affect drinking water. Being developed
with leading Quebec innovators, this new approach could be used around the world to aid global energy transition.
The Company is committed to science-based research and full transparency of data and results for this project.
In conjunction with its strategic partners, an independent clean tech energy alliance was formed earlier this year.
This alliance includes environmental non-governmental organizations, educational institutions and engineering

2019 Quarterly Report 9
firms. Questerre recently entered into arrangements with two of these members, SNC-Lavalin and Schlumberger
to assist with the engineering and design for this project.
Based in Quebec, SNC-Lavalin, the largest construction company in Canada, will be the lead engineering advisor
for the project.
Through its partnership with Schlumberger, the Company has secured access to the Schlumberger Stewardship
Tool to model and measure the environmental and social impacts of all stages of natural gas production. By
modelling development under the Clean Tech Energy approach and comparing this to a more conventional
approach, the tool will quantify the significant reduction expected in emissions, waste and pollution. Questerre
intends to make the tool available to all stakeholders to allow them to model and analyze the environmental impacts
of its Clean Tech Energy project for natural gas development.
The Company also engaged Industrial Alliance Securities Inc., a Quebec-based investment firm, to provide advisory
services with respect to finding Quebec-based strategic investors for its Clean Tech Energy project. During the
quarter, Teamsters Canada, one of the largest trade unions in the country, publicly declared their support for natural
gas development proceeding in Quebec.
Discussions with the Quebec government regarding its Clean Tech Energy project are ongoing. The Company
intends to apply to extend the deferral of its scheduled judicial review on the validity of the new oil and gas
regulations including the prohibition on hydraulic fracturing and the increase in setbacks for oil and gas activities.
These actions are to allow the parties to resolve the issues raised in the Company’s legal brief in a constructive
manner.
Oil Shale Mining
At the end of the quarter, Questerre was advised by the Ministry of Energy and Mineral Resources in Jordan of its
decision to move forward from a Memorandum of Understanding to a Concession Agreement for the Company’s
oil shale project. Negotiations on the fiscal and other commercial terms of this agreement are expected to
commence later in the third quarter. Questerre continues to hold the exclusive exploration rights to the acreage
during these negotiations.
The Company continues to advance the technical and economic feasibility assessment of this project. This work is
focused on identifying opportunities to optimize the processes and improve the economic returns. These
processes include the EcoShale process developed by Red Leaf Resources Inc. (“Red Leaf”) to produce oil from
shale. The Company plans to leverage the recent engineering work by Hatch Ltd., a global engineering firm, on the
EcoShale process to identify potential optimization opportunities.
Corporate
In the second quarter, the Company completed a private placement for gross proceeds of approximately $14.47
million. The placement consisted of the issuance of 38.9 million Common Shares at a price of $0.39 per Common
Share.

10 Questerre Energy Corporation
Drilling Activities
During the quarter, 2 (0.38 net) wells were drilled on the Company’s Kakwa Central acreage.
Production
Three months ended June 30, 2019 2018
Oil and Liquids
Natural Gas Equivalent
Oil and Liquids
Natural Gas Equivalent
(bbls/d) (Mcf/d) (boe/d) (bbls/d) (Mcf/d) (boe/d)
Alberta 860 4,805 1,661 964 4,055 1,640
Saskatchewan 325 – 325 350 – 350
Manitoba 49 – 49 26 – 26
1,234 4,805 2,035 1,340 4,055 2,016
Six months ended June 30, 2019 2018
Oil and Liquids
Natural Gas Equivalent
Oil and Liquids
Natural Gas Equivalent
(bbls/d) (Mcf/d) (boe/d) (bbls/d) (Mcf/d) (boe/d)
Alberta 921 4,304 1,638 946 3,947 1,604
Saskatchewan 301 – 301 382 – 382
Manitoba 50 – 50 28 – 28
1,272 4,304 1,989 1,356 3,947 2,014
Note: Oil and liquids includes light & medium crude oil and natural gas liquids. Natural gas includes conventional and shale gas.
Both on a quarterly and year to date basis, production volumes in 2019 remained largely unchanged from the prior
year.
In 2019, these volumes included 131 boe/d of royalty production from Kakwa North. Consistent with prior periods,
Kakwa continued to account for approximately 80% of corporate production.
The remaining volumes are attributable to light oil production from Antler, Saskatchewan and Pierson, Manitoba.
The lower production volumes in Antler reflect natural depletion declines partially offset by the increased volumes
in Pierson from a workover program. These volumes contributed to an oil and liquids weighting that averaged just
over 60% for the quarter and year to date, largely unchanged from the same periods last year. The Company
anticipates that over time the weighting will average 60%, reflecting the split between condensate and other liquids
to natural gas at Kakwa.
Subject to the timing of the remaining two wells planned for Kakwa Central this year, the Company anticipates its
production volumes to remain relatively flat for the remainder of this year. Subject to commodity prices and results,
production is anticipated to grow in mid to late 2020 following the commencement of a joint drilling program by
the operator at Kakwa North.

2019 Quarterly Report 11
Second Quarter 2019 Financial Results
Petroleum and Natural Gas Sales
Three months ended June 30, 2019 2018
Oil and Natural Oil and Natural
($ thousands) Liquids Gas Total Liquids Gas Total
Alberta $ 4,882 $ 616 $ 5,498 $ 6,790 $ 523 $ 7,313
Saskatchewan 2,206 – 2,206 2,577 – 2,577
Manitoba 315 – 315 184 – 184
$ 7,403 $ 616 $ 8,019 $ 9,551 $ 523 $ 10,074
Six months ended June 30, 2019 2018
Oil and Natural Oil and Natural
($ thousands) Liquids Gas Total Liquids Gas Total
Alberta $ 9,126 $ 1,463 $ 10,589 $ 12,584 $ 1,374 $ 13,958
Saskatchewan 3,918 – 3,918 5,288 – 5,288
Manitoba 617 – 617 369 – 369
$ 13,661 $ 1,463 $ 15,124 $ 18,241 $ 1,374 $ 19,615
Note: Oil and liquids includes light & medium crude oil and natural gas liquids. Natural gas includes conventional and shale gas.
On a three and six month basis, petroleum and natural gas revenue declined by 20% and 23% respectively over
the prior year. With production relatively stable over the last two years, this decline was attributable to
comparatively lower liquids prices, particularly in the first quarter of this year.
Pricing
Three months ended June 30, Six months ended June 30,
2019 2018 2019 2018 Benchmark prices:
Natural Gas - AECO, daily spot ($/Mcf) 1.09 0.74 1.68 1.19
Crude Oil - Mixed Sweet Blend ($/bbl) 73.53 79.66 70.03 69.26
Realized prices:
Natural Gas ($/Mcf) 1.41 1.41 1.88 1.93
Crude Oil and Natural Gas Liquids ($/bbl) 65.92 78.36 59.32 71.90
Although crude oil prices increased over the prior quarter, they remained volatile during the quarter. The benchmark
West Texas Intermediate (“WTI”) averaged US$59.82/bbl for the quarter (2018: US$67.88/bbl) compared to
US$54.90/bbl in the first quarter and US$57.36/bbl for the first six months of the year (2018: US$65.37/bbl).
The volatility was driven in part by supply concerns giving way to demand concerns. Geopolitical risk in the Middle
East, the commitment by OPEC+ to maintain prescribed inventory levels and increased imports by China were
12 Questerre Energy Corporation
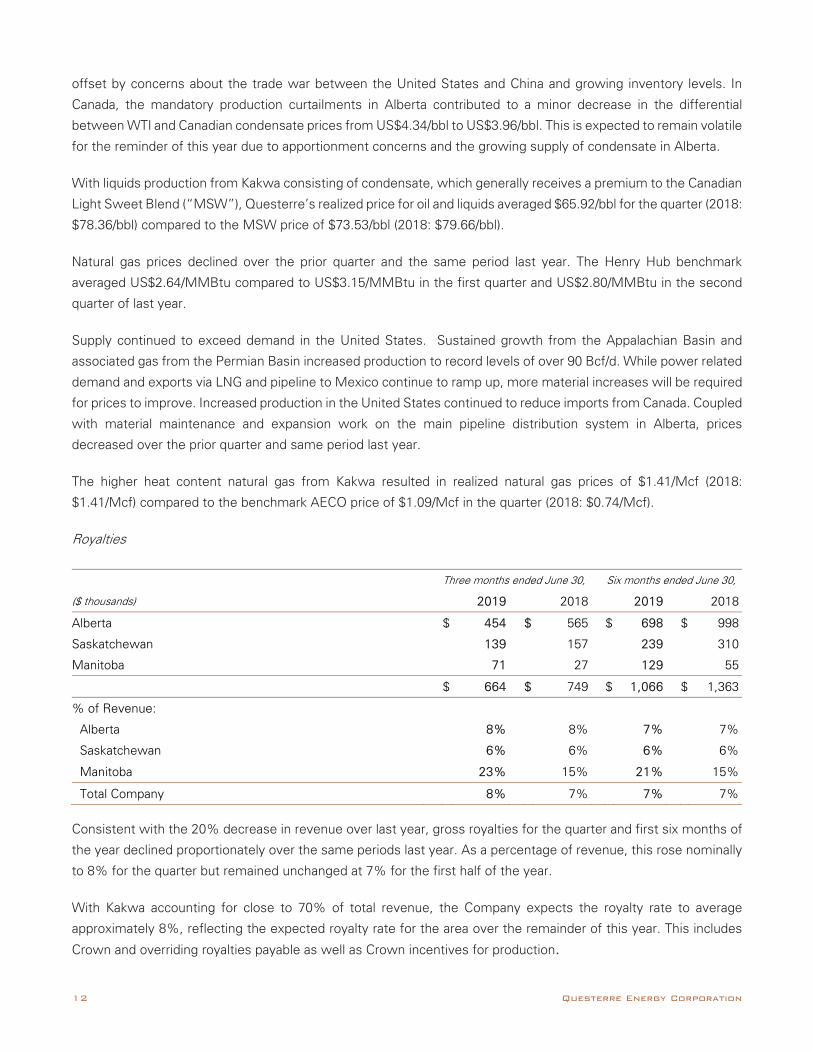
offset by concerns about the trade war between the United States and China and growing inventory levels. In
Canada, the mandatory production curtailments in Alberta contributed to a minor decrease in the differential
between WTI and Canadian condensate prices from US$4.34/bbl to US$3.96/bbl. This is expected to remain volatile
for the reminder of this year due to apportionment concerns and the growing supply of condensate in Alberta.
With liquids production from Kakwa consisting of condensate, which generally receives a premium to the Canadian
Light Sweet Blend (“MSW”), Questerre’s realized price for oil and liquids averaged $65.92/bbl for the quarter (2018:
$78.36/bbl) compared to the MSW price of $73.53/bbl (2018: $79.66/bbl).
Natural gas prices declined over the prior quarter and the same period last year. The Henry Hub benchmark
averaged US$2.64/MMBtu compared to US$3.15/MMBtu in the first quarter and US$2.80/MMBtu in the second
quarter of last year.
Supply continued to exceed demand in the United States. Sustained growth from the Appalachian Basin and
associated gas from the Permian Basin increased production to record levels of over 90 Bcf/d. While power related
demand and exports via LNG and pipeline to Mexico continue to ramp up, more material increases will be required
for prices to improve. Increased production in the United States continued to reduce imports from Canada. Coupled
with material maintenance and expansion work on the main pipeline distribution system in Alberta, prices
decreased over the prior quarter and same period last year.
The higher heat content natural gas from Kakwa resulted in realized natural gas prices of $1.41/Mcf (2018:
$1.41/Mcf) compared to the benchmark AECO price of $1.09/Mcf in the quarter (2018: $0.74/Mcf).
Royalties
Three months ended June 30, Six months ended June 30,
($ thousands) 2019 2018 2019 2018
Alberta $ 454 $ 565 $ 698 $ 998
Saskatchewan 139 157 239 310
Manitoba 71 27 129 55
$ 664 $ 749 $ 1,066 $ 1,363
% of Revenue:
Alberta 8% 8% 7% 7%
Saskatchewan 6% 6% 6% 6%
Manitoba 23% 15% 21% 15%
Total Company 8% 7% 7% 7%
Consistent with the 20% decrease in revenue over last year, gross royalties for the quarter and first six months of
the year declined proportionately over the same periods last year. As a percentage of revenue, this rose nominally
to 8% for the quarter but remained unchanged at 7% for the first half of the year.
With Kakwa accounting for close to 70% of total revenue, the Company expects the royalty rate to average
approximately 8%, reflecting the expected royalty rate for the area over the remainder of this year. This includes
Crown and overriding royalties payable as well as Crown incentives for production.

2019 Quarterly Report 13
Operating Costs
Three months ended June 30, Six months ended June 30,
($ thousands) 2019 2018 2019 2018
Alberta $ 2,420 $ 1,632 $ 4,499 $ 3,559
Saskatchewan 877 585 1,897 1,377
Manitoba 37 58 99 114
$ 3,334 $ 2,275 $ 6,495 $ 5,050
$/boe:
Alberta 16.01 10.94 15.17 12.25
Saskatchewan 29.62 18.37 34.78 19.92
Manitoba 8.40 24.45 10.96 22.65
Total Company 18.00 12.40 18.04 13.85
Operating costs for the three and six month periods ended June 30, 2019 increased over the prior year due to
higher expenses at both Kakwa and Antler. On a per unit of production basis, this increased to $18/boe from
$12.40/boe for the second quarter and $18.04/boe from $13.85/boe for the first half of the year.
At Kakwa, operating costs in the second quarter of last year included a credit of $0.66 million following an audit of
the plant operating costs based on actual partner volumes. Excluding this amount, operating costs averaged $2.23
million or $15.06/boe relatively consistent with operating costs of $2.32 million for the current quarter of
$15.74/boe.
As previously reported, operating costs at Antler grew due to higher maintenance and repair costs. These costs
should trend higher for the remainder of this year. Additionally, the Company anticipates higher routine workover
costs in 2019. As over 90% of the operating costs at Antler are fixed, the increase in these costs translated to a
more material increase on a boe basis.
General and Administrative Expenses
Three months ended June 30, Six months ended June 30,
($ thousands) 2019 2018 2019 2018
General and administrative expenses, gross $ 1,637 $ 1,532 $ 2,827 $ 3,242
Capitalized expenses and overhead recoveries (311) (336) (531) (631)
General and administrative expenses, net $ 1,326 $ 1,196 $ 2,296 $ 2,611
Gross General & Administrative Expenses (“G&A”) increased over the prior year by just under 7% to $1.64 million
in the second quarter of 2019 as a result of higher legal expenses associated with the Company’s claim in Quebec.
For the first half of the year, these costs decreased by $0.42 million from prior year mainly due to the absence of
any payments under the bonus plan in the current year, compared to $0.51 million last year. Capitalized expenses
and overhead recoveries as a percentage of gross G&A remained unchanged over the prior year.

14 Questerre Energy Corporation
Depletion and Depreciation
For the quarter ended June 30, 2019, Questerre recorded depletion and depreciation expense of $3.17 million
compared to $3.38 million for the same period last year. On a unit of production basis, these costs also decreased
to $16.72/boe from $17.63/boe. The decrease in both is attributable to the Kakwa reserve additions in 2018 at
lower finding and development costs than the prior year. This also accounted for the lower expense of $6.0 million
for the six months ended June 30, 2019 compared to $6.45 million in 2018.
Loss on Equity Investment
Questerre currently holds approximately 25% of the equity capital of Red Leaf. The Company uses the equity
method of accounting for its ownership in Red Leaf. Under the equity method, the Company’s investment is
recognized at cost with any changes to fair value being recognized through the income statement. The Company
also records its proportionate share of Red Leaf’s income or loss.
In 2018, the Company reduced the carrying value of its Red Leaf investment as it recorded its proportionate share
of Red Leaf’s net losses and cumulative preferred share dividends. As a result, the Company does not expect to
record any further losses with respect to this investment for the foreseeable future.
By comparison in the first three and six months of 2018, the Company incurred a loss of $1.65 million and $3.07
million respectively representing its share of the net loss realized by Red Leaf during the quarter and the impact of
the preferred share dividends accruing during the quarter. For more information, please see Note 3 of the Q2
Statements.
Deferred Taxes
During the second quarter, the Company recorded a deferred tax expense of $1.19 million (2018: $0.08 recovery).
This largely relates to the changes in the Alberta provincial tax rate announced in the period. This proportionately
reduced the estimated deferred tax asset to $5.82 million as at June 30, 2019 (December 31, 2018: $6.82 million).
Other Comprehensive Income and Expenses
In 2019, the Company recorded a loss of $0.09 million for the quarter and $0.19 million for the first half of the year
through other comprehensive income. The loss is due to a decrease in the Jordanian dinar relating to its investment
in Jordan and the decrease in value of the US dollar impacting its US dollar denominated investment in Red Leaf.
Conversely in 2018, an increase in the value of the US dollar and the Jordanian dinar increased the carrying value
of these investments and resulted in income of $0.42 million and $0.67 million for the same periods.
Total Comprehensive Loss
Questerre’s total comprehensive loss for the second quarter of 2019 was $2.19 million (2018: income of $0.99
million) and for the first half of 2019 was $3.22 million (2018: income of $1.30 million). The loss in 2019 for both
periods is due to the lower petroleum and natural gas revenue and higher operating costs, offset by no loss related
to its investment in Red Leaf.
2019 Quarterly Report 15
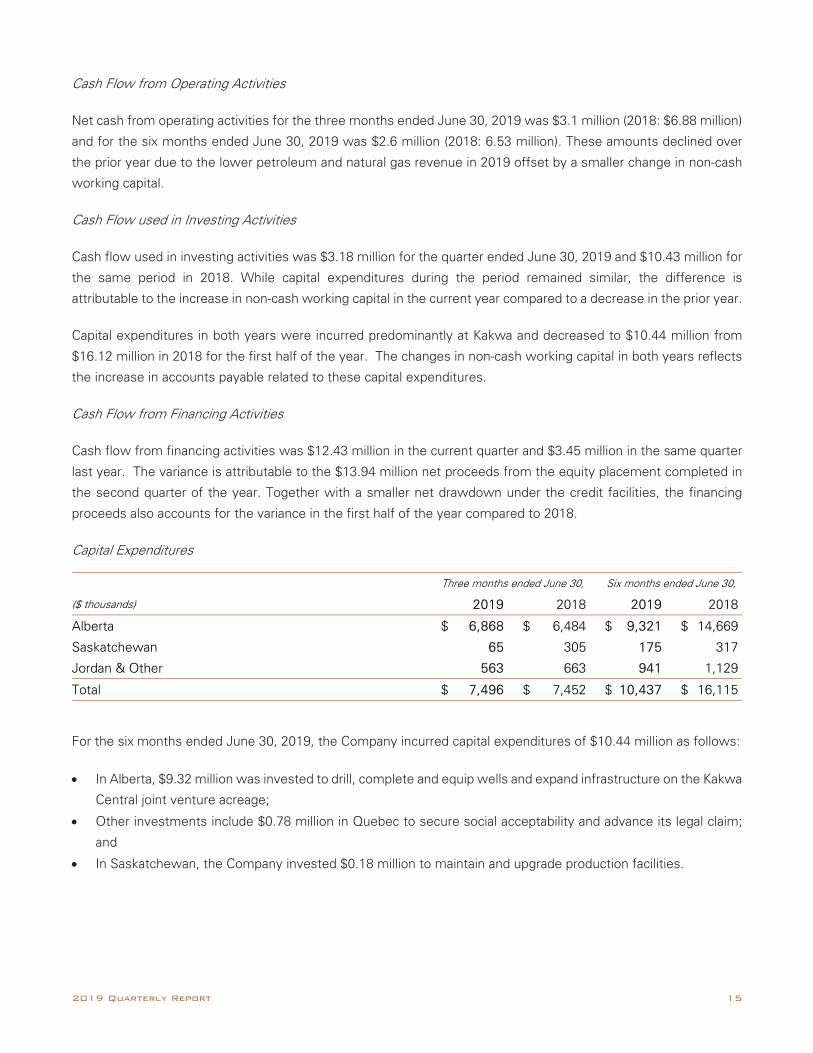
Cash Flow from Operating Activities
Net cash from operating activities for the three months ended June 30, 2019 was $3.1 million (2018: $6.88 million)
and for the six months ended June 30, 2019 was $2.6 million (2018: 6.53 million). These amounts declined over
the prior year due to the lower petroleum and natural gas revenue in 2019 offset by a smaller change in non-cash
working capital.
Cash Flow used in Investing Activities
Cash flow used in investing activities was $3.18 million for the quarter ended June 30, 2019 and $10.43 million for
the same period in 2018. While capital expenditures during the period remained similar, the difference is
attributable to the increase in non-cash working capital in the current year compared to a decrease in the prior year.
Capital expenditures in both years were incurred predominantly at Kakwa and decreased to $10.44 million from
$16.12 million in 2018 for the first half of the year. The changes in non-cash working capital in both years reflects
the increase in accounts payable related to these capital expenditures.
Cash Flow from Financing Activities
Cash flow from financing activities was $12.43 million in the current quarter and $3.45 million in the same quarter
last year. The variance is attributable to the $13.94 million net proceeds from the equity placement completed in
the second quarter of the year. Together with a smaller net drawdown under the credit facilities, the financing
proceeds also accounts for the variance in the first half of the year compared to 2018.
Capital Expenditures
Three months ended June 30, Six months ended June 30,
($ thousands) 2019 2018 2019 2018
Alberta $ 6,868 $ 6,484 $ 9,321 $ 14,669
Saskatchewan 65 305 175 317
Jordan & Other 563 663 941 1,129
Total $ 7,496 $ 7,452 $ 10,437 $ 16,115
For the six months ended June 30, 2019, the Company incurred capital expenditures of $10.44 million as follows:
In Alberta, $9.32 million was invested to drill, complete and equip wells and expand infrastructure on the Kakwa
Central joint venture acreage;
Other investments include $0.78 million in Quebec to secure social acceptability and advance its legal claim;
and
In Saskatchewan, the Company invested $0.18 million to maintain and upgrade production facilities.

16 Questerre Energy Corporation
For the same period in 2018, the Company incurred capital expenditures of $16.12 million as follows:
In Alberta, $14.67 million was invested to primarily expand infrastructure and drill and complete wells at its
Kakwa Central joint venture acreage; and
In Jordan, $1.02 million was invested in the technical and economic feasibility assessment for its oil shale
project.
Liquidity and Capital Resources
The Company’s objectives when managing its capital are firstly to maintain financial liquidity, and secondly to
optimize the cost of capital at an acceptable risk to sustain the future development of the business.
At June 30, 2019, $14.69 million (December 31, 2018: $13.84 million) was drawn on the credit facilities and the
Company is compliant with all its covenants under the credit facilities. As a consequence of the foregoing,
Management does not believe there is a reasonably foreseeable risk of non-compliance with its credit facilities.
Under the terms of the credit facilities, the Company has provided a covenant that it will maintain an Adjusted
Working Capital Ratio greater than 1.0. The ratio is defined as current assets (excluding unrealized hedging gains
and including undrawn Credit Facility A availability) to current liabilities (excluding bank debt outstanding and
unrealized hedging losses). The Adjusted Working Capital Ratio at June 30, 2019 was 1.87 and the covenant was
met. See Note 11 to the Q2 Statements. The credit facilities are under a regularly scheduled review and the review
should be completed in the third quarter of 2019.
The size of the credit facilities is determined by, among other things, the Company’s current reserve report, results
of operations and forecasted commodity prices. The credit facilities are a demand facility and can be reduced,
amended or eliminated by the lender for reasons beyond the Company’s control. Should the credit facilities be
reduced or eliminated, the Company would need to seek alternative credit facilities or consider the issuance of
equity to enhance its liquidity.
Management believes that with its expected positive operating cash flows from operations, its recently completed
private placement for gross proceeds of $14.47 million and current credit facilities, the Company should generate
sufficient cash flows and have access to sufficient financial liquidity to meet its foreseeable obligations in the
normal course of operations.
Questerre anticipates an increase in production, based on its drilling activity at Kakwa, which is expected to improve
operating cash flow and increase the contribution to finance planned capital expenditures. On an ongoing basis,
the Company will manage where possible future capital expenditures to maintain liquidity (See “Commitments”).
However, it does not expect that sufficient cash flows will be generated from operating activities alone to
independently finance planned capital expenditure program. Subject to the operators plans at Kakwa, the Company
intends to invest up to 90% of the 2019 future development costs associated with proved reserves in its
independent reserves assessment as of December 31, 2018. It anticipates that, as a result, reserves associated
with wells not drilled in 2019 will remain in the proved undeveloped category.

2019 Quarterly Report 17
For a detailed discussion of the risks and uncertainties associated with the Company’s business and operations,
see the Risk Management and Risk Factors sections of the Company’s 2018 Annual MD&A and the AIF,
respectively.
Share Capital
The Company is authorized to issue an unlimited number of Common Shares. The Company is also authorized to
issue an unlimited number of Class “B” Common voting shares and an unlimited number of preferred shares,
issuable in one or more series. At June 30, 2019, there were no Class “B” Common voting shares or preferred
shares outstanding. The following table provides a summary of the outstanding Common Shares and options as at
the date of the MD&A, the current quarter-end and the preceding year-end.
August 9, June 30, December 31,
(thousands) 2019 2019 2018
Common Shares 427,907 427,907 389,007
Stock Options 27,262 27,262 21,412
Weighted average common shares
Basic 403,192 388,712
Diluted 403,192 395,715
A summary of the Company’s stock option activity during the six months ended June 30, 2019 and the year ended
December 31, 2018 follows:
June 30, 2019 December 31, 2018 Weighted Weighted Number of Average Number of Average Options Exercise Options Exercise (thousands) Price (thousands) Price Outstanding, beginning of period 21,412 $ 0.44 21,387 $ 0.50 Granted 6,100 0.29 3,288 0.48 Forfeited – – (150) 0.52 Expired (250) 1.40 (3,003) 0.88 Exercised – – (110) 0.42 Outstanding, end of period 27,262 $ 0.40 21,412 $ 0.44 Exercisable, end of period 13,479 $ 0.35 10,403 $ 0.34

18 Questerre Energy Corporation
Commitments
A summary of the Company’s net commitments at June 30, 2019 follows:
($ thousands) 2019 2020 2021 2022 2023 Thereafter Total Transportation, Marketing and Processing $ 1,827 $ 4,084 $ 4,728 $ 3,990 $ 3,990 $ 11,971 $ 30,589
In order to maintain its capacity to execute its business strategy, the Company expects that it will need to continue
the development of its producing assets. There will also be expenditures in relation to G&A and other operational
expenses. These expenditures are not yet commitments, but Questerre expects to fund such amounts primarily
out of adjusted funds flow from operations and its existing credit facilities.
Risk Management
Companies engaged in the petroleum and natural gas industry face a variety of risks. For Questerre, these include
risks associated with exploration and development drilling as well as production operations, commodity prices,
exchange and interest rate fluctuations. Unforeseen significant changes in such areas as markets, prices, royalties,
interest rates and government regulations could have an impact on the Company’s future operating results and/or
financial condition. While Management realizes that all the risks may not be controllable, Questerre believes that
they can be monitored and managed. For more information, please refer to the “Risk Factors” and “Industry
Conditions” sections of the AIF and Note 6 to the audited consolidated financial statements for the year ended
December 31, 2018.
A significant risk for Questerre as a junior exploration company is access to capital. The Company attempts to
secure both equity and debt financing on terms it believes are attractive in current markets. Management also
endeavors to seek participants to farm-in on the development of its projects on favorable terms. However, there
can be no assurance that the Company will be able to secure sufficient capital if required or that such capital will
be available on terms satisfactory to the Company.
As future capital expenditures will be financed out of adjusted funds flow from operations, borrowings and possible
future equity sales, the Company’s ability to do so is dependent on, among other factors, the overall state of capital
markets and investor appetite for investments in the energy industry, and the Company’s securities in particular.
To the extent that external sources of capital become limited or unavailable, or available but on onerous terms, the
Company’s ability to make capital investments and maintain existing assets may be impaired, and its assets,
liabilities, business, financial condition and results of operations may be materially and adversely affected. Based
on current funds available and expected adjusted funds flow from operations, the Company believes it has
sufficient funds available to fund its projected capital expenditures. However, if adjusted funds flow from
operations is lower than expected, or capital costs for these projects exceed current estimates, or if the Company
incurs major unanticipated expense related to development or maintenance of its existing properties, it may be
required to seek additional capital to maintain its capital expenditures at planned levels. Failure to obtain any
financing necessary for the Company’s capital expenditure plans may result in a delay in development or production
on the Company’s properties. Subject to the ruling on its legal motion regarding the Regulations or changes to the
Regulations to better enable oil and natural gas development in Quebec, the Company anticipates that future

2019 Quarterly Report 19
development of its Quebec assets will require significant additional capital to be financed through among other
sources, future equity issuances or asset dispositions.
Questerre faces a number of financial risks over which it has no control, such as commodity prices, exchange
rates, interest rates, access to credit and capital markets, as well as changes to government regulations and tax
and royalty policies.
The Company uses the following guidelines to address financial exposure:
Internally generated cash flow provides the initial source of funding on which the Company’s annual capital
expenditure program is based.
Equity, including flow-through shares, if available on acceptable terms, may be raised to fund acquisitions
and capital expenditures.
Debt may be utilized to expand capital programs, including acquisitions, when it is deemed appropriate and
where debt retirement can be managed.
Farm-outs of projects may be arranged if Management considers that a project requires too much capital
or where the project affects the Company’s risk profile.
Credit risk represents the potential financial loss to the Company if a customer or counterparty to a financial
instrument fails to meet or discharge their obligation to the Company. Credit risk arises from the Company’s
receivables from joint venture partners and oil and gas marketers. In the event such entities fail to meet their
contractual obligations to the Company, such failures may have a material adverse effect on the Company’s
business, financial condition, results of operations and prospects. Credit risk also arises from the Company’s cash
and cash equivalents. In the past, the Company manages credit risk exposure by investing in Canadian banks and
credit unions. Management does not expect any counterparty to fail to meet its obligations.
Poor credit conditions in the industry may impact a joint venture partner’s willingness to participate in the
Company’s ongoing capital program, potentially delaying the program and the results of such program until the
Company finds a suitable alternative partner if possible.
Substantially all the accounts receivable are with oil and natural gas marketers and joint venture partners in the oil
and natural gas industry and are subject to normal industry credit risks. The Company generally extends unsecured
credit to these customers and therefore, the collection of accounts receivable may be affected by changes in
economic or other conditions. Management believes the risk is mitigated by entering into transactions with long-
standing, reputable counterparties and partners.
Accounts receivable related to the sale of the Company’s petroleum and natural gas production is paid in the
following month from major oil and natural gas marketing and infrastructure companies and the Company has not
experienced any credit loss relating to these sales to date. Pursuant to IFRS 9, the Company made a provision of
$0.03 million at June 30, 2019 for its expected credit losses related to its accounts receivable.
Receivables from joint venture partners are typically collected within one to six months after the joint venture bill
is issued. The Company mitigates this risk by obtaining pre-approval of significant capital expenditures.
20 Questerre Energy Corporation
The Company has issued and may continue in the future to issue flow-through shares to investors. The Company
uses its best efforts to ensure that qualifying expenditures of Canadian Exploration Expense (“CEE”) are incurred
in order to meet its flow-through obligations. However, in the event that the Company incurs qualifying
expenditures of Canadian Development Expense (“CDE”) or has CEE expenditures reclassified under audit by the
Canada Revenue Agency, the Company may be required to liquidate certain of its assets in order to meet the
indemnity obligations under the flow-through share subscription agreements.
Exploration and development drilling risks are managed through the use of geological and geophysical interpretation
technology, employing technical professionals and working in areas where those individuals have experience. For
its non-operated properties, the Company strives to develop a good working relationship with the operator and
monitors the operational activity on the property. The Company also carries appropriate insurance coverage for
risks associated with its operations.
The Company may use financial instruments to reduce corporate risk in certain situations. Questerre’s hedging
policy is up to a maximum of 40% of total production at Management’s discretion.
As at June 30, 2019, the Company had no outstanding commodity risk management contract in place. In the third
quarter, the Company hedged 200 bbls/d of oil production at US$58.50/bbl for August to December 2019.
Environmental Regulation and Risk
The oil and natural gas industry is currently subject to environmental regulations pursuant to provincial and federal
legislation. Environmental legislation provides for restrictions and prohibitions on releases of emissions and
regulation on the storage and transportation of various substances produced or utilized in association with certain
oil and natural gas industry operations, which can affect the location and operation of wells and facilities, and the
extent to which exploration and development is permitted. In addition, legislation requires that well and facility
sites are abandoned and reclaimed to the satisfaction of provincial authorities. As well, applicable environmental
laws may impose remediation obligations with respect to property designated as a contaminated site upon certain
responsible persons, which include persons responsible for the substance causing the contamination, persons
who caused the release of the substance and any past or present owner, tenant or other person in possession of
the site. Compliance with such legislation can require significant expenditures, and a breach of such legislation
may result in the suspension or revocation of necessary licenses and authorizations, civil liability for pollution
damage, the imposition of fines and penalties or the issuance of clean-up orders. The Company mitigates the
potential financial exposure of environmental risks by complying with the existing regulations and maintaining
adequate insurance. For more information, please refer to the “Risk Factors” and “Industry Conditions” sections
of the AIF.
Critical Accounting Estimates
The preparation of the consolidated financial statements requires Management to make judgments, estimates and
assumptions that affect the application of accounting policies and the reported amounts of assets, liabilities,
income and expenses. Actual results may differ from these estimates. These estimates and judgments have risk
of causing a material adjustment to the carrying amounts of assets and liabilities within the next financial year.

2019 Quarterly Report 21
Estimates and underlying assumptions are reviewed on an ongoing basis. Revisions to accounting estimates are
recognized in the year in which the estimates are revised and in any future years affected.
Petroleum and Natural Gas Reserves
Questerre’s petroleum and natural gas reserves and resources are evaluated and reported on by independent
petroleum engineering consultants in accordance with National Instrument 51-101 – Standards of Disclosure for
Oil and Gas Activities of the Canadian Securities Administrators (“NI 51-101”) and the COGE Handbook. For further
information, please refer to “Statement of Reserves Data and Other Oil and Gas Information” in the AIF.
The estimation of reserves and resources is a subjective process. Forecasts are based on engineering data,
projected future rates of production, commodity prices and the timing of future expenditures, all of which are
subject to numerous uncertainties and various interpretations. The Company expects that its estimates of reserves
and resources will change to reflect updated information. Reserve and resource estimates can be revised upward
or downward based on the results of future drilling, testing, production levels and changes in costs and commodity
prices. These estimates are evaluated by independent reserve engineers at least annually.
Proven and probable reserves are estimated using independent reserve engineer reports and represent the
estimated quantities of crude oil, natural gas and natural gas liquids which geological, geophysical and engineering
data demonstrate with a specified degree of certainty to be recoverable in future years from known reservoirs and
which are considered commercially producible. If probabilistic methods are used, there should be at least a
50 percent probability that the quantities recovered will equal or exceed the estimated proved plus probable
reserves and there should be at least a 90 percent probability that the quantities actually recovered will equal or
exceed the estimated proved reserves.
Reserve and resource estimates impact a few the areas, in particular, the valuation of property, plant and
equipment, exploration and evaluation assets and the calculation of depletion.
Cash Generating Units
A CGU is defined as the lowest grouping of assets that generate identifiable cash inflows that are largely
independent of the cash inflows of other assets or groups of assets. The allocation of assets into CGUs requires
significant judgment and interpretations. Factors considered in the classification include geography and the manner
in which Management monitors and makes decisions about its operations.
Impairment of Property, Plant and Equipment, Exploration and Evaluation and Goodwill
The Company assesses its oil and natural gas properties, including exploration and evaluation assets, for possible
impairment if there are events or changes in circumstances that indicate that carrying values of the assets may not
be recoverable. Determining if there are facts and circumstances present that indicate that carrying values of the
assets may not be recoverable requires Management’s judgment and analysis of the facts and circumstances.
The recoverable amounts of CGUs have been determined based on the higher of value in use (“VIU”) and the fair
value less costs of disposal (“FVLCD”). The key assumptions the Company uses in estimating future cash flows

22 Questerre Energy Corporation
for recoverable amounts are anticipated future commodity prices, expected production volumes, the discount rate,
future operating and development costs and recent land transactions. Changes to these assumptions will affect
the recoverable amounts of the CGUs and may require a material adjustment to their related carrying value.
Goodwill is the excess of the purchase price paid over the fair value of the net assets acquired. Since goodwill
results from purchase accounting, it is imprecise and requires judgment in the determination of the fair value of
assets and liabilities. Goodwill is assessed for impairment on an operating segment level based on the recoverable
amount for each CGU of the Company. Therefore, impairment of goodwill uses the same key judgments and
assumptions noted above for impairment of assets.
Asset Retirement Obligation
Determination of the Company’s asset retirement obligation is based on internal estimates using current costs and
technology in accordance with existing legislation and industry practice and must also estimate timing, a risk-free
rate and inflation rate in the calculation. These estimates are subject to change over time and, as such, may impact
the charge against profit or loss. The amount recognized is the present value of estimated future expenditures
required to settle the obligation using a risk-free rate. The associated abandonment and retirement costs are
capitalized as part of the carrying amount of the related asset. The capitalized amount is depleted on a unit of
production basis in accordance with the Company’s depletion policy. Changes to assumptions related to future
expected costs, risk-free rates and timing may have a material impact on the amounts presented.
Share Based Compensation
The Company has a stock option plan enabling employees, officers and directors to receive Common Shares or
cash at exercise prices equal to the market price or above on the date the option is granted. Under the equity
settled method, compensation costs attributable to stock options granted to employees, officers or directors are
measured at fair value using the Black-Scholes option pricing model. The assumptions used in the calculation are:
the volatility of the stock price, risk-free rates of return and the expected lives of the options. A forfeiture rate is
estimated on the grant date and is adjusted to reflect the actual number of options that vest. Changes to
assumptions may have a material impact on the amounts presented.
Income Tax Accounting
Deferred tax assets are recognized when it is considered probable that deductible temporary differences will be
recovered in the foreseeable future. To the extent that future taxable income and the application of existing tax
laws in each jurisdiction differ significantly from the Company’s estimate, the ability of the Company to realize the
deferred tax assets could be impacted.
The Company has revised its estimate related to deferred tax assets in the year. Since December 31, 2016, the
recoverability of deferred tax assets is assessed using proved reserves including an estimate of G&A associated
with the assets.
The determination of the Company’s income and other tax assets or liabilities requires interpretation of complex
laws and regulations. All tax filings are subject to audit and potential reassessment after the lapse of considerable
2019 Quarterly Report 23
time. Accordingly, the actual income tax asset or liability may differ significantly from that estimated and recorded
by management.
Investment in Red Leaf
Questerre has investments in certain private companies, including Red Leaf, which it classifies as an equity
investment and assesses for indicators of impairment at each period end. For the purposes of impairment testing,
the Company measures the fair value of Red Leaf by valuation techniques such as the net asset value approach.
Accounting Policy Changes
Changes in Accounting Policies for 2019
Effective 2019, the Company has implemented IFRS 16 Leases which requires entities to recognize lease assets
and lease obligations on the balance sheet. For leases entered into prior to January 1, 2019 the Corporation has
chosen to measure the right-of-use asset at an amount equal to the lease liability, adjusted by the amount of any
prepaid or accrued lease payments relating to that lease recognized in the balance sheet immediately before the
date of initial application.
Future Accounting Pronouncements
Other than as disclosed below, there were no new or amended accounting standards or interpretations issued
during the three months ended June 30, 2019 that are applicable to the Company in future periods. A detailed
description of accounting standards and interpretations that will be adopted by the Company in future periods can
be found in the notes to the annual consolidated financial statements for the year ended December 31, 2018.
IFRS 3 Business Combinations has been amended to revise the definition of a business to include an input and a
substantive process that together significantly contribute to the ability to create outputs. The amendment to IFRS
3 Business Combinations is effective for the years beginning on or after January 1, 2020. The Company is currently
assessing the impact of this amendment.
Disclosure Controls and Procedures and Internal Controls over Financial Reporting
The Company’s Chief Executive Officer (“CEO”) and Chief Financial Officer (“CFO”) have designed, or caused to
be designed under their supervision, disclosure controls and procedures to provide reasonable assurance that:
(i) material information relating to the Company is made known to the Company’s CEO and CFO by others,
particularly during the period in which the annual and interim filings are being prepared; and (ii) information required
to be disclosed by the Company in its annual filings, interim filings or other reports filed or submitted by it under
securities legislation is recorded, processed, summarized and reported within the time period specified in securities
legislation.
The Company’s CEO and CFO have designed, or caused to be designed under their supervision, internal controls
over financial reporting to provide reasonable assurance regarding the reliability of financial reporting and the
preparation of financial statements for external purposes in accordance with IFRS. The Company is required to
disclose herein any change in the Company’s internal controls over financial reporting that occurred during the

24 Questerre Energy Corporation
period beginning on April 1, 2019 and ended on June 30, 2019 that has materially affected, or is reasonably likely
to materially affect, the Company’s internal controls over financial reporting. No material changes in the Company’s
internal controls over financial reporting were identified during such period that have materially affected, or are
reasonably likely to materially affect, the Company’s internal controls over financial reporting.
It should be noted that a control system, including the Company’s disclosure and internal controls and procedures,
no matter how well conceived can provide only reasonable, but not absolute, assurance that the objectives of the
control system will be met, and it should not be expected that the disclosure and internal controls and procedures
will prevent all errors or fraud.
Quarterly Financial Information
June 30, Mar 31, Dec 31, Sept 30,
($ thousands, except as noted) 2019 2019 2018 2018
Production (boe/d) 2,035 1,944 2,033 1,414
Average Realized Price ($/boe) 43.30 40.61 34.35 52.98
Petroleum and Natural Gas Sales 8,019 7,105 6,492 6,892
Adjusted Funds Flow from Operations 2,662 2,547 1,929 2,620
Net Profit (Loss) (2,099) (934) 14,858 (2,023)
Basic and Diluted ($/share) (0.01) – (0.01) (0.01)
Capital Expenditures, net of acquisitions and dispositions 7,496 2,941 8,785 6,077
Working Capital Surplus (Deficit) (776) (9,543) (9,078) (2,374)
Total Assets 248,070 231,975 233,372 218,630
Shareholders' Equity 199,108 186,812 187,291 171,648
Weighted Average Common Shares Outstanding
Basic (thousands) 417,220 389,007 388,412 388,412
Diluted (thousands) 417,220 389,007 392,612 388,412
June 30, Mar 31, Dec 31, Sept 30,
($ thousands, except as noted) 2018 2018 2017 2017
Production (boe/d) 2,016 2,013 1,714 1,643
Average Realized Price ($/boe) 54.91 52.66 46.30 36.03
Petroleum and Natural Gas Sales 10,074 9,541 7,302 5,446
Adjusted Funds Flow from Operations 6,012 4,652 2,552 1,938
Net Profit (Loss) 572 59 (18,036) (2,641)
Basic and Diluted ($/share) – – (0.05) (0.01)
Capital Expenditures, net of acquisitions and dispositions 7,452 8,663 14,976 4,906
Working Capital Surplus (Deficit) 1,239 2,804 9,648 (7,559)
Total Assets 220,043 218,346 217,214 198,904
Shareholders' Equity 173,464 172,123 170,738 158,204
Weighted Average Common Shares Outstanding
Basic (thousands) 387,862 387,848 383,093 346,685
Diluted (thousands) 395,552 396,285 383,093 346,685

2019 Quarterly Report 25
The general trends over the last eight quarters are as follows:
Petroleum and natural gas revenues and adjusted funds flow from operations have fluctuated with
production volumes and realized commodity prices.
Production volumes reflect the capital investment in drilling and completing wells at Kakwa in preceding
quarters. The Company plans to continue to invest at Kakwa, subject to the operator’s plans, commodity
prices and results, and expects a commensurate increase in production.
The level of capital expenditure over the quarter has varied largely due to the timing and number of wells
drilled and completed as well as the timing of the infrastructure investment at Kakwa.
The working capital deficit has generally increased when capital expenditures and other investments have
been higher than adjusted funds flow from operations and cash from financing activities.
Shareholders’ equity increased in the quarters ended in the quarters ended June 30, 2019, June 30, 2018
and March 31, 2018 as a result of private placements, warrant and option exercises.
Off-Balance Sheet Transactions
The Company did not engage in any off-balance sheet transactions during the period ended June 30, 2019.
Related Party Transactions
The Company did not engage in any related party transactions during the period ended June 30, 2019.
26 Questerre Energy Corporation
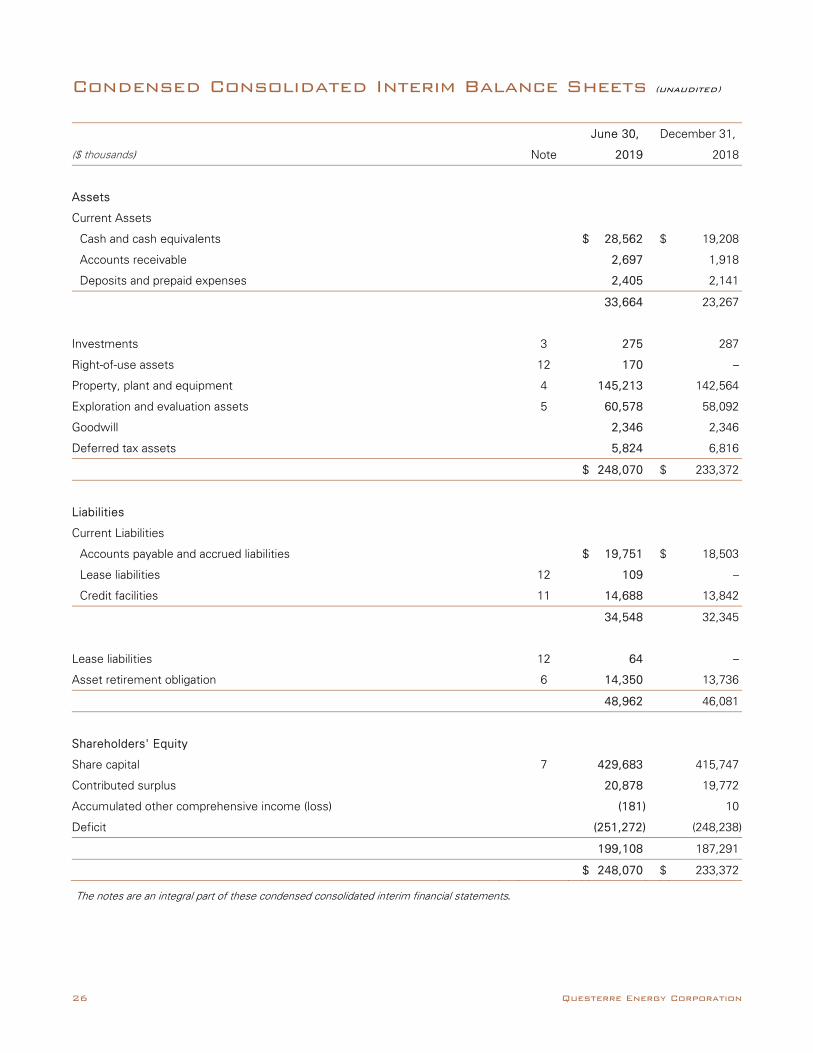
Condensed Consolidated Interim Balance Sheets (unaudited)
June 30, December 31,
($ thousands) Note 2019 2018
Assets
Current Assets
Cash and cash equivalents $ 28,562 $ 19,208
Accounts receivable 2,697 1,918
Deposits and prepaid expenses 2,405 2,141
33,664 23,267
Investments 3 275 287
Right-of-use assets 12 170 –
Property, plant and equipment 4 145,213 142,564
Exploration and evaluation assets 5 60,578 58,092
Goodwill 2,346 2,346
Deferred tax assets 5,824 6,816
$ 248,070 $ 233,372
Liabilities
Current Liabilities
Accounts payable and accrued liabilities $ 19,751 $ 18,503
Lease liabilities 12 109 –
Credit facilities 11 14,688 13,842
34,548 32,345
Lease liabilities 12 64 –
Asset retirement obligation 6 14,350 13,736
48,962 46,081
Shareholders' Equity
Share capital 7 429,683 415,747
Contributed surplus 20,878 19,772
Accumulated other comprehensive income (loss) (181) 10
Deficit (251,272) (248,238)
199,108 187,291
$ 248,070 $ 233,372
The notes are an integral part of these condensed consolidated interim financial statements.

2019 Quarterly Report 27
Condensed Consolidated Interim Statements of Net Income (Loss) and Comprehensive Income (Loss) (unaudited)
Three months ended June 30, Six months ended June 30,
($ thousands) Note 2019 2018 2019 2018
Revenue
Petroleum and natural gas sales $ 8,019 $ 10,074 $ 15,124 $ 19,615
Royalties (664) (749) (1,066) (1,363)
Petroleum and natural gas revenue, net of royalties 7,355 9,325 14,058 18,252
Expenses
Direct operating 3,334 2,275 6,495 5,050
General and administrative 1,326 1,196 2,296 2,611
Depletion, depreciation, accretion 4,5,6,12 3,169 3,379 6,247 6,666
Loss on equity investment 3 – 1,651 – 3,073
Gain on disposition of assets 4 (5) – (5) (213)
Share based compensation 8 363 158 727 306
Interest expense 181 127 355 219
Interest & other (income) expenses (104) 2 (214) (9)
Net income (loss) before taxes (909) 537 (1,843) 549
Deferred tax expense (recovery) 1,190 (35) 1,190 (82)
Net income (loss) (2,099) 572 (3,033) 631
Other comprehensive income (loss), net of tax Items that may be reclassified subsequently to net income (loss):
Foreign currency translation adjustment (86) 162 (179) 102
Gain (loss) on foreign exchange on investments 3 (6) 254 (12) 570
(92) 416 (191) 672
Total comprehensive income (loss) $ (2,191) $ 988 $ (3,224) $ 1,303
Net income (loss) per share
Basic and diluted 7 $ (0.01) $ – $ (0.01) $ –
The notes are an integral part of these condensed consolidated interim financial statements.

28 Questerre Energy Corporation
Condensed Consolidated Interim Statements of Changes in Equity (unaudited)
Six months ended June 30,
($ thousands) Note 2019 2018
Share Capital
Balance, beginning of period 7 $ 415,747 $ 414,995
Private placements 14,474 –
Warrants exercised - 713
Options exercised - 47
Share issue costs (net of tax) (538) (8)
Balance, end of period 429,683 415,747
Contributed Surplus
Balance, beginning of period 19,772 18,171
Share based compensation 1,106 670
Balance, end of period 20,878 18,841
Accumulated Other Comprehensive Loss
Balance, beginning of period 10 (724)
Other comprehensive income (loss) (191) 672
Balance, end of period (181) (52)
Deficit
Balance, beginning of period (248,239) (261,704)
Net income (loss) (3,033) 631
Balance, end of period (251,272) (261,073)
Total Shareholders' Equity $ 199,108 $ 173,463
The notes are an integral part of these condensed consolidated interim financial statements.

2019 Quarterly Report 29
Condensed Consolidated Interim Statements of Cash Flows (unaudited)
Three months ended June 30, Six months ended June 30,
($ thousands) Note 2019 2018 2019 2018
Operating Activities
Net Income (loss) $ (2,099) $ 572 $ (3,033) $ 631
Adjustments for:
Depletion, depreciation and accretion 4,5,6,12 3,169 3,379 6,247 6,666
Gain on disposition of assets 4 (5) – (5) (213)
Loss on equity investment 3 – 1,651 – 3,073
Share based compensation 8 363 158 727 306
Deferred tax recovery 1,190 (35) 1,190 (82)
Interest expense 181 127 355 219
Interest income (80) – (191) –
Other items not involving cash – 162 – 102
Abandonment expenditures 6 (57) (2) (81) (38)
Adjusted Funds Flow from Operations 2,662 6,012 5,209 10,664
Interest paid (181) (50) (355) (128)
Interest received 34 – 35 –
Change in non-cash working capital 583 915 (2,290) (4,011)
Net cash from operating activities 3,098 6,877 2,599 6,525
Investing Activities
Property, plant and equipment expenditures 4 (1,151) (5,385) (2,266) (10,065)
Exploration and evaluation expenditures 5 (6,345) (2,067) (8,171) (6,050)
Change in non-cash working capital 4,312 (2,980) 2,463 1,860
Net cash used in investing activities (3,184) (10,432) (7,974) (14,255)
Financing Activities
Proceeds from issue of share capital 7 14,474 14 14,474 760
Share issue costs 7 (538) (8) (538) (8)
Principal portion of lease payments 12 (28) – (53) –
Increase in credit facilities 7,326 14,943 17,046 27,007
Repayment of credit facilities (8,800) (11,501) (16,200) (25,801)
Net cash from financing activities 12,434 3,448 14,729 1,958
Change in cash and cash equivalents 12,348 (107) 9,354 (5,772)
Cash and cash equivalents, beginning of period 16,214 30,171 19,208 35,836
Cash and cash equivalents, end of period $ 28,562 $ 30,064 $ 28,562 $ 30,064 The notes are an integral part of these condensed consolidated interim financial statements.

30 Questerre Energy Corporation
Notes to the Condensed Consolidated Interim Financial Statements For the three and six months ended June 30, 2019 and 2018 (unaudited)
1. Nature of Operations and Basis of Presentation
Questerre Energy Corporation (“Questerre” or the “Company”) is an energy technology and innovation company.
It is leveraging its expertise gained through early exposure to low permeability reservoirs to acquire significant high
quality resources. These condensed consolidated interim financial statements of the Company as at and for the
three and six months ended June 30, 2019 and 2018 comprise the Company and its wholly-owned subsidiaries.
Questerre is incorporated under the laws of the Province of Alberta and is domiciled in Canada. The address of its
registered office is 1650, 801 – 6 Avenue SW, Calgary, Alberta.
These condensed consolidated interim financial statements have been prepared in accordance with International
Financial Reporting Standards (“IFRS”) as issued by the International Accounting Standards Board (“IASB”)
applicable to the preparation of interim financial statements, including International Accounting Standard 34 Interim
Financial Reporting. These condensed consolidated interim financial statements have been prepared following the
new IFRS accounting policies and method of computation as the audited annual consolidated financial statements
for the year ended December 31, 2018 with the exception of deferred taxes and leases. Taxes in the interim periods
are accrued using the tax rate that would be applicable to expected total annual net income (loss). The disclosures
provided below are incremental to those included with the annual consolidated financial statements. Certain
information and disclosures normally included in the notes to the annual consolidated financial statements have
been condensed or have been disclosed on an annual basis only. Accordingly, these condensed consolidated
interim financial statements should be read in conjunction with the audited annual consolidated financial
statements for the year ended December 31, 2018, which have been prepared in accordance with IFRS as issued
by the IASB.
These condensed consolidated interim financial statements of Questerre were approved by the Board of Directors
on August 9, 2019.
2. Accounting Policy Changes
IFRS 16 - Leases
The Company applied IFRS 16 effective January 1, 2019. IFRS 16 requires lessees to recognize a lease obligation
and right-of-use asset for the majority of leases. For leases entered into prior to January 1, 2019 the Company has
chosen to measure the right-of-use assets at an amount equal to the lease liabilities, adjusted by the amount of
any prepaid or accrued lease payments relating to that lease recognized in the balance sheet immediately before
the date of initial application.
The Company has applied IFRS 16 using the modified retrospective approach on January 1, 2019. Therefore,
comparative information has not been restated and continues to be reported under IAS 17 and IFRIC 4. The details

2019 Quarterly Report 31
of accounting policies under IAS 17 and IFRIC 4 are disclosed separately if they are different from those under
IFRS 16 and the impact of the changes is disclosed in Note 12.
On initial adoption, the Company elected to apply the following practical expedients permitted under the standard:
the use of a single discount rate to a portfolio of leases with reasonably similar characteristics;
the accounting for operating leases with a remaining lease term of less than 12 months as at January 1,
2019 as short-term leases;
the exclusion of initial direct costs for the measurement of the right-of-use assets at the date of initial
application; and
the use of hindsight in determining the lease term where the contract contains options to extend or
terminate the lease.
As a lessee, the Company previously classified leases as operating or finance leases based on its assessment of
whether the lease transferred significantly all the risks and rewards incidental to ownership of the underlying asset
to the Company.
Under IFRS 16, the Company recognizes right-of-use assets and lease liabilities for most leases. Certain short-term
leases (less than 12 months) and leases of low-value assets are exempt from the requirements and may continue
to be treated as operating leases. The right-of-use assets recognized are subsequently depreciated using the
straight-line method from the commencement date to the earlier of the end of the useful life of the right-of-use
assets or the end of the lease term. The estimated useful lives of right-of-use assets are determined on the same
basis as those of property and equipment. In addition, the right-of-use assets are periodically reduced by
impairment losses, if any, and adjusted for certain re-measurements of the lease liabilities.
The lease liabilities are initially measured at the present value of the lease payments that are not paid at the
commencement date, discounted using the interest rate implicit in the lease or, if that rate cannot be readily
determined, the Company's incremental borrowing rate. The Company uses its incremental borrowing rate as the
discount rate.
The lease liabilities are subsequently measured at amortized cost using the effective interest method. It is re-
measured when there is a change in future lease payments arising from a change in an index or rate, if there is a
change in the Company's estimate of the amount expected to be payable under a residual value guarantee, or if
the Company changes its assessment of whether it will exercise a purchase, extension or termination option.
When the lease liabilities are re-measured in this way, a corresponding adjustment is made to the carrying amount
of the right-of-use assets or is recorded in profit or loss if the carrying amount of the right-of-use assets has been
reduced to $0. The Company presents right-of-use assets and lease liabilities separately in the balance sheet.
The application of IFRS 16 requires significant judgments and estimations to be made. Areas that require judgment
include identifying whether a contract (or part of a contract) includes a lease, determining whether it is reasonably
certain that an extension or termination option will be exercised, determining whether variable payments are in
substance fixed, establishing whether there are multiple leases in an arrangement and determining the stand-alone
amounts for lease and non-lease components. Other sources of estimation uncertainty in the application of IFRS

32 Questerre Energy Corporation
16 include estimating the lease term, determining the appropriate discount rate to apply to lease payments and
assessing whether a right-of-use assets are impaired.
Future Accounting Pronouncements
Except as disclosed below, there were no new or amended accounting standards or interpretations issued during
the three month period ended June 30, 2019 that are applicable to the Company in future periods. A detailed
description of accounting standards and interpretations that will be adopted by the Company in future periods can
be found in the notes to the annual consolidated financial statements for the year ended December 31, 2018.
IFRS 3 Business Combinations, has been amended to revise the definition of a business to include an input and a
substantive process that together significantly contribute to the ability to create outputs. The amendment to IFRS
3 Business Combinations is effective for the years beginning on or after January 1, 2020. The Company is currently
assessing the impact of this amendment.
3. Investment in Red Leaf
Red Leaf is a private Utah based oil shale and technology company whose principal assets are its proprietary
EcoShale technology to recover oil from shale and its oil shale leases in the state of Utah.
Questerre currently holds 132,293 common shares, representing approximately 30% of the common share capital
of Red Leaf and 288 Series A Preferred Shares, representing less than 0.5% of the issued and outstanding
preferred share capital of Red Leaf.
Questerre has determined its investment in Red Leaf will be accounted for using the equity method. This is based
on several criteria including its current equity interest in Red Leaf and ability to participate in the decision making
process of Red Leaf through its current Board representation.
The Company measured the fair market value of its investment using a net asset valuation approach. The net
assets are estimated as the net current assets of Red Leaf less US$93.71 million representing the original issue
price plus accrued but unpaid dividends of the issued and outstanding Series A Preferred Shares of Red Leaf as of
June 30, 2019. No value was assigned to the non-current assets of Red Leaf for the purposes of determining the
fair value of the Company’s investment.
The Company also evaluated the fair value of the preferred shares based on the face value excluding accrued but
unpaid dividends as of June 30, 2019.

2019 Quarterly Report 33
The investment balance is comprised of the following:
June 30, December 31, ($ thousands) 2019 2018
Investment in Red Leaf $ 13,604 $ 13,604
Equity loss on investment in Red Leaf (13,329) (13,317)
$ 275 $ 287 The following table sets out the changes in investment over the respective periods:
June 30, December 31, ($ thousands) 2019 2018
Balance, beginning of year $ 287 $ 9,109
Equity loss on investment – (7,631)
Impairment expense – (1,703)
Gain (loss) on foreign exchange (12) 512
Balance, end of period $ 275 $ 287
The equity loss on investment represents the Company’s proportionate share of the net loss realized by Red Leaf
and the accrued but unpaid dividends on the outstanding Series A Preferred Shares for the period ending June 30,
2019.
The assets, liabilities and net loss of Red Leaf as of June 30, 2019 were comprised as follows:
($ thousands)(1)
Current assets $ 115,782
Other current assets 287
Current liabilities 2,284
Other current liabilities 1,477
Net loss(2) $ (12,360)(1) Converted at an exchange rate of US$1=C$1.3087 (2) Converted at an average exchange rate of US$1=C$1.3377
For the three months ended June 30, 2019, the loss on foreign exchange relating to investments was $0.01 million
(December 31, 2018: gain of $0.51 million), which was recorded in other comprehensive income (loss) net of a
deferred tax recovery.

34 Questerre Energy Corporation
4. Property, Plant and Equipment
The following table provides a reconciliation of the Company’s property, plant and equipment assets:
Oil and
Natural Gas Other
($ thousands) Assets Assets Total
Cost or deemed cost:
Balance, December 31, 2017 $ 246,806 1,334 248,140
Additions 13,337 – 13,337
Transfer from exploration and evaluation assets 14,071 – 14,071
Balance, December 31, 2018 274,214 1,334 275,548
Additions 2,711 – 2,711
Transfer from exploration and evaluation assets 5,883 – 5,883
Balance, June 30, 2019 $ 282,808 $ 1,334 $ 284,142
Accumulated depletion, depreciation and impairment losses:
Balance, December 31, 2017 $ 147,952 1,295 149,247
Depletion and depreciation 11,751 10 11,761
Reversal of impairment (28,024) – (28,024)
Balance, December 31, 2018 131,679 1,305 132,984
Depletion and depreciation 5,940 5 5,945
Balance, June 30, 2019 $ 137,619 $ 1,310 $ 138,929
Oil and
Natural Gas Other
($ thousands) Assets Assets Total
Net book value:
At December 31, 2018 $ 142,535 $ 29 $ 142,564
At June 30, 2019 $ 145,189 $ 24 $ 145,213
During the six months ended June 30, 2019, the Company capitalized $0.03 million of administrative overhead
charges related to development activities (2018: nil). Included in the June 30, 2019 depletion calculation are future
development costs of $314.08 million (December 31, 2018: $318.94 million). No impairment indicators were noted.

2019 Quarterly Report 35
5. Exploration and Evaluation Assets
The following table provides a reconciliation of the Company’s exploration and evaluation assets:
June 30, December 31,
($ thousands) 2019 2018
Balance, beginning of year $ 58,092 $ 53,675
Additions 8,696 19,740
Transfers to property, plant and equipment (5,883) (14,071)
Undeveloped lease expiries (145) (1,565)
Foreign currency translation adjustment - Jordan (182) 313
Balance, end of period $ 60,578 $ 58,092
During the period ended June 30, 2019, the Company capitalized administrative overhead charges of $0.53 million
(December 31, 2018: $2.36 million) including $0.38 million of stock based compensation expense (December 31,
2018: $0.92 million) directly related to exploration and evaluation activities. In the second quarter of 2019, the
Company transferred investments in Kakwa totalling $5.18 million (December 31 2018: $14.07 million) from
exploration and evaluation assets to property, plant and equipment.
In September 2018, the Ministry of Energy and Natural Resources in Quebec introduced regulations effectively
prohibiting any exploitation of natural gas in the province including the banning of hydraulic fracturing of shale. The
Company filed a legal motion requesting a temporary stay and judicial review to have the specific regulations
relating to the ban on hydraulic fracturing to be set aside. The Company was granted a hearing date in early 2019.
At the request of the Quebec Ministry of Justice, Questerre agreed to temporarily defer the judicial review in the
first quarter of 2019. The Company intends to grant a further deferral until early 2020. The Company is engaged in
discussions with the Quebec Government to allow the parties to resolve the issues raised in its legal motion in a
constructive manner. Should the Company be unsuccessful in resolving the situation to its satisfaction or the
Company’s legal motion is ultimately denied, the carrying value of its exploration and evaluation assets in Quebec
of $31.08 million as of June 30, 2019, could be materially impaired.
6. Asset Retirement Obligation
The Company’s asset retirement and abandonment obligations result from its ownership interest in oil and natural
gas assets. The total asset retirement obligation is estimated based on the Company’s net ownership interest in
all wells and facilities, estimated costs to reclaim and abandon these wells and facilities, and the estimated timing
of the costs to be incurred in future periods. The Company has estimated the net present value of the asset
retirement obligation to be $14.35 million as at June 30, 2019 (December 31, 2018: $13.74 million) based on an
undiscounted total future liability of $16.71 million (December 31, 2018: $18.47 million). These payments are
expected to be made over the next 40 years. The average discount factor, being the risk-free rate related to the
liabilities, is 1.55% (December 31, 2018: 1.99%). An inflation rate of 2.2% (December 31, 2018: 2.2%) over the
varying lives of the assets is used to calculate the present value of the asset retirement obligation.

36 Questerre Energy Corporation
The following table provides a reconciliation of the Company’s total asset retirement obligation:
June 30, December 31, ($ thousands) 2019 2018
Balance, beginning of year $ 13,736 $ 12,465
Liabilities incurred 84 174
Liabilities settled (81) (133)
Revisions due to change in estimates and discount rates 506 978
Accretion 105 252
Balance, end of period $ 14,350 $ 13,736
7. Share Capital
The Company is authorized to issue an unlimited number of Class “A” Common voting shares (“Common Shares”).
The Company is also authorized to issue an unlimited number of Class “B” Common voting shares and an unlimited
number of preferred shares, issuable in one or more series. At June 30, 2019, there were no Class “B” Common
voting shares or preferred shares outstanding.
a) Issued and outstanding – Common Shares
Number (thousands)
Amount ($ thousands)
Balance, December 31, 2018 389,007 $ 415,747
Private placement 38,900 14,474
Share issue costs (net of tax effect) – (538)
Balance, June 30, 2019 427,907 $ 429,683
In the second quarter of 2019, the Company completed a private placement for gross proceeds of $14.47 million
consisting of the issuance of 38.9 million Common Shares at $0.39 per Common Share.
b) Per share amounts
Basic net income (loss) per share is calculated as follows:
Three months ended June 30, Six months ended June 30,
(thousands, except as noted) 2019 2018 2019 2018
Net income (loss) ($ thousands) $ (2,099) $ 572 $ (3,033) $ 631 Issued Common Shares at beginning of period 389,007 387,848 389,007 385,331 Effect of shares issued pursuant to:
Private placements 28,213 – 14,185 – Exercise of options and warrants – 14 – 3,081
Weighted average Common Shares outstanding (basic) 417,220 387,862 403,192 388,412 Basic net loss per share $ (0.01) $ – $ (0.01) $ –

2019 Quarterly Report 37
Diluted net income (loss) per share is calculated as follows:
Three months ended June 30, Six months ended June 30,
(thousands, except as noted) 2019 2018 2019 2018
Net income (loss) ($ thousands) $ (2,099) $ 572 $ (3,033) $ 631 Weighted average Common Shares outstanding (basic) 417,220 387,848 403,192 388,412
Effect of outstanding options – 8,437 – – Weighted average Common Shares outstanding (diluted) 417,220 395,552 403,192 396,427 Diluted net loss per share $ (0.01) $ – $ (0.01) $ –
Under the current stock option plan, options can be exchanged for Common Shares, or for cash at the Company’s
discretion. As a result, there are 2.76 million stock options considered potentially dilutive as at June 30, 2019. The
average market value of the Company’s shares for purposes of calculating the dilutive effect of options was based
on quoted market prices for the period that the options were outstanding. Due to the loss sustained during the
quarter and year to date periods, these options are considered anti-dilutive and excluded from the calculation of
diluted net loss per share.
8. Share Based Compensation
The Company has a stock option program that provides for the issuance of options to its directors, officers and
employees at or above grant date market prices. The options granted under the plan generally vest evenly over a
three-year period starting at the grant date or one year from the grant date. The grants generally expire five years
from the grant date or five years from the commencement of vesting. The Company accounts for its stock-based
compensation awards on the basis that the options will be equity settled.
The number and weighted average exercise prices of the stock options are as follows:
June 30, 2019 December 31, 2018 Weighted Weighted Number of Average Number of Average Options Exercise Options Exercise (thousands) Price (thousands) Price Outstanding, beginning of period 21,412 $ 0.44 21,387 $ 0.50 Granted 6,100 0.29 3,288 0.48 Forfeited – – (150) 0.52 Expired (250) 1.40 (3,003) 0.88 Exercised – – (110) 0.42 Outstanding, end of period 27,262 $ 0.40 21,412 $ 0.44 Exercisable, end of period 13,479 $ 0.35 10,403 $ 0.34

38 Questerre Energy Corporation
9. Capital Management
The Company believes with its net current assets, recent private placement and positive expected funds flow from
operations (an additional non-GAAP measure defined as net cash from operating activities before changes in non-
cash working capital and interest paid or received) in the near future, that the Company will be able to meet its
foreseeable obligations in the normal course of operations. On an ongoing basis the Company reviews its
commitment to incur capital expenditures to ensure that adjusted funds flow from operations or access to credit
facilities are available to fund these capital expenditures. Refer to Note 11.
The volatility of commodity prices has a material impact on Questerre’s adjusted funds flow from operations.
Questerre attempts to mitigate the effect of lower prices by entering into risk management contracts, shutting in
production in unusually low pricing environments, reallocating capital to more profitable areas and reducing capital
spending based on results and other market considerations.
The Company considers its capital structure to include shareholders’ equity and any outstanding amounts under
its credit facilities. The Company will adjust its capital structure to minimize its cost of capital through the issuance
of shares, securing credit facilities and adjusting its capital spending. Questerre monitors its capital structure based
on the current and projected adjusted funds flow from operations.
June 30, December 31,
($ thousands) 2019 2018
Credit facilities $ 14,688 $ 13,901
Shareholders' equity 199,108 187,291
10. Financial Risk Management and Determination of Fair Values
a) Overview
The Company’s activities expose it to a variety of financial risks that arise as a result of its exploration, development,
production, and financing activities such as credit risk, liquidity risk and market risk. The Company manages its
exposure to these risks by operating in a manner that minimizes this exposure.
b) Fair value of financial instruments
The Company’s financial instruments as at June 30, 2019 included cash and cash equivalents, accounts receivable,
deposits, investments, credit facilities and accounts payable and accrued liabilities. As at June 30, 2019, the fair
values of the Company’s financial assets and liabilities approximate their carrying values due to the short-term
maturity, with the exception of the Company’s investments which are recorded at fair value.
Disclosures about the inputs to fair value measurements are required, including their classification within a
hierarchy that prioritizes the inputs to fair value measurement.
Level 1 Fair Value Measurements
Level 1 fair value measurements are based on unadjusted quoted market prices.

2019 Quarterly Report 39
The Company does not hold any Level 1 financial instruments.
Level 2 Fair Value Measurements
Level 2 fair value measurements are based on valuation models and techniques where the significant inputs are
derived from quoted indices.
The Company’s risk management contracts are considered a Level 2 instrument. The Company’s financial
derivative instruments are carried at fair value as determined by reference to independent monthly forward
settlement prices and currency rates.
Level 3 Fair Value Measurements
Level 3 fair value measurements are based on unobservable information.
The Company’s investments are considered a Level 3 instrument. The fair values are determined using a
discounted cash flow approach.
As at each reporting period, the Company will assess whether a financial asset is impaired, other than those
classified as fair value through profit or loss. Any impairment loss will be included in net income (loss) for the
period.
c) Market risk
Market risk is the risk that changes in market prices, such as commodity prices, foreign exchange rates and interest
rates will affect the Company’s profit or loss or the value of its financial instruments. The objective of the Company
is to mitigate exposure to these risks while maximizing returns to the Company.
Commodity price risk
Commodity price risk is the risk that the fair value or future cash flows will fluctuate as a result of changes in
commodity prices. Commodity prices for oil and natural gas are impacted both by the relationship between the
Canadian and United States dollar and world economic events that dictate the levels of supply and demand. The
Company may enter into oil and natural gas contracts to protect, to the extent possible, its cash flows from future
sales. The contracts reduce the volatility in sales revenue by locking in prices with respect to future deliveries of
oil and natural gas.
The Company had no risk management contracts as at June 30, 2019. See Note 13 for risk management contracts
entered in the third quarter of 2019.
d) Credit risk
Credit risk represents the potential financial loss to the Company if a customer or counterparty to a financial
instrument fails to meet or discharge their obligation to the Company. Credit risk arises principally from the
Company’s receivables from joint venture partners and oil and gas marketers.
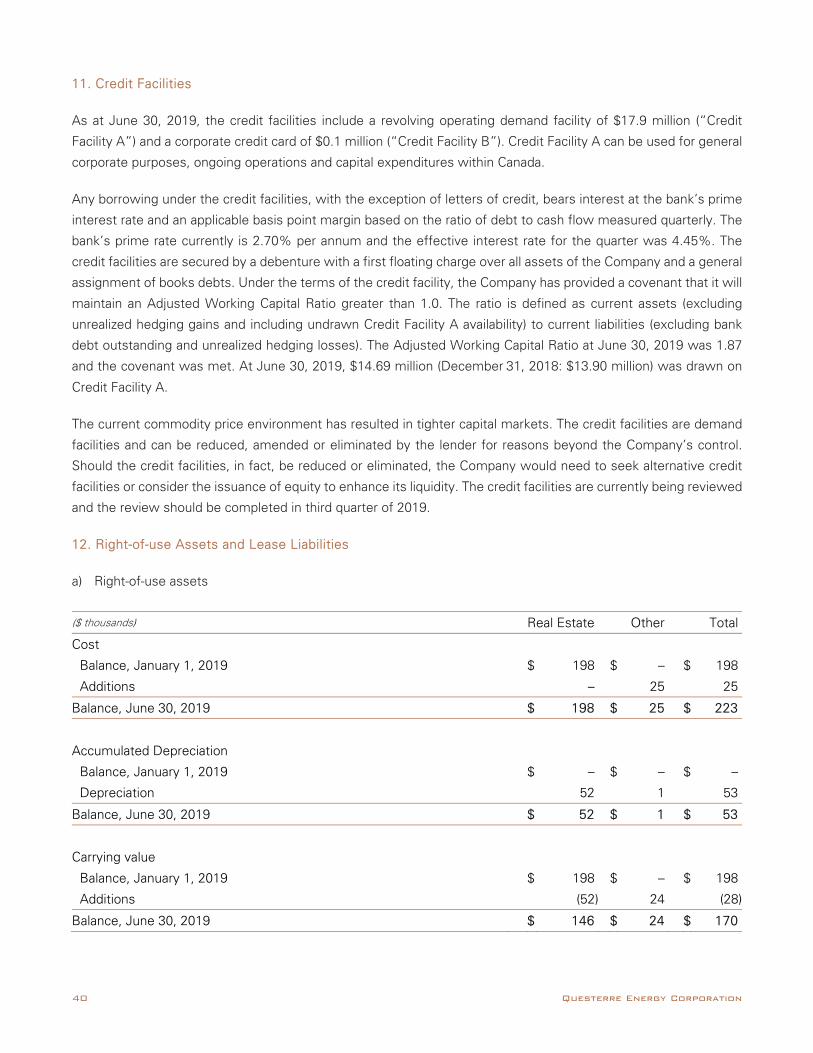
40 Questerre Energy Corporation
11. Credit Facilities
As at June 30, 2019, the credit facilities include a revolving operating demand facility of $17.9 million (“Credit
Facility A”) and a corporate credit card of $0.1 million (“Credit Facility B”). Credit Facility A can be used for general
corporate purposes, ongoing operations and capital expenditures within Canada.
Any borrowing under the credit facilities, with the exception of letters of credit, bears interest at the bank’s prime
interest rate and an applicable basis point margin based on the ratio of debt to cash flow measured quarterly. The
bank’s prime rate currently is 2.70% per annum and the effective interest rate for the quarter was 4.45%. The
credit facilities are secured by a debenture with a first floating charge over all assets of the Company and a general
assignment of books debts. Under the terms of the credit facility, the Company has provided a covenant that it will
maintain an Adjusted Working Capital Ratio greater than 1.0. The ratio is defined as current assets (excluding
unrealized hedging gains and including undrawn Credit Facility A availability) to current liabilities (excluding bank
debt outstanding and unrealized hedging losses). The Adjusted Working Capital Ratio at June 30, 2019 was 1.87
and the covenant was met. At June 30, 2019, $14.69 million (December 31, 2018: $13.90 million) was drawn on
Credit Facility A.
The current commodity price environment has resulted in tighter capital markets. The credit facilities are demand
facilities and can be reduced, amended or eliminated by the lender for reasons beyond the Company’s control.
Should the credit facilities, in fact, be reduced or eliminated, the Company would need to seek alternative credit
facilities or consider the issuance of equity to enhance its liquidity. The credit facilities are currently being reviewed
and the review should be completed in third quarter of 2019.
12. Right-of-use Assets and Lease Liabilities
a) Right-of-use assets
($ thousands) Real Estate Other Total
Cost
Balance, January 1, 2019 $ 198 $ – $ 198
Additions – 25 25
Balance, June 30, 2019 $ 198 $ 25 $ 223
Accumulated Depreciation
Balance, January 1, 2019 $ – $ – $ –
Depreciation 52 1 53
Balance, June 30, 2019 $ 52 $ 1 $ 53
Carrying value
Balance, January 1, 2019 $ 198 $ – $ 198
Additions (52) 24 (28)
Balance, June 30, 2019 $ 146 $ 24 $ 170

2019 Quarterly Report 41
The associated right-of-use assets were measured at the amount equal to the lease liabilities on January 1, 2019
with no impact on retained earnings.
b) Lease liabilities
A reconciliation of the gross future minimum lease payments on operating lease commitments, as disclosed in
Note 19 of the Annual Report for the year ended December 31, 2018, to the lease liabilities as at January 1, 2019
is as follows:
($ thousands) Operating lease commitments disclosed as at December 31, 2018 $ 256
Discounted using the incremental borrowing rate as at January 1, 2019 246
(Less): short-term leases recognized on a straight-line basis as expense (20)
(Less): low-value leases recognized on a straight-line basis as expense (28)
Lease liability recognized as at January 1, 2019 $ 198
Maturity analysis - undiscounted cash flows as at June 30, 2019: Current portion 114
Long term portion 121
Total undiscounted lease liabilities as at June 30, 2019 $ 235
Lease Liabilities Balance, January 1, 2019 198
Additional leases during period 25
Interest expense 5
Lease payments (55)
Balance, June 30, 2019 $ 173
Current portion 109
Long term portion 64
Balance, June 30, 2019 $ 173
Amounts related to lease liabilities recognized in profit or loss are as follows: Interest expense on lease liabilities $ 5
On adoption of IFRS 16, the Company recognized lease liabilities in relation to leases which had previously been
classified as operating leases under the principles of IAS 17, “Leases” (“IAS 17”). Under the principles of the new
standard these leases have been measured at the present value of the remaining lease payments, discounted
using the Company’s incremental borrowing rates at January 1, 2019 estimated at 4.14%. Leases with a remaining
term of less than twelve months and low-value leases were excluded. Interest expense related to leases are
included in “Interest paid” under Operating Activities on the Statements of Cash Flow.

42 Questerre Energy Corporation
13. Subsequent Events
In the third quarter, the Company hedged 200 bbls/d of production at US$58.50/bbl for August to December 2019.

2019 Quarterly Report 43

44 Questerre Energy Corporation

CorporateInformation
Directors
Michael Binnion
Alain Sans Cartier
Earl Hickok
Hans Jacob Holden
Dennis Sykora
Bjorn Inge Tonnessen
Officers
Michael Binnion
President and
Chief Executive Officer
John Brodylo
VP Exploration
Peter Coldham
VP Engineering
Jason D’Silva
Chief Financial Officer
Rick Tityk
VP Land
Bankers
Canadian Western Bank
200, 606 Fourth Street SW
Calgary, Alberta
T2P 1T1
Legal Counsel
Borden Ladner Gervais LLP
1900, 520 Third Avenue SW
Calgary, Alberta
T2P 0R3
Transfer Agent
Computershare Trust
Company of Canada
600, 530 Eighth Avenue SW
Calgary, Alberta
T2P 3S8
DNB Bank ASA
Dronning Eufemias gate 30
N-0021 Oslo, Norway
Auditors
PricewaterhouseCoopers LLP
3100, 111 Fifth Avenue SW
Calgary, Alberta
T2P 5L3
Independent Reservoir Engineers
McDaniel & Associates Cosultants Ltd.
2200, 255 Fifth Avenue SW
Calgary, Alberta
T2P 3G6
GLJ Petroleum Consultants Ltd.
4100, 400 Third Avenue SW
Calgary, Alberta
T2P 4H2
Head Office
1650 AMEC Place
801 Sixth Avenue SW
Calgary, Alberta T2P 3W2
Telephone: (403) 777-1185
Facsimile: (403) 777-1578
Web: www.questerre.com
Email: [email protected]
Stock Information
Toronto Stock Exchange
Oslo Stock Exchange
Symbol: QEC
2019 Quarterly Report

Questerre Energy Corporation
1650 AMEC Place 801 Sixth Avenue SW
Calgary, Alberta T2P 3W2 Telephone: (403) 777-1185 Facsimile: (403) 777-1578
Web: www.questerre.com Email: [email protected]